spatial and temporal analysis of nitrogen transport and
TRANSCRIPT
51
علاء ال�ضادق
Water Resources Management Program, College of Graduate Studies,Arabian Gulf University, P.O.Box 26671, Manama, Bahrain
Spatial and Temporal Analysis of Nitrogen Transport and Transformation in Surface Water
Arab Gulf Journal of Scientific Research, 29 (1/2): 51- 58 (2011)
Abstract: Water quality in terms of nitrogen transport and transformations in surface water has been presented in both spatial and temporal distributions. The paper is concentrated on the analysis for the Lake Nasser, the main Nile with the two branches, the drains, irrigation canals and rayahs. The spatial variation of the sampled water quality parameters is presented with the comparison to the recommended standard (Law 48/1982). Further temporal analysis considering the previous campaign (September 2000) results is presented. The study concluded that the nitrate problem has been found in the drains where agricultural land is the main source of nitrate in the surface water in Egypt. The research also concluded that the problems of understanding the different relations between the water quality evolution, estimating the effect of river flow and water quality management projects, etc. be solved by analysis of monitoring results and simulation models can have a significant and decisive role. Furthermore, the study indicated that the water quality models are the tools for analyzing, extrapolating and predicting water quality. To reduce groundwater and surface water pollution and control the environmental cost to remove nitrate-nitrogen from water, it is essential to understand fully the nitrate leaching from agricultural fields. Finally, it is recommended to build up a conceptual simplified model for the point-sources locations to be able to propose different scenarios for improving the current state of the river and drains quality conditions.Keywords: water quality; monitoring; nitrogen; transformation; spatial and temporal analysis.
تحليل مكاني وزماني لانتقال وتحويل النتروجين في المياه ال�ضطحية
El-Sadek, A.
Research Paper Ref. No 2601
الم�ضتخل�ص: تم تقديم نوعية المياه من حيث نقل وتحولات النيتروجين في المياه ال�شطحية على اأ�شا�ش التوزيعات المكانية والزمانية.
وتتركز هذه الورقة على تحليل لبحيرة نا�شر ونهر النيل الرئي�شي مع الفرعين، والم�شارف وقنوات الري والرياحات. وتم عر�ش
التباين المكاني لعنا�شر عينات نوعية المياه ومقارنتها مع الموا�شفات القيا�شية )القانون 1982/48(. وتم تقديم التحليل الزماني على
اأ�شا�ش نتائج الماأمورية ال�شابقة )�شبتمبر 2000(. وخل�شت الدرا�شة اإلى تواجد م�شكلة النترات في الم�شارف، حيث الاأرا�شي الزراعية
هي الم�شدر الرئي�شي للنترات في المياه ال�شطحية في م�شر. وخل�ش البحث اأي�شا اإلى اأن م�شاكل فهم العلاقات المختلفة لتطور نوعية
المياه، وتقدير اأثر تدفق مياه النهر وم�شاريع اإدارة نوعية المياه الخ ....، يمكن حلها عن طريق تحليل نتائج الر�شد. كذلك فنماذج
اأدوات للتحليل اأ�شارت الدرا�شة اإلى اأن نماذج نوعية المياه هي المحاكاة يمكن اأن يكون لها دور مهم وحا�شم. وعلاوة على ذلك،
والا�شتقراء والتنبوؤ بنوعية المياه. ولخف�ش تلوث المياه الجوفية وال�شطحية والتحكم في التكلفة البيئية لاإزالة النترات-نتيروجين من
المياه، فمن ال�شروري الفهم الكامل لتر�شيح النترات من الحقول الزراعية. اأخيرا ، فمن الم�شتح�شن بناء نموذج �شامل مب�شط لمواقع
الم�شادر المحددة للتلوث لتكون قادرة على اقتراح �شيناريوهات مختلفة لتح�شين ظروف النوعية للو�شع الحالي للنهر والم�شارف.
كلمات مدخلية: نوعية المياه، الر�شد، النيتروجين، التحويل، تحليل مكاني وزماني.

INTRODUCTION
Water quality is a term used to describe the chemical, physical, and biological characteristics of water, usually in respect to its suitability for a particular purpose (Radwan at el., 2001). With the increase in water consumption to satisfy different demands, quantities of disposed waste water are rapidly increased. The continued release of waste water has had serious impact on the water quality of the rivers (Radwan, 2002). Because of stricter environmental regulations and the increasing awareness of the negative impact of human activities on surface water quality, large efforts are made nowadays to prevent further degradation of the ecological system and to recover the water quality.
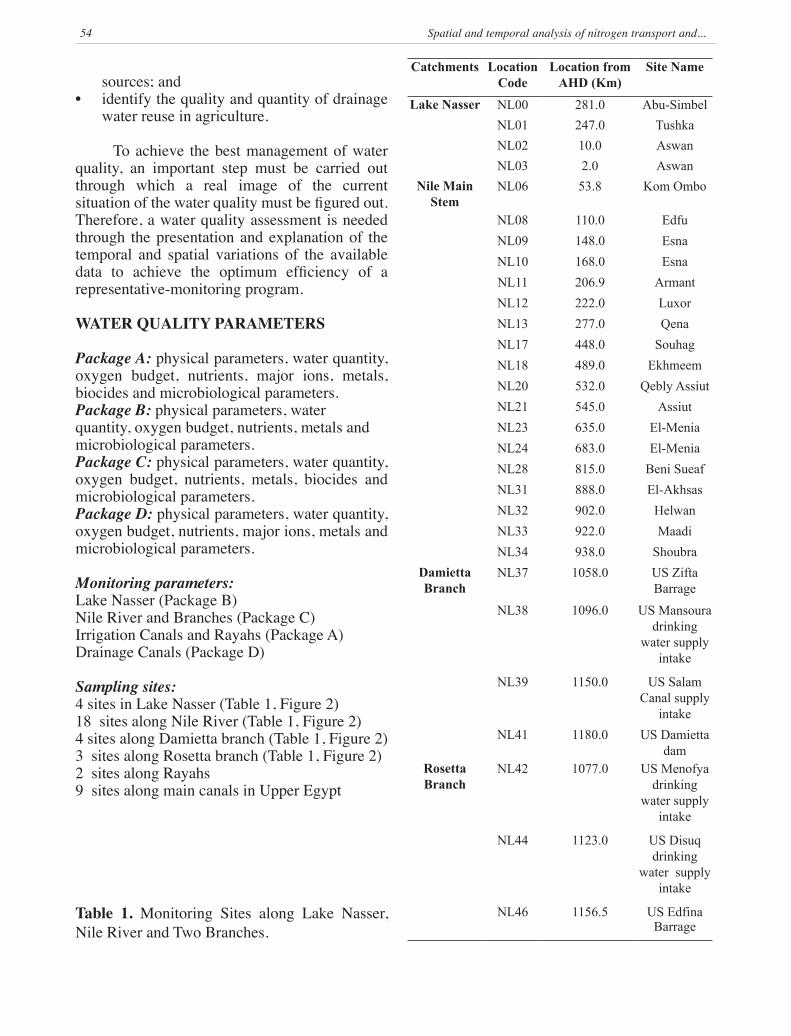
The monitoring program includes collecting water samples from 4 sites in Lake Nasser, 25 sites from the Nile River and its two branches in addition to 9 irrigation canals and 2 Rayahs. Moreover, 29 point sources of agricultural drains at the spillage points into the River Nile are monitored. All monitoring locations and monitored parameters are presented in the next sections. This research presents an analysis of August 2002 results, further temporal analysis considering the previous campaign (September 2000) results is presented. The paper is concentrated on the analysis for the Lake Nasser, the main Nile with its two branches, the drains, irrigation canals and rayahs. The spatial variation of the sampled water quality parameters is presented with the comparison to the recommended standard (Law 481982/).
BACKGROUND INFORMATION
The nitrogen cycle is composed of three processes. Two of these processes (ammonification and nitrification) convert gaseous nitrogen into usable chemical forms. The third process, denitrification, converts fixed nitrogen back to the unusable gaseous nitrogen state (Smith, 1990):
Ammonification is a one-way reaction in • which organisms break down amino acids and produce ammonia (NH3). Nitrification is the process in which ammonia • is oxidized to nitrite and nitrate, yielding energy for decomposer organisms. Two groups of microorganisms are involved in nitrification. Nitrosomonas oxidizes ammonia to nitrite and water. Subsequently, Nitrobacter
oxidizes the nitrite ions to nitrate. Denitrification is the process in which nitrates • are reduced to gaseous nitrogen. This process is used by facultative anaerobes. These organisms flourish in an aerobic environment but are also capable of breaking down oxygen-containing compounds (e.g. NO3
-) to obtain oxygen in an anoxic environment. Examples include fungi and the bacteria Pseudomonas (Smith, 1990).
In temperate zones, soil nitrate concentrations will vary seasonally with temperature and moisture levels. Fall and winter rains thoroughly remove all nitrates from the soil. No nitrate is naturally added to the soil during the late fall and winter because the cold weather prohibits mineralization and nitrification processes. During the spring and summer, the increased nitrogen-fixing activity of organisms and the addition of fertilizer causes the concentration of nitrates in the soil to steadily increase. Most of this nitrate is absorbed by plants. Thus, the removal of crops in the fall increases the chances for large flushes of nitrate from the soil to water bodies. Some leaching may occur in the spring if crops are not well established to absorb the nitrogen (Gower, 1980). Transport in water carries nitrates to surface water systems in (1) overland flow (runoff), (2) unsaturated flow, and (3) groundwater flow. Overland flow is the most direct route for water transportation. Underground flow is less direct because water flow is impeded by soil permeability and porosity constraints. Nitrate concentrations (as NO3
-) larger than 45 mg/l (or larger than 10 mg/l NO3-N) may cause Methemoglobinemia (Blue Baby Syndrome) in infants (Straub, 1989). The toxicity of nitrate in humans is a result of the reduction of nitrate (NO3
-) to nitrite (NO2
-). By reacting with hemoglobin, nitrite forms methemoglobin (MHb), a substance that does not bind and transport oxygen to tissues. Thus, methemoglobin formation may lead to asphyxia. Normally, methemoglobin accounts for 12%- of the globin in the body. A level greater than 3% is defined as methemoglobinemia (Kubek and Robillard, 1990). Water contaminated with nitrate is very difficult and costly to treat. Thus, if contamination affects a large water supply, the best alternative may be a new water source (Kubek and Robillard, 1990).
52 Spatial and temporal analysis of nitrogen transport and...
SOURCES OF POLLUTION OF THE RIVER NILE
Along the Nile major sources of pollution are Agricultural drainage, industrial waste water, domestic waste water and some other sources. Detailed description of the sources is presented below (EL-Shirbini, 1996):
Agricultural Drainage WaterThere are 70 main agricultural drains on
both sides of the river, from Aswan to Cairo, which discharge their drainage waters into the river directly. In the delta area, there are five drains located along the Rosetta branch and three drains are connected to the Dammietta Branch. Agricultural drainage water carries various contaminants which are mainly related to the use of pesticides and chemical fertilizers and to salinization as a result of evaporation and soil leaching.
Industrial WastewaterThe industrial wastes are considered as
one of the main sources of River Nile water pollution, because of their toxic chemicals and organic loading. There are about 20,000 industrial facilities in Egypt of which 700 are considered major ones. Most of these facilities are publicly owned. In major cities, most factories discharge to sewers, and the treated sewage is returned to the Nile. It is estimated that the wastewater from 350 industrial facilities are discharged directly into the Nile or through municipal system which discharge into the Nile.
Domestic WastewaterThe Nile and its waterways also suffer
from an alarming increase in the discharge rates of municipal and rural domestic waste. Along the River Nile there are one sewerage outlet pipe at Aswan and six secondary channels (Khours) receiving domestic, industrial, and agricultural wastes. In the reach from Aswan to Delta Barrage most of the domestic wastewater from cities, towns, villages, and individual houses reaches the river directly or through drains. Cities within the Delta area discharge to the drains that enter the Dammeitta and Rosetta Branches of the Nile, or discharge to the Northern lakes. Domestic wastewaters are potential sources of pathogenic organisms, heavy metals, household chemicals
(surfactant and pesticides), oil and grease, and organic matter.
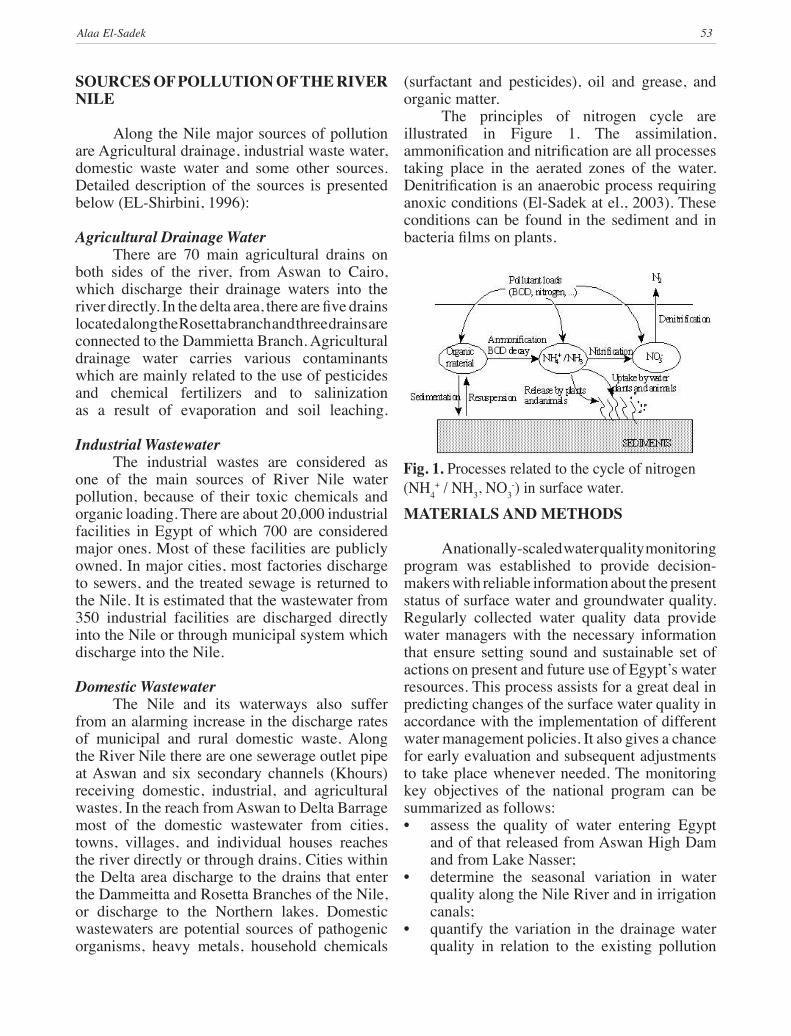
The principles of nitrogen cycle are illustrated in Figure 1. The assimilation, ammonification and nitrification are all processes taking place in the aerated zones of the water. Denitrification is an anaerobic process requiring anoxic conditions (El-Sadek at el., 2003). These conditions can be found in the sediment and in bacteria films on plants.
MATERIALS AND METHODS
A nationally-scaled water quality monitoring program was established to provide decision-makers with reliable information about the present status of surface water and groundwater quality. Regularly collected water quality data provide water managers with the necessary information that ensure setting sound and sustainable set of actions on present and future use of Egypt’s water resources. This process assists for a great deal in predicting changes of the surface water quality in accordance with the implementation of different water management policies. It also gives a chance for early evaluation and subsequent adjustments to take place whenever needed. The monitoring key objectives of the national program can be summarized as follows:
assess the quality of water entering Egypt • and of that released from Aswan High Dam and from Lake Nasser; determine the seasonal variation in water • quality along the Nile River and in irrigation canals;quantify the variation in the drainage water • quality in relation to the existing pollution
Fig. 1. Processes related to the cycle of nitrogen (NH4
+ / NH3, NO3-) in surface water.
Alaa El-Sadek 53
sources; andidentify the quality and quantity of drainage • water reuse in agriculture.
To achieve the best management of water quality, an important step must be carried out through which a real image of the current situation of the water quality must be figured out. Therefore, a water quality assessment is needed through the presentation and explanation of the temporal and spatial variations of the available data to achieve the optimum efficiency of a representative-monitoring program.
WATER QUALITY PARAMETERS
Package A: physical parameters, water quantity, oxygen budget, nutrients, major ions, metals, biocides and microbiological parameters.Package B: physical parameters, water quantity, oxygen budget, nutrients, metals and microbiological parameters.Package C: physical parameters, water quantity, oxygen budget, nutrients, metals, biocides and microbiological parameters.Package D: physical parameters, water quantity, oxygen budget, nutrients, major ions, metals and microbiological parameters.
Monitoring parameters:Lake Nasser (Package B)Nile River and Branches (Package C)Irrigation Canals and Rayahs (Package A)Drainage Canals (Package D)
Sampling sites:4 sites in Lake Nasser (Table 1, Figure 2)18 sites along Nile River (Table 1, Figure 2)4 sites along Damietta branch (Table 1, Figure 2)3 sites along Rosetta branch (Table 1, Figure 2)2 sites along Rayahs 9 sites along main canals in Upper Egypt
Catchments LocationCode
LocationfromAHD(Km)
SiteName
LakeNasser NL00 281.0 Abu-SimbelNL01 247.0 TushkaNL02 10.0 AswanNL03 2.0 Aswan
NileMainStem
NL06 53.8 Kom Ombo
NL08 110.0 EdfuNL09 148.0 EsnaNL10 168.0 EsnaNL11 206.9 ArmantNL12 222.0 LuxorNL13 277.0 QenaNL17 448.0 SouhagNL18 489.0 EkhmeemNL20 532.0 Qebly AssiutNL21 545.0 AssiutNL23 635.0 El-MeniaNL24 683.0 El-MeniaNL28 815.0 Beni SueafNL31 888.0 El-AkhsasNL32 902.0 HelwanNL33 922.0 MaadiNL34 938.0 Shoubra
DamiettaBranch
NL37 1058.0 US Zifta Barrage
NL38 1096.0 US Mansoura drinking
water supply intake
NL39 1150.0 US Salam Canal supply
intakeNL41 1180.0 US Damietta
damRosettaBranch
NL42 1077.0 US Menofya drinking
water supply intake
NL44 1123.0 US Disuq drinking
water supply intake
NL46 1156.5 US Edfina Barrage
Table 1. Monitoring Sites along Lake Nasser, Nile River and Two Branches.
54 Spatial and temporal analysis of nitrogen transport and...
Sampling frequency:Two campaigns per year during the
minimum and maximum river flows in February and August respectively.
Analysis:Laboratory analysis for Lake Nasser and
the Nile River from Aswan to El-Menia (except heavy metals) is carried out by Nile Research Institute (NRI), Egypt at its temporary laboratory in Esna. Central Laboratory for Environmental Quality Monitoring (CLEQM), Egypt performs the analysis for the Nile River from El-Menia to the Mediterranean Sea.
RESULTS
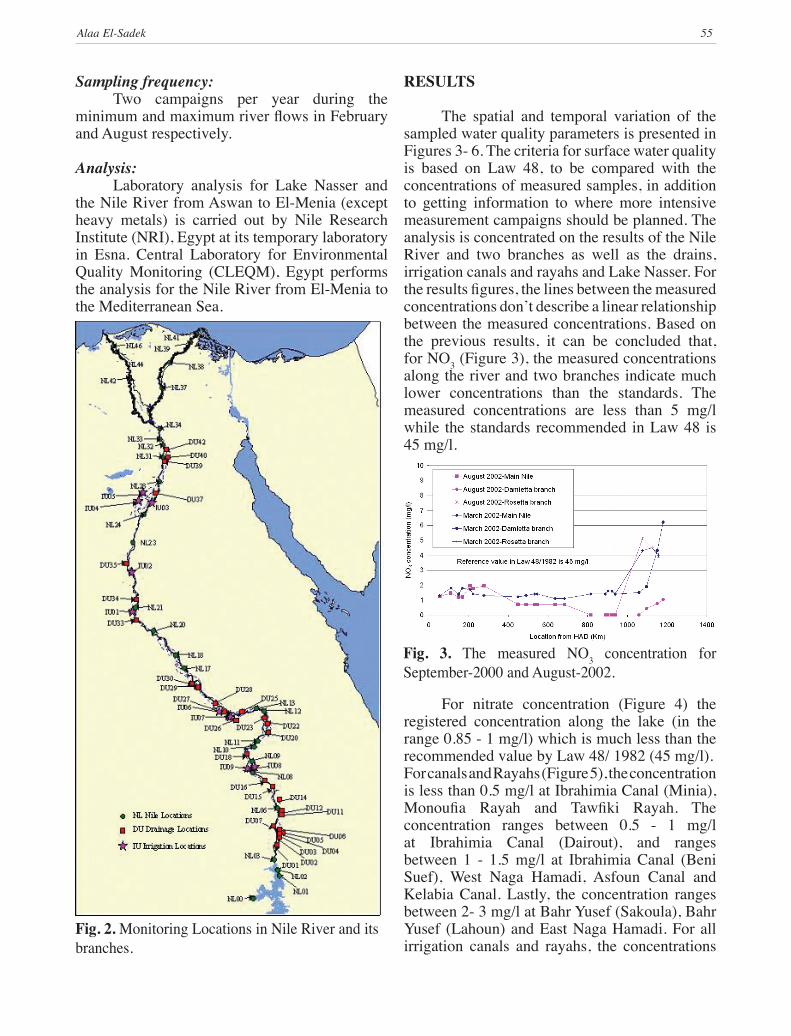
The spatial and temporal variation of the sampled water quality parameters is presented in Figures 3- 6. The criteria for surface water quality is based on Law 48, to be compared with the concentrations of measured samples, in addition to getting information to where more intensive measurement campaigns should be planned. The analysis is concentrated on the results of the Nile River and two branches as well as the drains, irrigation canals and rayahs and Lake Nasser. For the results figures, the lines between the measured concentrations don’t describe a linear relationship between the measured concentrations. Based on the previous results, it can be concluded that, for NO3 (Figure 3), the measured concentrations along the river and two branches indicate much lower concentrations than the standards. The measured concentrations are less than 5 mg/l while the standards recommended in Law 48 is 45 mg/l.
For nitrate concentration (Figure 4) the registered concentration along the lake (in the range 0.85 - 1 mg/l) which is much less than the recommended value by Law 48/ 1982 (45 mg/l).For canals and Rayahs (Figure 5), the concentration is less than 0.5 mg/l at Ibrahimia Canal (Minia), Monoufia Rayah and Tawfiki Rayah. The concentration ranges between 0.5 - 1 mg/lat Ibrahimia Canal (Dairout), and ranges between 1 - 1.5 mg/l at Ibrahimia Canal (Beni Suef), West Naga Hamadi, Asfoun Canal and Kelabia Canal. Lastly, the concentration ranges between 2- 3 mg/l at Bahr Yusef (Sakoula), Bahr Yusef (Lahoun) and East Naga Hamadi. For all irrigation canals and rayahs, the concentrations
Fig. 2. Monitoring Locations in Nile River and its branches.
Fig. 3. The measured NO3 concentration for September-2000 and August-2002.
Alaa El-Sadek 55
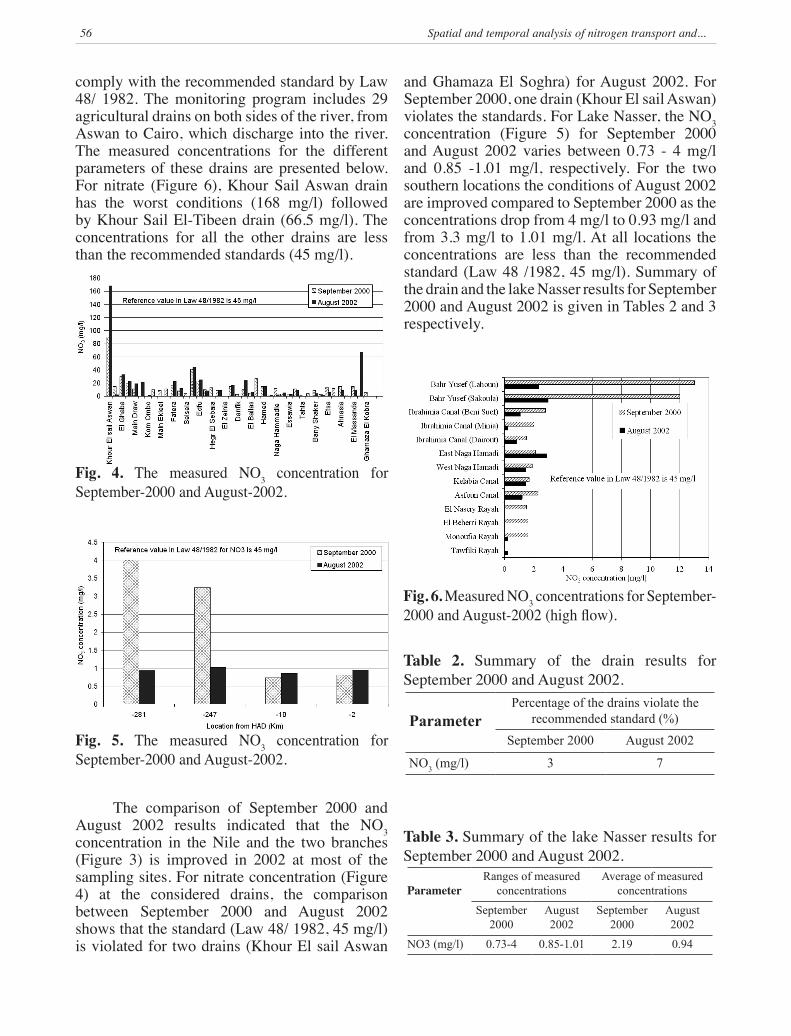
comply with the recommended standard by Law 48/ 1982. The monitoring program includes 29 agricultural drains on both sides of the river, from Aswan to Cairo, which discharge into the river. The measured concentrations for the different parameters of these drains are presented below. For nitrate (Figure 6), Khour Sail Aswan drain has the worst conditions (168 mg/l) followed by Khour Sail El-Tibeen drain (66.5 mg/l). The concentrations for all the other drains are less than the recommended standards (45 mg/l).
The comparison of September 2000 and August 2002 results indicated that the NO3 concentration in the Nile and the two branches (Figure 3) is improved in 2002 at most of the sampling sites. For nitrate concentration (Figure 4) at the considered drains, the comparison between September 2000 and August 2002 shows that the standard (Law 48/ 1982, 45 mg/l) is violated for two drains (Khour El sail Aswan
and Ghamaza El Soghra) for August 2002. For September 2000, one drain (Khour El sail Aswan) violates the standards. For Lake Nasser, the NO3 concentration (Figure 5) for September 2000 and August 2002 varies between 0.73 - 4 mg/land 0.85 -1.01 mg/l, respectively. For the two southern locations the conditions of August 2002 are improved compared to September 2000 as the concentrations drop from 4 mg/l to 0.93 mg/l and from 3.3 mg/l to 1.01 mg/l. At all locations the concentrations are less than the recommended standard (Law 48 /1982, 45 mg/l). Summary of the drain and the lake Nasser results for September 2000 and August 2002 is given in Tables 2 and 3 respectively.
Fig. 4. The measured NO3 concentration for September-2000 and August-2002.
Fig. 6. Measured NO3 concentrations for September-2000 and August-2002 (high flow).
Fig. 5. The measured NO3 concentration for September-2000 and August-2002.
ParameterPercentage of the drains violate the
recommended standard (%)September 2000 August 2002
NO3 (mg/l) 3 7
Table 2. Summary of the drain results for September 2000 and August 2002.
Table 3. Summary of the lake Nasser results for September 2000 and August 2002.
ParameterRanges of measured
concentrations Average of measured
concentrations September
2000August 2002
September 2000
August 2002
NO3 (mg/l) 0.73-4 0.85-1.01 2.19 0.94
56 Spatial and temporal analysis of nitrogen transport and...

DISCUSSION
The nitrate problem has been found in the drains where agricultural land is the main source of nitrate in the surface water in Egypt. The quantity of nitrate lost from an area of land is related to land use and farming practices and depends on the balance between inputs of nitrogen and the quantity removed in crops. It is also dependent on whether the farming system protects the soil from over-winter leaching, using, for example, mainly autumn sown crops, or whether the soil is bare during the main season. The concentration of nitrate in a groundwater or river drinking water source depends on the overall agricultural activities in the catchment. This means that the presence of some fields with high losses will not necessarily result in the overall water concentration exceeding 50 mg1-1. No agricultural system can be 100% efficient in its use of nitrogen. Nitrate leaching is a natural process and some loss each year is inevitable. There will always be some loss typically between 10 and 20 kg N ha-1 yr-1. Egypt is one of the largest users of nitrogen in agriculture. To reduce groundwater and surface water pollution and control the environmental cost to remove nitrate-nitrogen from water, it is essential to understand fully the nitrate leaching from agricultural fields.
Subsurface drainage systems are designed to remove excess water from soil quickly enough to minimize crop stress. All designs should remove water at the same rate and give similar crop yields. It has been proposed that placing drainage pipes at shallower depths might result in less nitrate loss. This would happen because nitrate would be more likely to reach a biologically active but saturated zone and be converted to nitrogen gas by denitrifying bacteria. The conversion of nitrate-nitrogen to nitrogen gas would prevent the nitrate from reaching the drainage pipes and nearby surface waters. The proper management of crop nutrients (nutrient source, application rate and timing) is an important way to help control the loss of nutrients through surface runoff and subsurface drainage water. It’s been shown that the application of nitrogen fertilizer at high rates increases the amount of nitrate removed through subsurface drainage systems (El-Sadek, 2010). It should be noted, however, that drained
agricultural soils have significant nitrate losses from the natural process of organic matter mineralization. Improved nutrient management can potentially reduce nitrate losses on drained lands. Row crops such as corn and soybeans experience considerably more nitrate loss through subsurface drainage flow than perennials. So the incorporation of perennials into farmers’ crop rotations could significantly decrease nitrate losses to nearby surface water.
When measured data is unavailable, calibrated and validated simulation models could be used to predict water discharges and nitrate leaching in agriculture fields on the poorly drained soils. More field studies and experiments are needed to determine nutrient decay parameter for the export coefficient models. Since such models have relatively few data requirements, and can be easily calibrated, they will be the suitable tools to model the total nutrient load at the catchment outlet when Geographic information system (GIS) facilities are not available.
Farmers are recommended to maintain records, on a field by field basis for fertiliser and manure usage. Application of fertilisers is not to exceed 210 kg ha-1 total nitrogen over the farm each year. This applies to all farms, whether producing or receiving organic manure (El-Sadek, 2007). On sandy or shallow soils there are to be no applications of slurry, poultry manure or liquid digested sludge on grass between 1st September and 1st November and to fields not in grass between 1st August and 1st November. These manures should not be applied if the soil is waterlogged, flooded, frozen hard or snow covered, or to fields that are steeply sloping or land within 10 m of surface water. The limits for NO3-N concentrations in groundwater and surface waters are still under discussion, but it is likely that they will become stricter. The denitrification process is the most important nitrogen loss process. The water table level can be used to manage and design the denitrification amount to reduce nitrate-nitrogen leaching to groundwater and surface water by raising the water table level in the soil profile.
Alaa El-Sadek 57

CONCLUSIONS AND RECOMMENDATIONS
The paper is concentrated on the analysis for the August 2002 campaign results for the main Nile with the two branches, the drains, irrigation canals and rayahs and the Lake Nasser. The spatial variation of the sampled water quality parameters is presented with the comparison to the recommended standard (Law 48 /1982). Based on the analysis, it was possible to define the locations where the concentrations violate the standards. Moreover, it presents the temporal analysis for the September 2000 and August 2002 campaign results. The analysis is performed for the Nile, the two branches, drains, irrigation canals and rayahs and Lake Nasser. For Lake Nasser, analysis of the monitoring sites results shows that all water quality parameters fulfill the recommended standard (Law 48 /1982 and the Flemish basic quality standard). Along the Nile River the measured concentrations for NO3 comply with the recommended standards. For the irrigation canals and rayahs, NO3 concentrations are less than the permissible limits. For the drains, the worst quality conditions for NO3 are registered at Khour Sail Aswan drain. It is recommended to have more intensive measurement campaigns along the drain to propose different scenarios for improving the current conditions. It is recommended to include more than two campaign results (from previous studies) to perform more advanced statistical analysis. The best way for determining the water quality of streams and rivers is by combining chemical, physical and biological monitoring of the considered water bodies. However, problems of understanding the different relations between the water quality evolution, estimating the effect of river flow and water quality management projects, etc. can not be solved by analysis of monitoring results and models can have a significant and decisive role. The limits for NO3-N concentrations in groundwater and surface waters are still under discussion, but it is likely that they will become stricter. As water quality models are tools for analyzing, extrapolating and predicting the water quality. It is recommended to build up a conceptual simplified model for the point-sources locations to be able to analyze different scenarios for improving the current state of the river and drains quality conditions.
REFERENCES
El-Sadek, A (2007) Upscaling field scale hydrology and water quality Modeling to catchment scale. Water Resources Management, 21: 149-169.
El-Sadek, A (2010) Monte Carlo approach to developing a water quality process-factor. International Journal of Water Resources and Environmental Management, 1: 97-104.
El-Sadek, A, Oorts, K, Sammels, L, Timmerman, A, Radwan M, and Feyen J (2003) Comparative study of two nitrogen models. Irrigation and Drainage Engineering, 129(1): 44-52.
El-Shirbini, A (1996), Design of water quality monitoring network for water quality management. Ph.D thesis, Ain Shams University.
Kubek, PB and Robillard, PD (1990) Drinking Water Solutions 2.0: Computer Information System. Pennsylvania State University Department of Agricultural and Biological Engineering., University Park, PA.
Radwan, M (2002) River quality modelling as water resources management tool at catchment scale. Ph.D thesis, K.U.Leuven, Belgium.
Radwan, M, El-Sadek, A, Willems, P, Feyen, J, and Berlamont, J (2001) Modelling of nitrogen in river water using a detailed and a simplified model. TheScientificWorld, 1 (S2): 200-206.
Smith, RL (1990) Ecology and Field Biology. 4th ed. Harper Collins Publishers, NY. Sobol, I. M., 1994. A Primer for the Monte Carlo Method. CRC Press.
Straub, CP (1989) Practical Handbook of Environmental Control. CRC Press, Inc., Boca Raton, FL.
Ref. No. (2601)Rec. 29/11/2010In-revised form: 8/2/2011
58 Spatial and temporal analysis of nitrogen transport and...