intensity of highly anisotropic low-spin heme epr signals
TRANSCRIPT

334
Biochimica et Biophysica Acta, 546 (1979) 334--340 © Elsevier/North-Holland Biomedical Press
BBA 47647
INTENSITY OF HIGHLY ANISOTROPIC LOW-SPIN HEME EPR SIGNALS
SIMON DE VRIES and SIMON P.J. ALBRACHT
Laboratory of Biochemistry, B.C.P. Jansen Institute, University of Amsterdarn, Plantage Muidergracht 12, 1018 TV Amsterdam (The Netherlands)
(Received July 12th, 1978)
Key words: Low-spin heine; EPR intensity
Summary
A semi-empirical formula has been derived to calculate the concentration of low-spin heme compounds that are highly anisotropic, i.e. 3 < gz ,( 4, and where information only on the g~ absorption is available.
Introduction
EPR can be used for the determination of the concentration of paramagnetic species through comparison with a known standard. In the procedure developed by Aasa and V~inng°ard [1] the total intensity of a rhombic powder spectrum is calculated from the area under an isolated absorption peak in the first derivative spectrum. This area is related to the intensity of the signal through a proport ionali ty factor which is a function of the three g values.
Since in general only one or two g values can be detected in low-spin heme compounds with highly anisotropic EPR spectra especially if g~ is greater than 3.3, the concentration of these compounds could not be determined by EPR.
Based on the expressions of the g values of low spin 3d s systems, derived by several authors [ 2--5 ], the proportionali ty factor of Aasa and V/~nng~rd can be rearranged into a form, that is exclusively a function of g~. Since it is always possible to detect the gz peak, the concentration of low-spin heme compounds with highly anisotropic EPR spectra can now be determined by EPR.
Materials and Methods
Cytochrome c and the cyanide complexes of metmyoglobin and cytochrome c were prepared as described in the literature [6]. The concentration of cyto- chrome c was determined optically using ~--~reA~55°d--ox : 21.1 mM -1 • cm -~ [7] and

335
that of metmyoglobin according to Ref. 8. EPR measurements and digitizing of EPR spectra were per formed as described in Ref. 9. EPR spectra were analyzed with a Du Pont 310 Curve Resolver.
Results
EPR theory o f low-spin 3d s sys tems Many authors have derived expressions of the g values of low-spin heme com-
pounds in terms of the wave-function coefficients [2--5]. Putt ing the orbital reduct ion factor k equal to 1 and ge = 2, Griffith [3,10]
calculated that the sum of the squares of the three g values, S, maximally equals 16. If ge = 2.0023 this sum equals 16.018. For the derivation we put ge = 2. From the expressions of the g values [11] it follows:
A = ½~/2(½gz + B2) '/2
p2 = ~gz + 2B: + B(2gz + 4B2) 1/2
where p = ~/2A + B. The sum expressed:
S = g~ + g~ + gz 2 = 4p2(4 _ p 2 )
(I)
(2)
of the squares of the g values, S, can then be
(2A)
By a calculation of the wave-function coefficients f rom the experimental g values of low-spin heme compounds and from the data in Ref. 5 it appeared that 2 < C/B < 5 (C is a wave-function coefficient).
Table I shows a calculation of S at different values of gz and B. In those
T A B L E I
C A L C U L A T I O N O F T H E S U M O F T H E S Q U A R E S O F T H E g V A L U E S (S ) A T D I F F E R E N T V A L U E S
O F gz A N D B
F r o m t h e v a l u e s g i v e n i n R e f . 5 i t a p p e a r s t h a t u s u a l l y B < 0 . 2 a n d 2 < C/B < 5 i n t h o s e l o w - s p i n h e i n e c o m p o u n d s h a v i n g a s e t o f g v a l u e s c o m p a r a b l e w i t h e x p e r i m e n t a l d a t a . A g o o d e s t i m a t e f o r A f r o m E q n .
1 is A = 1/2(gz) 1/2, s i n c e B i s s m a l l . T h e m a x i m u m f o r B is B m a x = ( 1 - - A 2 ) 1/2, w h e n C = 0. A s 2 < C]B 5 a n d A 2 + B 2 + C z = 1 i t f o l l o w s t h a t 0 . 2 B m a x < B < 0 . 4 5 B m a x . I t c a n b e s e e n i n t h e t a b l e , t h a t t h o s e
v a l u e s o f S, c a l c u l a t e d f r o m E q n s . 2 a n d 2 A , w h i c h fu l f i l t h i s c o n d i t i o n ( u n d e r l i n e d v a l u e s ) a r e c l o s e t o 16 .
gz A B m a x S
B = 0 B = 0 . 0 4 B = 0 . 0 8 B = 0 . 1 2 B = 0 . 1 6
3 . 0 0 . 8 6 6 0 . 5 0 0 1 5 . 0 0 1 5 . 3 6 1 5 . 6 6 1 .~ R7 1 5 . 9 9
3 .1 0 , 8 8 0 0 . 4 7 4 1 5 . 1 9 1 5 . 5 2 1 5 . 7 7 1 5 , 9 4 1~; ,00
3 . 2 0 , 8 9 4 0 . 4 4 7 1 5 . 3 6 1 5 . 6 5 1 5 . 8 6 1 5 , 9 8 1 5 , 9 9
3 . 3 0 . 9 0 8 0 . 4 1 8 1 5 . 5 1 1 5 . 7 6 1 5 . 9 3 1 ~ , 0 0 1 5 , 9 5 3 . 4 0 . 9 2 2 0 . 3 8 7 1 5 . 6 4 1 5 . 8 5 I~5,98 1 5 . 9 9 1 5 , 8 9 3 . 5 0 . 9 3 5 0 . 3 5 4 1 5 . 7 5 1 5 . 9 2 1 6 . 0 0 1 5 . 9 6 - -
3 .6 0 . 9 4 9 0 . 3 1 6 1 5 . 8 4 1 5 . 9 7 1 6 . 0 0 1 5 . 9 1 - - 3 .7 0 . 9 6 2 0 . 2 7 4 1 5 . 9 1 1 5 . 9 9 1 5 . 9 7 1 5 . 8 3 - - 3 . 8 0 . 9 7 5 0 . 2 2 4 1 5 . 9 6 1 6 . 0 0 1 5 . 9 3 1 5 . 7 3 1 5 . 3 8 3 .9 0 . 9 8 7 0 . 1 5 8 1 5 . 9 9 1 5 . 9 8 1 5 . 8 6 1 5 . 6 1 - - 4 . 0 1 . 0 0 0 0 . 0 0 0 1 6 . 0 0 . . . .
336
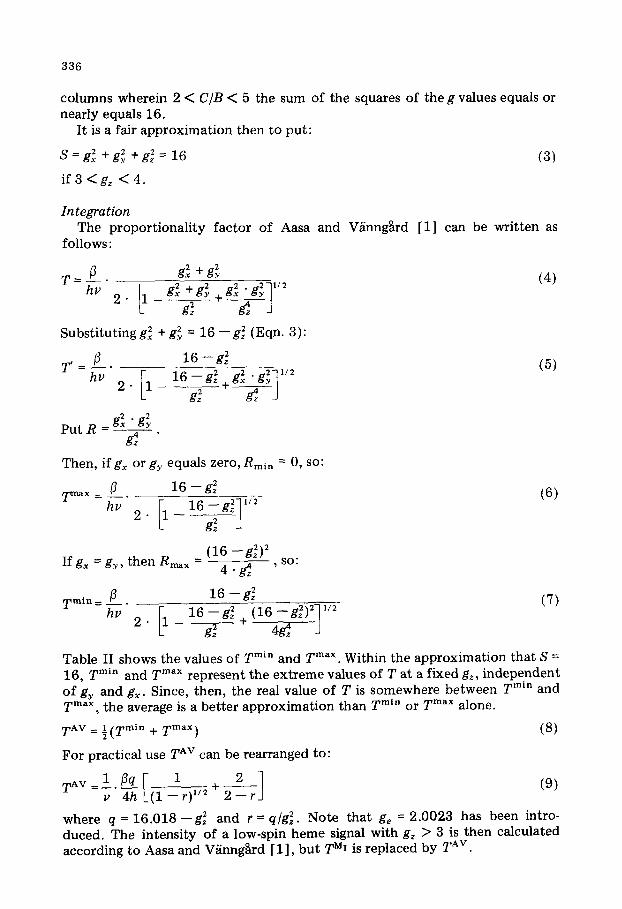
columns wherein 2 < C/B < 5 the sum of the squares of the g values equals or nearly equals 16.
I t is a fair approx imat ion then to put :
S = g~ + g~ + g~ = 16 (3)
if 3 <gz < 4 .
In tegra tion The p ropor t iona l i ty fac tor of Aasa and V/~nng~rd [1] can be wri t ten as
follows:
T = fi--- g~ + g~ (4) 1 g2 2 ,/2
Subs t i tu t ingg~ +g2 = 1 6 - - g z 2 (Eqn. 3): y
T' = fl-~-" 16 -- g2 (5) hv 2 [1 16_gz~+~2 g2~1/2
. .. gx " y| F J
P u t R g2 x . g2 _ y
Then, i fgx or gy equals zero, Rmi n = 0, so:
T ~ x = ~__. 16 -- g~ (6) hv 2 - [ 1 16--g2z] '/2
(16 _g~)2 If g~ = g~, then R ~ - 4 • g~z , so:
Train= fl_. 16 --g~ (7) 1 16 -- g~ (16 -- g~)2~ ,/2
hv 2" - - - ' - ~ - - + -4~z "-]
Table II shows the values of T min and T max. Within the approx imat ion tha t S = 16, T rain and T max represent the ex t reme values of T at a f ixed gz, i ndependen t o f gy and gx. Since, then, the real value o f T is somewhere be tween T rain and T max, the average is a bet ter approx imat ion than T rain or T max alone.
TAV = l (Tmin + Tmax) (8)
For practical use TAv can be rearranged to:
TAV 1 ~q I 1 2 1 -- ~" 4-h (1 -- r) ' / : + 2~-- r (9)
where q = 1 6 . 0 1 8 - - g ~ and r = q/g~. Note tha t ge = 2.0023 has been intro- duced. The in tens i ty of a low-spin heme signal with gz > 3 is then calculated according to Aasa and V/inng~rd [ 1 ], bu t T M1 is replaced by T Av .

337
T A B L E II
C A L C U L A T I O N OF T AV, T rain AND T m a x A T D I F F E R E N T V A L U E S OF gz
T m a x , T rain and T AV were ca lcu la ted w i th Eqns . 6, 7 and 8, in wh ich the f ac to r 1/u has b e e n o m i t t e d and 16 is r ep laced by 16 .018 . Dev ia t i on is de f ined as + (1--Tmin/T AV) X 100%. Note t ha t the dev ia t i on decreases wi th increas ing gz values.
gz T m a x T m i n T AV Devia t ion (%)
3.0 1 0 . 4 6 5 8 . 050 9 .257 + 13.0 3.1 7 .769 6 .727 7 .248 __+ 7.2 3.2 6 .125 5 .632 5 .879 -+ 4.2 3.3 4 .933 4 .694 4 .813 -+ 2.5 3.4 3 .980 3 .865 3 . 922 + 1.5 3.5 3 .169 3 .116 3 .142 __+ 0.8 3.6 2 .448 2 .426 2 .437 + 0.5 3.7 1 .788 1 .780 1 .784 + 0.2 3.8 1 .170 1 .168 1 .169 <:0.1 3.9 0 .581 0 .581 0 .581 <:0.01 4.0 0 .013 0 .013 0 .013 0
F. 9301 MHz T. 10 K P. 0.02 mW M.A. 3.2 mT
~ = '
p H = l O
l i i i i n l l l i i i i l i l l i l i l l i I I i I I I i i 14. 3 . 2.
Fig. 1. C o m p a r i s o n of the EPR spec t ra of c y t o c h r o m e c at p H 7.4 an d p H 10. (A) Oxid ized c y t o c h r o m e c in 50 m M Tris-HC1 b u f f e r ( pH 7.4). (B) Oxid ized c y t o c h r o m e c in 50 m M Tris-HC1 b u f f e r (pH 7.4) t i t r a t ed wi th 1 N N a O H unt i l pH = 10. Both samples were d i lu ted to the s ame e x t e n t and the spec t ra were r e c o r d e d wi th the s ame gain. Only a smal l f r ac t ion of the signal a t gz = 3.06 appea r s in t race B, and th ree new signals a p p e a r wi th the fo l lowing gz values: 3 .16 , 3 .40 an d 3 .48 . Th e origin of the sharp signals a r o u n d g = 2 is n o t clear , bu t t h e y are also p re sen t in the spec t ra of Ref . 6. EPR cond i t ions : F r e q u e n c y (F) , 9301 MHz; t e m p e r a t u r e (T) , 10 K; m i c r o w a v e p o w e r (P), 20 #W; m o d u l a t i o n a m p l i t u d e (MA), 3.2 m T ; scan ra te (SR), 100 m T / m i n , The field m o d u l a t i o n f r e q u e n c y for these spec t ra an d those in Fig. 2 is 100 kHz . The scale a t the b o t t o m of the f igures is o f g values.

338
T A B L E I I I
C O M P A R I S O N O F O P T I C A L L Y A N D E P R - D E T E R M I N E D C O N C E N T R A T I O N S O F S O M E L O W - S P I N
H E M E C O M P O U N D S W I T H H I G H L Y A N I S O T R O P I C E P R S P E C T R A
T w as c o m p u t e d f r o m E q n . 4, T A V w i t h E q n . 9. T h e i n t e n s i t y o f t he s igna l o f c o p p e r p e r c h l o r a t e s e rved
as a s t a n d a r d .
S a m p l e gz gY gx T T A V C o n c e n t r a t i o n ( p M )
E P R O p t i c a l l y
C y t o c h r o m e c a t p H 7 .4 3 . 0 6 2 . 2 5 1 . 2 5 7 . 4 9 5 - - 1 2 8 6 1 3 3 0
C y t o c h r o m e c a t p H 1 0
C o m p o n e n t 1 3 . 0 6 2 . 2 5 1 . 2 5 7 . 4 9 5 - - 1 4 9
C o m p o n e n t 2 3 . 1 5 9 . . . . 6 . 3 9 4 2 9 2
C o m p o n e n t 3 3 . 3 9 7 - - - - - - 3 . 9 4 9 4 3 2
C o m p o n e n t 4 3 . 4 8 - - - - - - 3 . 2 9 3 4 1 4
T o t a l (1 + 2 + 3 + 4 ) 1 2 8 7 1 3 3 0
C y t o c h r o m e c + c y a n i d e 3 . 3 4 3 - - - - - - 4 . 4 1 5 1 7 4 0 1 8 3 0
M e t m y o g l o b i n + c y a n i d e 3 . 3 8 3 - - - - - - 4 . 0 6 6 1 9 5 0 1 9 8 0
Validity of Eqn. 9 Fig. 1 shows the EPR spectra of cytochrome c at pH 7.4 and pH 10. In a
recent article [6] it was shown that the EPR spectrum of cytochrome c is pH dependent. Three new signals appear in the spectrum of pH 10 and only the
F. 9302 MHz / ~ T. 10 K
P. 0.02 mW M.A. 3.2 mT
A
j l i l l l l J l l J l l J i l l l J I i J I I [ J J l I i I i 4 . 3 . 2 ,
Fig . 2. E P R s p e c t r a o f t h e c y a n i d e c o m p l e x e s o f c y t o c h r o m e c a n d m e t m y o g l o b i n . (A) O x i d i z e d c y t o -
c h r o m e c i n 5 0 m M Tr i$-HCI b u f f e r a n d 1 4 0 m M K C N ( p H 7 .4 ) . T h e gz v a l u e is 3 . 3 4 3 . (B) M e t m y o g l o b i n
i n 50 m M Tris-HC1 b u f f e r a n d 1 4 0 m M K C N ( p H 7 .4) . T h e gz v a l u e is 3 . 3 8 3 . F o r b o t h s p e c t r a t h e gy v a l u e is a r o u n d 1 .9 a n d gx v a l u e s c a n n o t b e d e t e c t e d . E P R c o n d i t i o n s : F , 9 3 0 2 M H z ; T, 1 0 K; P,
2 0 ~zW; M A , 3 .2 m T a n d S R , 1 0 0 m T / m i n . F o r s y m b o l s see F ig . 1.

339
gz peaks are clearly visible. Note tha t the area under the g~ peaks in trace B is much smaller than in trace A, although both represent the same number of spins. The proport ionali ty factor T Av completely compensates for the differ- ence in area's, since: number of spins = concentration ~ (area)/T Av.
Assuming a Gaussian line shape, the g~ peaks in trace B were resolved into the individual components with a Curve Resolver. The area's, g values and values of T AV of the individual peaks were then used to compute the concen- tration of each component . The results are listed in Table III. There is a good correlation between the concentration determined by optical and EPR spec- t rometry.
Fig. 2 shows the EPR spectra of the cyanide complexes of cytochrome c and metmyoglobin. According to the literature [6,12] both compounds have the same set of g values: gz = 3.45, gy = 1.89 and gx = 0.93. However, we measured slightly different g values (see the legend of Fig. 2) and in neither case could we detect the gx line. The concentration was calculated with Eqn. 9 and compared with the optically determined concentration of both compounds in the absence of cyanide and corrected for dilution with cyanide. The results are shown in Table III.
Discussion
The only assumption made in the derivation of Eqn. 9 was that S equals 16 if 3 < g~ < 4. From a purely theoretical viewpoint this assumption cannot be proven and so Eqn. 9 is a semi-empirical equation. However, Table I shows that in all cases the maximum of 16 can be reached and that it appears from experi- mental data that the ratio of C and B is such that the maximum of 16 is attained for the low-spin heme compounds with g~ > 3.0. If this ratio remains fixed for other low-spin heme compounds with highly anisotropic EPR spectra, the sum of the squares of the g values is also 16 for these compounds. If one assumes that k < I then S < 16. The values of T Av then become smaller and the computed concentrations greater. However, the close correspondence between the optically and EPR-determined concentrations justifies the assump- tion that S equals 16.
Note that the difference between T ~in and T ~ax decreases with increasing g~ values and that if g~ is greater than 3.3 this difference is well within experi- mental error. For cytochrome c, with g z = 3.06, the difference between T ~in and T ~ax is 18%. The difference between T Av and T is, however, only 5.9% and this makes T Av a better approximation then either T ~in and T ~ax. It is of course preferable to use the expression of Aasa and V~inng~rd when the three g values are known. If only one or two g values can be detected T Av gives a very good approximation of T.
This approximation becomes even better at greater gz values. In practice it appears that in this case the gy and/or g~ resonances cannot be detected and only Eqn. 9 can be used to calculate the proportionali ty factor and so the con- centration.
Eqn. 9 was especially developed to determine the stoichiometry of the several heme groups in QH2: cytochrome c oxidoreductase, that have highly anisotropic EPR spectra with g~ values greater than 3.3 [13,14]. The results of these studies are presented in an accompanying paper [15].

340
Acknowledgements
We thank Prof. E.C. Slater for his continuous interest and for reading the manuscript. Part of this work has been supported by grants from the Nether- lands Organization for the Advancement of Pure Research (Z.W.O.) under the auspices of the Netherlands Foundation for Chemical Research (S.O.N.).
References
. . o 1 Aasa, R. and Vanngaxd, T. (1975) J. Magn. Res. 19 ,308- -315 2 Bleany, B. and O'Brien, M.C.M. (1956) Proc. Phys. Soc. B 69, 1216--1230 3 Griffith, J.S. (1961) The Theory of Transition-Metal Ions, Cambridge University Press, London and
New York 4 Weissbluth, M. (1966) Struct. Bonding, 2, 1--125 5 Harris-Loew, G.M. (1970) Biophys. J. 10, 196--212 6 Brautigan, D.L., Feinberg, B.A., Hoffman, B.M., Margoliash, E., Peisach, J. and Blumberg, W.E.
(1977) J. Biol. Chem. 252, 574--582 7 Van Gelder, B.F. and Slater, E.C. (1962) Biochim. Biophys. Acta 58, 593--595 8 Antonini , E. and Brunori, M. (1971) in Hemoglobin and Myoglobin in their React ions with Ligands,
Frontiers of Biology, Vol. 21, p. 19, North-Holland Publ. Co., Amsterdam 9 Albracht, S.P.J., Dooijewaaxd, G., Leeuwerik, F.J. and Van Swol, B. (1977) Biochim. Biophys. Acta
459 ,300 - -317 10 Griffith, J.S. (1971) Mol. Phys. 21, 135--139 11 Griffith, J.S. (1961) The Theory of Transition-Metal Ions, p. 364, formula 12.88, Cambridge Univer-
sity Press, London 12 Hori, H. (1971) Biochim. Biophys. Acta 251, 227--235 13 Orme-Johnson, N.R., Hansen, R.E. and Beinert, H. (1974) J. Biol. Chem. 249, 1928--1939 14 Dervartanian, D.V., Albracht, S.P.J., Berden, J.A., van Gelder, B.F. and Slater, E.C. (1973) Biochim.
Biophys. Acta 292, 496--501 15 De Vries, S., Albracht, S.P.J. and Leeuwerik, F.J. (1979) Biochim. Biophys. Acta 546 ,316- -333