intelligent transport systems · intelligent transport systems (its) can be defined as holistic,...
TRANSCRIPT
Intelligent Transport Systems Department Faculty of Transport and Traffic Sciences
University of Zagreb
Sadko Mandžuka
INTELLIGENT TRANSPORT SYSTEMS
Selected Lectures
Zagreb, 2015.

Intelligent Transport Systems Department Faculty of Transport and Traffic Sciences University of Zagreb Prof. Sadko Mandžuka, PhD INTELLIGENT TRANSPORT SYSTEM Selected Lectures Zagreb, 2015.

CONTENTS
I. DEVELOPMENT OF INTELLIGENT TRANSPORT SYSTEMS 1
II. ROAD WEATHER INFORMATION SYSTEM 29
III. PEDESTRIAN NAVIGATION 46
IV. MOBILE COMMUNICATION AND TRAFFIC INCIDENT
MANAGEMENT PROCESS
61
V. THE DECISION SUPPORT SYSTEM FOR DISASTER TRAFFIC
RESPONSE MANAGEMENT
80
VI. ROAD TRAFFIC INCIDENT DETECTION 89

Faculty of Transport and Traffic Sciences
Intelligent Transport Systems – Selected Lectures 1/115
I. DEVELOPMENT OF INTELLIGENT TRANSPORT
SYSTEMS
1. INTRODUCTION
Intelligent Transport Systems (ITS) can be defined as holistic, control, information
and communication upgrade to classical transport and traffic systems, which enables
significant improvement in performance, traffic flows, efficiency of passenger and
goods transportation; safety and security of transport, ensures more comfortable
travelling for passengers, reduces pollution, etc. ITS presents a crucial breakthrough
by changing approaches and trends in transport and traffic research and technology
aiming to solve escalating problems of congestions, pollution, transport efficiency,
safety and security of passengers and goods, [1]. This is also proved by numerous
programmes and projects related to ITS all over the world, introduction of new study
programmes on ITS and foundations of ITS associations at national and global level
(ITS Croatia was established in 2005). ITS replaced previously used concept for
transport problem solving, which had already been exploited. Increasing transport-
related problems in all major cities, centres or airports, raise the need for new
approaches and new solutions.
Direct benefits from ITS deployment can be analyzed based on different sets of
factors so called categories of ITS benefits. In literature ITS benefits are classified
into the following categories, [1, 2]:
1. Safety,
2. Flow efficiency,
3. Productivity and cost reduction,
4. Environment benefits.
Faculty of Transport and Traffic Sciences
Intelligent Transport Systems – Selected Lectures 2/115
Beside the measurable benefits, many other advances can also be noticed, including
new business opportunities, increase of employment; improvement of
regional/urban/national technology status etc. Among common users and
stakeholders, the following groups can be recognized: end users, network operators,
system owners (stakeholders), service providers, tour operators, local authorities,
civil government, etc. There are many approaches to measuring influences and
benefits of new projects related to ITS development and deployment. Designing
effective and usable ITS solution includes a possibility for estimating the ITS benefits
using suitable methods, such as:
1. Method for physical impact measurement
2. Benefit analysis method
3. Cost – effectiveness analysis (C/E)
4. Benefit – cost analysis (B/C).
Recently, the European Union has made some significant efforts in the field of ITS
deployment trying to find solutions for the escalating transport and traffic problems. A
great number of activities has been stipulated by different European bodies with the
single objective – to enforce the practical ITS deployment all over the Union [3]. The
paper provides overview of these activities and their influence on the Republic of
Croatia, and the surrounding region, as well.
2. DEVELOPMENT OF ITS ARCHITECTURE
Architecture can be defined as a basic system organisation consisting of crucial
components, their relations and connections to environment, as well as principles for
system design and development during the whole lifecycle, [1]. In order to enable
development and upgrades, complex systems have to include additional
characteristics such as: Compatibility, Expandability, Interoperability, Integrability,
Standardability, [4]. Lack of architecture can result in difficulties because of
incompatible components, higher cost for updates and complications in introducing or

Faculty of Transport and Traffic Sciences
Intelligent Transport Systems – Selected Lectures 3/115
adjusting new technologies. ITS architecture provides a general framework for
planning, designing and implementing integrated system in a given period and
geographical area.
An ITS Architecture is important for a number of reasons:
o it ensures an open market for services and equipment, because there are
“standard” interfaces between components;
o an open market permits economies of scale in production and distribution,
thus reducing the price of products and services;
o it ensures consistency of information delivered to end-users;
o it encourages investment in ITS since compatibility is ensured;
o it ensures inter-operability between components, even when they are
produced by different manufacturers, which is also good for SMEs (Small and
Medium sized Enterprises);
o it permits an appropriate level of technology independence and allows new
technologies to be incorporated easily;
o it provides the basis for a common understanding of the purpose and functions
of the ITS, thus avoiding conflicting assumptions, [5].
Based on the content and mandatory use, three main type of ITS Architecture are
defined:
o Framework ITS Architecture;
o Mandated ITS Architecture;
o Service ITS Architecture, [1].
Framework Architecture, most suitable for national level architecture, focuses on user
needs and functional viewpoint. This type of architecture can be also considered as a
starting point for the development of other two types of architecture. Mandated
Architecture consists of physical, logical and communication viewpoints but also
includes additional outputs (Cost-Benefit analysis, Risk analysis etc.), [4]. Content of
Mandated Architecture is strictly defined and, as a consequence, choices for
deployment options are limited. Service Architecture is similar to Mandated

Faculty of Transport and Traffic Sciences
Intelligent Transport Systems – Selected Lectures 4/115
Architecture, but includes services. Additionally, there are also physical and logical
(functional) architecture. While the logical architecture consists of processes and
interconnecting data flows, physical architecture includes physical components (parts
of equipment) and related data flows. ITS architecture can live to its potentials only
when logical architecture is based on user needs, vision and operational concept,
and when physical architecture is developed based on the logical architecture.
Defining the physical architecture is strongly connected with standardization and
implementation strategy.
2.1 Functional Area and services in the field of ITS
Initial standardization of ITS services, focused on road transport, was set up by ISO
(International Standardization Organization). First reference model for ITS included 8
functional areas and 32 services (ISO TR 14813-1 - Transport information and
control systems - Reference model architecture(s) for the TICS Sector), [1]. The
reference models for ITS architecture were improved in 1999 in the way that Part I
(1999.), describing ITS Fundamental Services, replaced standards presented in
Technical Report on Transport Information and Control Systems. Intention of new
taxonomy is to relate similar and complementary ITS services. The taxonomy
includes 11 functional areas:
1. Traveller Information
2. Traffic Management and Operations
3. Vehicles
4. Freight Transport
5. Public Transport
6. Emergency
7. Transport Related Electronic Payment
8. Road Transport Related Personal Safety
9. Weather and Environmental Monitoring
10. Disaster Response Management and Coordination
11. National Security.

Faculty of Transport and Traffic Sciences
Intelligent Transport Systems – Selected Lectures 5/115
National ITS architectures can include additional services and functions which are not
listed in ISO taxonomy of services. Each functional area consists of interrelated
services.
2.2 Development of European ITS architecture
Development of European ITS architecture is as the result of two project funded by
the European Commission – KAREN (started in 1999) and FRAME. FRAME project
includes early ideas of European ITS framework architecture with following
documentation:
1. European ITS functional architecture;
2. European ITS physical architecture;
3. European ITS communication architecture;
4. European ITS cost-benefit analysis;
5. European ITS implementation study;
6. ITS implementation models, [1].
The European ITS Framework Architecture is designed to provide a flexible
framework that individual countries can tailor to their own requirements. National ITS
Architecture projects based on the European ITS Framework Architecture, such as
ACTIF (France), ARTIST (Italy), TTS-A (Austria) and TEAM (Czech Republic),
therefore have a common approach and methodology, but each has been able to
focus on the aspects of local importance and develop them in more detail, [5]. Project
frame has continued as the E-FRAME FP7 project. There are significant differences
between approaches in designing the ITS architecture. US ITS Architecture is based
on physical viewpoint, European architecture relies mostly on users' needs and
functional viewpoint, while Japanese national ITS architecture uses object oriented
methodology.
Faculty of Transport and Traffic Sciences
Intelligent Transport Systems – Selected Lectures 6/115
3. ACTION PLAN AND DIRECTIVE FOR ITS DEPLOYMENT
Action plan for deployment of ITS can be considered as the document that initiated
stronger and more focused ITS development in European Union. Although there was
a high level of harmonisation in strategic researches supported by the European
Technology Platforms ERTRAC and ERTICO-ITS, framework for deployment of ITS
in road transport was still to be designed, [6]. Preparation of Action plan included
stakeholders’ consultation, workshops, on-line survey (public debate) and discussion
groups.
The introduction of the Action plan presents three major challenges:
1. congestion and congestion’s costs;
2. road transport related CO2 emissions;
3. fatalities.
The main policy objectives arising from these challenges are for transport and travel
to become: cleaner, more efficient, safer and more secure. ITS has been recognized
as a possible solution, and the purpose of the Action plan is to accelerate and to
coordinate the deployment of ITS in road transport, including interfaces with other
transport modes. The potential of ITS could be realised only if its deployment in
Europe is transformed from the limited and fragmented implementation into an EU
wide one. The role of the EU is to create frameworks that will include policy priorities,
choice of generic ITS components and clear timetable for specific activities, [7].
The Action plan envisages six priority areas:
1. Optimal use of road, traffic and travel data;
2. Continuity of traffic and freight management ITS services on European
transport corridors and in conurbations;
3. Road safety and security;
4. Integration of the vehicle into the transport infrastructure;
5. Data security and protection, and liability issues;
6. European ITS cooperation and coordination.

Faculty of Transport and Traffic Sciences
Intelligent Transport Systems – Selected Lectures 7/115
Within six priority areas the total of 24 activities were defined (Fig. I.1). Priority areas
were later partially transferred in Directive 2010/40/EU.
Fig. I.1 - Action plan priority areas and activities for deployment of ITS in
Europe
3.1. Directive 2010/40/EU
Directive 2010/40/EU is a general document for coordination of ITS development in
the European Union. Like other directives, it is not directly applicable in each Member
state. However, it is the obligation of the Member states to adapt their national
legislation in order to achieve goals set by directives. The essential part of the
Faculty of Transport and Traffic Sciences
Intelligent Transport Systems – Selected Lectures 8/115
document is the list of priority areas and priority actions, as well as plans with set
deadlines. The basic objective of the Directive is the setting up of framework for
future activities, which will consequently lead to the harmonisation of ITS
development in Europe.
The adoption of specification for priority areas is the first step toward a harmonised
development. Specifications will be developed individually and, depending on area
covered, they can include different types of provisions:
a) functional provisions that describe the roles of the various stakeholders
and the information flow between them;
b) technical provisions that provide for the technical means to fulfil the
functional provisions;
c) organisational provisions that describe the procedural obligations of the
various stakeholders;
d) service provisions that describe the various levels of services and their
content for ITS applications and services, [8].
After the adoption of each specification, the Commission notifies the European
Parliament and the Council. They may object to the content of specification within a
two month period and, at their initiative, the period for objections can be extended for
additional two months. If there are no objections from The Parliament or The Council,
specification is considered adopted and will be published in the Official Journal of
European Union. The Commission may also adopt non-binding measures (guidelines
and other) to facilitate Member States' cooperation relating to the priority areas.
Special attention is given to data protection and it is stated that Member states are
obliged to ensure fundamental rights and freedoms of individuals. National ITS
legislative must ensure that personal data are protected against misuse, including
unlawful access, alteration or loss, [8]. For these reasons, the use of anonymous
data is encouraged.
Implementation of tasks from the Directive is assisted by the European ITS
Committee (EIC). The European ITS Advisory Group is also established in order to
provide advices on business and technical aspects of ITS introduction and
deployment. The Advisory Group includes service providers, users, manufacturers,
professional associations and local authorities.

Faculty of Transport and Traffic Sciences
Intelligent Transport Systems – Selected Lectures 9/115
3.2. Priority areas and priority actions
The Directive establishes four priority areas:
1. Optimal use of road, traffic and travel data;
2. Continuity of traffic and freight management ITS services;
3. ITS road safety and security applications;
4. Linking the vehicle with the transport infrastructure, [8].
These four priority areas are also the priority areas of Action plan for ITS deployment.
Data security and protection, and liability issues, which was included in the Action
plan, is not included in the Directive but references to relevant legislation framework
are made. European ITS cooperation and coordination, the sixth area in the Action
plan, can be considered as a general issue. The existence of the Directive itself
proofs the existence of mentioned cooperation. Within the priority areas, six priority
actions are defined:
1. the provision of EU-wide multimodal travel information services
2. the provision of EU-wide real-time traffic information services;
3. data and procedures for the provision, where possible, of road safety
related minimum universal traffic information free of charge to users;
4. the harmonised provision for an interoperable EU-wide eCall;
5. the provision of information services for safe and secure parking places for
trucks and commercial vehicles;
6. the provision of reservation services for safe and secure parking places for
trucks and commercial vehicles.
Annex to the Directive describes relationships between priority areas and priority
actions. Three of them (1-3) are part of Area 1 (Optimal use of road, traffic and travel
data), while the last three (4-6) are included in Area 3 (ITS road safety and security
applications). For each priority action specification will be prepared in order to

Faculty of Transport and Traffic Sciences
Intelligent Transport Systems – Selected Lectures 10/115
achieve compatibility, interoperability and continuity of implementation and
deployment of ITS applications.
3.3. Expected timeframe for tasks set in the Directive
Expected deadlines for the implementation of specific tasks described in the Directive
are listed in Tab. I.1.
Tab. I.1 Deadline for activities envisaged in the Directive 2010/40/EU
Activity Responsibility Deadline
Entrance into force -- 27 July
2010
Adoption of specifications for one or more
priority actions
European
Commission
27 February
2013
Power to adopt the delegated acts
(specifications etc.)
European
Commission
7 years
following
27 August
2010
Adoption of the Working programme European
Commission and
EIC
27 February
2011
Submission of report on progress to the
European Parliament and the Council
European
Commission
Every three
years
Submission of reports on national activities and
projects regarding priority areas
Member states 27. August
2011
Submission of a five year plan on national ITS
actions
Member states 27 August
2012
Bringing into force the laws, regulations and
administrative provisions necessary to comply
with the Directive
Member states 27 February
2012
Submission of reports on progress made after
the initial report
Member states Every three
years

Faculty of Transport and Traffic Sciences
Intelligent Transport Systems – Selected Lectures 11/115
Source: [8]

Faculty of Transport and Traffic Sciences
Intelligent Transport Systems – Selected Lectures 12/115
3.4 Working Programme on the implementation of Directive 2010/40/EU
Based on the deadline set in the Directive, the Commission adopted the Working
Programme in February 2011. The Programme incorporates a detailed time schedule
for each priority action according to the articles of the Directive (Fig. I.2). For each
action the following steps are to be taken:
a) Analysis and Preparation (including external study, consultation with
stakeholders and appropriate consultation with Member states experts);
b) Impact Assessment;
c) Drafting of specification (including opinion of ITS Advisory Group and
appropriate consultation with Member states experts);
d) Final draft and Inter-service consultation;
e) Adoption.
1Q 2Q 3Q 4Q 1Q 2Q 3Q 4Q 1Q 2Q 3Q 4Q 1Q 2Q 3Q 4Q
2014
Adoption
Analysis and Preparation including:
- external study
- consultation with stakeholders
- appropriate consultation with Member states experts
Impact Assessment
Drafting of specification, including:
- opinion of ITS Advisory Group
- appropriate consultation with Member states experts
Final draft and Inter-service consultation
The provision of reservation services for safe and secure parking places for trucks and commercial
vehicles
2011 2012 2013
The harmonised provision for an interoperable EU-wide eCall;
The provision of EU-wide multimodal travel information services
The provision of EU-wide real-time traffic information services
Data and procedures for the provision, where possible, of road safety related minimum universal
traffic information free of charge to users
The provision of information services for safe and secure parking places for trucks and commercial
vehicles
Fig. I.2 - Timeline for priority activities according to the Working programme

Faculty of Transport and Traffic Sciences
Intelligent Transport Systems – Selected Lectures 13/115
Time schedule for each activity is prepared considering the current state of
preparation and complexity of the processes. As an example, at the time of
preparation of the Working Programme, phase of Analysis and Preparation for priority
action The harmonised provision for an interoperable EU-wide eCall has already
been finalised. The longest period is foreseen for action named The provision of EU-
wide multimodal travel information services.
3.5 Legal limitation for ITS deployment
The two main limitations for ITS deployment are incorporated in the EU legislation:
a) Personal data protection;
b) National security.
These limitations are not directly included in the legal framework for all modes of
transport (Tab. I.2).
Tab. I.2 Personal data protection and National security in EU ITS legislative
Mode of
transport
Legal
document
Personal data protection National security
Maritime transport
2002/59/EC -- Article 24 Member States shall, in accordance with their national legislation, take the necessary measures to ensure the confidentiality of information sent to them pursuant to this Directive.
Inland waterways transport
2005/44/EC Article 9. – Member States shall ensure that processing of personal data necessary for the operation of RIS is carried out in accordance with the Community rules protecting the freedoms and fundamental rights of individuals, including Directives 95/46/EC and 2002/58/EC.
--

Faculty of Transport and Traffic Sciences
Intelligent Transport Systems – Selected Lectures 14/115
Air traffic 219/2007 -- Annex Article 22. - The Joint Undertaking shall ensure the protection of sensitive information, the non-authorised disclosure of which could damage the interests of the contracting parties. It shall apply the principles and minimum standards of security defined and implemented by Council Decision 2001/264/EC of 19 March 2001 adopting the Council’s security regulations
Road transport
2010/40/EU Article 10. – Member States shall ensure that the processing of personal data in the context of the operation of ITS applications and services is carried out in accordance with Union rules protecting fundamental rights and freedoms of individuals, in particular Directive 95/46/EC and Directive 2002/58/EC.
Article 1. – without prejudice to matters concerning national security of necessary in the interest of defence
Sources: [8, 9, 10, 11, 12]
Although, the personal data protection is not always directly addressed in legal acts
on ITS deployment, the protection is obligatory due to the existing EU legal
framework.
4. IMPORTANCE OF THE EUROPEAN DIRECTIONS FOR THE
REPUBLIC OF CROATIA
As a candidate country Croatia has to fulfil specific conditions including compliance of
legal documents with the European legal framework (acquis communautaire).
Negotiations related to this harmonisation were conducted based on 35 chapters.
Simultaneously, the European Union supports the necessary reforms in the pre-
accession period providing co-financing through pre-accession funds. In the field of
transport, international harmonisation is necessary even if it would not be related to
accession to the Union. More precisely, lack of harmonisation could cause obstacles
in the traffic flows on the important paneuropean corridors (V and X) passing through
Croatia.
Receipt of co-financing is generally not possible without preparation of strategic
documents. Instrument for Pre-Accession Assistance (IPA) includes 5 components.

Faculty of Transport and Traffic Sciences
Intelligent Transport Systems – Selected Lectures 15/115
For component IPA III and IV, Croatia had to prepare Operational programmes based
on Multi-annual Indicative Planning Document (MIPD) and Strategic Coherence
Framework (SCF). Operational programmes generally include overview of current
situation, plans and list of potential projects (project pipeline). The implementation of
subcomponent IIIA “Regional Development – Transport” is based on Operational
programme for Transport. Management structure, interconnecting processes and
related activities merge into a complex system for the Programme implementation. In
the pre-accession period Operational Programme is focused on two modes of
transport: inland waterway transport and rail transport. Strategic definition of the
Programme includes three priority axes (Upgrading Croatia's rail transport system,
Upgrading Croatia's inland waterway system, Technical Assistance) and related
measures. In the course of preparation for the use of EU funds after accession,
abstract of the draft for Operational Programme for Transport has been prepared
(primarily intended for period 2012 – 2013). The new Programme incorporated all
modes of transport in order to harmonize the development of the transportation
network in Croatia and create successful connections to paneuropean networks.
Funds will be available for regional and local development of road transport
infrastructure, seaports, airports and public transport including support to cleaner
urban transport, [13]. Ministry of Sea, Transport and Infrastructure is envisaged as
the Managing Authority for Operational Programme for Transport after the accession
to the EU.
4.1. Scientific and research capacities in Croatia
The most significant part of research activities in the last period was financed within
the programme of the Ministry of Science, Education and Sports - MSES (former
Ministry of Science and Technology - MST). Some of those projects are:
- General ITS models and their modal mapping (MST, 1998-2002)
- Methods of development of integrated Intelligent transport systems (MST, 2002-
2005)
- Methodology for development of integrated adaptive transportation logistics
systems (MSES, 2006-2013)

Faculty of Transport and Traffic Sciences
Intelligent Transport Systems – Selected Lectures 16/115
In recent years, as a result of previous research activities, the Republic of Croatia
has been participating in several European R&D programmes, projects and activities.
Some of those projects are:
- Intelligent Cooperative Sensing for Improved traffic efficiency – ICSI (FP7 -
Framework Programme 7; 2012-2015)
- Intelligent Transport Systems in South East Europe - SEE-ITS (South East Europe
Transnational Cooperation Programme - SEE TCP; 2012-2014)
- Computer Vision Innovations for Safe Traffic - VISTA (European Regional
Development Fund, IPA- ERDF; 2012-2014)
- TU1102 Towards Autonomic Road Transport Support Systems, (COST Programme
actions, 2011-2015)
Although the present situation of research and educational capacities is satisfactory,
the biggest problem is insufficient connection of research capacities and economy.
This elementary problem in the Republic of Croatia is being solved through several
programmes on institutional and the project basis. The Croatian Agency for SMEs
and Investment - HAMAG-BICRO - was established by the Government with the
purpose of implementation of the Government's technological development support
programmes. Its basic task is successful and effective support to technological
development and commercialization of research results by connecting the economy
with science and by creation of financial, material and other preconditions for
successful innovation development. HAMAG-BICRO has recognised the importance
and the role of Intelligent transport systems through repeatedly support to such
projects.
Faculty of Transport and Traffic Sciences
Intelligent Transport Systems – Selected Lectures 17/115
4.2. Legal Framework
As of 1 July 2013, the Republic of Croatia became a member of the European Union.
During the process of negotiation for the accession, the Republic of Croatia
harmonised its legislation with that of the European Union and started with
deployment of corresponding systems. The most significant step in the field of ITS
legislation was made in the new version of the Act on the Amendments to the Roads
Act, which was adopted by Croatian Parliament on its session on 19 April 2013. This
refers primarily to implementation of the Directive 2010/40/EU of the European
Parliament and Council from 7 July 2010 on the framework for the deployment of
Intelligent Transport Systems in the field of road transport and for interfaces with
other modes of transport. In accordance with Article 72.b of the same Act, the
Government of the Republic of Croatia, at the proposal of the Ministry of Maritime
Affairs, Transport and Infrastructure on 2nd. of July 2014. brought the National
Programme for the development and deployment of ITS in road traffic on priority
areas for 2014.-2018. time period, for planning of activities and projects and
determining measures for implementation of the programme. Holder of activities for
preparation and drafting of National programme was newly established National
Council for the development and deployment of ITS in the Republic of Croatia.
4.3. Interests of Croatian industry
Latest progress in construction and modernization of highways and other
infrastructure put the Republic of Croatia on the very top in the region considering the
transport management system installed at highways and freeways. Modern transport-
related information technology implemented to all Croatian highways and some
freeways (region of Rijeka and Split) enables a continuous progress towards
integration of transport infrastructure management. This can be considered as an
important step in achieving harmonised transport management in the region.
Implemented technology is mostly produced by domestic industry which is the
additional benefit from highway (or other transport infrastructure) construction and
modernization – significant growth of small and medium enterprises related to
telematic equipment, based on research and development, designing, manufacturing,
implementation and maintenance of telematic systems for different purposes.

Faculty of Transport and Traffic Sciences
Intelligent Transport Systems – Selected Lectures 18/115
Technology for adaptive traffic signalisation and systems for centralized management
are considered as the best example of verified and acknowledged products, not only
in the region, but also on the global level. Some Croatian manufacturers are
specialised in providing integrated technological solution for advance traffic
management on highways, in tunnels or in the cities. Successful projects have been
realised in Croatia and in more than 30 countries in the region and in the world.
ITS Development Strategy in Republic of Croatia, especially the development of ITS
in the cities (adaptive traffic control, public transport management, parking lines
management, intermodal transport in big cities and ferry ports, convoy management)
is strongly related to the realisation of major projects in transport system
management. This should enable further development of small and medium
enterprises focused on manufacturing management systems and telematic
equipment for these purposes.
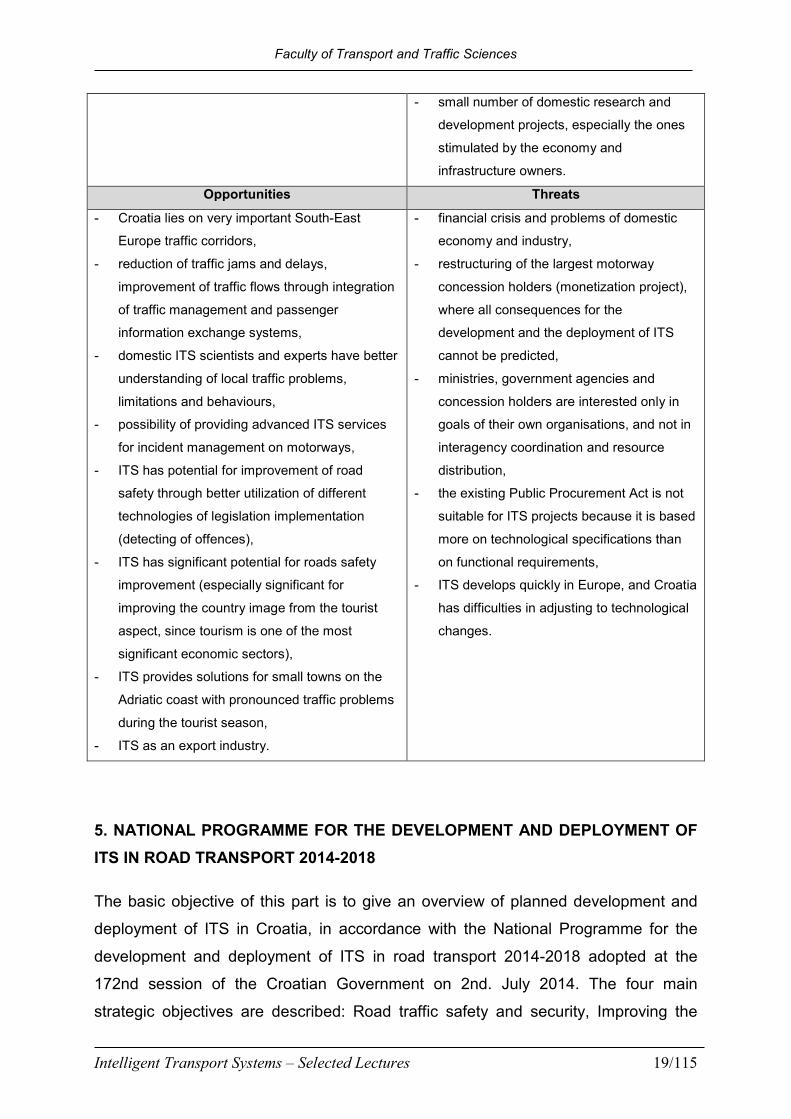
4.4. SWOT analysis
Taking into consideration current situation of ITS development in the European Union
and the Republic of Croatia, SWOT analysis was performed, and its results
presented in Table I.3.
Table I.3. SWOT analysis
Strengths Weaknesses
- the Republic of Croatia has the ability to
develop new ITS applications and services,
- transport telematics industry in the Republic of
Croatia has good experience in technology and
equipment development,
- leading road infrastructure operators have very
good experience in this area,
- there is a high level of education in the field of
ITS.
- in the previous period there were no clearly
defined politics and strategies in ITS
development and deployment,
- insufficient coordination of different bodies
in charge of transport,
- ITS development has been aimed at
fragmentary low level applications, which
resulted in the lack of effective integration
between the systems,
- the existing approach resulted in high
equipment maintenance costs,
- the former approach to design of these
systems did not take ITS features into
consideration,
Faculty of Transport and Traffic Sciences
Intelligent Transport Systems – Selected Lectures 19/115
- small number of domestic research and
development projects, especially the ones
stimulated by the economy and
infrastructure owners.
Opportunities Threats
- Croatia lies on very important South-East
Europe traffic corridors,
- reduction of traffic jams and delays,
improvement of traffic flows through integration
of traffic management and passenger
information exchange systems,
- domestic ITS scientists and experts have better
understanding of local traffic problems,
limitations and behaviours,
- possibility of providing advanced ITS services
for incident management on motorways,
- ITS has potential for improvement of road
safety through better utilization of different
technologies of legislation implementation
(detecting of offences),
- ITS has significant potential for roads safety
improvement (especially significant for
improving the country image from the tourist
aspect, since tourism is one of the most
significant economic sectors),
- ITS provides solutions for small towns on the
Adriatic coast with pronounced traffic problems
during the tourist season,
- ITS as an export industry.
- financial crisis and problems of domestic
economy and industry,
- restructuring of the largest motorway
concession holders (monetization project),
where all consequences for the
development and the deployment of ITS
cannot be predicted,
- ministries, government agencies and
concession holders are interested only in
goals of their own organisations, and not in
interagency coordination and resource
distribution,
- the existing Public Procurement Act is not
suitable for ITS projects because it is based
more on technological specifications than
on functional requirements,
- ITS develops quickly in Europe, and Croatia
has difficulties in adjusting to technological
changes.
5. NATIONAL PROGRAMME FOR THE DEVELOPMENT AND DEPLOYMENT OF
ITS IN ROAD TRANSPORT 2014-2018
The basic objective of this part is to give an overview of planned development and
deployment of ITS in Croatia, in accordance with the National Programme for the
development and deployment of ITS in road transport 2014-2018 adopted at the
172nd session of the Croatian Government on 2nd. July 2014. The four main
strategic objectives are described: Road traffic safety and security, Improving the

Faculty of Transport and Traffic Sciences
Intelligent Transport Systems – Selected Lectures 20/115
efficiency of the road transport system, Sustainable mobility in cities and ITS industry
development. In accordance with the strategic objectives, five national priority areas
are defined, which are related to the European priority areas. The description of the
proposed measures necessary to ensure effective way to achieve the
aforementioned strategic objectives is given. The measures are defined within
individual European priority areas and particularly for national priority areas.
5.1. STRATEGIC GOALS OF ITS IMPLEMENTATION IN REPUBLIC OF CROATIA
In defining the strategic objectives of ITS deployment in the Republic of Croatia for
the period 2014-2018, the following was taken into account:
a) Needs for the systematic deployment of Intelligent transport systems, arising from
the characteristics of its road transport system, arising from the characteristics of its
road transport system, the needs for the Croatian economy and the strengthening of
the industrial sector in the technologies used in Intelligent transport systems,
b) Obligations towards the European Union, primarily in the area of cross-border
availability of road, traffic and travel data services to the European Union, primarily
for the neighboring Member States. In addition, special attention was paid to
facilitating cross-border electronic exchange of data between relevant government
agencies and stakeholders and relevant service providers ITS.
Within the framework of the National Programme for the development and
implementation of ITS in road transport 2014-2018 are forseen four (4) strategic
objectives:
Strategic Objective 1. - Road traffic safety and security
The National Road Traffic Safety Programme of the Republic of Croatia 2011-2020
has defined a vision of road traffic safety through a drastic reduction in mortalality
rate and serious traffic injuries, reducing the high cost of traffic accidents, improved
health and quality of life, and ensure a safe and sustainable mobility. As a
quantitative target for that period (2011-2018) it is planned to reduce the number of
deaths and injuries in road accidents by 50%. In this respect, following the policies

Faculty of Transport and Traffic Sciences
Intelligent Transport Systems – Selected Lectures 21/115
and appropriate guidelines of the European Union, one of the strategic objectives of
the National Programme for the development and deployment of ITS in road
transport 2014-2018 is to raise the level of road safety.
In recent years, and especially with the Croatian accession to the European Union,
the protection of participants in road traffic is becoming increasingly important .
Besides standard protection functions of users in road traffic and the protection of
critical road infrastructure, one of the priority measures of the ITS Directive is
providing the information services for safe and secure parking places for trucks and
commercial vehicles, as well as possibilities for the corresponding reservations.
Strategic Objective 2. - Improving the efficiency of the road transport system
In the introductory part of the National Programme it is shown that one of the
fundamental reasons for development of ITS in the European Union was observed
problem of efficiency of the road transport system. Systematic research in the field of
efficiency estimation of its road transport system was not done in the Republic of
Croatia, but it's to be assumed, that it is a lot less effective than in the rest of the
European Union. Some experts conclude that a significant part of the national
economy is lost in inefficiencies in the overall transport system. Past experiences
have shown that the use of well-known ITS measures in this area gives significant
results in improving the overall efficiency of the road transport system. In fact, with
the deployment of new ITS solutions through individual specific systems, applications
and services, we should strive for them to be effective and efficient.
Strategic Objective 3. - Sustainable mobility in cities
As part of this strategic objective are scheduled measures for the improvement of
public transport system which has the following positive effects:
- increase of attractiveness of public transport (eg. giving priority to public transport
vehicles in the city road network, advanced billing systems of transportation, etc.)
- managing transport demand (eg. system of congestion charging, charging for
passing through certain urban areas at certain time, etc..)

Faculty of Transport and Traffic Sciences
Intelligent Transport Systems – Selected Lectures 22/115
- reduce greenhouse gas emissions (eg. using more efficient traffic management in
cities).
This strategic objective is primarily intended for solving accumulated problems in
urban transport of major cities and specific problems of traffic in tourist destination.
Strategic Objective 4. - ITS industry development
One of the significant possibilities of development and deployment of ITS in the
Republic of Croatia is the encouragement of appropriate industrial sector (road
telematics systems, the software industry, electronics, etc..). This is one of the
fundamental objectives of the European Union in the field of ITS. On this basis it is
possible to create new jobs with high added value. The prerequisite for these
activities is to better connect the industry with research and development capabilities
of the Republic of Croatia (e.g. higher education institutions, institutes, R & D
companies, etc..).
Within the framework of the National Programme for the development and
deployment of ITS in road transport 2014-2018 are envisioned five (5) national
priority areas:
a) National Priority Area 1.: Road traffic safety management
b) National Priority Area 2.: Transport demand management and
multimodality
c) National Priority Area 3.: Traffic management in cities
d) National Priority Area 4.: Raising the level of transport services to support
the Croatian tourism
e) National Priority Area 5.: Improving maintenance of roads supported by ITS
applications
Relation of certain strategic objectives, national priority areas and European priority
areas (ITS Directive) are shown in Fig. I.3.

Faculty of Transport and Traffic Sciences
Intelligent Transport Systems – Selected Lectures 23/115
Fig. I.3 - National strategic objectives, national priority areas and their connection to
the EU priority areas
5.2. PROPOSAL OF MEASURES FOR THE DEPLOYMENT OF ITS
An integral part of the National Programme are appropriate measures, which ensure
more effective implementation of priority activities and some of the planned projects.
They were established on the basis of defined national strategic objectives and
European and national priority areas. At the time of their defining period, the
experience of the past development of ITS in Croatia, and some of the European
experience were used.
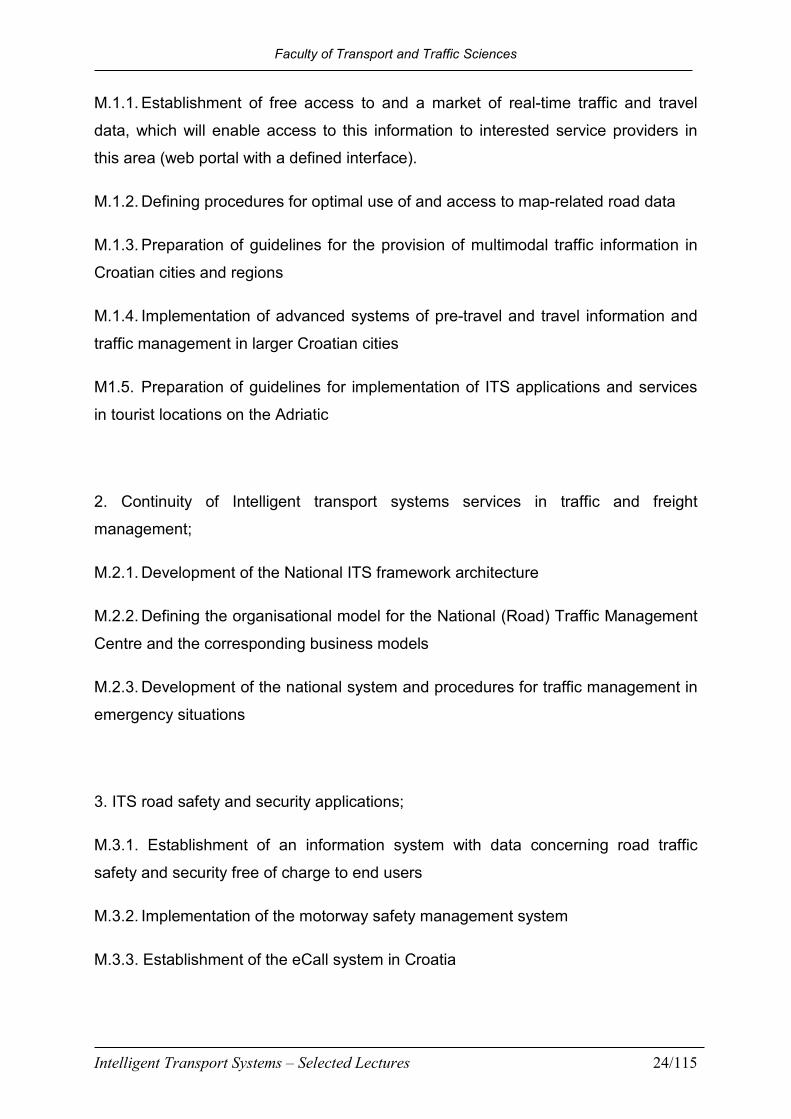
The following measures have been proposed within the priority areas:
1. Optimal use of road, traffic and travel data;
Faculty of Transport and Traffic Sciences
Intelligent Transport Systems – Selected Lectures 24/115
M.1.1. Establishment of free access to and a market of real-time traffic and travel
data, which will enable access to this information to interested service providers in
this area (web portal with a defined interface).
M.1.2. Defining procedures for optimal use of and access to map-related road data
M.1.3. Preparation of guidelines for the provision of multimodal traffic information in
Croatian cities and regions
M.1.4. Implementation of advanced systems of pre-travel and travel information and
traffic management in larger Croatian cities
M1.5. Preparation of guidelines for implementation of ITS applications and services
in tourist locations on the Adriatic
2. Continuity of Intelligent transport systems services in traffic and freight
management;
M.2.1. Development of the National ITS framework architecture
M.2.2. Defining the organisational model for the National (Road) Traffic Management
Centre and the corresponding business models
M.2.3. Development of the national system and procedures for traffic management in
emergency situations
3. ITS road safety and security applications;
M.3.1. Establishment of an information system with data concerning road traffic
safety and security free of charge to end users
M.3.2. Implementation of the motorway safety management system
M.3.3. Establishment of the eCall system in Croatia

Faculty of Transport and Traffic Sciences
Intelligent Transport Systems – Selected Lectures 25/115
M.3.4. Establishment of the system of information services for safe and secure
parking places for trucks and commercial vehicles and the corresponding
reservations system
M.3.5. Launching research projects from the field of road safety management
Research on the road safety local (national) characteristics.
M.3.6. Establishment of the National centre for operator training for traffic
management and traffic incident management
4. Linking the vehicle with the transport infrastructure
M.4.1. Launching of the national programme for the monitoring of application of
cooperative systems in road traffic in the European Union
M.4.2. Launching of research projects from the field of cooperative systems
5. National priority areas
M.5.1. Development of financing models for the establishment of particular ITS
solutions
M.5.2. Promotion of public-private partnership in the field of implementation of ITS
solutions in Croatia
M.5.3. Measures for stimulating the R&D sector in the field of ITS
M.5.4. Improvement of the road telematics equipment maintenance as an important
part of the ITS
M.5.5. Development of efficient lifelong learning in the field of ITS for different users
M.5.6. Strengthening the coordination between key stakeholders in the field of ITS
Faculty of Transport and Traffic Sciences
Intelligent Transport Systems – Selected Lectures 26/115
6. CONCLUSION
Term „Intelligent Transport Systems” has been introduced in transport and traffic
engineering during the 1990s, and can be defined as holistic, control, information and
communication upgrade to classical transport and traffic systems enabling significant
improvement in performance, traffic flow, efficiency of passenger and goods
transportation, safety and security of transport, reduction of pollution, etc. Quality of
implementation of Intelligent Transport System is primarily based on harmonization
and possible integration of individual solutions into integrated systems. Achievement
of that is related to design of the basic organization so called ITS Architecture and
definitions of the necessary standards by official organisations. Background for
Architecture and standardization development in modern society can be usually
found in legal documents of individual countries or international organizations.
The European Union created a legal framework for ITS development based on the
recognition of ITS advantages and need for an EU wide harmonized development.
First legal documents were related to specific solutions, but during the first years of
the 21st century, general legal acts for each mode of transport were prepared.
Adoption of legal document is, however, only the first step which is followed by
standards adoption and activities realisation in deadlines that need to be respected.
The legal document is often followed by Work plans or Communications dealing with
its implementation. According to the EU legislation, the main reasons for ITS
introduction are: improving safety, improving efficiency, reducing pollution and
enabling interoperability between different systems.
In order to achieve harmonization of transport system with the European Union
(which is one of the most important tasks), the Republic of Croatia should focus on
the development of optimal ITS architecture (Framework Architecture, Mandated
Architecture, Service Architecture). A possible solution is to take into consideration a
wider approach – regional ITS architecture, [15, 16]. New Transport Strategy of
Republic of Croatia is expected to be prepared soon and in the course of preparation
adequate inclusion of ITS, based on EU experience, should be required.
Faculty of Transport and Traffic Sciences
Intelligent Transport Systems – Selected Lectures 27/115
7. REFERENCES
[1] Bošnjak, I., Intelligent Transportation Systems 1., (in Croatian), Faculty of Traffic
Science, Zagreb, 2005.
[2] Mandžuka, S., Intelligent Transportation Systems 1., (in Croatian), Faculty of
Traffic Science, Lectures, Zagreb, 2010
[3] Horvat, B., Directives of the European Union in the field of ITS, (in Croatian), BSc
Thesis, Faculty of Traffic Science, Zagreb, 2011.
[4] Yokota, T., Weiland, R., ITS System Architectures For Developing Countries,
Technical Note 5, Transport and Urban Development Department, World Bank, 2005.
[5] http://www.frame-online.net – March, 2011 – Why you need an ITS Architecture
[6] The Intelligent transport systems (ITS) practioners' guide to Europe, RTI Focus,
London, 2011.
[7] Action Plan for the Deployment of Intelligent Transport Systems in Europe, COM
(2008) 886 final, 2008.
[8] Directive 2010/40/EU of the European parliament and of the Council of 7 July
2010 on the framework for the deployment of Intelligent Transport Systems in the
field of road transport and for interfaces with other modes of transport, Official
Journal of the European Union, 2010., L 207, 1 – 13.
[9] Communication from The Commission to The European Parliament and The
Council on the deployment of the European Rail Signalling System ERTMS/ETCS,
COM(2005) 298 final, 2005.
[10] Council Regulation (EC) No 219/2007 of 27 February 2007 on the establishment
of a Joint Undertaking to develop the new generation European air traffic
management system (SESAR), Official Journal of the European Union, 2007., L 64,
1.-10.
[11] Directive 2002/59/EC of The European parliament and of The Council of 27 June
2002 establishing a Community vessel traffic monitoring and information system and
repealing Council Directive 93/75/EEC, Official Journal of the European Union, 2002.,
L 208, 10 – 27
[12] Directive 2005/44/EC of The European Parliament and of The Council of 7
September 2005 on harmonised river information services (RIS) on inland waterways
in the Community, Official Journal of the European Union, 2005., L 255, 152. – 159.

Faculty of Transport and Traffic Sciences
Intelligent Transport Systems – Selected Lectures 28/115
[13] http://www.strategija.hr – April, 2011.
[14] Mandžuka, S., Intelligent Transportation System - Experiences in Republic of
Croatia, (in Croatian), ITS Workshop, Ministry of Sea, Transport and Infrastructure,
Zagreb, 2009.
[15] Bošnjak I., Mandžuka, S., Šimunović, Lj., Concept and Implementation of
regional ITS Architecture, (in Croatian), V. Croatian Road Congress, Cavtat, 2011.
[16] Mandžuka, S., Electronic Payment in Traffic and Transport - Challenges and
Perspectives of Regional Development, (in Croatian), 6th ITS Croatia Forum,
Zagreb, 2011.
[17] National Programme for the development and deployment of ITS in road
transport 2014-2018, (NN 82/2014), 2014.

Faculty of Transport and Traffic Sciences
Intelligent Transport Systems – Selected Lectures 29/115
II. ROAD WEATHER INFORMATION SYSTEM
1. INTRODUCTION
Road weather monitoring is essential for traffic because ambient conditions have
considerable influence on safety, functionality and efficiency of road traffic. Therefore,
the monitoring system has to be set-up on the elements that enable fast exchange of
information and good response. There are many scientific papers with examples that
prove the importance of meteorological information in the traffic. Road Weather
Information Systems are also very important part of Intelligent Transportation
Systems.
The Croatian roadways agency Hrvatske caste Ltd. (HC) installed a series of road
weather monitoring stations in the arterial road routes and in the Croatian regions
that have challenging winter conditions. Data on specific ambient conditions
measured at the stations is used to support scheduling and optimizing winter
maintenance activities and to enhance road safety. All weather data is automatically
collected at the Information Center of HC and is distributed to headquarters and
regional winter maintenance centers. The information on weather conditions on a
specific road route enables scheduling of maintenance actions to be taken to ensure
road safety and mobilization of winter maintenance operative forces, but also to
enable timely clearing of snow and de-icing chemicals spreading, issuing alert
information to the travelling public etc. The primary objective and purpose of the
project is to assist in winter maintenance operations. This implies the use of
pavement sensors at main and auxiliary weather monitoring stations, the collecting of
ambient data from the pavement, the development of prognostic software, the
interpretation adequate for the field-use and the incorporation of weather information
system in standard procedures of winter maintenance providers.
Faculty of Transport and Traffic Sciences
Intelligent Transport Systems – Selected Lectures 30/115
2. SYSTEM DESCRIPTION
Main road weather monitoring station collects general data on weather and pavement
condition continually. The data measured at selected micro-locations is as follows:
temperature, relative humidity of air and dew point temperature; wind speed and
direction; air pressure; quantity, intensity and type of precipitation; visibility; pavement
temperature; pavement condition, residual salt, ice point temperature etc.
Auxiliary road weather monitoring stations collects additional weather data continually
and reports them to variable message signs that display advisory messages on
challenging driving conditions to travelling public. The data measured at any micro-
location is as follows: air temperature; dew point temperature; relative humidity of air;
pavement surface temperature.
Central control centre consists of communication and application servers with an
Oracle data base, connected through the local Ethernet network. The application
server is in the network together with operator workstations – clients that use
installed user software to retrieve data from the Oracle database. Data on the
application server may be accessed by Local computer network, or modem / ISDN/
Web.
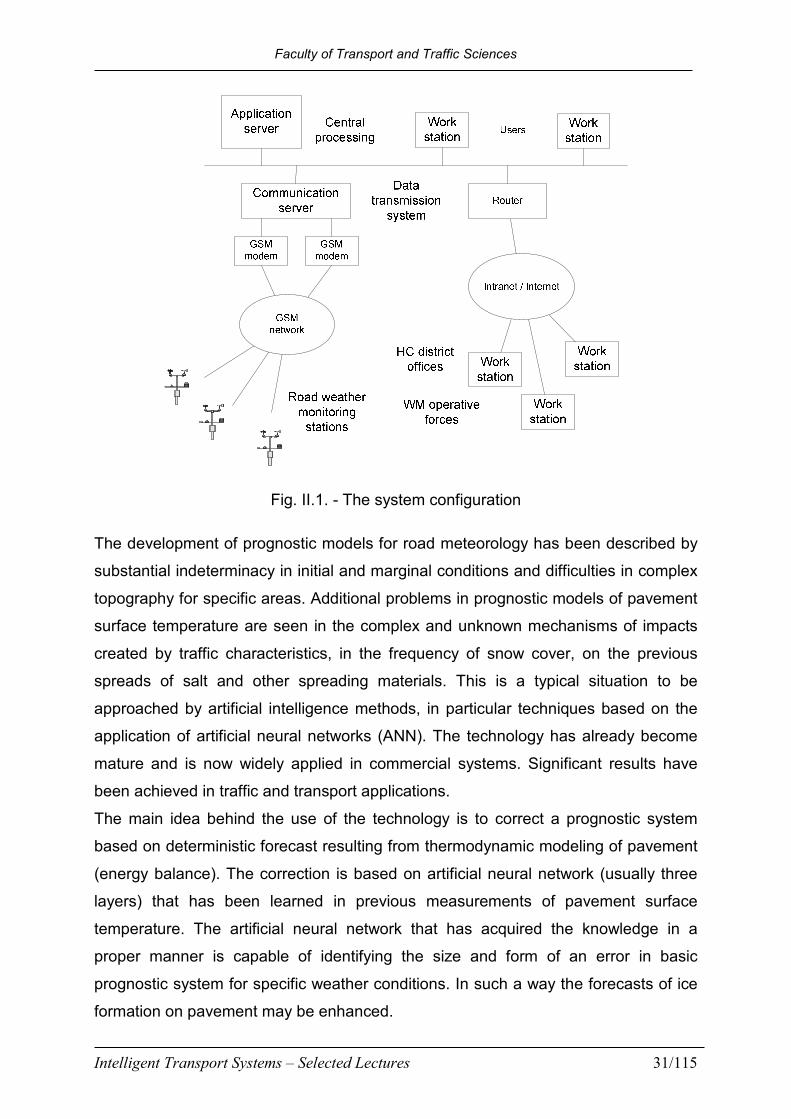
Configuration of the system has been designed at the dual interface of data and
communication servers with the large data quantities long-term storing system, as
shown in Fig. II.1.
Faculty of Transport and Traffic Sciences
Intelligent Transport Systems – Selected Lectures 31/115
Fig. II.1. - The system configuration
The development of prognostic models for road meteorology has been described by
substantial indeterminacy in initial and marginal conditions and difficulties in complex
topography for specific areas. Additional problems in prognostic models of pavement
surface temperature are seen in the complex and unknown mechanisms of impacts
created by traffic characteristics, in the frequency of snow cover, on the previous
spreads of salt and other spreading materials. This is a typical situation to be
approached by artificial intelligence methods, in particular techniques based on the
application of artificial neural networks (ANN). The technology has already become
mature and is now widely applied in commercial systems. Significant results have
been achieved in traffic and transport applications.
The main idea behind the use of the technology is to correct a prognostic system
based on deterministic forecast resulting from thermodynamic modeling of pavement
(energy balance). The correction is based on artificial neural network (usually three
layers) that has been learned in previous measurements of pavement surface
temperature. The artificial neural network that has acquired the knowledge in a
proper manner is capable of identifying the size and form of an error in basic
prognostic system for specific weather conditions. In such a way the forecasts of ice
formation on pavement may be enhanced.

Faculty of Transport and Traffic Sciences
Intelligent Transport Systems – Selected Lectures 32/115
3. SYSTEM SOFTWARE
The system software of the central information system includes a series of software
modules for processing of data collected from road weather monitoring stations,
meteorological data base with data surveyed, prognostic models, reports and display
of collected information to road users. The main components of the system software
are:
a) Software for data collection and data display:
1. communication drive software
2. software for polling of stations (universal polling for main and auxiliary
stations, VMS and additional panels) and collecting of real-time data in the
process base with transmission to Oracle base
3. data display software – browsers (clients) for unlimited number of users in
the local network and remote users
b) Control algorithms and decision models for control of variable message signs and
additional panels
c) Analysis of data obtained, incorporation of other sources of data (CNMHS) and
prognostic models for short-range forecasts (1-2 hours) of the road weather
conditions. The structure of system software is shown in Fig. II.2.
Auxiliary road weather monitoring stations and
VMS
Relational data base
Main road weather monitoring stations
Pro
cess
b
ase
Browsers clients
Reports
Control of VMS
Selector SelectorOption to export the base in ASCII data files
Polling of stations by GSM modem
Access to server data by local or WAN network
ASCII
LOG L.
DHMZ
Prognostic algorithms
Short-range forecasts
Fig. II.2. - System Software Structure

Faculty of Transport and Traffic Sciences
Intelligent Transport Systems – Selected Lectures 33/115
4. USER INTERFACE
Efficient user interface is an essential component of the system. The interface has to
be tailored to the specific user needs and it has to take into account actual
possibilities to interpret the weather data collected. Accordingly, the interpretation of
the data on roadway conditions and recommendations for activities to be taken are
quite simple in order to serve the needs of winter maintenance staff. The common
questions used in routine winter maintenance operations are summarize as:
1. Is there any ice on the pavement?
2. When will the ice formation start on the pavement?
3. Where has the ice been detected, at which sections?
4. What to do, which activities to take?
Road weather information system uses warnings and alerts and thermal maps of the
region to give response and information to assist the winter maintenance operations,
as follows:
Precipitation – warning:
- There was precipitation (rain, snow), ice formation possible - pavement temperature
close to or under 0ºC!
Frost – warning:
- Frost on pavement present or may appear!
Ice – warning:
- Ice will be formed in 1 to 2 hours!
Ice – alert
- Pavement temperature is under 0ºC, ice has begun to form!
Thermal maps of the area:
-Presentation of thermal colder and warmer sections, condition evaluation,
recommendations for decisions on salt spreading.

Faculty of Transport and Traffic Sciences
Intelligent Transport Systems – Selected Lectures 34/115
5. USE THE ARTIFICIAL NEURAL NETWORK FOR SHORT RANGE
FORECASTS
The development of prognostic models for road meteorology has been described by
substantial indeterminacy in initial and marginal conditions and difficulties in complex
topography for specific areas. Additional problems in prognostic models of pavement
surface temperature are seen in the complex and unknown mechanisms of impacts
created by traffic characteristics, in the frequency of snow cover, on the previous
spreads of salt and other spreading materials [8]. This is a typical situation to be
approached by artificial intelligence methods, in particular techniques based on the
application of artificial neural networks (ANN). The technology has already become
mature and is now widely applied in commercial systems. Significant results have
been achieved in traffic and transport applications [9].
The main idea behind the use of the technology is to correct a prognostic system
based on deterministic forecast resulting from thermodynamic modeling of pavement
(energy balance). The correction is based on artificial neural network (usually three
layers) that has been learned in previous measurements of pavement surface
temperature. The artificial neural network that has acquired the knowledge in a
proper manner is capable of identifying the size and form of an error in basic
prognostic system for specific weather conditions. In such a way the forecasts of ice
formation on pavement may be enhanced [8]. A simple solution model of forecast
corrections is based on static artificial neural network with dynamics added from
outside (Fig. II.3), [10].
Fig. II.3. - Simple ANN for pavement surface temperature forecast
STATIC
ANN
x1(k)
x1(k-1)
x2(k-1)
x2(k-2)
y(k)
y(k-1)
y(k-2)
y(k+1)
Faculty of Transport and Traffic Sciences
Intelligent Transport Systems – Selected Lectures 35/115
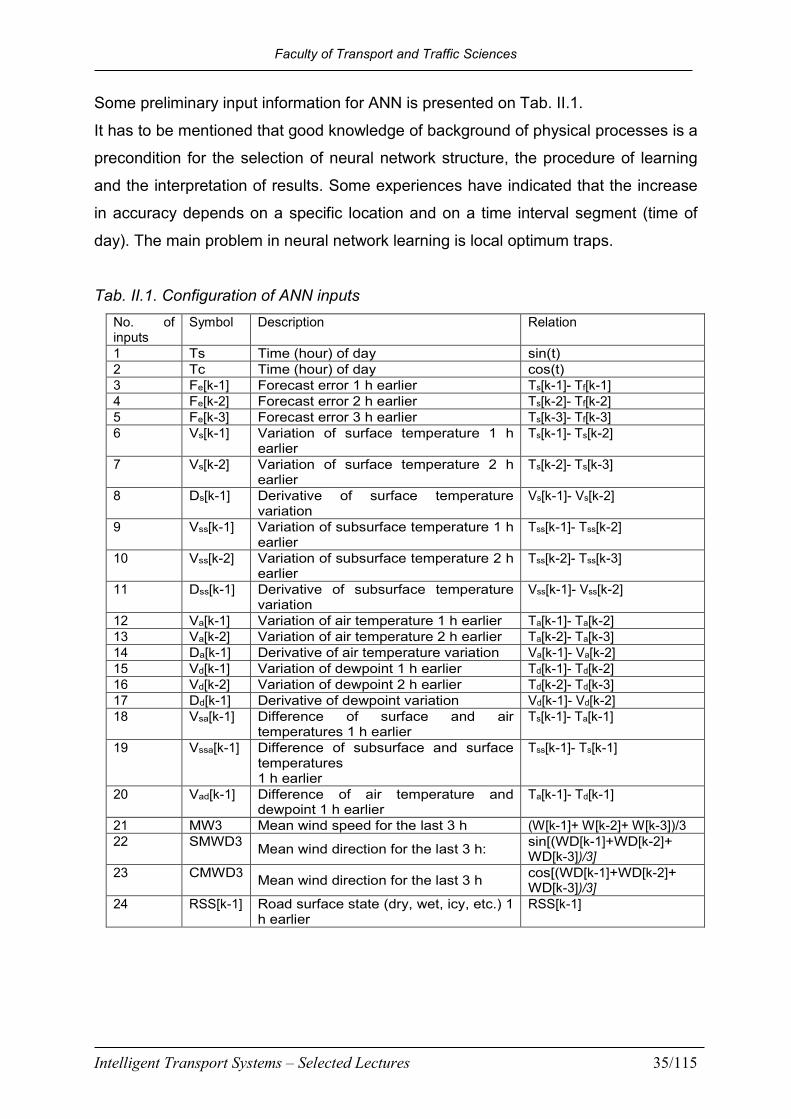
Some preliminary input information for ANN is presented on Tab. II.1.
It has to be mentioned that good knowledge of background of physical processes is a
precondition for the selection of neural network structure, the procedure of learning
and the interpretation of results. Some experiences have indicated that the increase
in accuracy depends on a specific location and on a time interval segment (time of
day). The main problem in neural network learning is local optimum traps.
Tab. II.1. Configuration of ANN inputs
No. of inputs
Symbol Description Relation
1 Ts Time (hour) of day sin(t) 2 Tc Time (hour) of day cos(t) 3 Fe[k-1] Forecast error 1 h earlier Ts[k-1]- Tf[k-1] 4 Fe[k-2] Forecast error 2 h earlier Ts[k-2]- Tf[k-2] 5 Fe[k-3] Forecast error 3 h earlier Ts[k-3]- Tf[k-3] 6 Vs[k-1] Variation of surface temperature 1 h
earlier Ts[k-1]- Ts[k-2]
7 Vs[k-2] Variation of surface temperature 2 h earlier
Ts[k-2]- Ts[k-3]
8 Ds[k-1] Derivative of surface temperature variation
Vs[k-1]- Vs[k-2]
9 Vss[k-1] Variation of subsurface temperature 1 h earlier
Tss[k-1]- Tss[k-2]
10 Vss[k-2] Variation of subsurface temperature 2 h earlier
Tss[k-2]- Tss[k-3]
11 Dss[k-1] Derivative of subsurface temperature variation
Vss[k-1]- Vss[k-2]
12 Va[k-1] Variation of air temperature 1 h earlier Ta[k-1]- Ta[k-2] 13 Va[k-2] Variation of air temperature 2 h earlier Ta[k-2]- Ta[k-3] 14 Da[k-1] Derivative of air temperature variation Va[k-1]- Va[k-2] 15 Vd[k-1] Variation of dewpoint 1 h earlier Td[k-1]- Td[k-2] 16 Vd[k-2] Variation of dewpoint 2 h earlier Td[k-2]- Td[k-3] 17 Dd[k-1] Derivative of dewpoint variation Vd[k-1]- Vd[k-2] 18 Vsa[k-1] Difference of surface and air
temperatures 1 h earlier Ts[k-1]- Ta[k-1]
19 Vssa[k-1] Difference of subsurface and surface temperatures 1 h earlier
Tss[k-1]- Ts[k-1]
20 Vad[k-1] Difference of air temperature and dewpoint 1 h earlier
Ta[k-1]- Td[k-1]
21 MW3 Mean wind speed for the last 3 h (W[k-1]+ W[k-2]+ W[k-3])/3 22 SMWD3
Mean wind direction for the last 3 h: sin[(WD[k-1]+WD[k-2]+ WD[k-3])/3]
23 CMWD3 Mean wind direction for the last 3 h
cos[(WD[k-1]+WD[k-2]+ WD[k-3])/3]
24 RSS[k-1] Road surface state (dry, wet, icy, etc.) 1 h earlier
RSS[k-1]

Faculty of Transport and Traffic Sciences
Intelligent Transport Systems – Selected Lectures 36/115
6. COOPERATIVE ROAD WEATHER MONITORING STATION
6.1. COOPERATIVE SYSTEMS IN TRAFFIC AND TRANSPORTATION
Cooperative Systems are important component of the intelligent transportation
system architecture. It enables a driver (or its vehicle) to communicate with roadside
equipment or other drivers (or their vehicles), [12]. As a result, this information can
help improve the road traffic safety and efficiency. The general architecture of
cooperative system network is presented on Fig. II.4.
DRIVER
ROADOPERATOR
SERVICE PROVIDER
ROAD ITS INFRASTRUCTURE
VOZAČDRIVER
VOZAČVEHICLEVEHICLE
DSRC
DSRC
DATAUSER
INTERNET
1
4
3
2
PEDESTRIAN DSRC
Fig.II.4 - General Concept of Cooperative Systems
Cooperative system networks are composed of mobile nodes, vehicles equipped with
On Board Units (OBU), and stationary nodes called Road Side Units (RSU) attached

Faculty of Transport and Traffic Sciences
Intelligent Transport Systems – Selected Lectures 37/115
to infrastructure that will be deployed along the roads. Also, there are some ideas for
movable pedestrian equipment, especially for Vulnerable Road User (VRU). Both
OBU and RSU devices have wireless/wired communications capabilities. OBUs
communicate with each other and with the RSUs in ad hoc manner. There are mainly
two types of communications scenarios in vehicular networks: Vehicle-to-Vehicle
(V2V) and Vehicle-to-RSU (V2R), [13, 14]. The RSUs can also communicate with
each other and with other networks like the internet by its users (service providers,
road operators, other traffic data users) as shown in Fig. II.4.
6.2 ROAD WEATHER MONITORING STATION
Road weather monitoring station consists of multiple sensors that collect data of
atmospheric conditions such as air temperature, visibility, air pressure, wind speed
and direction, relative air humidity, quantity and type of precipitation, Fig. II.5. Also
the station collects data of road conditions such as surface temperature, temperature
beneath the surface. Also it can detect a difference between dry, wet or ice covered
surface and it can measure water film thickness.
Fig. II.5. - Weather station block diagram
The central component of the weather station is the controller to which are sensors
connected. The main task of the controller is to collect data from the sensor, log the
data locally and send a data to the central weather server in regular intervals. For
connecting sensors there are several different ports available. These ports can be
configured as 2-wire RS485 or RS232 ports. There are also available ports for

Faculty of Transport and Traffic Sciences
Intelligent Transport Systems – Selected Lectures 38/115
connecting sensors with current output (4-20mA) and voltage output (0-5V). Whole
system can be powered from the local power grid but in the absence of the mains
power connection it can be powered from the batteries that are charged via solar
panels. In that case the controller is equipped with power monitoring board which
monitors several crucial parameters of the system such as battery voltage, charging
current, load current etc. If the batteries got over discharge the controller sends a
warning message to the central server and in that case the maintenance service can
react and change the discharged battery on the site. In order to the controller to send
the data to the server it must be equipped with some kind of communication module.
This communication module can be connected directly to dedicated local, in most
cases optical, network that is connected to the monitoring center. In the other cases
where local network is not available communication module could be a GSM/GPRS
(or faster 3G, LTE) module. In the last case if we have more than a few weather
stations and other smart traffic infrastructure we can have a dedicated short range
communication between them and in the end one of them (could be a weather
station, but it can be a separate dedicated device) has a direct connection to the
monitoring center.
In the beginning of the last section are listed weather and road conditions that can be
measured with this weather station. In the following section is going to be described
configuration and types of the sensors which are used to measure these conditions.
For measurement of these conditions will be described five different devices.
First device is for measurement of air temperature and relative humidity. For the air
temperature is usually used some kind of resistance temperature detectors with
positive (PTC) or negative temperature coefficient (NTC). Also there is available
some semiconductor type of temperature sensors, but they usually have a slightly
worse characteristics than the resistive types.
For the humidity in this case is used capacitive MEMS (microelectromechanical
system) sensor. Both of these sensors (temperature and humidity) are connected to
the electronics for attenuation and conditioning. Later on these prepared signals are
sent to AD converter and later prepared for the output. As mentioned the output can
be digital (RS485, RS232) or analog (current output, voltage output). Same
technology (MEMS) is used for air pressure sensor.
Wind speed and wind direction can be measured with electromechanical sensors
such as cup anemometer and wind wane or just with ultrasonic sensor. Cup
Faculty of Transport and Traffic Sciences
Intelligent Transport Systems – Selected Lectures 39/115
anemometer has a three or four cups that transform wind into rotation of the axle on
which end is mounted relative encoder. Depending on wind speed there is more or
less pulses for controller to count and there is connection between wind speed and
frequency of the pulses. Wind wane has a similar principle as cup anemometer but
instead of relative encoder it has absolute 5-bit gray code encoder. In this case
controller just need to readout the value of the absolute encoder. On the other hand
the ultrasonic sensor is more reliable in the winter conditions because there is no
moving parts which can froze in the low temperatures. It uses in the measurement
two pairs of ultrasonic transceivers: one for the x axis and another for the y axis.
Disadvantage of this kind of sensor is lower accuracy in the condition of extensive
precipitations.
Precipitation sensor can also be very simple like tipping bucket but also complicated
like Doppler radar. Tipping bucket is accurate way to measure rain but it cannot
recognize the difference between snow and rain. Also there is a problem with
freezing during the winter so it is not maintenance free. Doppler radar can recognize
snow from rain and there are fewer problems with the freezing during the winter but
in some condition on the road can sometime give a false measurement especially
when is mounted incorrectly.
The data from visibility sensor is crucial for detecting the road conditions because the
reduced visibility can produce all sorts of dangerous scenarios in traffic. Visibility
sensors are using a forward scattered light procedure for estimating visual range of
human eye. Sensor contains receiver and transmitter, usually an infrared diode and
photo transistor on the other side. The transmitter and receiver are not turned to each
other directly but they are turned for a certain angle in relation to horizontal line. After
the fog is formed in the front of the sensor reflected light beams from the transmitter
are detected by receiver. The amount of the reflected light beams is inversely
proportional to visibility measurements. The more beams are reflected the worse are
the road conditions. Usually the measurement range is 10 to 2000 meters [4] but
there is on the market products for measurements up to 35000 meters [5].
The road sensor is like the visibility sensor very important for measuring road
conditions. Also this sensor will be the theme of the future studies so here is going to
be explained some principles that are used for building prototype. The goal of the
research is to achieve the similar or better results than the sensors developed in the
past and improve the algorithms for detecting the road conditions. Road sensor can

Faculty of Transport and Traffic Sciences
Intelligent Transport Systems – Selected Lectures 40/115
be divided in two functional units. The first one is for temperature measurement. It
can have one or several temperature sensors: one for the surface temperature and
the others are for measurement of temperature beneath the surface. The
temperature beneath surface can be useful because it can be indicator when or how
long is going to be ice on the road. For example in conditions of low temperatures the
ice can form very quickly on the surface but is the temperature beneath surface is
over the freezing temperature it will melt faster when the outside temperature rises.
The temperature sensors and the measurement principle is the same as was
described for the air temperature sensor so additional explanations are not
necessary. Second functional unit are the modules for detecting road conditions. For
this purposes the sensor measures conductivity and capacity on the road surface.
With conductivity measurements the sensor can detect the liquids on the road
surface and detect a certain amounts of chemicals in the liquids. Capacity is
measured at two different frequencies f and f/2 and the data is used to improve the
results which sensor acquired with conductivity measurements. The goal with fusion
of this two sensors, temperature sensor and learning algorithms will be to detect road
conditions such as dry, wet, ice, black ice. Also it could be estimated water film
thickness and chemical concentration. In this first stage in the prototype will be
integrated micro radar for detection of water film thickness for comparing estimated
results with measured results.
6.3 ROAD WEATHER INFORMATION SET FOR DRIVER
Road weather information collected from weather station is sent to central data
acquisition server and the data is also stored locally at the weather station. Data on
the weather station is processed locally and information about possible bad weather
is sent to oncoming vehicles to avoid vehicles entering a bad weather area at high
speed or without winter equipment [15]. To make it possible to send data to the
vehicle weather station is equipped with some short range communication module.
Also the protocol between vehicles and infrastructure needs to be developed and
maybe the most important part is presentation of the data to driver. Communication
module will have separate section further in this paper so here is going to be
presented more about presentation of the collected data.

Faculty of Transport and Traffic Sciences
Intelligent Transport Systems – Selected Lectures 41/115
The goal is to present data to driver clearly and on time. There is two ways to present
data to driver. The first one is concise and simple and its task is to warn the driver
fastest way possible that driver can undertake necessary actions without
endangering the other members in traffic. Proposed appearance of the weather
warning icon is shown on the Fig. II.6.
Fig. II.6. - Proposal for weather warning icon, [15]
It is also possible to show some sort of text warning near the weather warning icon to
emphasize the type of weather and the distance to the bad weather area. The
warning could be presented on car console, near other informational icons, on screen
of the trip computer or on the head-up display (HUD). Also it can be implemented
some discrete sound indicators that will ensure that driver notices the weather
warning icon. The second type of presentation is extended. This type of presentation
presents full data from weather station. The driver can choose from the menu in the
car trip computer is going to be presented on the screen. After the driver notices
weather warning icon and see extended information about the weather can decide to
change a route or adapt to new weather conditions. Use case diagram for road
weather exchange information procedure is presented on Fig. II.7.

Faculty of Transport and Traffic Sciences
Intelligent Transport Systems – Selected Lectures 42/115
Fig. II.7. – Use case diagram
6.4 COMMUNICATION MODULE
As mentioned before weather station must have some sort of DSRC module for
communication with approaching vehicles. This DSRC network must meet some
requirements that are specific for the vehicular environments such as fast
reconnection, high interference environment, impact of weather conditions to range of
the network. For that purpose the IEEE 802.11 standard body made an addition to
existing 802.11 standards to meet these requirements. The full name of the new
standard is 802.11p WAVE (Wireless Access in Vehicular Environments) [17]. This
network is going to operate at 5.9GHz so for the foundation is taken IEEE 802.11a
because this standard already operates at 5GHz so there is small amount of changes
in the physical level of this standard. Another difference between these two
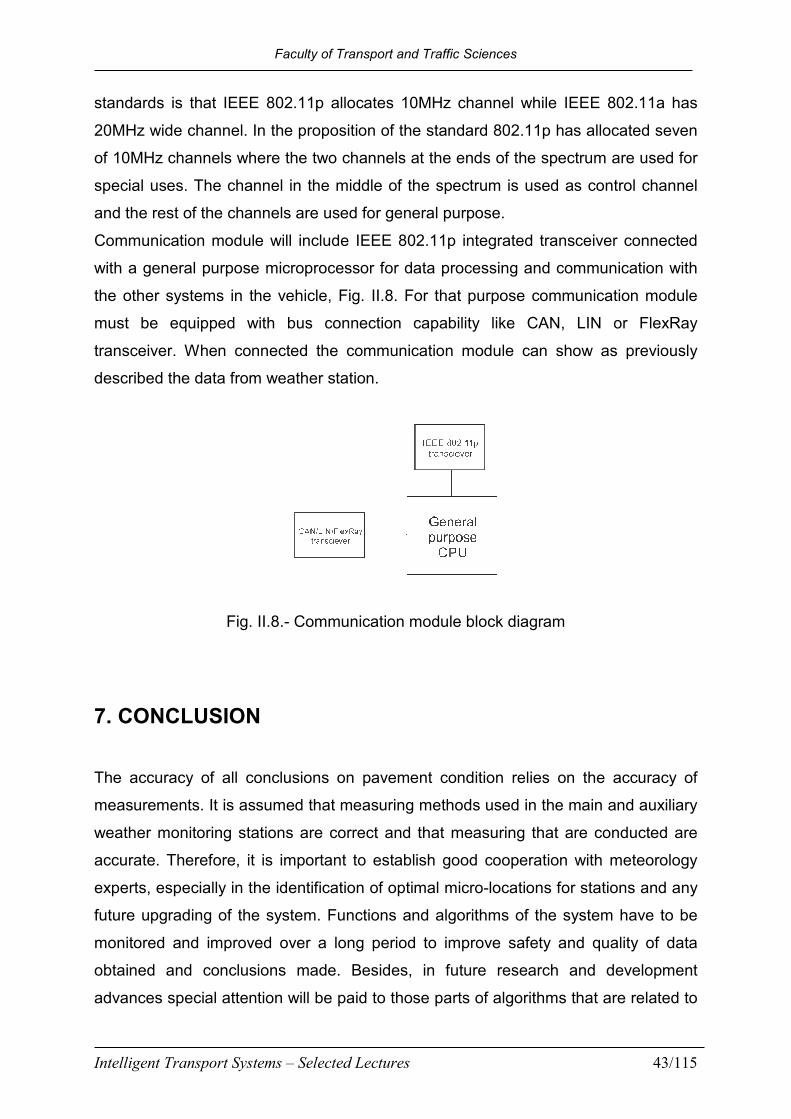
Faculty of Transport and Traffic Sciences
Intelligent Transport Systems – Selected Lectures 43/115
standards is that IEEE 802.11p allocates 10MHz channel while IEEE 802.11a has
20MHz wide channel. In the proposition of the standard 802.11p has allocated seven
of 10MHz channels where the two channels at the ends of the spectrum are used for
special uses. The channel in the middle of the spectrum is used as control channel
and the rest of the channels are used for general purpose.
Communication module will include IEEE 802.11p integrated transceiver connected
with a general purpose microprocessor for data processing and communication with
the other systems in the vehicle, Fig. II.8. For that purpose communication module
must be equipped with bus connection capability like CAN, LIN or FlexRay
transceiver. When connected the communication module can show as previously
described the data from weather station.
Fig. II.8.- Communication module block diagram
7. CONCLUSION
The accuracy of all conclusions on pavement condition relies on the accuracy of
measurements. It is assumed that measuring methods used in the main and auxiliary
weather monitoring stations are correct and that measuring that are conducted are
accurate. Therefore, it is important to establish good cooperation with meteorology
experts, especially in the identification of optimal micro-locations for stations and any
future upgrading of the system. Functions and algorithms of the system have to be
monitored and improved over a long period to improve safety and quality of data
obtained and conclusions made. Besides, in future research and development
advances special attention will be paid to those parts of algorithms that are related to

Faculty of Transport and Traffic Sciences
Intelligent Transport Systems – Selected Lectures 44/115
short-range prognosis of pavement surface temperature. This is of particular
relevance for contemporary use of Advanced Optimization Methods for Winter
Services Organization, [11].
New cooperative approach for Intelligent transport systems development provides
multiple opportunities in the development of new road weather equipments and
system. Various useful information can be generated and transmitted between the
roadside equipment and the vehicle. Many of today's complex pavement condition
systems in the vehicle can be significantly simplified by transfer selected information
from the road weather station to the vehicle. Significant research will be guided in the
area of information presentation problem to the driver in the vehicle. Here we expect
solutions from simple warnings to complex Advanced Driver Assistance Systems
(ADAS).
8. REFERENCES
[1] Žibrat, Z., Tomšić, D., The Application of Road Weather Information System (in
Croatian), Proceedings: Održavanja cesta 2006 – Zimska služba, Šibenik, 2006.
[2] Andrey, J., Knapper, C.K., Weather and Transportation in Canada. Department
of Geography Publication Series, no. 55., 2003.
[3] Brijs, T., Karlis, D., , Wets ,G., Studying the effect of weather conditions on daily
crash counts using a discrete time-series model, Accident Analysis &
Prevention, Volume 40, Issue 3, 2008
[4] Mandžuka, S., Golenić, V., Močibov, B., Accurate meteo-information as critical
elements of traffic safety (in Croatian), Proceedings: Medical, technical and
legal aspects of traffic safety, Croatian Academy of Science and Arts, Zagreb,
2009.
[5] Bošnjak I., Intelligent Transportation System 1 (in Croatian), Uneversity of
Zagreb, 2007.
[6] TEB – Elektronika d.o.o.: Hrvatske Ceste Ltd. Road Weather Information
System (in Croatian), Final Project, Zagreb, 2005.
[7] Golenić, V., Hrvatske Ceste Ltd. Road Weather Information System (in
Croatian), Proceedings, Održavanja cesta 2006 – Zimska služba, Šibenik, 2006.

Faculty of Transport and Traffic Sciences
Intelligent Transport Systems – Selected Lectures 45/115
[8] Shao, J., Improving Nowcasts of Road Surface Temperature by a
Backpropagation Neural Network, Weather and Forecasting, Volume 13, Issue
1, 1998.
[9] Mandžuka, S., Application of artificial intelligence in the Intelligent Transport
Systems (in Croatian), ITS forum, Zagreb 2007.
[10] Mandžuka, S., Application of artificial neural networks in intelligent telematics,
TEB Elektronika, Zagreb, 2010 (in Croatian)
[11] Mandžuka, S., Perković, A., Ivanković, B., The Use of Operations Research in
Optimization of Winter Services (in Croatian), Proceedings, Održavanja cesta
2009, Šibenik, 2009.
[12] Mandžuka, Sadko; Golenić, Vladimir; Gojić, Marko., LOW‐COST
COOPERATIVE ROAD WEATHER MONITORING STATION // ., Andorra :
PIARC, 2014. 222-222
[13] ICSI - Intelligent Cooperative Sensing for Improved Traffic Efficiency project,
http://www.ict-icsi.eu/
[14] Mäkinen, T., Schulze, M., Krajzewicz, D., Gaugel, T., Koskinen, S., (2011),
DRIVE C2X methodology framework, Version 1.0.
[15] -------, Operating Manual VS20-UMB Visibility Sensor, Luft
[16] -------, ROSA: User guide, Vaisala.
[17] Jiang D., Delgrossi, L., (2008), IEEE802.11p: Towards and international
standard for wireless access in vehicular Environments, Vehicular Technology
Conference, VTC Spring 2008.

Faculty of Transport and Traffic Sciences
Intelligent Transport Systems – Selected Lectures 46/115
III. PEDESTRIAN NAVIGATION
1. INTRODUCTION
It is necessary to ensure accessibility to the desired destination as well as freedom of
movement and stay at the desired location for all people, regardless of whether they
have some degree of disability or not. Accessibility is expressed in the degree to
which the environment is available to most people. In the transport context, it usually
means physical accessibility to transport means and facilities in open spaces, such
as station, stop, station platform, parking, pedestrian crossings, pedestrian island,
pedestrian square, street, path, park, playground, walking path, underpass,
overpass, stairs, etc. However, pedestrians walk in confined, unfamiliar areas, where
problems of finding a certain room in the stations exist, such as ticket-office, info
stand, restaurant, university rooms (classroom, Secretariat), hospitals, health centers
(physician's room), shopping centers, hotels (room number, floor, reception, lift,
tickets, etc.)
The main goal of navigating visually impaired people in urban areas is to determine
the position and reach the destination. For that purpose, the electronic positioning
systems (GNSS) integrated with GIS are used. Because of problems with satellite
navigation (the receiver must have a direct connection with the satellite), the
navigation of visually impaired people in enclosed spaces is limited and unreliable.
That is the reason why the local navigation is applied. In addition, some systems and
technologies can only exist in open spaces, and some only indoors. Systems and
technologies should be simple to use and maintain. In order to enable mutual
communication between the systems, it is necessary to ensure appropriate
communication protocol or standard.

Faculty of Transport and Traffic Sciences
Intelligent Transport Systems – Selected Lectures 47/115
2. NAVIGATION
The word navigation is derived from the Latin "navis" which means “ship“ and "agere"
which means "to move" [1]. Until the 20th century, the concept of navigation is mainly
used in maritime affairs, as a term for keeping ships at sea. Today the term is used or
the purpose of guiding an entity towards a goal in other types of transport (on land
indoors and outdoors, in air and water transport). The term "navigation" means
directing the user towards its ultimate destination, i.e. finding a way in a potentially
unknown environment. Exact object positioning and orientation are particularly
important for navigation. For accurate positioning of pedestrians, various techniques
(GPS, Assisted GPS, a variety of Wi-Fi technology, LBS) are used. Showing the
position on the map is called mapping. Only when a place where a person is located
is known, messages and various instructions can be sent to that person. The
algorithm for routing users to the main destination is the main task of navigation.
Orientation is the correct understanding and experience of spatial relations between
one’s own position and relevant points in the environment.
3. OUTDOOR POSITIONING SYSTEM
3.1. TRADITIONAL NAVIGATION
In traditional navigation dead reckoning and piloting are used. When piloting, the
current position is calculated using the horizontal angle between the object and the
known reference point.
With dead reckoning (the actual computation), positions are calculated at each point
of the movement or just at a few. It is the process of determining the position in
relation to a known starting position, which must be known.
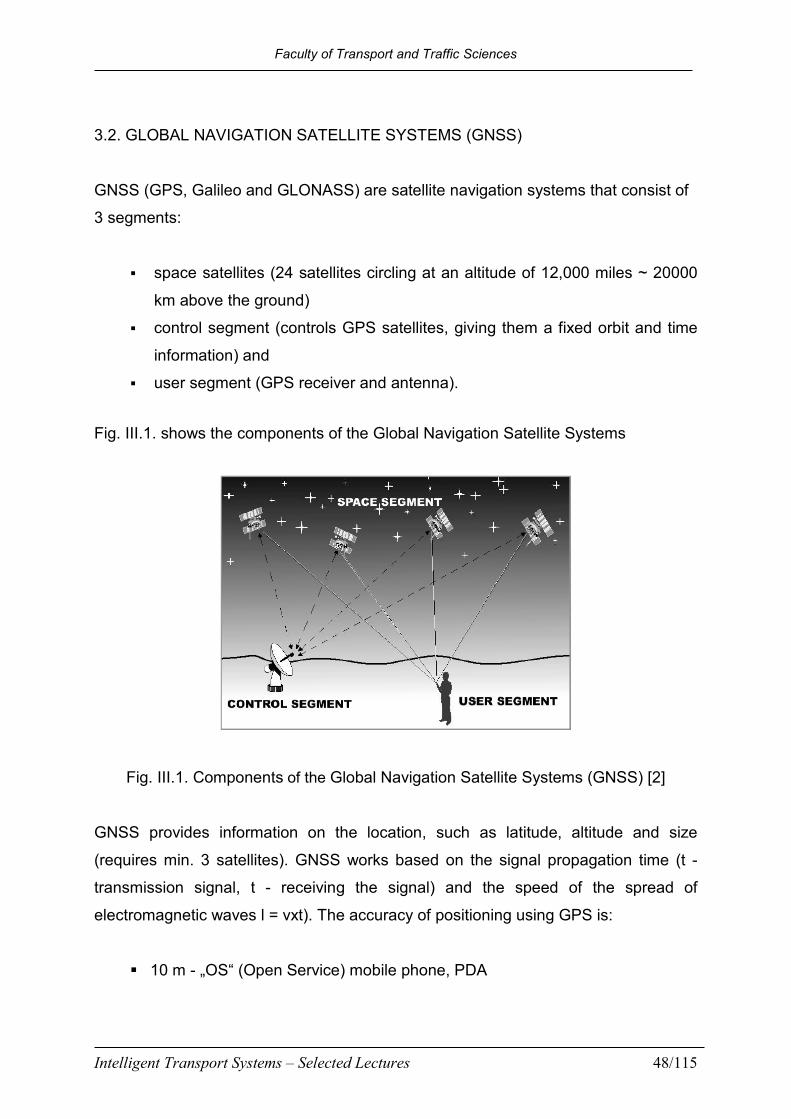
Faculty of Transport and Traffic Sciences
Intelligent Transport Systems – Selected Lectures 48/115
3.2. GLOBAL NAVIGATION SATELLITE SYSTEMS (GNSS)
GNSS (GPS, Galileo and GLONASS) are satellite navigation systems that consist of
3 segments:
� space satellites (24 satellites circling at an altitude of 12,000 miles ~ 20000
km above the ground)
� control segment (controls GPS satellites, giving them a fixed orbit and time
information) and
� user segment (GPS receiver and antenna).
Fig. III.1. shows the components of the Global Navigation Satellite Systems
Fig. III.1. Components of the Global Navigation Satellite Systems (GNSS) [2]
GNSS provides information on the location, such as latitude, altitude and size
(requires min. 3 satellites). GNSS works based on the signal propagation time (t -
transmission signal, t - receiving the signal) and the speed of the spread of
electromagnetic waves l = vxt). The accuracy of positioning using GPS is:
� 10 m - „OS“ (Open Service) mobile phone, PDA
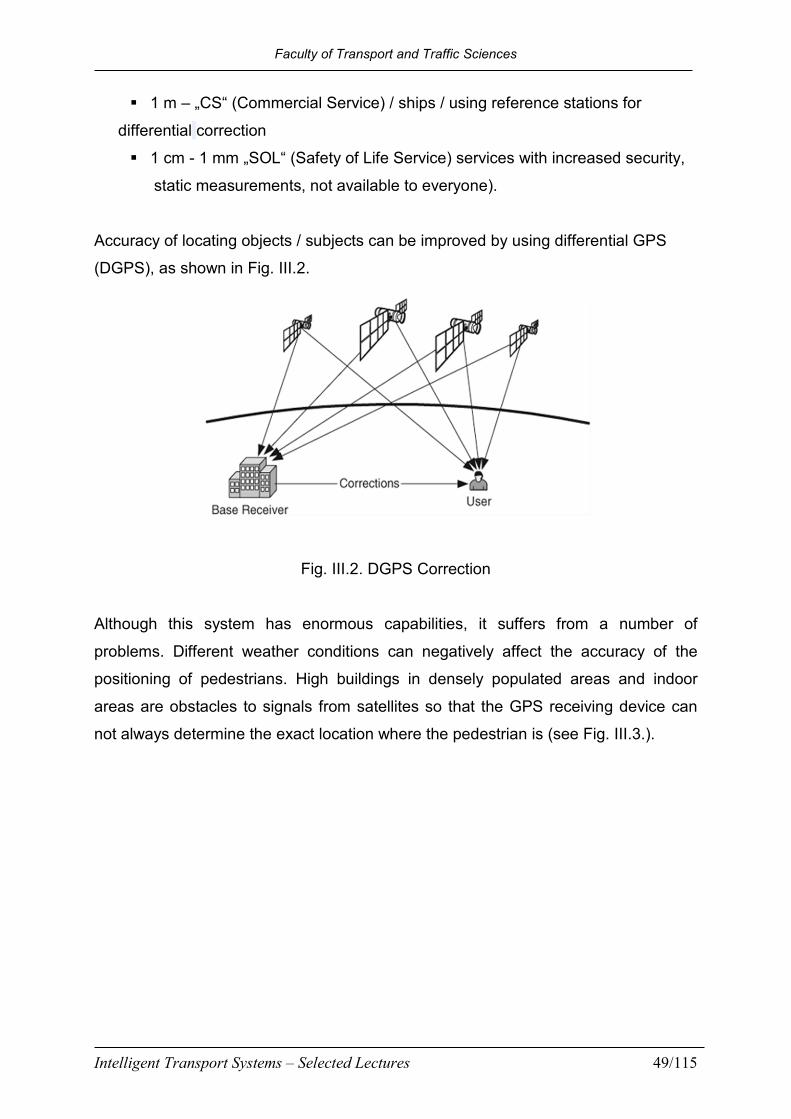
Faculty of Transport and Traffic Sciences
Intelligent Transport Systems – Selected Lectures 49/115
� 1 m – „CS“ (Commercial Service) / ships / using reference stations for
differential correction
� 1 cm - 1 mm „SOL“ (Safety of Life Service) services with increased security,
static measurements, not available to everyone).
Accuracy of locating objects / subjects can be improved by using differential GPS
(DGPS), as shown in Fig. III.2.
Fig. III.2. DGPS Correction
Although this system has enormous capabilities, it suffers from a number of
problems. Different weather conditions can negatively affect the accuracy of the
positioning of pedestrians. High buildings in densely populated areas and indoor
areas are obstacles to signals from satellites so that the GPS receiving device can
not always determine the exact location where the pedestrian is (see Fig. III.3.).

Faculty of Transport and Traffic Sciences
Intelligent Transport Systems – Selected Lectures 50/115
Fig. III.3. - Sources of GPS signal errors
Due to these reasons, GPS technologies are suitable for positioning outdoors, while
the problem indoors can be solved by cell phone location technologies and other
technologies by local navigation.
The successful application of GPS technology for positioning and monitoring the
movement of pedestrians on a particular network or area is significantly improved by
the use of GIS technology (Geographic Information System). Connecting GPS and
GIS technologies into a single system provides the tracking of mobile objects /
subjects in real time and displays the exact position of objects / subjects at the
appropriate geographical map. The idea of the application of global positioning
satellite and navigation of pedestrians is not new and it is now extensively used in
developed countries. The interaction of pedestrians with this system begins by
defining the destination. If the destination address is unknown, the system requires
for it to be entered. Based on the known map, the path between two points is given.
GIS tools can generate a walking path with respect to the shortest route, the safest
way, comfort, or a preferred route can be insisted on (based on the preferences
selected by the user: walking through the countryside, along the river, on better
streets, beautiful facades, etc.). Avoiding certain locations is dictated by the needs of
users (go to the store, stop by at a friend's place). After the recognition of the
destination, the pedestrian hears the proposed plan and, if it is acceptable, a
sequence of navigation and travel begins, as shown in Fig. III.4., [3].

Faculty of Transport and Traffic Sciences
Intelligent Transport Systems – Selected Lectures 51/115
Fig. III.4. Graphical interface for pedestrian navigation
3.3. CELL PHONE LOCATION TECHNOLOGIES
Cell phone location technologies are techniques for positioning of a cell phone or a
pedestrian using radio network and additional features of cell apparatus. The
operator knows the exact position of each base station and the size of the
surrounding cells. When a cell phone is switched on, it sends an identification code to
a base station, which enables the operator to determine the cell in which it is located.
Position accuracy depends on the size of the cells and it is at least c2 / 2 at the time
of entry of cell units in the area of base station b2. Accurate position, that is the
distance of a d2 cell phone, can be determined based on the speed and the time
needed to get the signal from base station b2 to the cell phone. More precise position
of a cell phone can be calculated by combining the time of arrival of signals from
base stations b1, b2 and b3 to the cell phone, which will improve the precision of
locating cell phones. This positioning technique is applicable both indoors and
outdoors. Fig. III.5. presents positioning using cell phone technique [4].

Faculty of Transport and Traffic Sciences
Intelligent Transport Systems – Selected Lectures 52/115
Fig. III.5. - Cell phone technique positioning
4. INDOOR POSITIONING SYSTEM
For indoor positioning mainly two groups of techniques are used. PVA group uses a
dead reckoning technique (DR and allows the mobile system to calculate its position
without the use of external information sources). Another group requires that the
space in which a visually impaired person walks is equipped with additional
hardware:
� Internal GPS (pseudo-satellite)
� Ultrasound sensor
� Infrared transmitter and receiver
Pseudo-satellite is installed on the ground and sends synchronized signals, as well
as a satellite from space. Based on the knowledge of the exact position of a pseudo-
satellite, it is possible with standard GPS receiver to determine the precise position of
pedestrians in places where it is difficult to receive signals from GPS satellites.
Pedestrian positioning accuracy can be increased depending on the number of
pseudo-satellites (Fig. III.6.). This technology is very expensive [5].

Faculty of Transport and Traffic Sciences
Intelligent Transport Systems – Selected Lectures 53/115
Fig. III.6. - Pedestrian positioning using GPS pseudo-satellites
4.1. INFRARED TECHNOLOGY FOR INTERNAL NAVIGATION
Infrared transmitters are installed at key locations and continuously transmit signals
from base stations. When a user enters the area of mobile communication, the
device is activated (vibrating or sound signals given). By pressing the appropriate
button, the speaker is activated and the user gets the information that lead him
towards the destination (Fig. III.7.).
Fig. III.7. - Establishment of communication between transmitter and user

Faculty of Transport and Traffic Sciences
Intelligent Transport Systems – Selected Lectures 54/115
Infrared transmitters send signals of a certain level, which are shaped like a cone.
That means that the area of availability is discrete, as well as receiving of the
information. The user searches the area by the receiver and intercepts the
transmitted beam. When the receiver catches the beam, it appears as a voice
message. As long as the user hears the message, he knows he is moving towards
the adequate location. Cone beam becomes smaller and ends in a point which brings
the user exactly at the desired destination (see Fig. III.8.) [6].
Fig. III.8. - Infrared technology for internal navigation
These devices can operate independently (stand-alone devices) and in that case all
transmitted information on the location / object are stored on the microchip (position
and other relevant data). They can also operate in integration with the central server
and can get more information in the interactive way, upon request.
4.2. ULTRASONIC SENSORS
Ultrasonic sensors are used for an autonomous indoor navigation system, and their
purpose is to avoid collision with movable and immovable objects. When a
transmitted signal encounters an obstacle, it is reflected back to the sonar, which is
converted into a sound that the human ear can detect. The human brain recognizes a
variety of tones and gets an idea of the environment ahead, i.e. creates a “mental

Faculty of Transport and Traffic Sciences
Intelligent Transport Systems – Selected Lectures 55/115
map” of the buildings ahead. In that way it detects an obstacle on the road and the
distance to it. The user with a white cane must come in direct contact with the object
in front of him, while the ultrasonic device covers a larger area ahead. Using
ultrasonic sensors increases confidence and reduces stress from the sudden contact
with an unknown object. Fig. III.9. shows an ultrasonic sensor.
Fig. III.9. - Ultrasonic sensor
4.3. RADIO-FREQUENCY IDENTIFICATION (RFID)
RFID is a wireless identification technology which exchanges data via radio waves. It
consists of the following components:
� Transponder /Tag/ consists of an antenna and a microchip that contains
information about the object that is identified.
� Reader is used to read data from the tag. They usually transmit low power
radio signals on tags. Tags then reflect the energy / information (their identity
and other relevant information) back to the reader, which now acts as a
receiver. Reader captures the information that came from the tag, decodes
and submits them to the host computer for further processing.
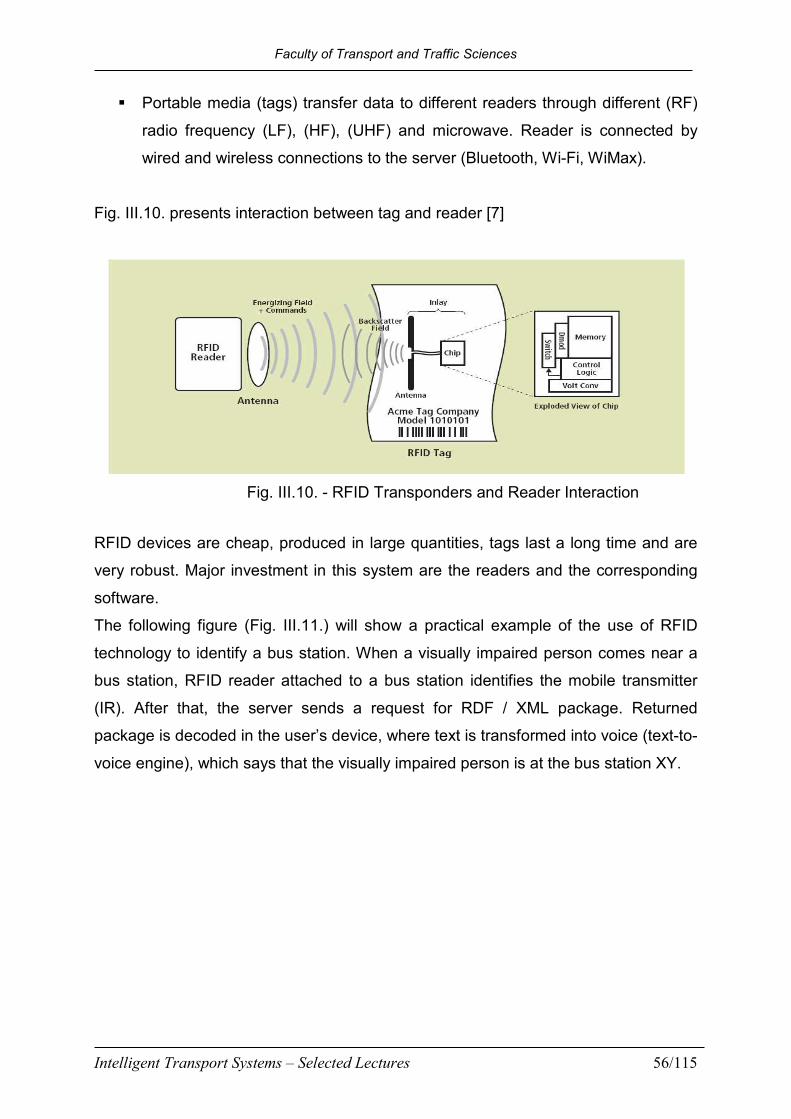
Faculty of Transport and Traffic Sciences
Intelligent Transport Systems – Selected Lectures 56/115
� Portable media (tags) transfer data to different readers through different (RF)
radio frequency (LF), (HF), (UHF) and microwave. Reader is connected by
wired and wireless connections to the server (Bluetooth, Wi-Fi, WiMax).
Fig. III.10. presents interaction between tag and reader [7]
Fig. III.10. - RFID Transponders and Reader Interaction
RFID devices are cheap, produced in large quantities, tags last a long time and are
very robust. Major investment in this system are the readers and the corresponding
software.
The following figure (Fig. III.11.) will show a practical example of the use of RFID
technology to identify a bus station. When a visually impaired person comes near a
bus station, RFID reader attached to a bus station identifies the mobile transmitter
(IR). After that, the server sends a request for RDF / XML package. Returned
package is decoded in the user’s device, where text is transformed into voice (text-to-
voice engine), which says that the visually impaired person is at the bus station XY.

Faculty of Transport and Traffic Sciences
Intelligent Transport Systems – Selected Lectures 57/115
Fig. III.11. - Identification of a bus station using RFID
Integration of different sensors applied for the navigation of blind people is shown in
Fig. III.12. When a pedestrian passes a checkpoint, the reader denotes a passing
pedestrian and forwards the information to the headquarters in real time. Feedback is
given to the pedestrian in the form of voice messages. The role of server in this
system is to manage dialogues with the voice as an XML language.
Fig. III.12. Pedestrian navigation using RFID technology and IR sensors
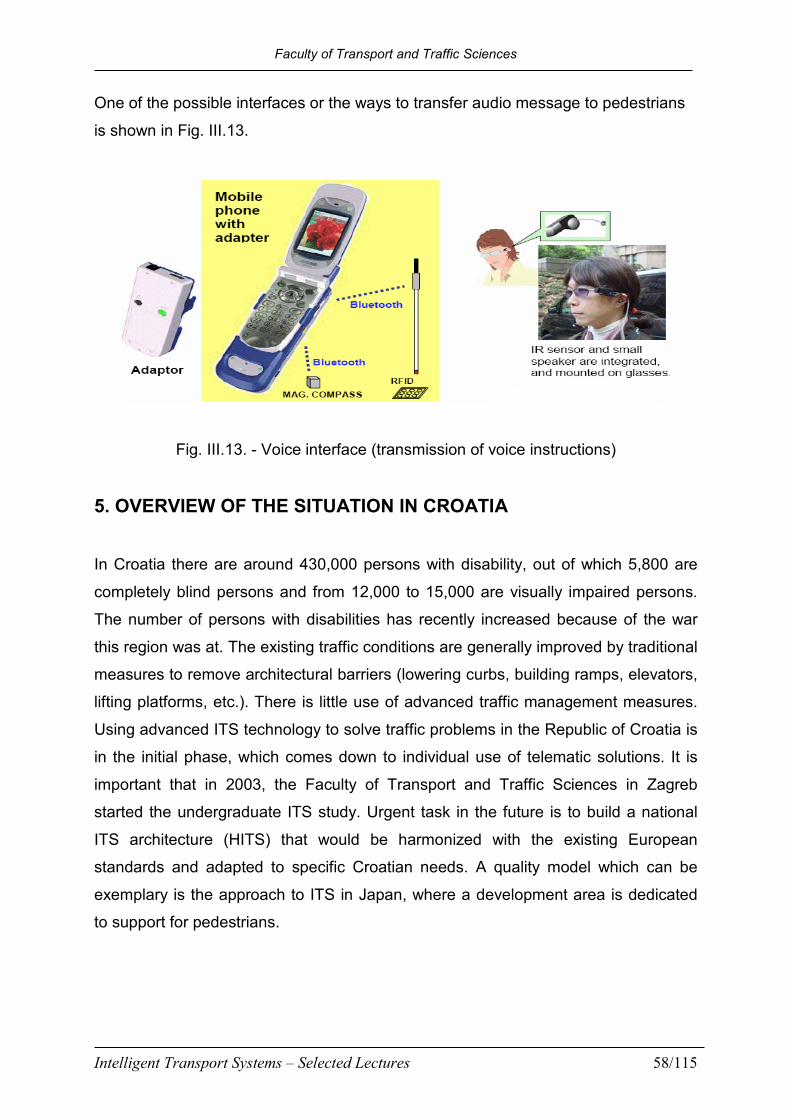
Faculty of Transport and Traffic Sciences
Intelligent Transport Systems – Selected Lectures 58/115
One of the possible interfaces or the ways to transfer audio message to pedestrians
is shown in Fig. III.13.
Fig. III.13. - Voice interface (transmission of voice instructions)
5. OVERVIEW OF THE SITUATION IN CROATIA
In Croatia there are around 430,000 persons with disability, out of which 5,800 are
completely blind persons and from 12,000 to 15,000 are visually impaired persons.
The number of persons with disabilities has recently increased because of the war
this region was at. The existing traffic conditions are generally improved by traditional
measures to remove architectural barriers (lowering curbs, building ramps, elevators,
lifting platforms, etc.). There is little use of advanced traffic management measures.
Using advanced ITS technology to solve traffic problems in the Republic of Croatia is
in the initial phase, which comes down to individual use of telematic solutions. It is
important that in 2003, the Faculty of Transport and Traffic Sciences in Zagreb
started the undergraduate ITS study. Urgent task in the future is to build a national
ITS architecture (HITS) that would be harmonized with the existing European
standards and adapted to specific Croatian needs. A quality model which can be
exemplary is the approach to ITS in Japan, where a development area is dedicated
to support for pedestrians.

Faculty of Transport and Traffic Sciences
Intelligent Transport Systems – Selected Lectures 59/115
7. CONCLUSION
The pedestrian traffic used almost all design measures for the increase of mobility
and accessibility for persons with disabilities: curb lowering, curb extension, reducing
the turn radius for vehicles, traffic calming measures, the construction of tactile paths
for the navigation of blind persons, etc. As a result, attention is focused on traffic
control with the help of ITS upgrades. World experience has confirmed that the
integration of ITS can significantly improve mobility and safety of blind people, and
thus allow them the execution of basic human rights, which include movement and
access to all facilities.
Using services provided by Intelligent Transport Systems for traffic and transport,
alleviates shortcomings and reduces discrimination against people with disabilities. It
is therefore very important that when building the future architecture of ITS in the
Republic of Croatia (HITS), special attention is given to pedestrian traffic. In addition,
high-quality model can be accessed in the ITS in Japan, where a development area
is dedicated to support for pedestrians.
7. LITERATURE:
[1] Johansen, J.: History of navigation, stand 2001.
http://pip.dknet.dk/~janj/navigation.html
[2] GARMIN, Gps guide for beginners, stand 2001.
http://www.garmin.com/manuals/gps4beg.pdf.
[3] Šimunović, Lj., Bošnjak, I., Mandžuka, S.: Intelligent transport systems and
pedestrian traffic, Promet - Traffic – Traffico, Vol 21, 2009., pp. 141-152
[4] Mannesmann Mobilfunk. Standortbestimmung Mobiltelefonen im D2-Netz,
2001.http://www.d2vodafone.de/askd2/D2-Netz/Telefonieren_im_D2-
Netz/Ortsbestimmung_im_D2-Netz/ o_im_d2-netz.html.rtsbestimmung
[5] O’Keefe, K., Sharma, J., Cannon, M.E.: and Lachapelle, G.: Pseudolite-based
inverted gps concept for local area positioning. In Proceedings of GPS99 (Session
D4, Nashville, 14-17 September), 1999.

Faculty of Transport and Traffic Sciences
Intelligent Transport Systems – Selected Lectures 60/115
[6] Marston, J. R.:Towards an Accessible City: Empirical Measurement and
Modeling of Access to Urban Opportunities for those with Vision Impairments, Using
Remote Infrared Audible Signage, University of California, Santa Barbara, September
2002
[7] Macalanda, E. C.: Radio Frequency Identification (RFID) for Naval Medical
Treatment Facilities (MTF) Monterey, California, September, 2006.
[7] Bošnjak, I.: Intelligent Transportation Systems 1, University of Zagreb, Faculty of
Transport and Traffic Sciences, Vukelićeva 4, Zagreb (in Croatian)
[8] Bošnjak, I., Mandžuka, S., Šimunović Lj.: Possibilities of Intelligent transport
systems to improve traffic safety, Proceedings: Incidents and traffic accidents and
measures for their prevention, pp. 12-20, Croatian Academy of Sciences and Arts,
Zagreb 2007. (in Croatian)
[9] Šimunović, Lj., Mandžuka, S., Missoni, E.: Contribution of ITS to Road
Transport and Traffic Safety, 13th International Conference on Transport Science,
ICTS 2010, Transport, Maritime and Logistics Science, Portorož, 2010.
[10] Wayfinding in the Built Environment, Research Project 2002-053-C, Brisbane,
Australia, July 2004
[11] Gartner, G., Frank, A. and Retscher, G.: "Pedestrian Navigation System in
Mixed Indoor/Outdoor Environment - The Navio Project", CORP 2004

Faculty of Transport and Traffic Sciences
Intelligent Transport Systems – Selected Lectures 61/115
IV. MOBILE COMMUNICATION AND TRAFFIC INCIDENT
MANAGEMENT PROCESS
1. INTRODUCTION
Everyday life in most cities of the world is becoming more dynamic. Growing needs of
the population of urban areas are realized through continued increase in mobility and
requirements for quality and travel safety. Urban and transportation planners are
faced with many demands on the one hand and infrastructure constraints on the
other hand. Increased mobility adversely affects the environment and the climate,
human health, quality of life, social conditions and safety aspects of people and the
wider society. We do not and cannot give up mobility, so we look for answers that
introduce innovative, sustainable and energy efficient solutions that will contribute to
the quality of life of citizens. Increased mobility has resulted in a significant increase
in road traffic incidents and the induced damages and costs, [1].
An “incident” is defined as any non-recurring event that causes a reduction of
roadway capacity or an abnormal increase in demand. Such events include traffic
crashes, disabled vehicles, spilled cargo, highway maintenance and reconstruction
projects, and special non-emergency events (e.g., ball games, concerts, or any other
event that significantly affects roadway operations). Although the problems most
often associated with highway incidents consequence is traveler delay, by far the
most serious problem is the risk of secondary crashes. Another related issue is the
danger posed by incidents to response personnel serving the public at the scene.
Other secondary effects of incidents include:
· Increased response time by police, fire, and emergency medical services
· Lost time and a reduction in productivity
· Increased cost of goods and services
· Increased fuel consumption
· Reduced air quality and other adverse environmental impacts

Faculty of Transport and Traffic Sciences
Intelligent Transport Systems – Selected Lectures 62/115
· Increased vehicle maintenance costs
· Reduced quality of life
· Negative public image of public agencies involved in incident management
activities, [2].
Road traffic incident management is a functional part of the holistic approach to
solving traffic problems known under the term Intelligent Transportation System –
ITS. The advanced development of communication and navigation technologies and
their implementation in various phases of incident management can significantly
reduce the consequences of incident event such as congestion, delay, pollution and
especially dangerous secondary incidents [3].
Real-time incident management in traffic comprises coordination activities
undertaken by several actors in order to reduce the negative impact, i.e. recovery of
the traffic flow to the conditions of normal flow. One of the basic problems in incident
management is the warning of other participants in traffic, as well as effective
coordination of various organizations, i.e. services included in this process [4, 5].
Besides, incident management comprises also legal regulations which require careful
planning of all segments. The success of the incident management lies in careful
development of clear (and efficient) instructions and procedures, which are
acceptable and understandable for all the involved services, organizations and
individuals. One of the important conditions to achieve this is high-quality
communications among the participants, i.e. information transparency and real-time
data flow. Absence of such an approach which combines cooperation,
communication and training, represent one of the main reasons of inefficient incident
management process, today [6, 7].
The critical point in the traffic incident management chain is the procedure after
detecting the incident and the appropriate verification thereof. It is the process of
informing other participants in road traffic (special importance are the motorists) by
using different technologies. Motorist information involves activating various means of
disseminating incident-related information to affected motorists. Media used to
disseminate motorist information include the following:
1. Commercial radio broadcasts

Faculty of Transport and Traffic Sciences
Intelligent Transport Systems – Selected Lectures 63/115
2. Highway advisory radio (HAR)
3. Variable message signs (VMS)
4. Telephone information systems
5. In-vehicle or personal data assistant information or route guidance systems
6. Commercial and public television traffic reports
7. Internet/on-line services
8. A variety of dissemination mechanisms provided by information service
providers
Motorist information needs to be disseminated as soon as possible, and beyond the
time it takes clear an incident. In fact, it should be disseminated until traffic flow is
returned to normal conditions. This may take hours if an incident occurs during a
peak period, and has regional impacts, [2]. Recently, the increasing importance has
mobile (wireless) communications and their associated technologies and services.
The development of wireless communications systems and their application in
everyday life of citizens have enabled the use of mobile communications technology
in urban processes, and opened the possibility of entirely new solutions that until now
could not be realized. This new, technologically advanced solutions based on mobile
communications systems have opened new possibilities in the creation of an urban
and traffic policy, which should serve the increasing population needs to ensure their
mobility, accessibility, efficiency, rationality of energy and environmental
conservation.
The penetration of mobile communications is growing rapidly levels of 90% coverage
are no longer exceptions, [8]. Telecom operators, due to competition and saturation,
are offering new services and focus on differentiation through value-added services.
The paper provides the description of one such technology, known as the Cell
Broadcasting. In the second section a general model of Traffic Incident Management
System is described. In particular, the importance of timely information about traffic
incidents is pointed. The problem of traffic congestion caused by the incident is
described. Some features of the Cell Broadcasting technology and some systemic
functions are described in the third section. The basic features of its architecture and
a description of some specific interfaces are given. In the fourth section, several
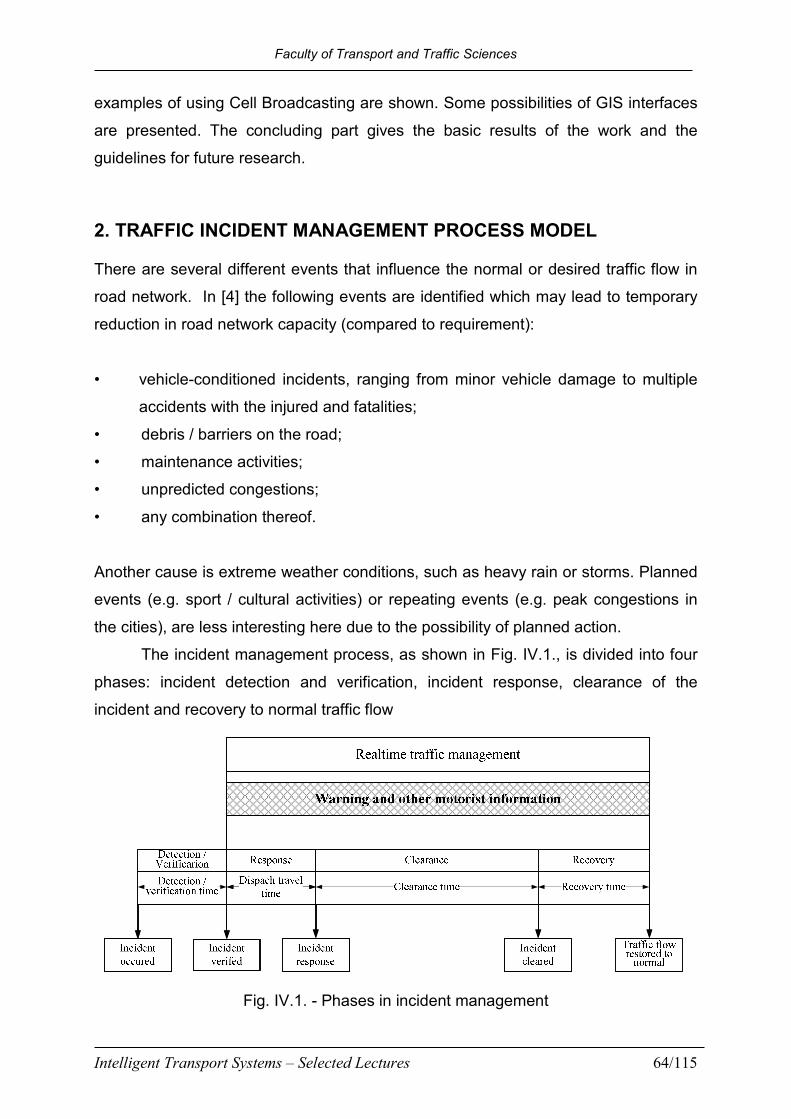
Faculty of Transport and Traffic Sciences
Intelligent Transport Systems – Selected Lectures 64/115
examples of using Cell Broadcasting are shown. Some possibilities of GIS interfaces
are presented. The concluding part gives the basic results of the work and the
guidelines for future research.
2. TRAFFIC INCIDENT MANAGEMENT PROCESS MODEL
There are several different events that influence the normal or desired traffic flow in
road network. In [4] the following events are identified which may lead to temporary
reduction in road network capacity (compared to requirement):
• vehicle-conditioned incidents, ranging from minor vehicle damage to multiple
accidents with the injured and fatalities;
• debris / barriers on the road;
• maintenance activities;
• unpredicted congestions;
• any combination thereof.
Another cause is extreme weather conditions, such as heavy rain or storms. Planned
events (e.g. sport / cultural activities) or repeating events (e.g. peak congestions in
the cities), are less interesting here due to the possibility of planned action.
The incident management process, as shown in Fig. IV.1., is divided into four
phases: incident detection and verification, incident response, clearance of the
incident and recovery to normal traffic flow
Fig. IV.1. - Phases in incident management

Faculty of Transport and Traffic Sciences
Intelligent Transport Systems – Selected Lectures 65/115
Incident detection may be defined as a process of identifying the space and time
coordinates of the incident (incident situation) and possible nature of the incident
itself. Incident detection methods are realized by private calls (phone, mobile
phones), calls from SOS road phones, police report, report of the patrolling services
and the operation of the automatic incident detection system. Incident verification
means checking, which is used to determine the exact position and nature of the
incident. In this way the possibility of responding to false alarms is reduced. Incident
verification is carried out by the employees using the image obtained by specialized
cameras (CCTV), or based on the comparison of several incoming calls about the
incident.
The next step is very important. It is necessary to inform (warn) all participants in this
road section about the nature of the incident. Implementation of this type of systems
reduces the negative consequences of adverse events or sometimes an early
warning of danger results in the adverse events not occurring. Fig. IV.2. shows the
relationship between the size of damage made in relation to the starting time of
reaction. The figure is a display of statistically processed information on fires and
their consequences. The diagram shows the impact of the shortest response of
human and technical resources. It also shows the effect of sending real-time
management information and alerts to people in danger, and in some cases, to
participants in traffic approaching a site affected primarily or secondarily by
consequences of accidental events, [9, 10].

Faculty of Transport and Traffic Sciences
Intelligent Transport Systems – Selected Lectures 66/115
Fig. IV.2. - Quantity of caused damage in relation to initial response time
We see from figure 2.2, that if the intervention, which can range from intervention
management of informing people to physical rescue of endangered, started after only
5 minutes, according to curve a) the damage remained at the DVa level. If the
intervention starts later, after 25 minutes, the damage was much higher, at DVd level.
Similar, Fig. IV.3. shows graphically the effect of reducing the cumulative arrivals of
vehicles due to traffic flow diverting to alternative routes via cell broadcast messages
about the emerged incidental situation, [4, 11]. Also, as a positive consequence the
response time of urgent services is shortened at the incident the situation due to the
decrease (diversion) of traffic flow, and instructions to drivers on how to conduct
themselves as they approach the place of incident.

Faculty of Transport and Traffic Sciences
Intelligent Transport Systems – Selected Lectures 67/115
Fig. IV.3. - Relationship of cumulative vehicle arrival and departure
Timely and accurate incident management and provision of information in real or
near real time can significantly reduce the unwanted side effects that can exceed
several times the incident that caused them.
According to the experience of leading projects in this area, it is generally considered
that one minute lost for detection and verification requires four minutes to normalize
the traffic flow.

Faculty of Transport and Traffic Sciences
Intelligent Transport Systems – Selected Lectures 68/115
3. BASIC TECHNICAL CHARACTERISTICS OF CELL
BROADCASTING
The key to successful delivery of mobile services with added value is in finding the
right combination of network services and content. An example of such a combination
of content and functionality of the mobile network is providing the location-based
technology, recently often used in entertainment and marketing industry.
These innovative telecom services began to develop more strongly after 2000. One
of the services is "Location-qualified telecom messaging" which allows end users to
receive different kinds of "push" specific information in relation to their current
location, from multiple senders. One of the pioneering services in this area is the
cellular broadcast system for sending telecom messages for emergency activities.
Such services are based on sending alphanumeric messages to mobile phones (cell
phones) that are found in a particular area that is dynamically determined by the
content provider. The smallest area to which the content provider can send the
contents is a radio cell, and the largest is a complete wireless network.
Cell Broadcast System distributes information in a message format, very similar to
the familiar SMS messages. These messages can be in a text or binary form. The
length of a message is between 1 and 15 pages of 82 bytes (93 characters). A very
important feature of this system is the distribution of information to a large number of
users in a very short time. Processing required for the distribution of information is
completely independent of the number of users that receive the information. The end
user determines what information is to be presented to him and whether he wishes to
receive this content. There are more than 65,000 channels available (in the ETSI
terminology called "Message Identifiers"), each corresponding to a particular type of
information.
The user individually activates and deactivates the reception of the first 999
broadcast channels. The rest of the channels must be activated via the OTA.
Moreover, such a messaging system offers a range of unique functionalities such as
support for sending specific information about location.
Apart from features provided by work in real time, the terminal required to receive
broadcast information is continuously with the user, so he can read it immediately
upon message delivery.

Faculty of Transport and Traffic Sciences
Intelligent Transport Systems – Selected Lectures 69/115
The system architecture of "Location-qualified telecom messaging" gives the operator
complete control over the network topology, whether it is a GSM or a UMTS
(Universal Mobile Telecommunications System) network, Figure 3.1.
It also allows the content provider to work under largest load and with most complex
cellular networks with their frequent changes. This is accomplished by dividing the
system into two components, usually placed in two domains:
- CBC (Cell Broadcast Center) is a network element in the mobile network, which
sends broadcast messages to a specific radio cells.
- One or more CBE (Cell Broadcast Entities) are connected to the CBC, and can be
used locally (by operators) and remotely (by independent content providers) to define
and send telecom messages with location importance.
Using the Cell Broadcast function, the end user selects relevant information, while
blocking all other information. Received Cell Broadcast messages are displayed
instantly on the display of the cell phone, or can be stored as SMS (Short Message
Service) in the memory for later reading. The user selects relevant information by
activating the so-called Cell Broadcast Channel (in ETSI terminology: "Message
Identifiers").
This kind of telecom messaging supports messages in several languages, encoded
in the ETSI Default Alphabet and Unicode (UCS2), as defined in GSM 03.38 Phase 2
+] and [3GPP TS 23.038], [12, 13].
Furthermore, such information can be sent in binary format for processing using
machine-to-machine applications). A range of applications can take advantage of Cell
Broadcast technologies, including the following examples:
- Traffic signs and information boards along the road can be equipped with mobile
receivers.
- Dispatching systems can use the CB messages to send information to vehicles
(taxis, police or firefighters).
- Traffic information for the navigation systems.

Faculty of Transport and Traffic Sciences
Intelligent Transport Systems – Selected Lectures 70/115
User interfaces of today's mobile phones support different procedures to activate the
Cell Broadcast channel. Although manufacturers of mobile terminals develop and
enhance functions, it is extremely important for the service of content providers to
facilitate the activation of the Cell Broadcast channels. There are two ways to do this:
- Using the index message
- Use the activation via OTA (Over the air activation - of services and tariff changes)
The index message is a specially formatted CB message with which channels from
the menu can be selected and activated.
In the case of activation via OTA, remote activation of CB channels (e.g. via a
website) can be done by sending a binary SMS (also referred to as an OTA
message) to the mobile device which updates the SIM (Subscriber Identity Module)
card and activates the CB channels. In addition to improving the user interface,
activation of CB channels via OTA can provide a CB charging service (or its
activation), Fig. IV.4.
The center for location-specific telecom messaging is the central point for distribution
of CB messages via a GSM network or a UMTS network. CBE submit broadcast
claims to the CBC, [14, 15]. Several CBE can be also interfaced to the center. CBC
will address the appropriate cell controllers (Base Station Controller in a GSM
network and Radio Network Controller in a UMTS network), which in turn will ensure
the transmission of broadcast messages by the corresponding radio cells (Base
Transceiver Station in a GSM Network and Node-B in a UMTS network). CBC
supports a number of cell controllers in accordance with ETSI standards.
Fig. IV.4. - Functional Diagram of Cell Broadcast System

Faculty of Transport and Traffic Sciences
Intelligent Transport Systems – Selected Lectures 71/115
4. INTERFACES FOR CELL BROADCAST SYSTEM
The CBE-CBC interface allows the CBE access to functions of the CBC. The
interface accepts requests, processes them and transfers error messages or
confirmation to the CBE. Message encoding (e.g. Universal Character Set 2) is
transparent to the CBE-CBC interface.
The CBC provides two protocols for access to CBE:
• Protocol based on ASN.1
• Protocol based on HTTP / XML
CBE is connected to the CBC Center via LAN or a network interface, such as ISDN,
X.25 or the Internet, Fig. IV.5.
In the CBC, bandwidth control is performed on the CBE-CBC interface. That means
when CBE exceeds the configured maximum bandwidth, the CBC will slow down
sending replies.
Fig. IV.5. Cell Broadcast System Architecture
Commands for cell controllers are provided with a list of cells, identifying the radio
cells involved in commands. The cell controller is also responsible for the repetition of
CB messages at a certain frequency. When a CB message is stopped, the cell
controller reports the number of broadcasts by radio cell. ETSI has defined a
standard for this interface (GSM 03.49 and [3GPP TS 25.419]), which the CBC

Faculty of Transport and Traffic Sciences
Intelligent Transport Systems – Selected Lectures 72/115
supports. The CBC also supports interfaces to cell controllers that are not in
accordance with ETSI standards.
The replies of the cell controller can change the internally maintained status variables
of cell controllers and radio cells. The CBC attempts again to send failed messages
for a configurable number of times. If after these attempts, the command is still not
accepted, the command will be canceled.
The CBC Center can be controlled remotely using the OMC (Operations and
Maintenance Centre) via the web interface, Fig. IV.6. Functions, which the web
interface provide are basic functions such as:
- start up and shut down of the CBC or its parts,
- entering basic information about the system (for e.g. position of a radio cell or which
cell controller controls a specific radio cell),
- monitoring CBC activity.
Fig. IV.6. - Alphanumeric Cell Broadcast System interface
The same functionality is provided in the CBC. An SNMP interface is available for
remote monitoring of alarms.
The CBC automatically imports data on the topology of the GSM and the UMTS
network (ie. the relationship between radio cells and cell controllers) with file import
tools. Data must be presented in the files, transferred using a file transfer protocol
(FTP).
For a network element such as a Cell Broadcast Center, characteristics such as
availability and capacity are of decisive importance.
Basic features are:
- Scalability, CBC can be implemented as CBS Smart (entry level platform), or dual-
node Power CBS

Faculty of Transport and Traffic Sciences
Intelligent Transport Systems – Selected Lectures 73/115
- Availability, several techniques are used in the CBC to improve system availability
(Fail-take: if one node fails the other will take over.
5. COMPARISON OF CELL BROADCAST SYSTEM AND SHORT
MESSAGE SERVICE
SMS is one-to-one technology whereas CB is one-to-many. This significantly impacts
the cost structure of such services allowing for easier network dimensioning. In an
average network it would take 100 SMS with the same content approximately 30
seconds to reach its destination, whereas in a CB-enabled network, a similar
message transmission takes 30 seconds to reach all end users tuned into a CB
channel, up to several million at a time. Unlike SMS, the time to broadcast a
message over a CB channel is insensitive to the number of subscribers scheduled to
receive the message. In a typical CB, a message can be sent within 30 seconds to all
handsets. Efficiency of communicating the message does not decline in peak hours
and CB does not use the signaling network (IN7) to carry messages as with SMS.
Some basic characteristics of Cell Broadcast System and Short Message Service are
presented in Tab. IV.1.
Tab. IV.1. Basic Characteristics of SMS and CBS [16].
Characteristic Short Message Service Cell Broadcast Service
Handset
compatibility All handsets support SMS
Most handsets support CBS
except
Few numbers.
Transmission
form
Unicast and Multicast
communication
Broadcast service. Message
received indiscriminately by every
handset within broadcast range
Mobile number
dependency
Dependent. Foreknowledge
of mobile number(s) is
essential
Independent. Message is
received
on activate broadcasting channel
Location
dependency
Independent. User receives
the message anywhere
Dependent. Targets one cell or
more
Geo- Achieved by obtaining cell Cell(s) location is known for
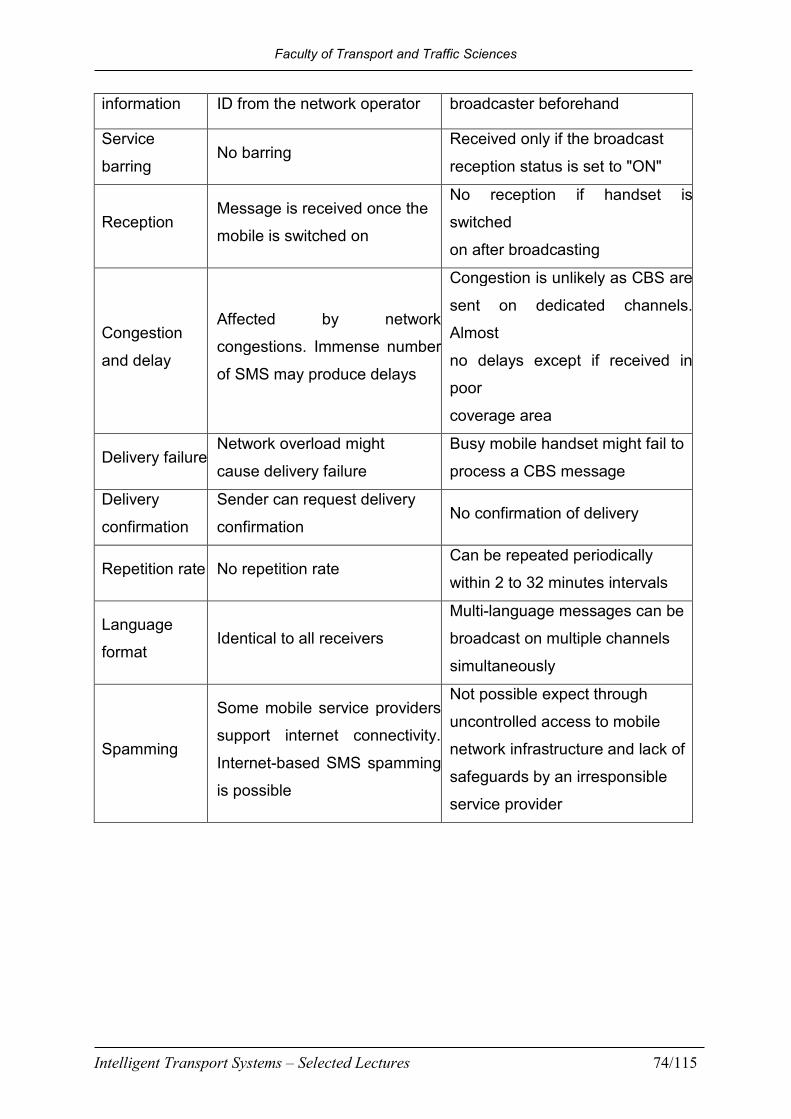
Faculty of Transport and Traffic Sciences
Intelligent Transport Systems – Selected Lectures 74/115
information ID from the network operator broadcaster beforehand
Service
barring No barring
Received only if the broadcast
reception status is set to "ON"
Reception Message is received once the
mobile is switched on
No reception if handset is
switched
on after broadcasting
Congestion
and delay
Affected by network
congestions. Immense number
of SMS may produce delays
Congestion is unlikely as CBS are
sent on dedicated channels.
Almost
no delays except if received in
poor
coverage area
Delivery failure Network overload might
cause delivery failure
Busy mobile handset might fail to
process a CBS message
Delivery
confirmation
Sender can request delivery
confirmation No confirmation of delivery
Repetition rate No repetition rate Can be repeated periodically
within 2 to 32 minutes intervals
Language
format Identical to all receivers
Multi-language messages can be
broadcast on multiple channels
simultaneously
Spamming
Some mobile service providers
support internet connectivity.
Internet-based SMS spamming
is possible
Not possible expect through
uncontrolled access to mobile
network infrastructure and lack of
safeguards by an irresponsible
service provider

Faculty of Transport and Traffic Sciences
Intelligent Transport Systems – Selected Lectures 75/115
6. APPLICATION OF CELL BROADCASTING IN TRAFFIC
The main application of Cell Broadcasting in traffic is sending alphanumeric
messages for location-specific alarms and messaging within the framework of mobile
telecommunications network. The main purpose is to warn and inform motorist and
other participants about the event in this road section. Also, same system can be
used to inform about other incidents such as natural disasters, infrastructure or
chemical accidents, and terrorist or other security incidents. In Japan, since 2008,
DoCoMo (Japan's premier mobile provider of leading-edge mobile voice, data and
multimedia services) has implemented an alarm and messaging system for
dangerous weather conditions and alert for earthquakes using the cell broadcast
service. New York City in 2007 launched the "Crisis text via CB" project intended for
early warning of citizens. The Indian operator BSNL (Broadband - Bharat Sanchar
Nigam Ltd) has introduced a cellular broadcast of important information on disaster,
as well as crisis management. The U.S. FEMA (Federal Emergency Management
Agency) under the Department of Homeland Security in the United States
implements the "Emergency Cell Broadcast Network" system for cities and areas till
now frequently threatened by natural disaster.
Several operators and content providers develop traffic information services in real
time. Two main types can be distinguished in these applications. One is the basic
version in which location and traffic information is sent to users and displayed as text
messages on their mobile devices. More advanced versions of these services are
continually sending dynamic information on road conditions and their display on a
navigation system, Fig. IV.7.
Fig. IV.7. - Example of traffic messaging, [17]
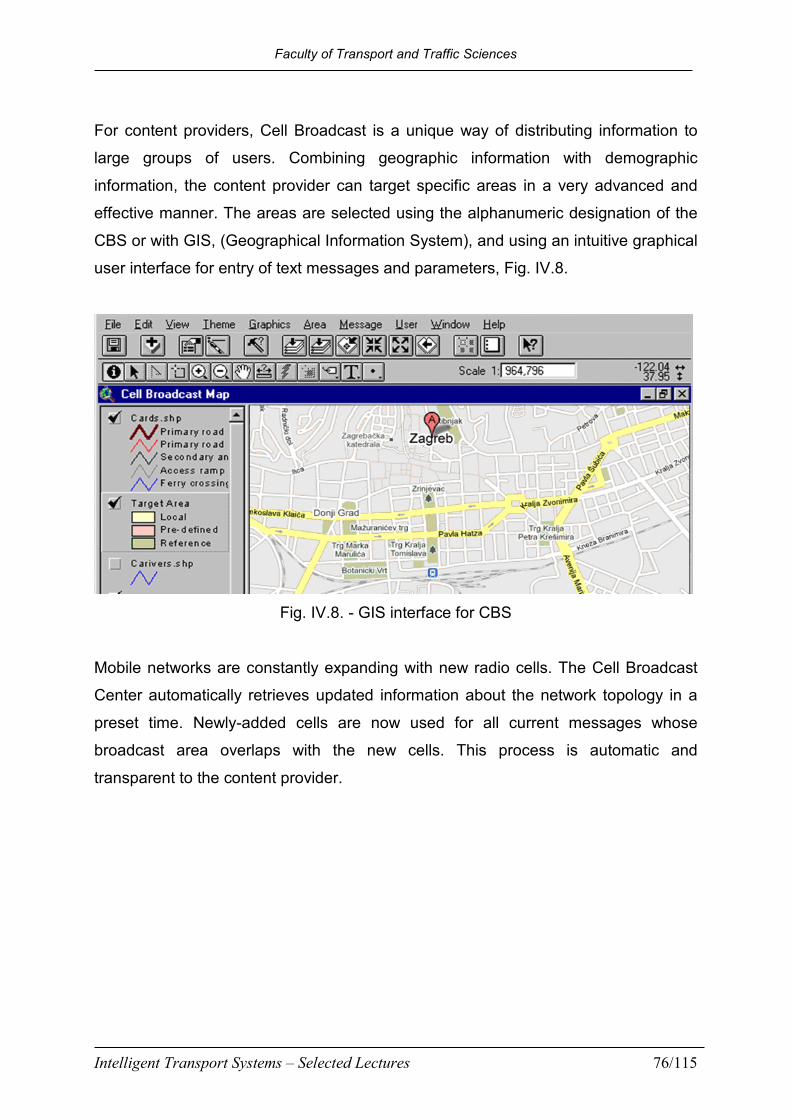
Faculty of Transport and Traffic Sciences
Intelligent Transport Systems – Selected Lectures 76/115
For content providers, Cell Broadcast is a unique way of distributing information to
large groups of users. Combining geographic information with demographic
information, the content provider can target specific areas in a very advanced and
effective manner. The areas are selected using the alphanumeric designation of the
CBS or with GIS, (Geographical Information System), and using an intuitive graphical
user interface for entry of text messages and parameters, Fig. IV.8.
Fig. IV.8. - GIS interface for CBS
Mobile networks are constantly expanding with new radio cells. The Cell Broadcast
Center automatically retrieves updated information about the network topology in a
preset time. Newly-added cells are now used for all current messages whose
broadcast area overlaps with the new cells. This process is automatic and
transparent to the content provider.

Faculty of Transport and Traffic Sciences
Intelligent Transport Systems – Selected Lectures 77/115
7. CONCLUSION
Reactions to incident events in real time reduce material damage and human
casualties. Such properties have systems for early warning, that allow dislocation of
people out of vulnerable locations. Especially an important role is played by these
telecommunications systems in traffic that is very dynamic and therefore complex in
terms of management. The introduction of advanced telecommunications solutions
increases safety in unfolding traffic reduces the number of casualties in traffic
accidents and leads to faster response and actions by emergency services. Due to
the success of implementation of such telecom systems, they become an integral
part of the strategic program for design and deployment of regional ITS systems (ITS
- Intelligent Transportation Systems). Tracking the number and severity of the
consequences of accidents before and after the introduction of ITS provides a
relatively objective quantification of the security gains and mitigates the effects of
these events. Except in traffic incidents, similar processes and technology can be
applied in the case of other emergencies, major accidents and disasters. Measuring
the percentage reduction in response time is not a direct indicator of benefits, but is a
very important factor. Reducing response time significantly affects the reduction of
fatalities and prevent further casualties after the initial traffic (or other) accidents.
Warning systems on highways improve driver perception of the accident scene and
help reduce stress while traveling. Perception of safe travel is not only about reducing
the number of accidents and their consequences, but also about increasing the
perception of personal safety and security in transport. Also, dynamic and location-
selective management of large incidents reduces the possibility of uncontrolled
process (for e.g. panic in humans). The introduction of new telecommunications
technologies with the above properties, such as Cell Broadcast Systems,
substantially increases the effectiveness of security systems in the public and the
transport sector.
Faculty of Transport and Traffic Sciences
Intelligent Transport Systems – Selected Lectures 78/115
REFERENCES
[1] Mandžuka, S., Kljaić, Z., Škorput, P., Application of ICT in the traffic incident
management system, Proceedings Vol. II CTI – MIPRO, pp. 359-362, Opatija,
2011.
[2] Traffic Incident Management Handbook, Federal Highway Administration
Office of Travel Management, Nov., 2000.
[3] Bošnjak, I., Intelligent Transportation Systems 1, Faculty of Transport and
Traffic Sciences, Zagreb, 2006 (in Croatian).
[4] Škorput, P., Real-time incident management system, M.Sc. Thesis, Faculty of
Transport and Traffic Sciences, Zagreb, 2009 (in Croatian)
[5] P. Škorput, S. Mandžuka, N. Jelušić: “Real-time Detection of Road Traffic
Incidents”, pp. 273-283, Promet, 22, 4; 2010
[6] Dudek, C.L, Messer, C.J. and N.B. Nuckles, N.B, Incident detection on urban
freeways. Transportation Research Record, 495 pp. 12-24., 1994.
[7] Dia, H., Rose, G., Snell, A., “Comparative performance of freeway automated
incident detection algorithms,” in Proc. Roads 96: Joint 18th ARRB Transp.
Res. Conf. and Transit New Zealand Land Transp. Symp., pt. 7, pp. 359–374,
1996
[8] Global mobile statistics 2011: all quality mobile marketing research, mobile
Web stats, subscribers, ad revenue, usage, trendsd,
(http://mobithinking.com/mobile-marketing-tools/latest-mobile-stats), visited
June, 2011.
[9] Mandžuka, S., Kljaić, Z., Kordić, Z., Mobile Telecommunication technology for
Incident Management System, Proc. XVII Telecommunications Forum
TELFOR, 2009.
[10] Wattegama, Ch., ICT for Disaster Management, Asia-Pacific Development
Information Programme, 2007.
[11] Evanco, W. M. The Impact of Rapid Incident Detection on Freeway Accident
Fatalities. Virginia : Mitretek Center for Information Systems McLean, 1996.
[12] Ericsson; “Content Delivery System”, FC 101 097/3, , Stockholm, Sweden.
[13] Ericsson; “Mobile Positioning System”, FC 101 0351, Stockholm, Sweden.

Faculty of Transport and Traffic Sciences
Intelligent Transport Systems – Selected Lectures 79/115
[14] 3GPP TS 23.041; 3GPP TS 23.041, “Technical realization of Cell Broadcast
Service (CBS)”, 3GPP, V4.1.0
[15] GSM 03.41; “Digital Cellular Telecommunications System (Phase 2+);
Technical Realisation of the Short Message Service Cell Broadcast (SMSCB)”,
ETSI
[16] Aloudat, A, Michael, K and Yan, J, Location-Based Services in Emergency
Management- from Government to Citizens: Global Case Studies", Recent
Advances in Security Technology, Australian Homeland Security Research
Centre, Melbourne, 2007, 190-201.

Faculty of Transport and Traffic Sciences
Intelligent Transport Systems – Selected Lectures 80/115
V. THE DECISION SUPPORT SYSTEM FOR DISASTER
TRAFFIC RESPONSE MANAGEMENT
1. INTRODUCTION
Crisis Management System consists of two phases; Pre-incident and Post-incident
phases, (Kang and Shneiderman, 2006). Pre-incident tasks include predicting and
analyzing potential dangers and developing necessary action plans for mitigation.
Post-incident response starts while the disaster is still in progress. At this stage the
challenge is locating, allocating, coordinating, and managing available resources. An
effective emergency response plan should integrate both of these phases within its
objective (Tufekci and Wallac, 1998). Separating Pre-incident and Post- incident
objectives may lead to suboptimal solutions to the overall problem.
Managing the system of protection and rescue of the City of Zagreb, following legal
provisions, is a hierarchical set - consists of several levels of management and refers
to management in all situations: emergencies, disasters, major accidents and
disasters. The system is a combination of civilian management and elements of
command and leadership. Management is implemented in various centers of
decision-making levels, and these are centers or sites which are shipped all
processed and analyzed relevant information in relation to the emergency situation,
unfortunately, a great misfortune and disaster upon which to make appropriate
decisions in various phases of crisis development (Fig. V.1.).
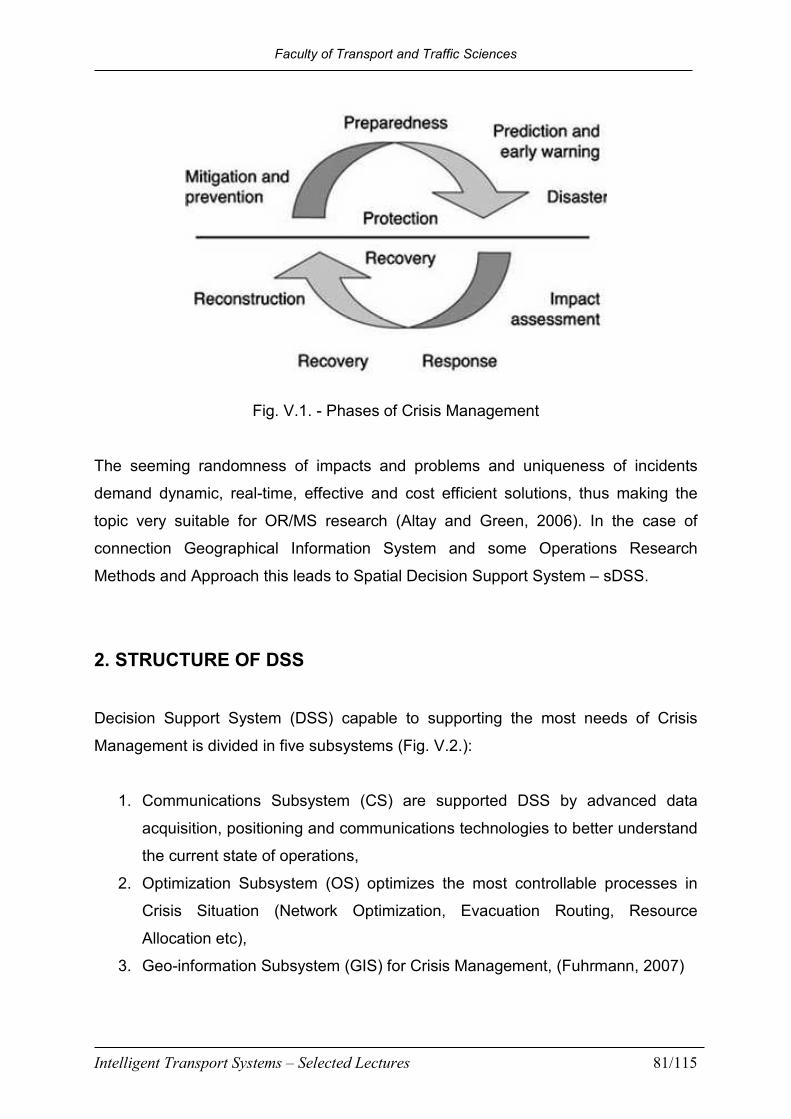
Faculty of Transport and Traffic Sciences
Intelligent Transport Systems – Selected Lectures 81/115
Fig. V.1. - Phases of Crisis Management
The seeming randomness of impacts and problems and uniqueness of incidents
demand dynamic, real-time, effective and cost efficient solutions, thus making the
topic very suitable for OR/MS research (Altay and Green, 2006). In the case of
connection Geographical Information System and some Operations Research
Methods and Approach this leads to Spatial Decision Support System – sDSS.
2. STRUCTURE OF DSS
Decision Support System (DSS) capable to supporting the most needs of Crisis
Management is divided in five subsystems (Fig. V.2.):
1. Communications Subsystem (CS) are supported DSS by advanced data
acquisition, positioning and communications technologies to better understand
the current state of operations,
2. Optimization Subsystem (OS) optimizes the most controllable processes in
Crisis Situation (Network Optimization, Evacuation Routing, Resource
Allocation etc),
3. Geo-information Subsystem (GIS) for Crisis Management, (Fuhrmann, 2007)

Faculty of Transport and Traffic Sciences
Intelligent Transport Systems – Selected Lectures 82/115
4. Simulation Subsystem (SS) simulates partial problem of the realworld
environment for the supervised area (pollution propagation, dynamic of traffic
system, dynamic of river flooding, etc.)
5. Knowledge Subsystem (KS) gives the corresponding reasoning methods
required to perform the monitoring and management of emergency situations.
The interface with the outside world is Communications Subsystem. A special part of
this subsystem is an alert system. In this case it works with Cell Broadcasting
technology. The main application of Cell Broadcasting in Crisis Management is
sending alphanumeric messages for location-specific alert/alarms and messaging
within the framework of mobile telecommunications network, (Mandžuka and all,
2010).
Kno
wle
dge S
ubsy
stem
DB
MS
Mo
dule
MB
MS
Mod
ule
Fig. V.2. - Structure of DSS
The main purpose is to warn and inform all relevant participants about the incident
event in critical area. The system can be used to inform location-dependent about

Faculty of Transport and Traffic Sciences
Intelligent Transport Systems – Selected Lectures 83/115
different incidents such as natural disasters, infrastructure or chemical accidents, and
terrorist, large traffic incidents or other security incidents.
3. OPTIMIZATION MODULE
The Optimization Subsystem (OS) optimizes the most (full or partially) controllable
processes in Crisis Situation. The main optimization tasks are Network Optimization,
Evacuation Routing, Resource Allocation etc. is proposed to find the optimal solution
for some emergency evacuation planning problem (Transport/Transshipment on
Road Network, Optimal Routing Evacuation, Optimal Allocation of different
resources, etc. The Optimization Engine simultaneously solves for the choice of
destination (shelter), evacuation route, and departure time for all evacuees from
given origins (evacuations zones). It is envisaged that the Optimization Engine works
with the classic numerical and (or) heuristic methods (Barbarosoglu and Arda, 2004;
Cret et all, 1993).
AHP (Analytic Hierarchy Process) module is designed as a multi-criteria decision-
making tool, (Saaty, 1989). The objective of multi-criteria decision-making is the
choice of the best alternative according to the defined set of criteria. If the results of
multi-criteria decision-making are the final evaluations of the alternatives, and if these
evaluations reflect their place on the scale of priorities, this procedure may be called
multi-criteria evaluation. Previous studies indicate the great utility of AHP method for
decision making in crisis management. In this project, the standard AHP method
extends the capabilities of various models of operational research. For example, this
tool is applied in estimating of basic features (values) of arches in a traffic network.
We now study the possible application of integrated measures of arcs in the form:
ijijijijij lkcrs =
where:
sij – integrated measure of arc between nodes i and j,
rij – reliability coefficient of arc between nodes i and j,
cij – capacity coefficient of arc between nodes i and j,

Faculty of Transport and Traffic Sciences
Intelligent Transport Systems – Selected Lectures 84/115
kij – congestion coefficient of arc between nodes i and j,
lij – distance of arc between nodes i and j.
The values of coefficients rij, cij, and kij are given by multi-criteria AHP evaluation
(Jelušić et all, 2009). In order to estimate the particular coefficient, a survey has been
carried out among a group of experts in the area of crisis management, traffic
experts, city traffic policeman, etc. The survey group consisted of respondents such
as: public services involved in urban traffic management, companies that deal with
design in traffic and scientists and experts from the University of Zagreb.
4. GEO-INFORMATION SUPPORT IN CRISIS MANAGEMENT
Within the management of urban crisis management, geoinformation systems (GIS)
are used in any of the phases of mitigation, preparedness; response and recovery as
most of the required data have a spatial component (Zlatanova et. Al, 2006). GIS can
combine many layers of different information, creating products that are much more
sophisticated than flat maps. By linking maps to databases, GIS enables users to
visualize, manipulate, analyze, and display spatial data.
All phases of crisis management depend on data from a variety of sources. The
appropriate data has to be gathered, organized, and displayed logically to determine
the size and scope of crisis management programs. During an actual crisis it is
critical to have the right data, at the right time, displayed logically, to respond and
take appropriate action (Johnson, 2000). Crisis can impact all or a number of
government departments. Emergency personnel often need detailed information
concerning pipelines, building layout, electrical distribution, sewer systems, and so
forth. By utilizing a GIS, all departments can share information through databases on
computer-generated maps in one location. Without this capability, emergency
workers must gain access to a number of department managers, their unique maps,
and their unique data. Most emergencies do not allow time to gather these resources.
This results in emergency responders having to guess, estimate, or make decisions
without adequate information. This costs time, money, and in some cases lives. GIS
provides a mechanism to centralize and visually display critical information during a
crisis. GIS is a flexible technology enabling full integration with other information

Faculty of Transport and Traffic Sciences
Intelligent Transport Systems – Selected Lectures 85/115
systems. Linking people, processes, and information together and being able to
access that information at command centers and out in the field, are strengths GIS
offers agencies as they respond to events.
In an emergency case, not only the location of the event but many other information
is needed, like How many people are affected? Which road network is available? Can
the location be reached by vehicles? Where are the most nearby hospitals located?
How much and which kind of capacity do the hospitals have? Such and many other
questions can be answered very quickly if and only if reliable spatial data are
available in digital form and if the data are processed in a powerful GIS (FIG, 2006).
Depending on the specific tasks, different types of GIS are to be used:
1. Spatial information portals and data warehouses
2. Modeling and simulation systems
3. Monitoring and early warning systems
4. Planning support systems
In the city of Zagreb, the Office of emergency management (OEM) is responsible for
the coordination of the City’s emergency planning, training, response, and recovery
efforts of major disasters such as fires, floods, earthquakes, acts of terrorism; and for
major planned events in the city that require involvement by multiple City
departments. OEM was established in 2008 and has immediately started with
implementation of GIS system. GIS is implementing with the main purpose to mitigate
the consequences of possible disasters but also for different analysis in the phase of
preparedness and planning (Cetl, et. al. 2010). It must be mentioned that the city of
Zagreb is located in a seismically active area and there is a real expectation of
earthquakes in the future period. The last great earthquake in the city of Zagreb was
in 1880.
Currently GIS database consists of more than 20 data layers such as:
communications, evacuation areas, shelters, health institutions, fire protection units,
police stations, settlements, different utilities, shopping centers, industrial objects,
educational objects, etc. However GIS is still in developing phase. As a background,
digital orthophoto is used (Fig. V.3.)

Faculty of Transport and Traffic Sciences
Intelligent Transport Systems – Selected Lectures 86/115
Fig. V.3. - Current view of OEM's GIS
GIS is based on the GIS Cloud software (http://www.giscloud.com/) and PostgreSQL
database with PostGIS extension. GIS Cloud is the web based GIS that can visualize
any data as maps. It is a very innovative solution that enables easy data sharing and
collaboration within different organizations. The main challenge in the further
development is exactly sharing of data between different city offices. In the city of
Zagreb an official GIS was established already in 1992. Today it consists of more
than 40 different spatial layers. The intention of OEM is not to have a parallel GIS but
rather to combine their data with other spatial datasets. Thanks to the technology
development, nowadays is such solution possible through standard OGC (Open
Geospatial Consortium) services such as WMS (Web Map Service), WFS (Web
Feature Service), etc.

Faculty of Transport and Traffic Sciences
Intelligent Transport Systems – Selected Lectures 87/115
5. CONCLUSION
The development of Knowledge-based Decision Support Systems for Crisis
Management requires the management of complex information (Recourses,
Geospatial information, Traffic etc). Some preliminary results (concepts and structure
of DSS, application of GIS in our system etc.) is described in this paper. Future
research will include the selection of appropriate numerical methods and the
possibility of heuristics for particular situations. In this area there are many
opportunities to improve existing knowledge.
6. REFERENCES
1. Altay, N., Green, W. (2006), OR/MS research in disaster operations management,
European Journal of Operational Research 175, 475–493
2. Barbarosoglu, G., and Arda, Y.,, (2004), A two-stage stochastic programming
framework for transportation planning in disaster response, Journal of the
Operational Research Society 55 No. 1., pp. 43–53.
3. Cetl, V., Mađer, M., Guberina, B. (2010), Risk Management in the teaching at the
Faculty of Geodesy in Zagreb. Proceedings of Second conference of the Croatian
platform for reducing risk of disasters, October 14-15, Zagreb.
4. Cret, L., Yamazaki, F., Nagata, S. and Katayama, T., (1993), Earthquake damage
estimation and decision-analysis for emergency shutoff of city gas networks using
fuzzy set-theory, Structural Safety 12 No. 1, pp. 1–19.
5. FAO, Drought impact mitigation and prevention in the Limpopo River Basin, A
situation analysis, FAO SubOffice SEA, Rome, 2004.
6. FIG, International Federation of Surveyors (2006), The Contribution of the
Surveying Profession to Disaster Risk Management. FIG Publication no 38.,
Copenhagen, Denmark.
7. Fuhrmann, S., Maceachren, A.M., Cai, G., (2007), Crisis Management with
Modern Geographic Information Technologies: Kartographische Nachrichten, Vol. 57,
No. 2, pp. 92- 99.
8. Jelušić, N; Anžek, M; Mandžuka, S., (2009), Evaluation of Sensor Technologies for
Intelligent Transport Systems, Proceedings of 16th ITS World Congress, Stockholm

Faculty of Transport and Traffic Sciences
Intelligent Transport Systems – Selected Lectures 88/115
9. Johnson, R. (2000), GIS Technology for Disasters and Emergency Management,
ESRI White Paper. ESRI (Environmental Systems Research Institute, Inc.) 380 New
York St., Redlands, US.
10. Kang, H., B. Shneiderman, (2006), Exploring Personal Media: A Spatial Interface
Supporting User-Defined Semantic Regions. Journal of Visual Languages &
Computing, Vol. 17, No. 3, pp. 254-283.
11. Mandžuka, S., Savi, I., Kljaić, Z. (2010): Intelligent transportation system and
crisis management, International Conference: Crisis management Days, Velika
Gorica, ISBN 978-953-7716-07-3 (in Croatian)
12. Saaty, T.L., (1989), Group Decision Making and the AHP. In: B. Golden, E. Wasil
and P.T. Harker, Editors, The Analytic Hierarchy Process: Applications and Studies,
Springer-Verlag, New York
13. Tufekci, S., Wallace, W.A., (1998), The emerging area of emergency
management and engineering. IEEE Transactions on Engineering Management 45
(2), 103–105.
14. Zlatanova S., Van Oosterom P., Verbree, E. (2006). Geo-information support in
management of urban disasters. Open House International, Volume: 31, Issue: 1,
Pages: 62-69.

Faculty of Transport and Traffic Sciences
Intelligent Transport Systems – Selected Lectures 89/115
VI. ROAD TRAFFIC INCIDENT DETECTION
1. INTRODUCTION
Road traffic incident management is a functional part of the holistic approach to
solving traffic problems known under the term Intelligent Transportation System –
ITS. The advanced development of communication and navigation technologies and
their implementation in various phases of incident management can significantly
reduce the consequences of incident event such as congestion, delay, pollution and
especially dangerous secondary incidents [1]. The development of the incident
management system is approached in a new and technologically innovative manner
starting from adequate basis of the traffic flow theory, theory of dynamic system
estimation, general theory of classification, as well as adequate ITS architectures,
available technologies, etc. [2, 3, 4].
Real-time incident management in traffic comprises coordination activities
undertaken by several actors in order to reduce the negative impact, i.e. recovery of
the traffic flow to the conditions of normal flow. One of the basic problems in incident
management is effective coordination of various organisations, i.e. services included
in this process [5]. Besides, incident management comprises also legal regulations
which require careful planning of all segments. The success of the incident
management lies in careful development of clear (and efficient) instructions and
procedures, which are acceptable and understandable for all the involved services,
organisations and individuals. One of the important conditions to achieve this is high-
quality communications among the participants, i.e. information transparency and
real-time data flow. Absence of such an approach which combines cooperation,
communication and training, represent one of the main reasons of inefficient incident
management process, today [5, 6, 7].

Faculty of Transport and Traffic Sciences
Intelligent Transport Systems – Selected Lectures 90/115
The critical point in the traffic incident management chain is the procedure of
detecting the incident and the appropriate verification thereof. There are today
different technologies used to achieve this. The basic classification of such systems
is into:
1. traffic incident detection systems in/on road structures (tunnels, bridges,
viaducts, etc.),
2. traffic incident detection systems on open road sections.
The first group systems are based mainly on the processing of video-signals of
appropriate CCTV cameras. The specialised products of this type are available on
the market and represent the usual solutions e.g. in tunnels and especially important
sections of roads, where they detect a stopped vehicle, illegal half turns, driving in
wrong direction, and similar. A much more complex system for traffic incident
detection is the one on open road sections. Due to economic reasons, the installation
of CCTV system is here unacceptable. These systems are based on estimation of the
traffic state variables (space mean speed, traffic flow, traffic density, etc.), [8, 9, 10].
Based on the reconstruction of the traffic state variables, using various algorithms of
the theory of classification and sample recognition, possible incidents are detected.
These procedures allow also prediction of incident occurrence.
The application of the procedures of traffic state variables estimation is based on the
macroscopic traffic flow models [11]. The basic problem here is the selection of the
appropriate model. It is necessary to assess the complexity of the model and its real
possibilities for such an application. Recently, several approaches have been studied
and they are more or less based on various applications of the second order traffic
flow model [10, 12]. The next step is the application of appropriate incident detection
algorithms. In this paper the classification of various approaches is used by using the
results of general theory of process faults detection [13, 14]. There is, namely, great
similarity of traffic incident detection and the appropriate well-defined area of process
faults detection in the classical theory of automatic control. The latest research in the
field of automatic incident detection is directed to the usage of complex systems that
use various sources of information and processing procedures. These solutions lead
to the proposal of using the decision support system (DSS), [15].

Faculty of Transport and Traffic Sciences
Intelligent Transport Systems – Selected Lectures 91/115
The paper provides the description of the main elements of the incident management
system. The second chapter describes the generalised model of incident
management. The main phases of the management process are described
(detection/verification, response, clearance, recovery) and general classification of
detection/verification methods is presented. The third chapter focuses on the
mathematical model of estimating the traffic state variables. For this purpose the
appropriate development of the discrete mathematical model of the traffic flow has
been presented, as well as the structure of estimator based on the application of the
Extended Kalman Filter. An overview of the theory of automatic detection of traffic
incidents on open road sections is provided in the fourth chapter. The main algorithm
groups that are applied today for these purposes are briefly described. In the end a
description of the incident management decision support system as a possible
promising future solution is given. An analysis of several factors is made, which in
practice significantly affect the quality of work of the incident detection system. The
concluding part gives the basic results of the work and the guidelines for future
research.
2. INCIDENT MANAGEMENT PROCESS MODEL
There are several different events that influence the normal or desired traffic flow in
road network. In [5] the following events are identified which may lead to temporary
reduction in road network capacity (compared to requirement):
• vehicle-conditioned incidents, ranging from minor vehicle damage to multiple
accidents with the injured and fatalities;
• debris / barriers on the road;
• maintenance activities;
• unpredicted congestions;
• any combination thereof.
Another cause is extreme weather conditions, such as heavy rain or storms. Planned
events (e.g. sport / cultural activities) or repeating events (e.g. peak congestions in
the cities), are less interesting here due to the possibility of planned action.
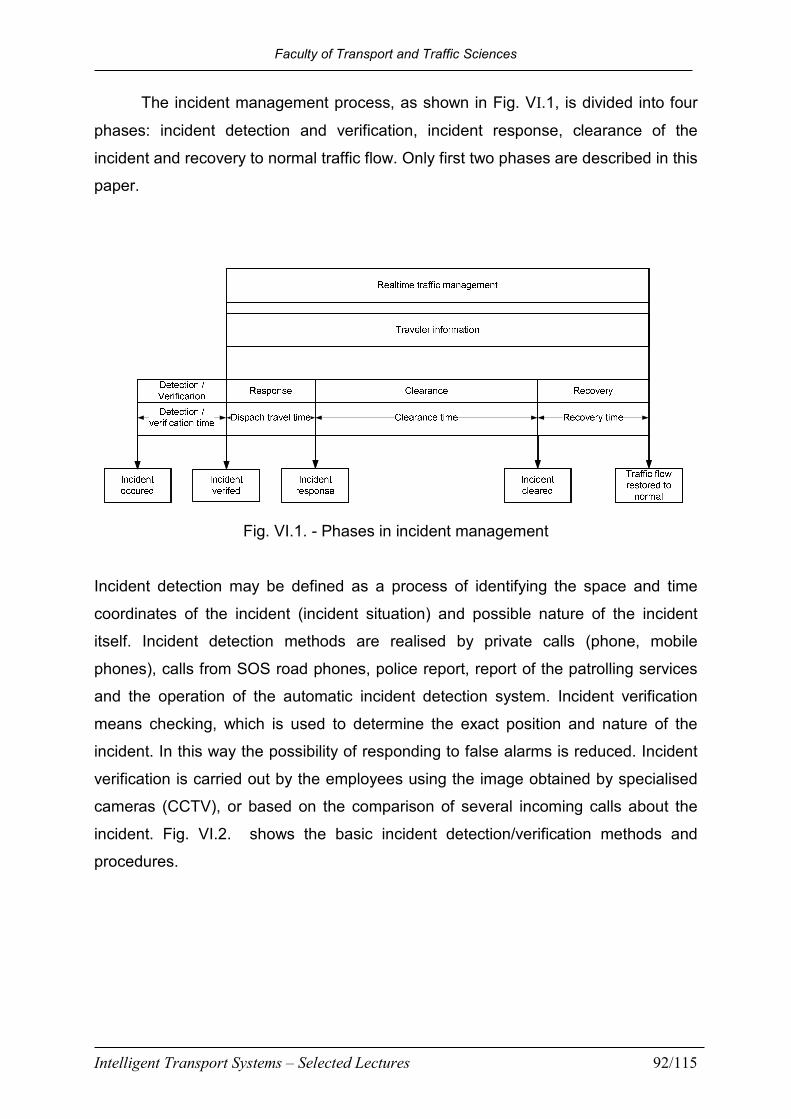
Faculty of Transport and Traffic Sciences
Intelligent Transport Systems – Selected Lectures 92/115
The incident management process, as shown in Fig. VI.1, is divided into four
phases: incident detection and verification, incident response, clearance of the
incident and recovery to normal traffic flow. Only first two phases are described in this
paper.
Fig. VI.1. - Phases in incident management
Incident detection may be defined as a process of identifying the space and time
coordinates of the incident (incident situation) and possible nature of the incident
itself. Incident detection methods are realised by private calls (phone, mobile
phones), calls from SOS road phones, police report, report of the patrolling services
and the operation of the automatic incident detection system. Incident verification
means checking, which is used to determine the exact position and nature of the
incident. In this way the possibility of responding to false alarms is reduced. Incident
verification is carried out by the employees using the image obtained by specialised
cameras (CCTV), or based on the comparison of several incoming calls about the
incident. Fig. VI.2. shows the basic incident detection/verification methods and
procedures.
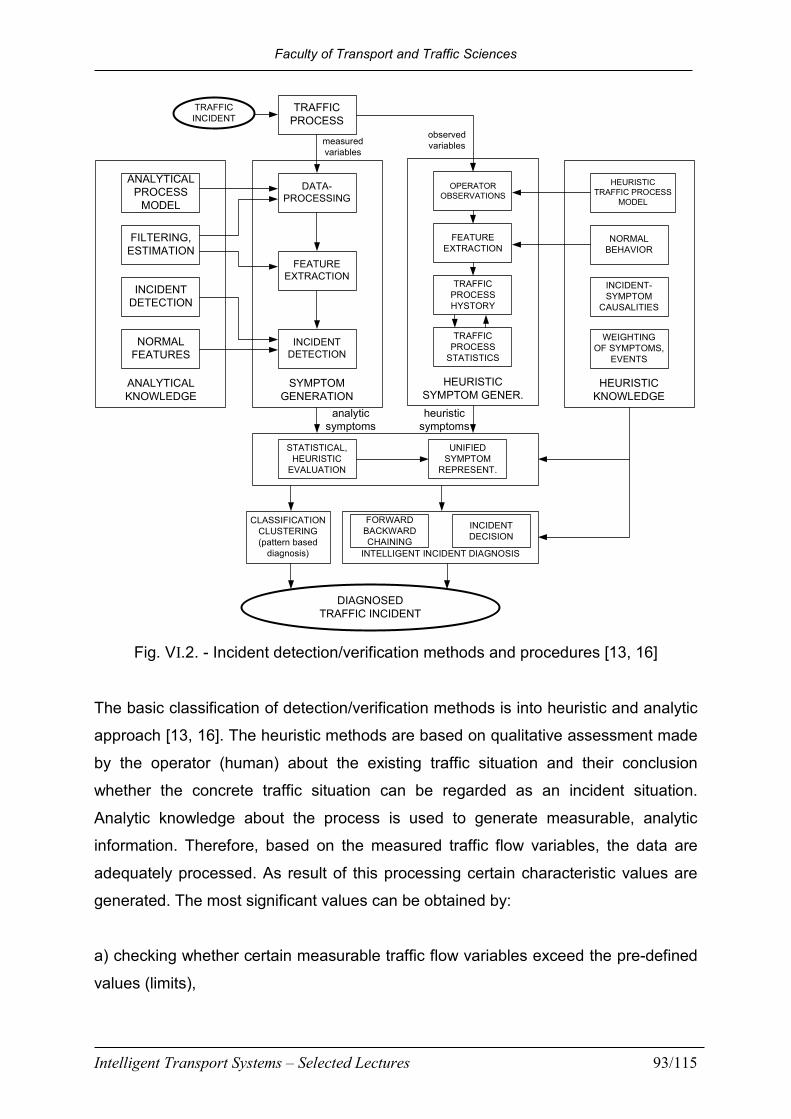
Faculty of Transport and Traffic Sciences
Intelligent Transport Systems – Selected Lectures 93/115
ANALYTICALKNOWLEDGE
ANALYTICALPROCESS
MODEL
INTELLIGENT INCIDENT DIAGNOSIS
CLASSIFICATIONCLUSTERING(pattern based
diagnosis)
STATISTICAL,HEURISTIC
EVALUATION
FORWARDBACKWARDCHAINING
TRAFFICPROCESS
NORMALFEATURES
INCIDENT DETECTION
FILTERING,ESTIMATION
SYMPTOM GENERATION
DATA-PROCESSING
INCIDENT DETECTION
FEATUREEXTRACTION
measuredvariables
TRAFFICINCIDENT
HEURISTICSYMPTOM GENER.
OPERATOROBSERVATIONS
TRAFFICPROCESS
STATISTICS
TRAFFICPROCESSHYSTORY
FEATUREEXTRACTION
HEURISTICKNOWLEDGE
HEURISTICTRAFFIC PROCESS
MODEL
WEIGHTINGOF SYMPTOMS,
EVENTS
INCIDENT-SYMPTOM
CAUSALITIES
NORMALBEHAVIOR
observedvariables
UNIFIEDSYMPTOM
REPRESENT.
analyticsymptoms
heuristicsymptoms
INCIDENTDECISION
DIAGNOSED TRAFFIC INCIDENT
Fig. VI.2. - Incident detection/verification methods and procedures [13, 16]
The basic classification of detection/verification methods is into heuristic and analytic
approach [13, 16]. The heuristic methods are based on qualitative assessment made
by the operator (human) about the existing traffic situation and their conclusion
whether the concrete traffic situation can be regarded as an incident situation.
Analytic knowledge about the process is used to generate measurable, analytic
information. Therefore, based on the measured traffic flow variables, the data are
adequately processed. As result of this processing certain characteristic values are
generated. The most significant values can be obtained by:
a) checking whether certain measurable traffic flow variables exceed the pre-defined
values (limits),
Faculty of Transport and Traffic Sciences
Intelligent Transport Systems – Selected Lectures 94/115
b) analysing the measurable traffic flow variables by using advanced methods of
signal analysis such as correlation function, frequency spectrum, auto-regressive
moving average process (ARMA), and similar,
c) analyses using mathematical models of the process which includes identification of
the road parameters, estimation of the traffic state variables, etc.
In this way, special indicators (coefficients) can be deduced from these characteristic
values, i.e. special filtered and transformed residuals (deviations from the normal
condition). This analysis uses different methods of Traffic Flow Change Detection
and Traffic State Classification Methods.
For this, special importance is on the use of adequate sensor technologies. With
advance in technology and improvement of hardware new incident detection and
verification possibilities are opened up which result in rapid shortening of the time
and increase in reliability. Although inductive loops are the most used and very
reliable technology for vehicle detection, other technologies are becoming
increasingly acceptable as a substitute or addition to inductive loops, especially in
cases when the setting of new or replacement of the existing inductive loops is
difficult to perform or economically unjustified. The selection of adequate
technologies is of special interest in defining the system in road telematics. In this
sense, the selection based on multi-criteria decision-making is of special interest [17,
18, 19].
The detection time is the most important parameter in the incident management
process. For maximally efficient incident management the incident detection time has
to be maximally shortened. Delay in incident detection usually results in queues and
traffic congestion, and often cause secondary incidents which very often multiply
exceed the incident that caused them.

Faculty of Transport and Traffic Sciences
Intelligent Transport Systems – Selected Lectures 95/115
3. MATHEMATICAL MODEL OF ESTIMATING TRAFFIC FLOW
VARIABLES
In the introduction of this paper it was mentioned that the most demanding part in
incident management is the detection procedure on open road sections (freeway).
Since the application by using CCTV cameras on open road sections is still
economically unacceptable, different detection methods are used that are based on
measuring the variables of the traffic flows. During the incident, the normal traffic flow
is disturbed, and this is reflected in the respective traffic flow variables. A simplified
scenario of detection is presented in Fig. VI.3. It gives visual presentation of a typical
traffic incident situation, traffic pattern and respective sensor installations.
Fig. VI.3. – Incident detection principle on open road sections (freeway)
The characteristics of individual traffic flow features during an incident on an open
road section can be described in detail by a traffic flow in four adjacent segments, as
presented in Fig. VI.4. The flow in segment A, far upstream from the incident,
operates at normal speeds with normal density. The flow in segment B, which is
immediately in front of the incident location is characterised by vehicle standstill. This
segment features the phenomenon of upstream propagation of the shock wave. The
speeds are generally low and there is high density of vehicles. The flow in segment
C, which is immediately downstream of the incident is characterised by lower traffic
density than normal and adequate traffic speed is generally higher than normal. The

Faculty of Transport and Traffic Sciences
Intelligent Transport Systems – Selected Lectures 96/115
flow in segment D, which is sufficiently far downstream from the incident, has normal
density and speed, the same as in segment A.
DownstreamUpstream
A B C D
Normal Congestion Metered Normal
Dir
ection
Seg
men
tSpe
edD
ensi
ty
Incident Location
Shock WaveRelative distance
Fig. VI.4. – Traffic flow characteristics during incident [2]
3.1 Discrete mathematical model of traffic flow
The traffic variables estimation is based on the familiarity with the macroscopic
mathematical traffic flow model. The basic equation of the macroscopic mathematical
traffic flow model is the equation of conservation in the following form:
),(),(),(),(
txstxrx
txq
t
tx−=
∂∂
+∂
∂ρ
(1)
where:
ρ - traffic density (veh./km/lane),
q – traffic flow (veh./h),
r – on-ramp inflow (veh./h),
s – off-ramp outflow (veh./h),
t – time coordinate,
x – location coordinate.

Faculty of Transport and Traffic Sciences
Intelligent Transport Systems – Selected Lectures 97/115
For computer model requirement, the upper partial differential equation is space/time
discretized and the set of difference equations is produced. Therefore, the test
section is defined by the model presented in Fig. VI.5.
r 1
s1
q1ρ1, v1
r i si
qiρi, vi
r N
sN
q1NρN, vN
Section
Segment 1 Segment i Segment N
L1 LNLi
Fig. VI.5. – Physical discretisation of the test section
The basic discrete model of individual segment (i) is given in the form:
[ ] [ ] [ ] [ ] [ ] [ ])(1 1 kskrkqkqL
Tkk iiii
i
ii −+−+=+ −ρρ (2)
Where k is a time discretisation step. In the procedure of discretisation of partial
differential equations special attention should be paid to the size of the space/time
step of discretisation. One conservative approach defines the criterion of the size of
the space/time step of discretisation in the form:
if
Lv
T>
(3)
where:
Li – space discretisation value,
T – time discretisation value,
vf – free flow speed.
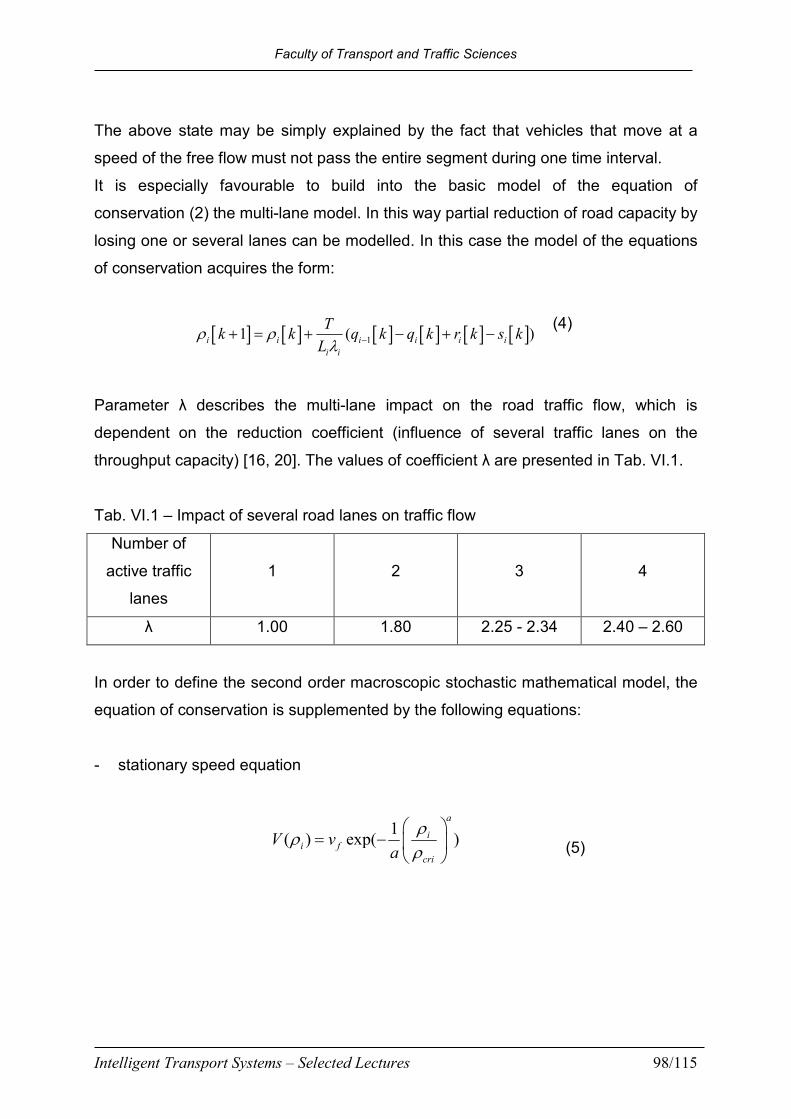
Faculty of Transport and Traffic Sciences
Intelligent Transport Systems – Selected Lectures 98/115
The above state may be simply explained by the fact that vehicles that move at a
speed of the free flow must not pass the entire segment during one time interval.
It is especially favourable to build into the basic model of the equation of
conservation (2) the multi-lane model. In this way partial reduction of road capacity by
losing one or several lanes can be modelled. In this case the model of the equations
of conservation acquires the form:
[ ] [ ] [ ] [ ] [ ] [ ]11 ( )i i i i i i
i i
Tk k q k q k r k s k
Lρ ρ
λ −+ = + − + − (4)
Parameter λ describes the multi-lane impact on the road traffic flow, which is
dependent on the reduction coefficient (influence of several traffic lanes on the
throughput capacity) [16, 20]. The values of coefficient λ are presented in Tab. VI.1.
Tab. VI.1 – Impact of several road lanes on traffic flow
Number of
active traffic
lanes
1
2
3
4
λ 1.00 1.80 2.25 - 2.34 2.40 – 2.60
In order to define the second order macroscopic stochastic mathematical model, the
equation of conservation is supplemented by the following equations:
- stationary speed equation
1( ) exp( )
a
ii f
cri
V va
ρρ
ρ
= −
(5)

Faculty of Transport and Traffic Sciences
Intelligent Transport Systems – Selected Lectures 99/115
- dynamic speed equation
[ ] [ ]
[ ] [ ]
[ ] [ ] [ ]( )
[ ] [ ][ ] [ ]
1
1
1
( ( ) ) ( )
( )
( )
i i
i i
i i i
i
i i v
i
i i
v k v k
TV k v k a
Tv k v k v k b
L
k kTk c
L k
ρτ
ρ ρνξ
τ ρ κ
−
+
+ = +
+ − +
+ − −
−− +
+
(6)
- traffic flow equation
[ ] [ ] [ ] q
i i i i iq k k v kρ λ ξ= ⋅ ⋅ + (7)
The above system of equations is described by the well-known Payne model [21].
The dynamic speed equation describes the actual drivers’ behaviour taking into
consideration the mean traffic flow speed and the traffic state in segment after and in
front of the current segment. Term (a) is convection part, term (b) is relaxation part,
and term (c) defines the anticipation drivers’ behaviour. Parameters , ,τ ν κ describe
the local traffic characteristics of individual segment, and they are obtained in the
procedure of dynamic identification of traffic characteristics of the road section [16,
22]. A special problem lies in determining the statistical characteristics of additive
noise of model v
iξ (standard deviation). One of the possible methods is to use the
approach such as Singer manoeuvre model and its derivatives [23, 24].

Faculty of Transport and Traffic Sciences
Intelligent Transport Systems – Selected Lectures 100/115
3.2 Integral mathematical traffic flow model in state space
In the discrete mathematical model of traffic flow (4, 5, 6, 7) the state variables are
the traffic densities ρi, space mean speeds vi, and traffic flow qi, where i=1,...,N. The
external inputs into the system are boundary conditions of the systems q0, v0 and
ρN+1. In order to model the traffic flow on a road section this flow is usually described
as Brownian dynamic system, that is:
[ ] [ ] [ ]1s k s k n k+ = + (8)
where:
[ ]0 0 1
T
Ns q v ρ += (9)
is the vector of exogenous inputs, and n[k] is a sequence of Gaussian white noise, of
zero mean value and standard deviation depending on the characteristics of the
traffic flow of the concrete segment.
The integral model of the traffic flow for the road section (freeway) can be expressed
in the form:
[ ] [ ] [ ]1 ( )k k k+ = +x f x γ (10)
where:
1 1 ...T
T
N Nv v sρ ρ = x (11)
is vector which defines the traffic state variables, and γ[k] is a sequence of the
Gaussian white noise, of the zero mean value, and standard deviation depending on
the inaccuracy of the mathematical model.
The output equation can be presented in the form:
[ ] [ ] [ ]( )y k g x k kζ= + (12)

Faculty of Transport and Traffic Sciences
Intelligent Transport Systems – Selected Lectures 101/115
where function g(x) describes the used measuring system and measurement
algorithm, and ζ[k] is a sequence of the Gaussian white noise, of the zero mean
value, and standard deviation depending on the accuracy of the measuring system.
Usually it is:
[ ] [ ] [ ] [ ] [ ] [ ]0 0
T
N Ny k q k v k q k v k kζ = + (13)
The measurement procedure depends on the used measuring system. The
optimisation procedure in selecting the measuring system is described in [17].
3.3 Traffic state variables estimator
By using the model of estimation error in the form of the covariance matrix:
[ ] [ ] [ ]( ) [ ] [ ]( ){ }ˆ ˆT
P k E x k x k x k x k= − − (14)
where [ ]x̂ k is the optimal state estimate of state [ ]x k , the goal is to realise the
optimal estimator in the sense of minimising the upper covariance matrix. One of the
approaches is the well-known Extended Kalman Filter [25, 26]. Its standard approach
has the following form:
[ ] [ ]( ) [ ] [ ] [ ]( )ˆ ˆ ˆ1 ( )fx k f x k K k y k g x k+ = + − (15)
where Kf is Kalman filter gain matrix, which is calculated by using the Riccati matrix
equation in the discrete form:
[ ] [ ] [ ] [ ] [ ] [ ] [ ] [ ] [ ] 11 ( )( )T T
fK k F k P k G k M k G k P k G k R k −+ = + + (16)
where the estimation covariance matrix is calculated recursively in the form:

Faculty of Transport and Traffic Sciences
Intelligent Transport Systems – Selected Lectures 102/115
[ ] [ ] [ ] [ ] [ ] [ ] [ ] [ ] [ ]1 ( )T T
f fP k F k K k G k P k F k Q k K k M k+ = − + − (17)
In the above equations certain terms are:
[ ][ ]
[ ][ ]
ˆ
ˆ
x x k
x x k
fF k
x
gG k
x
=
=
∂=
∂
∂=
∂
(18)
Jacobian matrices which describe the linearised system around estimated state, and
matrices Q, R and M adequate covariance matrices of excitation noise, measurement
and cross-covariance of excitation and measurement. There is the possibility of
implementing different approaches in determining their values [23, 24]. In using the
above algorithm (in one of different applicable versions) the real-time estimate of
traffic state variables on the selected road segment is achieved. The selected
structure of the model facilitates various possibilities of simulating the incident events
(blocking traffic in one or several lanes, complete traffic standstill, traffic congestion
on road section, etc.). In order to model the influence of merging vehicles on the
inflow ramp, the above model can be extended by adequate members of influence in
the dynamic speed equation [27, 28, 29].
By using the presented estimate procedure, based on the traffic measurement on a
limited number of points of a certain section, it is possible to reconstruct the traffic
signature per single segment. These data are the starting element for the usage of
the algorithms of automatic traffic incidents detection.

Faculty of Transport and Traffic Sciences
Intelligent Transport Systems – Selected Lectures 103/115
4. AUTOMATIC DETECTION OF TRAFFIC INCIDENTS ON OPEN
ROAD SECTIONS
In the introduction to this paper it was said that the implementation of CCTV cameras
on open road sections /freeway) is still economically unacceptable. For the incident
detection requirements various methods based on the estimate of traffic state
variables are used. Based on the good estimate of traffic state variables the detection
of possible traffic anomalies is carried out. This area generally belongs to the part of
the general classification theory.
As the measure of the quality of success of a certain algorithm the following
indicators are used [30, 31].
a) DR – Detection Rate is the ratio of the number of detected incidents and the
total number of actual incidents,
b) FAR – False Alarm Rate is the ratio of the number of “false” detected incidents
and the total number of detection algorithm decisions,
c) TTD – Time to Detection is the time interval from the moment of incident to the
moment when the incident has been detected, and it does not include the time
necessary for incident verification.
The relation of the detection rate (DR) and false alarm rate (FAR) is not independent
and it behaves qualitatively as presented in Fig. VI.6. This figure shows the optimal
area of parameters DR and FR. Insisting on the increase in the detection rate above
these values leads to unacceptable growth in false alarm rates (the “price” of
increasing the detection rate is connected with the significant rise in “false” alarms).
.

Faculty of Transport and Traffic Sciences
Intelligent Transport Systems – Selected Lectures 104/115
Fig. VI.6. – Theoretical model of DR and FR relation
In past research and implementation, the algorithms of automatic incident detection
in traffic could be divided into the following approaches:
1.) Statistical theory;
2.) Pattern based algorithms;
3.) Catastrophe theory;
4.) Artificial intelligence.
Statistical theory
Such approach was developed as early as in the 1970s and it is based on the
statistical deduction of the relation of measurement and estimated state of “normal”
traffic. The especially appropriate method is based on the Bayesian algorithms of
calculating the probability of incident occurrence in the downstream area [32]. The
algorithm calculates the conditional probability that the traffic has “deteriorated” due
to an incident.
Faculty of Transport and Traffic Sciences
Intelligent Transport Systems – Selected Lectures 105/115
Pattern based algorithms
Algorithms based on the pattern theory are usually algorithms in present operative.
They operate on the principle of traffic flow occupancy, traffic volume and information
on the traffic flow which are usually taken over from the measurement system. By
sample identification in the data that are not considered “normal” for a certain road,
the potential incident is recognised. The best known representative of this approach
in automatic incident detection is the so-called California algorithm, developed in the
late 1960s for the usage on the Los Angeles highway [33]. The algorithm is based on
three tests that are performed on the data about the passage between two adjacent
detectors, and the calculation of “thresholds” with which the results are to be
compared. If the planned threshold is exceeded, incident is pronounced.
Catastrophe theory
The catastrophe theory is a relatively older scientific discipline originated from the
theory of sensitivity. It studies the influence of minor changes of single parameters on
the total system behaviour. In case of incident detection in traffic these are speed,
flow and occupancy of the traffic space. For instance, when speed is significantly
reduced, without respective increase in occupancy and flow, this will result in incident
announcement. The algorithms based on the catastrophe theory can distinguish
between the incident and normal congestion. Congestions are created gradually,
whereas incidents cause sudden changes which drastically affect the current flow
speed. The representative of algorithms which belongs to this group is the McMaster
algorithm [34]. Basically, it uses the model of catastrophe theory to describe the flow
– lane occupancy relation.
Artificial intelligence
Algorithms based on artificial intelligence use different procedures of Fuzzy logics
and Artificial Neural Networks (ANN). In the early 1990s the researchers at the
Faculty of Transport and Traffic Sciences
Intelligent Transport Systems – Selected Lectures 106/115
University in California presented the possibility of using artificial neural network for
incident detection [35, 36]. The artificial neural network consists of three layers: input
layer which receives the data from the measurement system, hidden layer which
processes the data and external layer which generates the signal depending on
whether it is an incident or normal traffic flow state. In application of artificial neural
network the selection of adequate learning examples is of special importance. The
“intelligence” of these methods depends most on this selection. Today the orientation
is increasingly towards the structures known as neuro-fuzzy expert systems.
The recent approaches in incident detection in traffic are based on the usage of
several different approaches through the decision support system (DSS) [15].
Usually, such decision support systems are based on the voting principle, with built-in
restrictions.
5. DECISION SUPPORT SYSTEM FOR INCIDENT MANAGEMENT
The latest research in the field of automatic incident detection in traffic refers to the
usage of complex systems that use different sources of information and processing
procedures [15, 37]. Such solutions lead to the proposal of using the decision support
system. The information flow in one such system is presented in Fig. VI.7. Such
systems require significant integration of information from various sources. The past
experiences, namely, of implementing the traffic incident detection system show
significant correlation of different causes of incident occurrence. In this sense
different procedures of information fusion are proposed, with the aim of improved
detection (better level of detection, reduction of false alarms, and shortening of time
necessary for safer detection).

Faculty of Transport and Traffic Sciences
Intelligent Transport Systems – Selected Lectures 107/115
Fig. VI.7. – Information flow model in IMDSS
Apart from the standard parts, a system like this has the following functionalities:
• monitoring and reporting of the services in the field,
• predictive estimate of danger, dangerous spots and law violation,
• real-time monitoring of vehicles and creation of traffic situation picture,
• saving and referencing of all events related to the incident,
Faculty of Transport and Traffic Sciences
Intelligent Transport Systems – Selected Lectures 108/115
• real-time reconstruction of events,
• intelligent contact lists of the crucial participants in incident management,
• generation of automatic messages that are forwarded to different control
panels in control centres, different agencies, technical groups or individuals.
In construction of such systems one should pay attention that several factors affect
the quality of the operation of the incident detection subsystem. The crucial factor is
the currently operative condition of the road (freeway) in relation to its design
capacity. The experience shows, namely, that it is very difficult to determine that a
traffic incident has occurred on the road, in case when the current traffic is
significantly lighter than the highway capacity. This is the consequence of information
insufficiency. Besides, the variations in traffic flow have a daily rhythm, with two -
three peaks in the hours of the busiest traffic. In this case, these daily and hourly
variations in traffic exclude the application of simple threshold algorithms. Such
algorithms do not recognise the nature of temporal variation of traffic picture during
the day.
The grade of the road, the change in the number of lanes and the existence of
approach ramps makes the identification of certain traffic situations difficult, as well
as the patterns of single traffic incidents. Similarly, the external factors such as the
condition of road surface and meteorological condition will affect the traffic picture
regardless of the incident occurrence (for example heavy rain and snow change the
picture of the traffic flow).
The performances of simple detection algorithms that use the comparison of
measurements on two or more spaced detectors depend significantly on the gap
between detector stations. The presence of approach ramps, lane merging and other
geometrical road characteristics need to be considered with special attention. Good
starting basis for the determination of the positions of detector stations is that the
same throughput conditions on the selected measurement segment are valid.
In the previous studies have shown that vehicle heterogeneity on the road section
significantly affect the performances of the detection algorithm, [31, 37]. Most of the
algorithms assume large participation of the vehicles of the same type, which dictate
a certain picture of the traffic flow. A disproportionate percentage of big trucks will
have the tendency of slowing down the traffic and increase the headway. This may

Faculty of Transport and Traffic Sciences
Intelligent Transport Systems – Selected Lectures 109/115
cause such a change in the picture of the traffic flow, that some detection algorithms
pronounce this as incident.
All the mentioned elements indicate the need for application of a far more complex
structure. Some experiences in the application of the decision support system, as
expert systems derivative, indicate the possibility of these artificial intelligence
technologies. Such approach allows the installation of knowledge bases and
inference engines that have the capacity of high-quality processing of such complex
information.
6. CONCLUSION
The objective of this paper is to present the possibilities of achieving maximally
effective and efficient development and implementation of the real-time traffic incident
management system. It emphasises the special significance on the timely incident
detection. The efficient management of available information, data exchange as well
as intelligent real-time decision-making can reduce the consequences of traffic
incidents, especially, prevent secondary incidents. Advanced inventive technologies
and the approach based on the intelligent transport system paradigm, significantly
improve the system performances. The main performance characteristics taken into
consideration are response time and reduction of harmful consequences from
incidents. .
The future work should study the possibilities of different realisations of the algorithm
for traffic flow variables estimation. Therefore, a promising approach is based on the
implementation of neuro-fuzzy estimators, which may include also the incident
detection algorithms. The authors’ opinion is certainly that such systems will lead in
the future to technologies based on the today already proven approach to the
decision support system i.e. expert systems. Special effort should be directed also to
the study of the possibility of predicting the incident. Some past researches have
shown that in some situations an incident can be predicted (forecast) with fairly
sufficient probability. In that case, the final results referring to the prevention of the
incident itself can be of great significance.

Faculty of Transport and Traffic Sciences
Intelligent Transport Systems – Selected Lectures 110/115
7. LITERATURE
[1] Bošnjak, I., Intelligent Transportation Systems 1, Faculty of Transport and
Traffic Sciences, Zagreb, 2006 (in Croatian)
[2] Intelligent Vehicle Highway Systems: The State of the Art, JHK and Associates,
New York, NY, March 1993
[3] Hegyi, A., Girimonte, D., Babuska, R., & De Schutter, B., A comparison of filter
configurations for freeway traffic state estimation. In Proceedings of the 9th
international IEEE conference on Intelligent Transportation Systems, 2006
[4] Roy, P., Abdulhai, B., GAID: Genetic adaptive incident detection for freeways,
TRB 82nd Annu. Meeting, Washington, DC, 2003.
[5] Škorput, P., Real-time incident management system, M.Sc. Thesis, Faculty of
Transport and Traffic Sciences, Zagreb, 2009 (in Croatian)
[6] Dudek, C.L, Messer, C.J. and N.B. Nuckles, N.B, Incident detection on urban
freeways. Transportation Research Record, 495 pp. 12-24., 1994.
[7] Dia, H., Rose, G., Snell, A., “Comparative performance of freeway automated
incident detection algorithms,” in Proc. Roads 96: Joint 18th ARRB Transp. Res.
Conf. and Transit New Zealand Land Transp. Symp., pt. 7, pp. 359–374, 1996
[8] Papageorgiou, M., Blosseville, J.-M., & Haj-Salem, H., Modelling and real-time
control of traffic flow on the southern part of Boulevard Périphérique in Paris, Part I:
Modelling. Transportation Research A, 24, 345-359, 1990
[9] Kotsialos, A., Papageorgiou, M., The importance of traffic flow modelling for
motorway traffic control, Networks and Spatial Economics, 1, 179-203, 2001
[10] Wang, Y., Papageorgiou, M, & Messmer, A., Real-time freeway traffic state
estimation based on extended Kalman filter: A case study. Transportation Science,
41, 167-181, 2007
[11] Cremer, M., Flow variables: estimation. In: Concise Encyclopedia of Traffic and
Transportation Systems. Pergamon Press, 143–148., 1991.
[12] Wang, Y., Papageorgiou, M., Messmer, A., Renaissance–A unified
macroscopic model based approach to real-time freeway network traffic surveillance,
Transportation Research Part C 14, 190–212, 2006

Faculty of Transport and Traffic Sciences
Intelligent Transport Systems – Selected Lectures 111/115
[13] Isermann, R., Process faults detection based on modelling and estimation
methods, A survey, Automatica 20 (4), 387-404, 1984
[14] Willsky, A. S., A survey of design methods for failure detection in dynamic
systems, Automatica 12, 601-611, 1976
[15] Mitrovich, S., Valenti, G., Mancini, M., A Decision Support System (DSS) for
Traffic Incident Management in Roadway Tunnel Infrastructure, Association for
European Transport and contributors, 2006
[16] Mandžuka, S., Application of artificial neural networks in intelligent telematics,
TEB Elektronika, Zagreb, 2010 (in Croatian)
[17] Jelušić, N.: The Evaluation of Sensor Technology in Automatic Road Traffic
Control System, Ph Thesis, Faculty of Traffic and Transport Sciences University of
Zagreb, 2008 (in Croatian)
[18] Jelušić, N., Anžek, M., Ivanković, B., Information Source Quality in Intelligent
Transport Systems, Promet-Traffic-Transportation, 125-134, 2010
[19] Jelušić, N., Anžek, M., Mandžuka, S., Evaluation of sensor technologies for
ITS, Proceedings of 16th ITS World Congress, Stockholm: Ertico, 2009
[20] Legac, I., Roads 1, Public Roads, Faculty of Transport and Traffic Sciences,
2006, (in Croatian)
[21] Payne H.J., Models of freeway traffic and control, Mathematical Models of
Public Systems, (G.A. Bekey, ed.), Vol. 1, No. 1, Simulation Council Proceedings
Series, pp. 51-61, La Jolia, California, 1971
[22] Papageorgiou M., Dynamic modeling, assignment, and route guidance in traffic
networks, Transportation Research B, vol. 24B, no 6, pp. 471-495, 1990
[23] Li, X.R., Jilkov, V.P.,Survey of Maneuvering Target Tracking, Part I: Dynamic
Models, IEEE Transactions On Aerospace and Electronic Systems Vol. 39, No. 4,
2003
[24] Mandzuka, S., Ship tracking control: Optimal estimation of navigation
parameters, In Proceedings of the 42th International Symposium, ELMAR, Zadar,
2000
[25] Jazwinsky, A. H., Stochastic processes and filtering theory. NewYork:
Academic Pres, 1970
[26] Sorenson, H. W., Kalman filtering: Theory and application, IEEE Pres, New
York, 1985

Faculty of Transport and Traffic Sciences
Intelligent Transport Systems – Selected Lectures 112/115
[27] Wang, Y., & Papageorgiou, M., Real-time freeway traffic state estimation
based on extended Kalman filter: A general approach. Transportation Research B,
39, 141-167, 2005
[28] Wang, Y., Papageorgiou, M., & Messmer, A., An adaptive freeway traffic state
estimator and its real data testing, Part II: Adaptive capabilities. In Proceedings of
IEEE 8th international conference on intelligent transportation systems, 537-542,
2005
[29] Wang, Y., Papageorgiou, M, & Messmer, A., Real-time freeway traffic state
estimation based on extended Kalman filter: A case study. Transportation Science,
41, 167-181, 2007
[30] Ritchie, S.G., Cheu, R.L., Simulation of Freeway Incident Detection Using
Artificial Neural Networks, Transportation Research Part C: Emerging Technologies.
Vol. 1, No. 3. Pergamon Press, 1993.
[31] Al-Deek M., Implementation of Incident Detection Algorithms, UCF
Transportation Systems Institute, August 1999.
[32] Levin, M., Krause, G., Incident Detection: A Bayesian Approach.
Transportation Research Record 682 (52-58), 1978.
[33] Payne, H.J., Tignor, S.C., Freeway Incident Detection Algorithms Based on
Decision Trees with States, Transportation Research Record 682 (30-37),1978.
[34] Antoniades, C.N., Stephanedes, Y.J., Single-Station Incident Detection
Algorithm (SSID) for Sparsely Instrumented Freeway Sites. Transportation
Engineering, 1996.
[35] Stephanedes, Y.J., Liu, X., Artificial Neural Networks for Freeway Incident
Detection. Transportation Research Record 1494 (91-97), 1995.
[36] Ritchie, S.G., Cheu, R.L., Simulation of Freeway Incident Detection Using
Artificial Neural Networks. Trasportation Research Part C. Volume 1, (313-331).
Pergamon Press, New York, 1993.
[37] Zografos K.G., Androutsopoulos K.N., Vasilakis G.M., A real-time decision
support system for roadway network incident response logistics, Transportation
Research Part C: Emerging Technologies, 10 (1), 2002