intelligent compaction workshop on mechanistic based qc/qa
TRANSCRIPT
Center for Earthworks Engineering Research
Intelligent Compaction Workshop on Mechanistic Based QC/QA
Presenter:David J. White, Ph.D., P.E.President and Chief Engineer
Technology Transfer for Intelligent Compaction Consortium (TTICC)Federal Highway Administration Pooled Fundy Study TPF-5(233)

Center for Earthworks Engineering Research
Overview of different IC measurements for Soils, Aggregate, and HMA
CMV and OMVIndex Values
ks or Evib values
MDP valuesWorks in both Static and VibratoryModes
Works in VibratoryMode

Center for Earthworks Engineering Research
IC measurements have a deeper measurement influence depth than other in situ tests
Static Cone Penetration Test (CPT)
Width (m)0 1 2 3 4 5 6 7 8
Dep
th (m
)
0.00.30.60.91.21.51.82.12.42.73.0
300 mm dia.LWDa/FWDa,d
Nuclear Density Gaugec
Dynamic Cone
Penetrometer (DCP)
Notes:a Influence depths for LWD/FWD are assumed ~ 1 x B (width)b Influence depth of soil stiffness gauge ~ 0.23 mm (ASTM D6758-08)c Maximum penetration depth for Nuclear density gauge = 0.3 m
Soil StiffnessGaugeb
Typical penetration depth ~ 1m
Extensionup to ~ 3m
B = 2.1 m B = 0.3 m
Compaction layerInfluence depth = 0.8 to 0.9 m
(this study)
Impact ForceFrom Rollers
X X X X X X X2.1 m
In-situ point test measurementsArea over which the roller MV’s are averaged
Distance = Roller travel in approx. 0.1 to 0.5 sec.
1.5 m (ISSMGE 2005)
X
0.3 m spacingGeophones
Deflection Basin
X
> 3m
Vennapusa et al. (2012)

Center for Earthworks Engineering Research
“Weak” areas in subgrade reflect to the surface
0 5 10 15 20 25 30 35 40 45 50 55
E VIB
(MPa
)
0306090
120150180
0 5 10 15 20 25 30 35 40 45 50 55
E VIB
(MPa
)
0306090
120150180
a = 0.70mm
Distance (m)
0 5 10 15 20 25 30 35 40 45 50 55
E VIB
(MPa
)
0306090
120150180
a = 0.70 mm
a = 0.70 mm
Base Layer 2
Base Layer 1
Subgrade
3
2
1
Clay Subgrade – Subgrade (10-12 inches)
Aggregate Base – Base Layer 2 (6 inches)
Aggregate Base – Base Layer 2 (6 inches)
1
2
3
E VIB
Base Layer (1)
Base Layer (2)
~ 20
0 ft
~ 40 ft ~ 40 ft
Hard subsurface layer reflecting through surface compaction layer
Aggregate Base – Base Layer 1 (6 inches)

Center for Earthworks Engineering Research
IC measurements over eight passes on lime stabilized subgrade show compaction improvement
Dis
tanc
e (m
)
0
20
40
60
80
100
120
140
160
180
Pass 1 2 3 4 5 6 7 8
Lane12345
Wet Area
White et al. (2008)

Center for Earthworks Engineering Research
Perspective from contractor after using the IC roller on an earthwork project in Iowa
• “You can add a lot of road life with (road base) uniformity,” Taylor said. “States spend a lot of their transportation money on maintenance. If the base has no weaknesses, you’ll only have to replace a wear course from time to time. That is a huge cost savings at a time when every dime is being watched.”
• “Most of those passes are a waste,” Taylor said. “Many times on jobsites, we could probably get compaction densities with haul trucks. We might not even need rollers. But the specs call for eight passes, so we make them.”
• “You can’t leave technology like this on the shelf,” he said. “You would have better measurements, and better roads, at a lower cost. Those are tough points to argue.”

Center for Earthworks Engineering Research
Statistics shows that risk is quantified and related to QC/QA test frequency
7111520>20
CMV
w/calibration
Typical # of samples/acre
VIC
$$$ too high to increase!

Center for Earthworks Engineering Research
Intelligent Compaction Workshop on Mechanistic Based QC/QA: Illinois Tollway
Presenter:David J. White, Ph.D., P.E. (Co-PI)President and Chief Engineer
Co-Authors:Prof. Erol Tutumluer, Ph.D. (PI)Pavana Vennapusa, Ph.D., P.E.William (Bill) Vavrik, Ph.D., P.E.Maziar Moaveni, Ph.D.Steven Gillen, P.E.

Center for Earthworks Engineering Research
What value do you select to represent pavement foundation modulus...?
Res
ilien
t Mod
ulus
, Mr
Distance
Over-design, $
Under-design, $$$
Varia
bilit
y

Center for Earthworks Engineering Research
A better question might be… how can we field control and verify design assumption's?
Res
ilien
t Mod
ulus
, Mr
Distance
“Precision Roadbuilding”
Varia
bilit
y

Center for Earthworks Engineering Research
Research Goals for Intelligent Compaction (IC) for Earthwork and Aggregates:
o Depend less on spot checks and density measurementso Apply to performance related or based specificationso Expedite construction by putting more control in the hands
of the operator / contractoro To make design – build projects easier to implement with
more construction quality based on engineering performance, not specified means and methods
o Most importantly to build pavements more efficiently, cost wise, and better performing

Center for Earthworks Engineering Research
Why Link IC to Modulus? Stiffness or modulus is a better predictor of
pavement response under traffic loading Modulus better indicates the compactability for
recycled materials that vary in specific gravity Higher modulus commonly relates well to better
rutting resistance Modulus of a pavement base is used in M-E
pavement design
Center for Earthworks Engineering Research
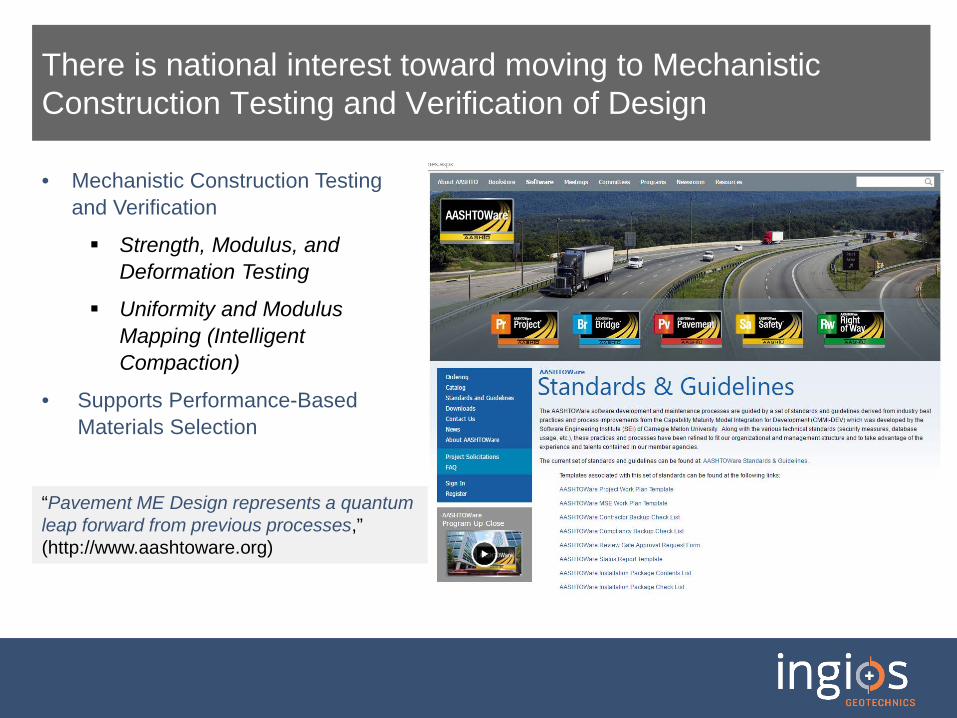
• Mechanistic Construction Testing and Verification
Strength, Modulus, and Deformation Testing
Uniformity and Modulus Mapping (Intelligent Compaction)
• Supports Performance-Based Materials Selection
“Pavement ME Design represents a quantum leap forward from previous processes,” (http://www.aashtoware.org)
There is national interest toward moving to Mechanistic Construction Testing and Verification of Design

Center for Earthworks Engineering Research
Illinois Tollway Research Objectives
(1) Create a synthesis of literature that identifies methods used to compare IC measurements to soil mechanical properties, and the success of those methods.
(2) Develop a criteria or procedure for field validating the relationship between IC measurements and soil mechanical properties.
(3) Demonstrate the field calibration process using three different IC technology providers.

Center for Earthworks Engineering Research
Concept of Field Certification / Calibration and Verification Process in Relationship with Design Assumed Mechanical Properties
Calibrate IC values in situ with mechanical measurement value needed (target high R2 values > 0.9)

Center for Earthworks Engineering Research
Summary of Range of R2 Values between Different IC Measurement Values

Center for Earthworks Engineering Research
Calibration performed to measure:
• APLT – In situ Composite Resilient Modulus (Mr-Comp) at 5 psi to 40 psi cyclic stresses at surface
• APLT – In situ Layered Resilient Modulus (RAP+PGE and Subgrade) at 5 psi to 40 psi cyclic stresses at surface
• APLT – In situ modulus of subgrade reaction (static k-value)
• DCP – CBR of RAP+PGE and Subgrade
• LWD – Dynamic Elastic Modulus (~15 psi dynamic stress)

Center for Earthworks Engineering Research
Test Section 1 (10/13/16) using Hamm H 11i System

Center for Earthworks Engineering Research
Test Section 3 (10/13/16)
RAMP

Center for Earthworks Engineering Research
Test Section 3: PGE5 LWD tests5 DCP testsOnly in the ramp area
0 50 100 150 200 250
0.0
6.0
12.0
18.0
24.0
30.0
0.1 1.0 10.0 100.0
Cumulative Blows
Dep
th (i
nche
s)
California Bearing Ratio, CBR (%)
CBR Cumulative Blows Interface
DCP 53
DCP 53
QA TargetCBR = 2.54 blows/6 in.

Center for Earthworks Engineering Research
HAMM H11 Smooth Drum Roller – HMV ReportPROJECT NAME: Validation of Intelligent Compaction to Characterize Pavement Foundation Mechanical PropertiesPROJECT ID: ILT_IC ProjectLOCATION: Elgin O’Hare Expressway, Elgin, IL
DATE: 10/18/2016
OPERATOR: PLOTE
0 62.5 125 250 375 500Feet
< 55-1010-1515-20>20
HMV
Bridge Approach Backfill
Center for Earthworks Engineering Research
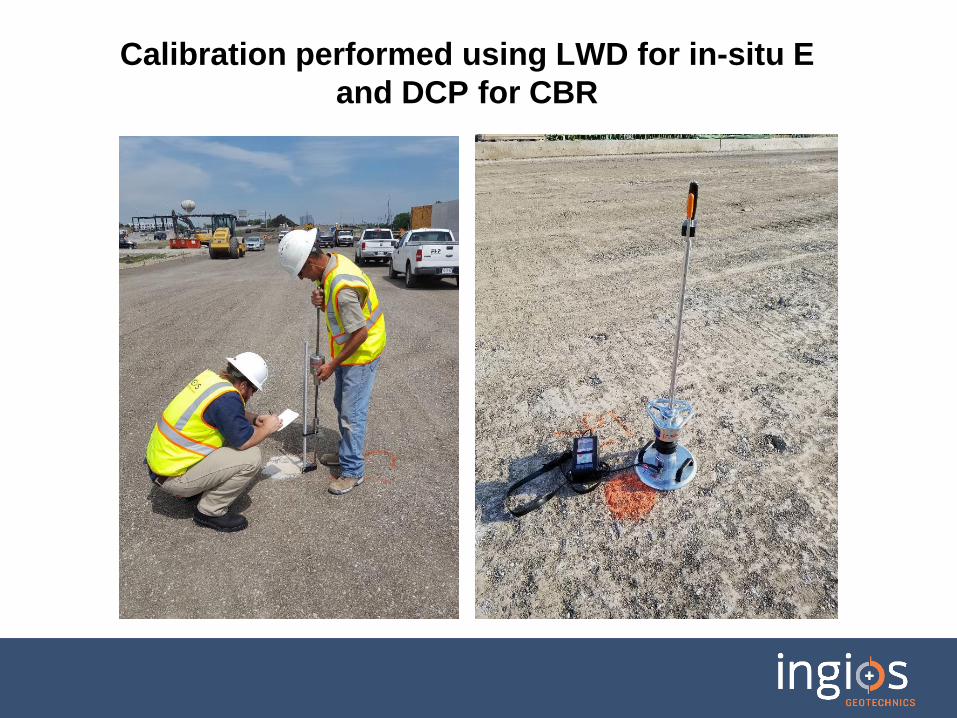
Calibration performed using LWD for in-situ E and DCP for CBR

Center for Earthworks Engineering Research
Modest Correlation Quality Combining All Test Sections

Center for Earthworks Engineering Research
TS14: Subgrade LayerThorndale Ave (EB)Just West of Hamilton Lakes Dr. Overpass

Center for Earthworks Engineering Research
TS15: PGE Layer (placed over TS14)Thorndale Ave (EB)Just West of Hamilton Lakes Dr. Overpass
Center for Earthworks Engineering Research
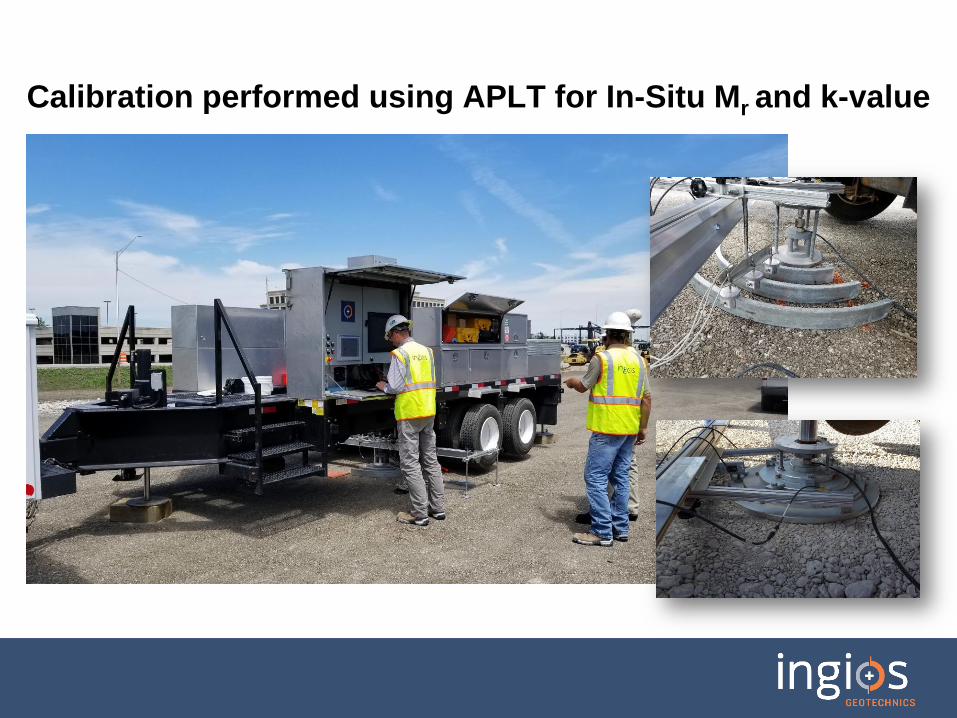
Calibration performed using APLT for In-Situ Mr and k-value

Center for Earthworks Engineering Research
Test:Date: Time: Test IDTested By Location: Sta.Latitude,N: Longitude,W: Elev. (ft):Comments:
Step Nσcy clic
[psi] Mr-comp [psi]Mr-comp (pred.)
[psi]δp
[in.]∆δp
[in.]d =∆log(δp)/ ∆log(N)
Near-linear Elastic
Conditioning 500 14.78 --- --- 0.0230 --- 0.198 ---1 100 4.74 40,146 39,993 0.0228 -0.0003 -0.255 Y2 100 9.93 37,282 37,907 0.0231 0.0001 0.397 Y3 100 14.78 37,837 37,182 0.0243 0.0013 0.493 Y4 100 19.99 36,788 36,875 0.0267 0.0037 0.642 Y5 100 29.95 36,776 36,872 0.0351 0.0121 0.694 N6 100 39.80 37,222 37,210 0.0454 0.0223 0.829 N
Model: AASHTO (2015)
Parameter Value P-Valuek*1 2,570.6 1.61E-08k*2 -0.109 3.98E-02k*3 0.522 9.11E-02Adj. R2 0.867Std. Error [psi] 436
41,643σcyclic-BP [psi] 3.0
Project Name: Illinois Tollway - IC Research Project ID: Elgin O'Hare Extension - IL TollwayLocation: IL390 (West of O'Hare), Itasca, IL
RAP CA6 testing, east bound Thorndale Ave. b/w/ Hamilton Lakes Dr. and No. Arlington Heights Rd.
DW, HG, PV, JV6/21/2017
In-situ Resilient Modulus [Mr]: Cyclic Loading, Composite, Stress-Dependent
71041.983776 88.010727
Mr-comp (pred.)-BP [psi]
Automated Plate Load Test [APLT]In-situ Resilient Modulus [Mr]: Cyclic Loading, Composite, Stress-Dependent (5, 10, 15, 20, 30, 40)
TS_13_SG NAILT_12_Mr_pt64:52:56 PM
No image.
0
0.01
0.02
0.03
0.04
0.05
0.06
0.07
0.08
0.09
0.1
0 200 400 600 800 1000
δ p[in
.], δ r
[in.]
Loading Cycles, N
Permanent [in.]Recoverable [in.]
0
10,000
20,000
30,000
40,000
50,000
60,000
70,000
80,000
90,000
100,000
0 10 20 30 40 50
Mr-
com
p.[p
si],
Mr-
com
p (p
red.
) [ps
i]
σcy clic [psi]
Mr-comp [psi]Mr-comp (pred.) [psi]BP
𝑀𝑟−𝑐𝑜𝑚𝑝 = 𝑘1∗𝑃𝑎𝜃𝑃𝑎
𝑘2∗1 + 𝜏𝑜𝑐𝑡
𝑃𝑎
𝑘3∗
APLT to measure composite resilient modulus for cyclic stresses of 5, 10, 15, 20, 30, and 40 psi
Deflection basis measurement kit

Center for Earthworks Engineering Research
Test:Date: Time: Test IDTested By Location: Sta.Latitude: Longitude: Elev. (ft):Comments:
Step Nσcy clic_surf ace
[psi] Mr-Base[psi]Mr-Base (pred.)
[psi]σcy clic_Int.
[psi]
Mr-Subgrade
[psi]Mr-Subgrade
(pred.) [psi]Modulus
Ratio
Conditioning 500 14.78 --- --- --- --- --- ---1 100 4.74 47,208 47,059 1.79 32,080 31,851 1.472 100 9.93 49,576 50,407 3.51 26,619 27,100 1.863 100 14.78 53,570 52,483 5.01 25,154 25,084 2.134 100 19.99 54,120 54,243 6.66 24,027 23,832 2.255 100 29.95 56,455 56,925 9.69 22,906 22,774 2.466 100 39.80 59,299 59,088 12.58 22,391 22,525 2.65
Model: AASHTO (2015)
Parameter Value P-Valuek*1 (Base) 3243.9 2.19E-08k*2 (Base) 0.080 1.11E-01k*3 (Base) 0.191 4.89E-01Adj. R2 0.972Std. Error [psi] 729k*1 (Subgrade) 1260.0 1.01E-06k*2 (Subgrade) -0.432 2.13E-03k*3 (Subgrade) 2.607 1.32E-02Adj. R2 0.993Std. Error [psi] 297
Project Name: Illinois Tollway - IC Research Project ID: Elgin O'Hare Extension - IL TollwayLocation: IL390 (West of O'Hare), Itasca, IL
In-situ Resilient Modulus [Mr]: Cyclic Loading, Layered Analysis, Stress-Dependent
41.983776 88.010727 710RAP CA6 testing, east bound Thorndale Ave. b/w/ Hamilton Lakes Dr. and No. Arlington Heights Rd.
DW, HG, PV, JV TS_13_SG NA
Automated Plate Load Test [APLT]In-situ Resilient Modulus [Mr]: Cyclic Loading, Composite, Stress-Dependent (5, 10, 15, 20, 30, 40)
6/21/2017 4:52:56 PM ILT_12_Mr_pt6
-
10,000
20,000
30,000
40,000
50,000
60,000
70,000
80,000
90,000
100,000
0 10 20 30 40 50
Mr-
Bas
e an
dM
r-S
ubgr
ade.
[psi
]
σcy clic [psi]
Mr-Base[psi]Mr-Base (pred.) [psi]Mr-Subgrade [psi]Mr-Subgrade (pred.) [psi]
𝑀𝑟 = 𝑘1∗𝑃𝑎𝜃𝑃𝑎
𝑘2∗1 + 𝜏𝑜𝑐𝑡
𝑃𝑎
𝑘3∗
0 50 100 150 200 250
0.0
3.0
6.0
9.0
12.0
15.0
18.0
21.0
24.0
27.0
30.0
33.0
36.0
0.1 1.0 10.0 100.0
Cumulative Blows
Dep
th [i
n.]
California Bearing Ratio, CBR [%]
CBR Cum. Blows Interface
00.0020.0040.0060.008
0.010.0120.0140.016
6 12 18 24δr
[in.
]
Distance away from plate center, [in.]
Deflection Basin
APLT to measure layered analysis resilient modulus for cyclic stresses of 5, 10, 15, 20, 30, and 40 psi
Subgrade (stress-softening)
Base (stress-stiffening)
Deflection basis measurement

Center for Earthworks Engineering Research

Center for Earthworks Engineering Research
VIC Calibration Performed on Subgrade, PGE, and RAP Materials: 06/21-06/23/2017
CS56 Smooth Drum Outfitted with
VIC Data Analytics
RAP Capping, Subgrade, and PGE`
Center for Earthworks Engineering Research
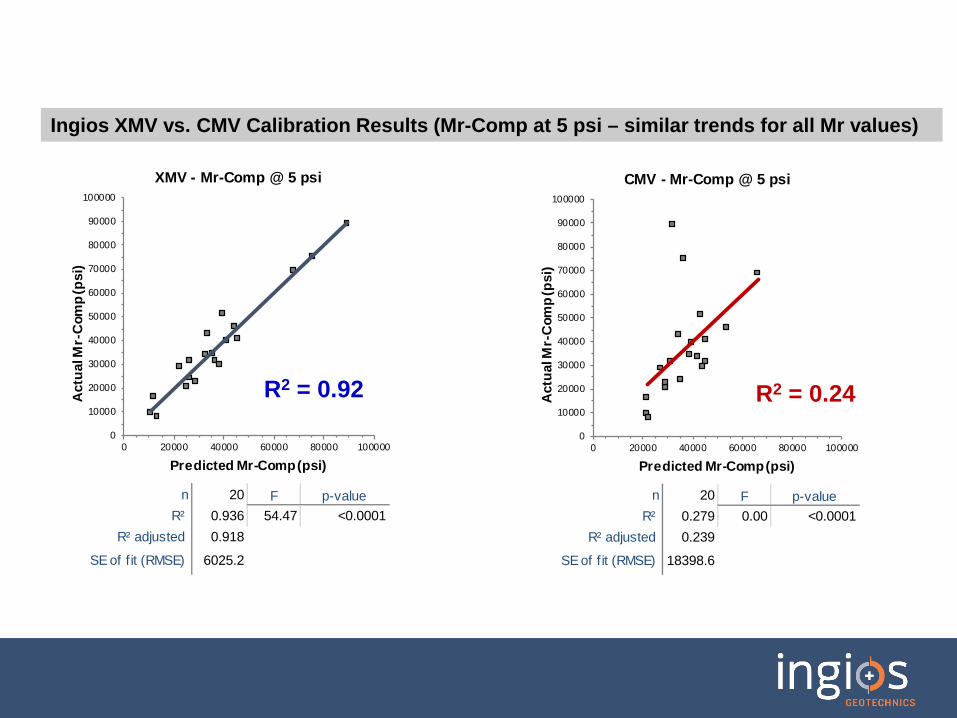
n 20 F p-valueR² 0.936 54.47 <0.0001
R² adjusted 0.918
SE of f it (RMSE) 6025.2
0
10000
20000
30000
40000
50000
60000
70000
80000
90000
100000
0 20000 40000 60000 80000 100000
Act
ual M
r-C
omp
(psi
)
Predicted Mr-Comp (psi)
XMV - Mr-Comp @ 5 psi
n 20 F p-valueR² 0.279 0.00 <0.0001
R² adjusted 0.239
SE of f it (RMSE) 18398.6
0
10000
20000
30000
40000
50000
60000
70000
80000
90000
100000
0 20000 40000 60000 80000 100000
Act
ual M
r-C
omp
(psi
)
Predicted Mr-Comp (psi)
CMV - Mr-Comp @ 5 psi
R2 = 0.92 R2 = 0.24
Ingios XMV vs. CMV Calibration Results (Mr-Comp at 5 psi – similar trends for all Mr values)

Center for Earthworks Engineering Research

Center for Earthworks Engineering Research
Center for Earthworks Engineering Research
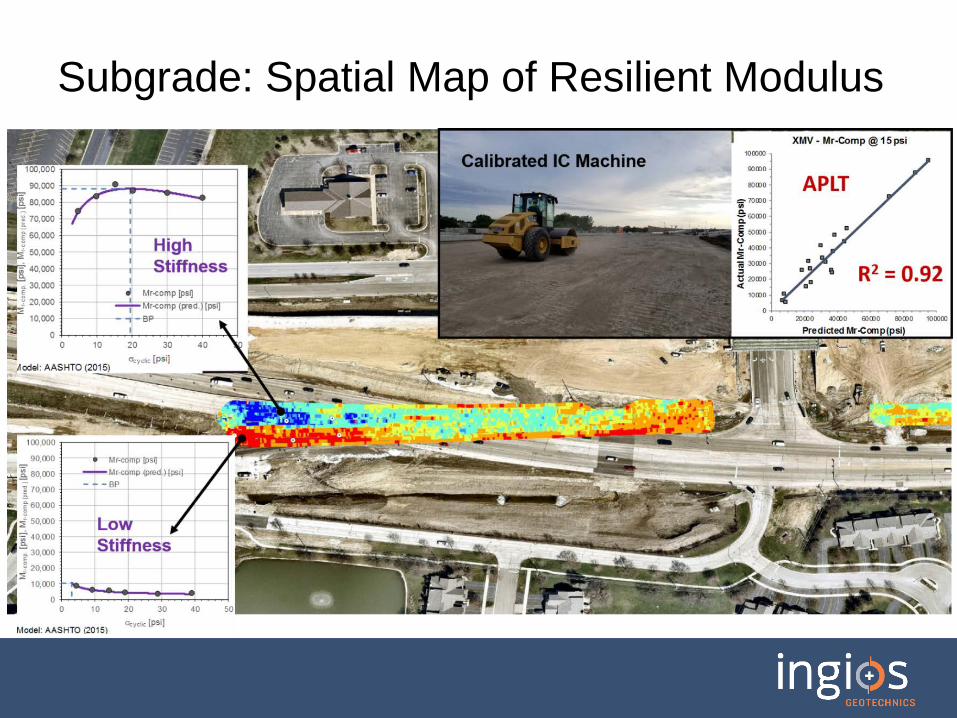
Subgrade: Spatial Map of Resilient Modulus

Center for Earthworks Engineering Research
Passed QC/QA process?

Center for Earthworks Engineering Research
Center for Earthworks Engineering Research
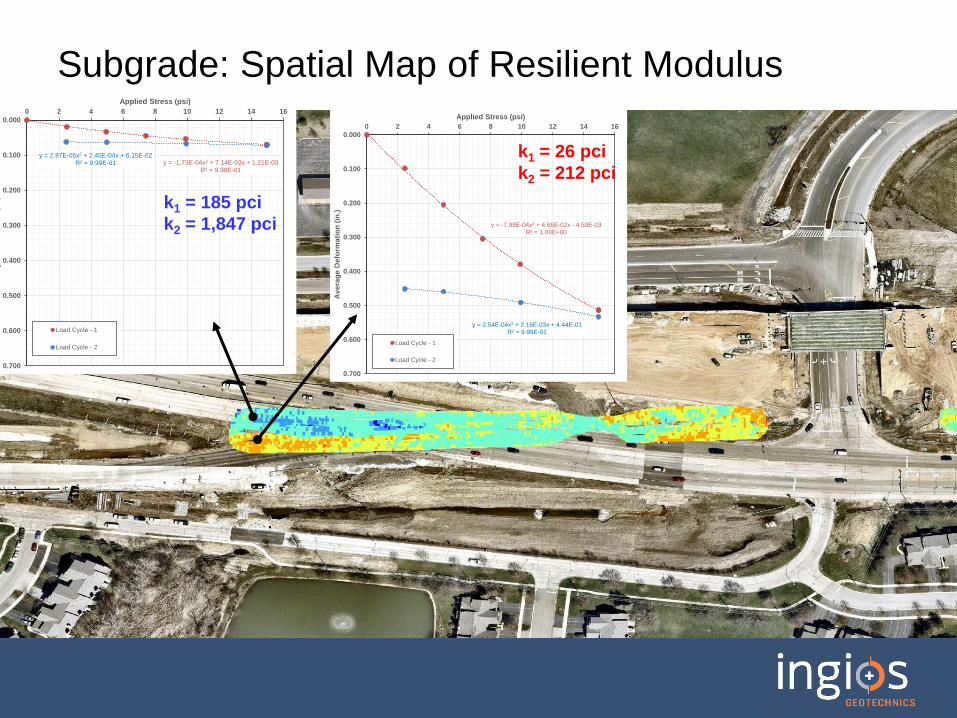
y = -7.98E-04x2 + 4.66E-02x - 4.50E-03R² = 1.00E+00
y = 2.54E-04x2 + 2.16E-03x + 4.44E-01R² = 9.99E-01
0.000
0.100
0.200
0.300
0.400
0.500
0.600
0.700
0 2 4 6 8 10 12 14 16
Aver
age
Def
orm
atio
n (in
.)
Applied Stress (psi)
Load Cycle - 1
Load Cycle - 2
y = -1.73E-04x2 + 7.14E-03x + 1.21E-03R² = 9.98E-01
y = 2.97E-05x2 + 2.45E-04x + 6.15E-02R² = 9.99E-01
0.000
0.100
0.200
0.300
0.400
0.500
0.600
0.700
0 2 4 6 8 10 12 14 16
g
()
Applied Stress (psi)
Load Cycle - 1
Load Cycle - 2
k1 = 26 pcik2 = 212 pci
k1 = 185 pcik2 = 1,847 pci
Subgrade: Spatial Map of Resilient Modulus

Center for Earthworks Engineering Research
Findings and What’s Next…
• Spatial variability in modulus identified.• Calibrated results demonstrate application for near
real-time modulus mapping when calibrated.• Specification developed to be used in parallel with
conventional testing.• Two proposed project in 2018• Working on data management and engineering
reporting tools.

Center for Earthworks Engineering Research
THANK YOU