roller compaction: mechanistic understanding of ribbon
TRANSCRIPT

Roller Compaction: Mechanistic
understanding of ribbon splitting and
sticking
Osama Mahmah
A thesis submitted in partial fulfilment of the requirements for the degree of
Doctor of Philosophy
The University of Sheffield
Faculty of Engineering
Department of Chemical and Biological Engineering
August 2019
1
Abstract
Roller compaction is a dry granulation technique in which the feed powder is subjected
to different types of stresses, which are applied between two counter-rotating rollers. The
stress applied during this process mediates both desired (intact ribbon) and undesired
(ribbon splitting/sticking) bond formation. The phenomenon of ribbon splitting/sticking
could originate from either process or formulation related causes; due to the imbalanced
combination of material mechanical properties and stress application which has the
potential to result in different types of ribbon failures i.e. cohesion and/or adhesion-
related ribbon failure. Despite current research work conducted in the field of roller
compaction, there remains a lack of comprehensive understanding in relation to the
development of ribbon failure during roller compaction which can hinder the use of roller
compaction with many formulations. Therefore, an in-depth understanding of the causes
of ribbon failure during roller compaction is required to design better formulations and
incorporate steps which will mitigate/stop the occurrence of ribbon splitting/sticking.
The aim of this work is to build a mechanistic understanding of ribbon splitting/sticking
phenomenon in terms of the ribbon-roller interactions in both the bulk and at the roller
walls.
A range of materials was selected to cover a wide range of powder deformability, the
minimum gap between the two smooth rollers was fixed and the maximum roll stress was
varied. Ribbon splitting was observed to occur either transversally (through the ribbon
thickness) or longitudinally (through the ribbon width). It was observed that transverse
splitting is commonly associated with sticking of the split ribbons to the rollers.
Longitudinal splitting is associated with an across-width distribution of the ribbon density
which may cause an adverse effect on the mechanical strength and dissolution properties
of the tablets formed from the milled granules. The observed trends of ribbon splitting
were rationalised in terms of a splitting index which is a measure of the residual stresses
driving crack growth relative to the tensile strength of the ribbons.
Furthermore, knurled rollers with higher roller/powder contact surface area have been
investigated in terms of the occurrence of ribbon splitting/sticking. The predictability of
the splitting index was improved by incorporating the ribbon solid fraction difference
across the ribbon width. Using knurled rollers extends the range of transversal

2
splitting/roller sticking when compared with the smooth rollers and reduces the extent of
longitudinal splitting.
Attempts have been conducted to correlate powder and metal thermodynamic work of
adhesion with its sticking tendency during roller compaction. The technology of inverse
gas chromatography was utilised to characterise both powder and metal in terms of their
surface energy. No clear correlation between the work of adhesion/cohesion and sticking
probability was found which suggests that particle deformation is the dominant factor of
sticking during compaction. However, the result could contribute to the elaboration of the
lubrication mechanism of MgSt during powder compaction.
Finally, a data-driven model was developed to predict the ribbon porosity distribution
using the artificial neural network approach (ANN). Various process-related parameters
and material properties considered as the inputs of the ANN. While the outputs of the
network were the porosity which was experimentally measured by X-ray tomography
across the ribbon width, powder and ribbon porosity distribution have linked together
using ANN approach as a novel approach to predict the heterogeneity of ribbon in terms
of its porosity distribution. Results showed that the ANN was able to successfully map
various material and process parameters to the ribbon porosity distribution across the
ribbon width, which is considered to be one of the most important quality attributes in the
roller compaction process. Due to its short processing time This is particularly useful as
it allows potentially for future powders and formulations to be modelled to understand
the propensity of undesired ribbon properties to occur.

3
Acknowledgements
I would like to express my sincere appreciation and thanks to my supervisor Prof. Agba
D. Salman, you have been a tremendous mentor for me. The completion of this work
could not have been possible without your support. I would like to thank you for your
critical comments. Thanks to the particle product group (PPG) for being my family for
the whole of the PhD period. I am extremely grateful for The University of Sheffield for
funding my PhD study.
Special thanks to Prof. Mike Adams for his valuable contributions. It was an honour to
work with such a knowledgeable and experienced scientist with tens of years of
experience in the field of particle science and technology. Great thanks to Dr Bindhu
Gururajan, Dr Syed Islam, and Dr Chalak Omar for their continuous help and support.
No words can be strong enough to express my gratitude and appreciation for my parents,
sisters, brothers, and wife for always being here for me, adding love to everything you
do. One day, I will join you back in Syria when the war hopefully stops.
On top of all, I will give thanks to you GOD for everything I have and for everything I
have been blessed with. Praise be to GOD, Lord of the worlds.

4
LIST OF PUBLICATIONS AND PRESENTATIONS
• O. Mahmah, M.J. Adams, C.S. Omar, B. Gururajan, A.D. Salman, Roller
compaction: Ribbon splitting and sticking, International Journal of
Pharmaceutics. 559 (2019) 156–172.
• O. Mahmah, M.J, B. Gururajan, A.D. Salman, Roller compaction: ribbon
splitting and sticking. Conference paper at 8th International Granulation
Workshop. Sheffield, UK. 26th-28th June 2017. Paper No. 86.
• O. Mahmah, B. Gururajan, A.D. Salman, Roller compaction: ribbon splitting
and sticking. Poster presentation at 8th International Granulation Workshop.
Sheffield, UK. 26th-28th June 2017.

5
TABLE OF CONTENTS
Chapter 1 Introduction ....................................................................................................... 20
Granulation in general ................................................................................................. 20
Why dry granulation.................................................................................................... 20
Roller compaction challenges ..................................................................................... 22
Mechanism of bonding ................................................................................................ 24
Thesis overview........................................................................................................... 26
Chapter 2 Literature review ............................................................................................... 28
Compact Defects due to sticking (powder-metal interaction) ..................................... 29
Factors affecting sticking (powder-metal interaction) ........................................ 33
Compact defect due to improper interaction between powder particles (cohesion-
induced defects) ...................................................................................................................... 47
Factors affecting defects due to improper particle-particle interaction ............... 49
Predictive models in roller compaction ....................................................................... 59
Johanson’s Model ................................................................................................ 59
Finite element Modelling (FEM) ........................................................................ 63
Discrete Element Modelling (DEM) ................................................................... 65
Artificial neural network (ANN) modelling ........................................................ 66
Theoretical Modelling-Summary ........................................................................ 68
Aim of the research ..................................................................................................... 69
Chapter 3 Materials and Methods ..................................................................................... 70
Materials ...................................................................................................................... 70
Calcium carbonate (CaCO3) ................................................................................ 73
Mannitol C160..................................................................................................... 73
Lactose ................................................................................................................ 73
Starch 1500 .......................................................................................................... 74
Maltodextrin ........................................................................................................ 74
Microcrystalline cellulose (MCC) ....................................................................... 74
Methods ....................................................................................................................... 75
Powder preparation ............................................................................................. 75
Powder characterisation ...................................................................................... 75
Roller compaction ............................................................................................... 78
Roller surface coverage monitoring .................................................................... 80
Online thermal imaging ....................................................................................... 81
Determination of un-compacted fine percentage ................................................ 81
Ribbon strength measurement-three point bend testing ...................................... 82
Ribbon porosity measurement using X-ray tomography ..................................... 83
6
Ribbon porosity distribution measurement using Near Infrared Chemical Imaging
(NIR-CI) 83
Chapter 4 Novel understanding of ribbon splitting/sticking phenomena ...................... 85
Introduction ................................................................................................................. 85
Hypothesis ................................................................................................................... 85
Methods ....................................................................................................................... 86
Results and Discussion ................................................................................................ 86
Yield strength ...................................................................................................... 86
Single-particle yield strength............................................................................... 88
Maximum stress in roller compaction ................................................................. 92
Elastic recovery ................................................................................................... 94
Ribbon tensile strength ........................................................................................ 96
Ribbon splitting and sticking observations ......................................................... 98
Ribbon splitting/sticking: effect of maximum roll stress and yield strength ..... 103
Splitting index ................................................................................................... 107
Conclusions ............................................................................................................... 114
Chapter 5 Ribbon splitting: role of porosity distribution .............................................. 115
Introduction ............................................................................................................... 115
Hypothesis ......................................................................................................... 115
Methods ..................................................................................................................... 116
Results and discussion ............................................................................................... 117
Max stress with knurled rollers ......................................................................... 117
Assessing the roller compaction process using knurled rollers (comparison with
smooth rollers mediated RC) ............................................................................................. 119
Ribbon splitting/sticking observations .............................................................. 127
Ribbon heterogeneity across ribbon width ........................................................ 130
Modified ribbon splitting index ......................................................................... 147
Conclusion ................................................................................................................. 149
Chapter 6 Roller sticking-role of surface energy ............................................................ 150
Introduction ............................................................................................................... 150
Theoretical background ............................................................................................. 150
Methods of measuring surface energies and its relation to sticking studies ...... 151
Summary ........................................................................................................... 158
Methods ..................................................................................................................... 158
Results and Discussion: ............................................................................................. 160
BET specific surface area .................................................................................. 160
Dispersive and specific surface energies of powders and metal surface ........... 162
Work of cohesion and adhesion ........................................................................ 164

7
Understanding the mechanism of lubrication as a function of surface energy .. 167
Conclusions ............................................................................................................... 170
Chapter 7 Prdictive model for the ribbon porosity distribution using the artificial neural
network 171
Abstract ..................................................................................................................... 171
Introduction ............................................................................................................... 171
Theoretical background ..................................................................................... 173
Experimental ............................................................................................................. 176
Method .............................................................................................................. 176
Modelling and simulation .................................................................................. 177
Results and Discussion .............................................................................................. 178
Statistical analysis ............................................................................................. 178
Neural network topology optimization .............................................................. 179
Prediction results ............................................................................................... 183
Conclusions ............................................................................................................... 186
Chapter 8 General conclusions and future work ............................................................ 187
Conclusions ............................................................................................................... 187
Future work ............................................................................................................... 189
References ................................................................................................................................ 191
Appendix A .............................................................................................................................. 210
8
LIST OF FIGURES
Figure 1-1: Schematic diagram of the roller compaction process showing the different
compaction zones–Adapted [7]. ..................................................................................... 22
Figure 1-2: Possible events during particle compaction cycle–Adapted [21]. ............... 25
Figure 1-3: Suggested bond types and their theoretical strengths in relation to particle size
[22,24]. ........................................................................................................................... 26
Figure 2-1: Main points discussed in this chapter. ......................................................... 28
Figure 2-2: Possible cases during detachment of an adhered compacted powder; particles
are detached by perpendicular forces–Adapted [26]. ..................................................... 30
Figure 2-3: Oscillation in roller compactor process parameters as a result of roller
stickiness [20]. ................................................................................................................ 31
Figure 2-4: classification of the bonding mechanisms according to the presence or
absence of material bridges between the contacted surfaces [35]. ................................. 32
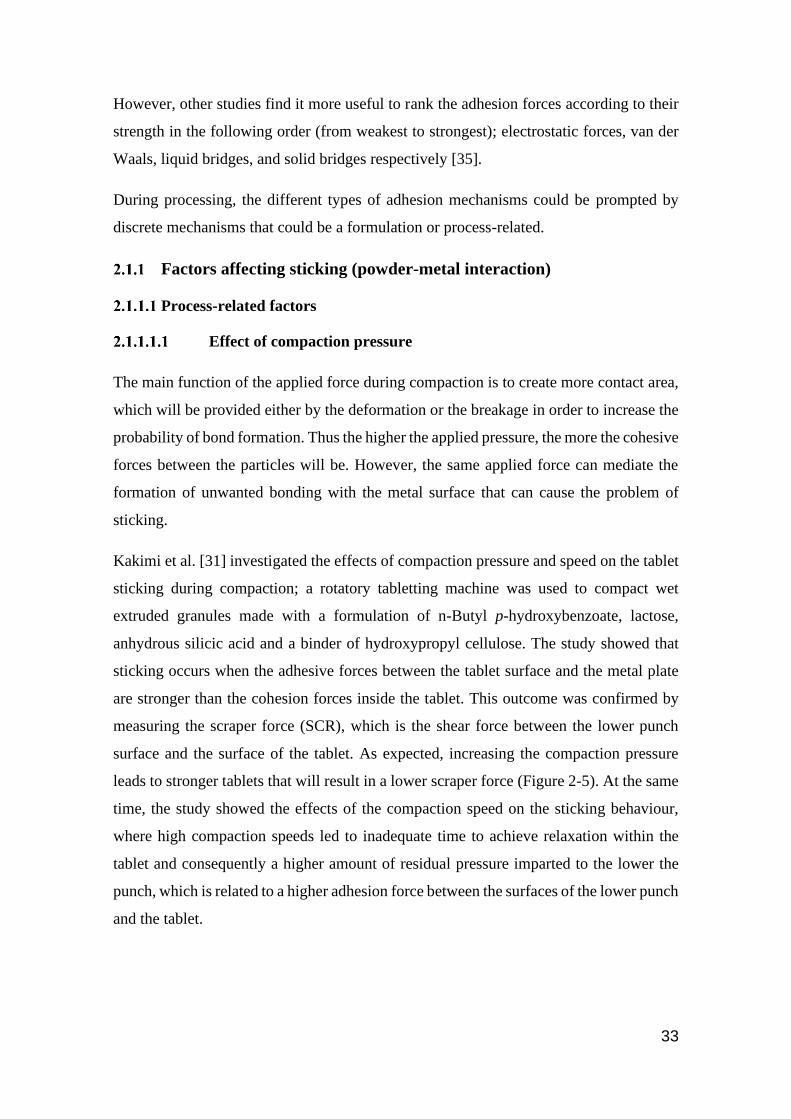
Figure 2-5: The relationship between the compression pressure and the scraper force at
different compression speed, where; ○10 rpm; Δ 15 rpm; □ 20 rpm [31]. ..................... 34
Figure 2-6: Adhesion force versus compression force profiles of sorbitol at three different
magnesium stearate levels (0.25, 0.5, and 1.0%) [26]. ................................................... 35
Figure 2-7: Adhesion force versus compression force profiles of microencapsulated ASA
with and without 0.5% magnesium stearate [26]. .......................................................... 35
Figure 2-8: The instrumented compaction tooling used by Waimer et al. [43]. The figure
also shows a schematic drawing to the shear cone that is fixed to the upper punch surface.
α is the angle between the punch plain surface and the cone lateral surface. ................. 36
Figure 2-9: The effect of materials hardness value on its ribbon tensile strength that was
produced using roller compactor at 100 bar hydraulic pressure. (▲Avicel PH 101, ○
Glucidex16, + Tylpor 604, ■ pharmatose 200 M, Δ sodium carbonate, calcium
carbonate) [45]. ............................................................................................................... 40
Figure 2-10: Suggested scenarios of the roller stickiness ranging from the best case (a) to
worst case with complete roller coverage (d) [18]. ........................................................ 42
Figure 2-11: Change in roll gap distance as a response to external lubrication application.
........................................................................................................................................ 42
Figure 2-12: Effect of the temperature and compression pressure on the yield pressure
(Py) values derived from Heckel analysis for all the different materials tested. To easily
compare materials with different ductility and consequently Py, the y-axis is set to show
a Py range of 60 MPa. Symbols * and # refer to statistical significance [55] ................ 45
Figure 2-13: Temperature increase of ribbons of different materials during roller
compaction at varying hydraulic pressures [8]. .............................................................. 46
Figure 2-14: the distribution of (A) density at maximum compaction pressure and (B)
Shear stresses as reported in Wu et al. [59]. ................................................................... 48
Figure 2-15: Contour plots of capping and non-capping zones at (A) constant tensile
strength and Poisson’s ratio and (B) constant in-die recovery and residual die pressure
[66]. ................................................................................................................................ 50
9
Figure 2-16: effect of external and internal lubrication on the RDP/MDP for A: lactose
and B: mannitol. * Capping was observed during tabletting [71]. ................................. 52
Figure 2-17: Tensile strength of unlubricated (■) and lubricated (▲) tablets of sorbitol
(A) and MCC (B) at a range of compaction pressures. (*) represents unlubricated sorbitol
tablets which show start of capping [73]. ....................................................................... 53
Figure 2-18: Permeability of powder bed expressed as the pressure drop across the powder
bed at 15 kPa as a function of API contents. The measurements were conducted with and
without 0.5% MgSt ......................................................................................................... 54
Figure 2-19: the effect of compaction pressure on A: in-die elastic recover (IER %) and
(B) tablet tensile strength for a formulation containing 75% Acetaminophen [66]. The
time shown on the figures is the dwell time. .................................................................. 56
Figure 2-20: The shear stress distribution during decompression for compaction with
different die-wall friction and surface curvatures [80]. .................................................. 57
Figure 2-21: Relative density of MCC, mannitol, and MCC/mannitol ribbons produced
using a pair of smooth (A) and knurled (B) rollers [82]. ............................................... 59
Figure 2-22: Comparison between experimentally and predicted stress profile calculated
using Johanson’s model at a range of gap distances [83]. .............................................. 62
Figure 2-23: Normal and shear pressure distribution as a function of angular position and
position across roll width [64]. ....................................................................................... 64
Figure 2-24: Schematic representation to the approach used by Mazor et al. [90]; the
predicted particle axial velocity used as an inlet velocity for the FEM model. ............. 66
Figure 2-25: ANN predicted granule friability as a function of horizontal screw speed
(HS) and roller speed (RC) [76]. .................................................................................... 67
Figure 3-1: Primary powder particle size distribution for CaCO3 (—), mannitol (—),
lactose 200M (—), anhydrous lactose (—), starch (—), maltodextrin (—) and MCC (—).
........................................................................................................................................ 70
Figure 3-2: SEM images for the primary particles used in this study. ........................... 72
Figure 3-3: An example of loading /unloading curve that used is to calculate compact
elastic recovery. .............................................................................................................. 78
Figure 3-4: Alexanderwerk WP120 Roller Compaction with schematic drawings of the
main three systems involved in roller compaction i.e. feeding, compaction, and milling
system. ............................................................................................................................ 79
Figure 3-5: Optical image of a section of the knurled roller surface (a) and the smooth
roller surface (b). ............................................................................................................ 80
Figure 3-6: Schematic drawing of the set used for roller surface coverage monitoring. 81
Figure 3-7: Schematic drawing of the setting used for the three points bend test. ......... 82
Figure 3-8: A schematic of the hyperspectral imaging system, Adapted-[107]. ............ 83
Figure 4-1: A schematic diagram of the two kinds of ribbon splitting investigated. ..... 86
Figure 4-2: Typical Heckel analysis profiles obtained by two approaches; A: out-die and
B: in-die. : CaCO3 ( ), mannitol ( ), lactose 200M ( ), anhydrous lactose (+), starch
(x), maltodextrin ( ) and MCC ( ). .............................................................................. 87

10
Figure 4-3: Force-displacement curves of the studied powder particles, which are
obtained using the single particle-diametrical compression test. ................................... 90
Figure 4-4: A: Fitting the compaction profile of starch particle to Hertz equation
(Equation 4-1) to find the elastic deformation limit; the brown dotted line represents the
best fitting line to the elastic region. B: the force-displacement range used to determine
starch particle yield strength using (Equation 4-3). ........................................................ 91
Figure 4-5: Typical stress-strain data for anhydrous lactose during uniaxial compaction
test. The blue line represents the best fit to equation (Equation 2-14) and the black line
shows anhydrous lactose compaction profile. ................................................................ 93
Figure 4-6: Maximum roll stress as a function of the hydraulic pressure for the smooth
rollers and the following feed powders: CaCO3 ( ), mannitol ( ), lactose 200M ( ),
anhydrous lactose (+), starch (x), maltodextrin ( ) and MCC ( ). ............................... 94
Figure 4-7: The loading/unloading compaction curves of lactose 200M obtained during
confined uniaxial compaction test at a series of maximum compaction stresses ( …. 66, -
--- 110, ‒ ‒ ‒ 184, - · - 295, — — 443, —·— 553, — 848 MPa) respectively equivalent
to the hydraulic pressures used during roller compaction which are 18, 30, 50, 80, 120,
150, and 230 bar. ........................................................................................................... 95
Figure 4-8: The elastic recovery of tablets measured during uniaxial compaction as a
function of Heckel yield strength for the range of compressive stresses (MPa) investigated
as given to the right of each data set; the lines are to guide the eye. The symbols for the
powder feeds correspond to: CaCO3 ( ), mannitol ( ), lactose 200M ( ), anhydrous
lactose (+), starch (x), maltodextrin ( ) and MCC ( ).................................................. 96
Figure 4-9: The effect of maximum compaction stress on the tensile strength of ribbons.
........................................................................................................................................ 97
Figure 4-10: The mean ratio of the tensile strength and the maximum roll stress as a
function of the reciprocal of the yield strength for CaCO3 ( ), mannitol ( ), lactose 200M
( ), anhydrous lactose (+), starch (x), maltodextrin ( ) and MCC ( ); the line is the best
linear fit (Equation 4-4). ................................................................................................. 98
Figure 4-11: A: Images of top and bottom surface of calcium carbonate splitting ribbons
produced at different stresses, and B: Ribbon thickness profile for the top and the back
surface of calcium carbonate splitting ribbons produced at 70 and 877 MPa, the
measurements were conducted for 3mm line across the ribbon through the width centre
(measured by digital microscope (Keyence VHX-5000). ............................................ 101
Figure 4-12: Images of mannitol ribbons that are produced at different maximum roll
stresses. ......................................................................................................................... 102
Figure 4-13: Images of top and bottom surface of maltodextrin ribbons produced at
different stresses. .......................................................................................................... 102
Figure 4-14: The amount of fines (w/w%) produced for the powder feeds with the
unlubricated smooth rollers as a function of the maximum roll stress. The symbols for the
powder feeds correspond to: CaCO3 ( ), mannitol ( ), lactose 200M ( ), anhydrous
lactose (+), starch (x), maltodextrin ( ) and MCC ( )................................................ 103
Figure 4-15: A map of the transition from no splitting to longitudinal splitting in
coordinates of the maximum roll stress and the Heckel particle yield strength for the
11
unlubricated and externally lubricated smooth rollers. The symbols for the powder feeds
correspond to: mannitol ( ), lactose 200M ( ), anhydrous lactose (+), starch (x), MCC (
). Longitudinal splitting was not observed for CaCO3. .............................................. 104
Figure 4-16: X-ray tomography images of MCC ribbon produced at 204 MPa across its
width. ............................................................................................................................ 105
Figure 4-17: A histogram of the number of non-splitting, longitudinal splitting, and
transversal splitting outcomes per powder feed normalised by the total number of
outcomes that were observed with the unlubricated (solid filling bar) and lubricated
smooth rollers (pattern-filled bar) based on the ratio of the maximum roll stress and
Heckel particle yield strength. NS refers to no splitting, T to transversal splitting, L to
longitudinal splitting and Lub to external roller lubrication......................................... 106
Figure 4-18: The applied force as a function of the displacement for three-point fracture
measurements. The ribbons formed from all the powder feeds except those from CaCO3
exhibited unstable fracture at all maximum roll stresses. ............................................. 108
Figure 4-19: A histogram of the number of non-splitting ( ) and longitudinal splitting
outcomes per powder feed normalised by the total number of outcomes that were
observed with the unlubricated ( ) and lubricated smooth rollers ( ) based on the splitting
index. NS refers to no splitting, L to longitudinal. The data for CaCO3 ribbons are not
included since its splitting behaviour is anomalous. .................................................... 109
Figure 4-20: The particle debris coverage on the smooth unlubricated rollers measured
after the scrapers as a function of the maximum roll stress for the mannitol ( ), lactose
200M ( ), and anhydrous lactose (+). Adhesion was absent for starch, MCC and CaCO3.
...................................................................................................................................... 110
Figure 4-21: A histogram based on the splitting index of the number of non-splitting and
splitting outcomes per powder feed normalised by the total number of outcomes that were
observed with the unlubricated smooth rollers. The data for CaCO3 ribbons are not
included since its splitting behaviour is anomalous. The coding refers to transversal ( ,
T), longitudinal ( , L), mixed transversal-longitudinal ( , T+L) and no splitting ( , NS).
...................................................................................................................................... 111
Figure 5-1: A schematic drawing of the development of the proposed bending stress
across ribbon width. ...................................................................................................... 116
Figure 5-2: A: The surface area of 25 mm2 roller area measured by a digital microscope
(Keyence VHX-5000). B: Calculated roller surface area of smooth and knurled rollers
used in this study. ......................................................................................................... 117
Figure 5-3: Maximum roll stress as a function of the hydraulic pressure for the (A) smooth
and (B) knurled rollers and the following feed powders: CaCO3 ( ), mannitol ( ), lactose
200M ( ), anhydrous lactose (+), starch (x), maltodextrin ( ) and MCC ( ). ........... 118
Figure 5-4: The calculated nip angles for the different types of powder feed materials,
which were compacted using knurled ( ) and smooth ( ) rollers. .............................. 119
Figure 5-5: comparison of ribbon tensile strength using small knurled rollers at the same
set of hydraulic pressures. Red and blue lines represent the ribbon produced by knurled
and smooth rollers ribbons respectively. ...................................................................... 120

12
Figure 5-6: X-ray tomography images of MCC ribbons made with the (A) smooth and
(B) knurled rollers at maximum roll stresses of 129 and 92 MPa respectively,
corresponding to a hydraulic pressure of 50 bar........................................................... 121
Figure 5-7: Effect of roller maximum stress on the ribbon width. Red and blue lines
represent the ribbon produced by knurled and smooth rollers ribbons respectively. ... 122
Figure 5-8: Effect of roller maximum stress on the amount of un-compacted fines. Red
and blue lines represent the ribbon produced by knurled and smooth rollers ribbons
respectively. .................................................................................................................. 124
Figure 5-9: Effect of hydraulic pressure on the feeder screw speed at constant gap distance
(2 mm) for the different studied powder materials. Red and blue lines represent the ribbon
produced by knurled and smooth rollers ribbons respectively. .................................... 126
Figure 5-10: A histogram based on the splitting index of the number of non-splitting and
splitting outcomes per powder feed normalised by the total number of outcomes that were
observed with the smooth (A) and knurled rollers (B). The data for CaCO3 ribbons are
not included since its splitting behaviour is anomalous. The coding refers to transversal
(T), longitudinal (L), mixed transversal-longitudinal (T+L) and no splitting (NS). Solid
and patterned filled bars refer to unlubricated and lubricated cases respectively. ....... 129
Figure 5-11: The porosity profile across ribbon width for the ribbons produced from all
powder feed. The profiles are for the ribbons produced using smooth rollers (left column)
and knurled rollers (right column). (Hydraulic pressures used: …. 18, ---- 30, ‒ ‒ ‒50, - ·
- 80, — —120, —·— 150 , and — 230 bar). ............................................................... 132
Figure 5-12: Ribbon porosity profiles for ribbons produced at 30 bar using smooth and
knurled rollers. .............................................................................................................. 133
Figure 5-13: The relative solid fraction difference across the ribbons (Equation 5-1) as a
function of the maximum roll stress for the ribbons formed with the unlubricated (solid
line) smooth and (dashed line) knurled rollers. ............................................................ 134
Figure 5-14: A schematic representation of how could surface roughness cause blurry
images and affect the distribution of reflected light on the detector. ........................... 137
Figure 5-15: Raw images of plastic micro ruler taken with the NIR-CI spectrometer at
different distances to the spectrometer detector. .......................................................... 139
Figure 5-16: Surface profile of mannitol tablet compacted at a stress equivalent to 18 bar
(lowest) and 230 bar (Highest) hydraulic pressure in the roller compactor. The profile is
divided into five segments to calculate Rz value. ........................................................ 140
Figure 5-17: Rz values of the calibration tablets (A), and smooth roller ribbons (B).
Tablets are made at stresses corresponds to the highest and lowest stresses of roller
compaction. Blue and orange bars represent the highest and lowest stresses respectively.
L,C, and R are left, centre and right sides of the ribbon respectively. (C) is an example
surface profile of knurled ribbon with its Rz value. ..................................................... 141
Figure 5-18: A: Raw NIR spectrum of lactose 200M calibration tablets made at stress
levels equivalent to the stress applied on lactose 200M during smooth rollers mediated
roller compaction. The stresses are ordered ascendingly in the following colour order: (
, , , , , , and ). B: porosity of the calibration tablets as a function
of applied compaction stress......................................................................................... 142
Figure 5-19: Predicted vs. nominal tablet porosity. ..................................................... 143

13
Figure 5-20: NIR-CI porosity maps of lactose 200M calibration tablets (top) and roller
compacted ribbons (bottom). ........................................................................................ 143
Figure 5-21: Calibration tablets average greyscale value vs. measured porosity (%). . 144
Figure 5-22: Porosity profile as measured by NIR-CI technique. The colour coding are in
the following order; : 18 bar, : 30, : 50 bar, : 80 bar, :120, : 150
bar ). .............................................................................................................................. 145
Figure 5-23: The surface temperature profile for four materials across ribbon width;
compaction conducted using two different pairs of rollers (smooth and knurled) at 30 bar
hydraulic pressure. The dashed line represents knurled rollers whereas continuous line
represents smooth rollers. ............................................................................................. 147
Figure 5-24: A histogram of the number of non-splitting and splitting outcomes per
powder feed normalised by the total number of outcomes that were observed with the
smooth and knurled rollers . The data for CaCO3 ribbons are not included since its
splitting behaviour is anomalous. This based on the splitting index 𝐼S : (A-C) and
modified splitting index 𝐼𝑆′ (B-D). NS refers to no splitting, L to longitudinal. Coding
refers to transversal (T), longitudinal (L), mixed transversal-longitudinal (T+L) and no
splitting (NS). Solid and patterned filled bars refer to unlubricated and lubricated cases
respectively. .................................................................................................................. 148
Figure 6-1: Determination of surface free energy based on Dorris-Gray approach [151].
...................................................................................................................................... 154
Figure 6-2: The typical plot of the polarisation method which is used to determine the
specific surface energy of adsorption 𝛥𝐺𝑎𝑠𝑝[153]. ..................................................... 155
Figure 6-3: Technical drawing of the film cell module for IGC (60 × 210 × 11 mm). The
arrows show gas flow [162].......................................................................................... 160
Figure 6-4: Octane isotherms (amount adsorbed n as a function of partial pressure Peq/Psat)
for starch sample 298 K) .............................................................................................. 161
Figure 6-5: Dispersive and polar surface energy distribution profiles as a function of
surface coverage; orange and blue colours represent dispersive and specific surface
energies respectively..................................................................................................... 164
Figure 6-6: The profiles of work of adhesion and cohesion between the powders and metal
surface determined by IGC. Red and green colours represent work of adhesion and work
of cohesion respectively. .............................................................................................. 165
Figure 6-7: The ratio of work of adhesion to work of cohesion (Wad/Wco) at 0.04 n/nm
surface coverage. .......................................................................................................... 166
Figure 6-8: Cohesion energy measured between different particle combinations [150].
...................................................................................................................................... 168
Figure 6-9: Work of cohesion and adhesion between MgSt-MgSt (—), MgSt-steel (—),
PP-PP (—), PP-steel (—), and MgSt-PP (—). (PP: stands for powder particle). ........ 169
Figure 7-1: A comparison between Biological and ANN neuron, figures adapted from
[178]. ............................................................................................................................ 174
Figure 7-2: Sigmoid and step activations functions [92]. ............................................. 175
Figure 7-3: The two main types of topologies of ANN networks [92]. ....................... 175
14
Figure 7-4: Schematic diagram of the ANN simulation process. ................................. 177
Figure 7-5: Prediction performance of Pearson correlation (green-line) and quadratic
fitting (red-line). ........................................................................................................... 179
Figure 7-6: Performance of the 25- single hidden layer networks; Number of nodes was
increased while recording R-value. corresponds to training, to validation, to testing,
and to all. .................................................................................................................... 180
Figure 7-7: Regression results of fitting porosity results at position 5 (output 5) across
ribbon width .................................................................................................................. 182
Figure 7-8: Predicted and experimentally measured ribbon porosity distribution across
ribbon width for ribbons produced at 20.72 kN roller force using smooth rollers. The blue
line represents predicted values and the orange line for the X-ray measured results. .. 184
Figure 7-9: Predicted and experimentally measured ribbon porosity distribution across
ribbon width for ribbons produced at 20.72 kN roller force using knurled rollers. Blueline
represents predicted values and the orange line for the X-ray measured results. ......... 185
Figure 8-1: Schematic representation of the particle deformation and the increase in
contact surface area upon stress application. ................................................................ 190

15
List of Tables
Table 2-1: The main causes of powder stickiness during the tabletting process [19]. ... 32
Table 2-2: Correlation between sticking to roller surface and the adjusted coefficient of
determination [57]. ......................................................................................................... 47
Table 3-1: Primary powder particle size data. ................................................................ 71
Table 3-2: The relationship between roller separating force and hydraulic pressure as
given by the manufacturer (Alexanderwerk) [45]. ......................................................... 79
Table 4-1: Single-particle yield strengths and true densities for the powder feeds. ....... 88
Table 4-2: The yield strength of studied powder materials determined using single-
particle diametrical compression test. ............................................................................ 91
Table 4-3: Compressibility factor and flow properties of the materials. ........................ 93
Table 4-4: Effect of the maximum roll stress on the splitting and sticking behaviour of
the ribbons formed from unlubricated smooth rollers. Grey dotted areas indicate a non-
achievable condition. Red regions indicate the occurrence of splitting/sticking. Green
regions indicate the non-occurrence of splitting/sticking. Spitting is designated by T
(transversal splitting), Ln (longitudinal splitting into n pieces) and L J (longitudinally
joined splitting). .............................................................................................................. 99
Table 4-5: Effect of the hydraulic pressure on the splitting behaviour of the ribbons
formed from lubricated formulations. Grey dotted areas indicate a non-achievable
condition. Red regions indicate the occurrence of splitting. Green regions indicate the
non-occurrence of splitting. Spitting is designated by T (transversal splitting), Ln
(longitudinal splitting into n pieces) and LJ (longitudinally joined splitting). ............. 113
Table 5-1: Angles of wall friction for all powders used. .............................................. 118
Table 5-2: Effect of the maximum roll stress on the splitting and sticking behaviour of
the ribbons formed from unlubricated knurled rollers. Grey dotted areas indicate a non-
achievable condition. Red regions indicate the occurrence of splitting/sticking. Green
regions indicate the non-occurrence of splitting/sticking. Spitting is designated by T
(transversal splitting), Ln (longitudinal splitting into n pieces) and LJ (longitudinally
joined splitting). ............................................................................................................ 128
Table 6-1: Characteristics of probes gases used in the IGC study [161]. ..................... 160
Table 6-2: Specific surface area parameters determined using octane isotherm. ......... 161
Table 7-1: Optimum neural network topologies for process simulation and their
regression results. ......................................................................................................... 181
16
Nomenclature
A Parameter described in Equation 2-7
b Width of ribbon (mm)
C The BET or sorption constant related to the heat of adsorption and condensation
𝐶ℎ A constant related to the volume reduction of the powder (Equation 3-1)
d Average thickness of the briquette rolled when the roll gap is zero (mm)
dps Travelling distance per lubricant shot (mm)
dr Roll diameter (mm)
𝐸𝑝 Young’s modulus (Pa)
𝐸∗ Reduced effective young’s modulus (GPa)
f The activation function (ANN)
F Force applied during compaction test (N)
Fad Adhesion forces (N)
Fco Cohesion forces (N)
Fc Carrier gas flow rate (ml/min)
Fdet Detachment force (N)
𝑓𝑓𝑎𝑐 Force factor
𝐹𝑚𝑎𝑥 Force required to break the ribbon (N)
FvdW Lifshitz-van der waal force (N)
h Displacement during single particle test (mm)
ℎ𝑐 Current powder bed height (mm)
ℎ𝑑 Distance separation between the contiguous bodies (m)
ℎ𝑖 Initial height of powder (mm)
ℎ𝑚 Displacement of the moving platen (single particle test) (mm)
𝐼𝑆 Splitting index
J James-Martin correction factor
K Compressibility factor
𝐿𝑠 Distance between the supporters in the three point bend test (mm)
m Ribbon thickness (mm)
M The molar mass (g mol-1)
𝑚𝑎𝑑𝑠 The mass of the adsorbent (g)
𝑁𝐴 The Avogadro number (6.022 × 10²³ mol−1)
𝑛 The amount of gas adsorbed at equilibrium pressure
𝑛𝑚 The amount of gas adsorbed in a monolayer
17
𝑝 Pressure (MPa)
𝑃0 Outlet pressure of IGC (mmHg)
𝑃𝐷 The molar deformation polarisation of the gaseous probe (cm3 mol-1)
𝑃𝑒𝑞 Equilibrium pressure (BET specific surface area)
𝑃𝑖 Inlet pressure of IGC (mmHg)
𝑝𝑚𝑎𝑥 The maximum stress applied on the material (Johason’s theory) (MPa)
𝑝𝑟 Poisson’s ratio of the powder particle
𝑃𝑠𝑎𝑡 Saturation pressure (BET specific surface area)
Py Particle yield strength (single particle test) (MPa)
Q Contact angle between a droplet and a surface (º)
r Particle radius (m)
R Coefficient of correlation
R2 Coefficient of determination
Rf Roller separation force (kN)
Rg Ideal gas constant (8.314 J.mol-1)
Rz Peak to trough surface roughness (µm)
S Roll gap (mm)
𝑠𝐵𝐸𝑇 BET specific surface area (m2g-1)
Spm Number of shots per minute
SR Stress ratio
T The threshold value (Equation 7-1)
𝑡𝑟 Retention time (min)
𝑡0 Dead time (min)
V The molar volume of the adsorbed gas
𝑉𝑁 Retention volume (ml)
𝑣𝑟 Roll speed (rpm)
W Roller width (mm)
Wad Work of adhesion (mJ.m-2)
Wco Work of cohesion (mJ.m-2)
𝑤𝑖 The weight of 𝑥𝑖 input (Equation 7-1)
𝑤𝑟𝑖 Refractive index
X Material related constant (Heckel analysis-Equation 3-1)
𝑥𝑖 Input (i) to the node
𝑥𝑖 The average of all of the actual values
𝑥𝑛 The normalised value of the input 𝑥

18
Y Tablet relative density (Heckel analysis-Equation 3-1)
𝑦𝑝𝑟𝑑 The predicted output of the node
Greek alphabet
𝛼 Nip angle (º)
𝛼𝑎𝑑𝑠 The cross sectional area of the adsorbing gas molecule (m2)
𝛼𝐶𝐻2 The cross sectional area of a methylene molecule (6 Å2)
β True nip angle (Adam’s equation) (º)
𝛽𝐶 Solid fraction at ribbon centre
𝛽𝐸 Solid fraction at ribbon edge
γ Surface free energy (mJ.m-2)
𝛾𝑎𝑏 Polar surface energy for acid-base interaction (mJ.m-2)
𝛾𝑎+ Acidic surface energy (mJ.m-2)
𝛾𝑏− Basic surface energy (mJ.m-2)
𝛾𝐶𝐻2 The surface free energy of a solid contains methylene groups (mJ.m-2)
𝛾𝑑 Dispersive surface energy (mJ.m-2)
𝛾𝑠𝑙 The interfacial energies between solid and liquid (mJ.m-2)
𝛾𝑠𝑣 The interfacial energies between solid and vapour (mJ.m-2)
𝛾𝑙𝑣 The interfacial energies between liquid and vapour (mJ.m-2)
∆𝛽 Solid fraction difference
𝛥𝐺𝑎𝑠𝑝
The specific component of the free energy of adsorption
𝛿𝐸 Effective angle of the internal friction (º)
휀 Compressive natural strain
휀𝑅 Elastic recovery
휀𝐿 Energy of loading (N.mm)
휀𝑈 Energy of unloading (N.mm)
𝜃 Angular position in roll bite (º)
𝜅 Modified compressibility factor (Adam’s equation)
𝜇 Parameter in Johanson’s theory (Equation 2-9)
𝜈 Acute angle between the direction of the principle stress and the tangent to the roll surface
(Equation 2-8)
𝜌 Density (g/mm3)
σ Stress (MPa)
𝜎𝜃 Mean normal stress at position 𝜃 (MPa)
𝜎𝑚𝑎𝑥 Maximum normal stress applied in roller compaction (Johanson’s theory) (MPa)
𝜎𝑡 Tensile strength (MPa)

19
𝜎𝑌 Powder yield strength (MPa)
𝜏0 Constant related to mechanical strength of particles “Adams equation”
∅𝑤 Angel of wall friction (º)
ɦѿ Lifshitz-van der waal constant (J)
Abbreviations
ANN Artificial neural network
APAP Acetaminophen (Paracetamol)
API Active pharmaceutical ingredients
CP Capping propensity
DBC Drucker-Prager cap model
DOF Depth of field of the lens
FEM Finite elements modelling
IER In-die elastic recovery
IGC Inverse gas chromatography
L Longitudinal splitting
MCC Microcrystalline cellulose
MDP Maximum die wall pressure
MgSt Magnesium stearate
MISO Multiple inputs single output structure
MPC Model predictive control
NIR-CI Near-infrared chemical imaging
RDP Residual die wall pressure
SCR Scraper force
T Transversal splitting
20
CHAPTER 1 INTRODUCTION
Granulation in general
As a result of increasing diversity and competition between the pharmaceutical
companies, most of the globally working pharmaceutical companies attempt to maximize
the efficiency of the manufacturing processes. Direct tabletting is the most preferred
formulation technique for the solid dosage forms. However, all ingredients in the case of
direct tabletting have to be homogenous in terms of physical and chemical properties.
Otherwise, a negative variation in segregation behaviour might occur, and this may result
in tablets with poor mass and content uniformity. Moreover, in addition to the need for
sufficient flowability and compressibility behaviour, the need for specially produced
direct compressible excipients could affect its cost-effectiveness [1].
To overcome such problems and to mask the poor flow properties exhibited by many
drug compounds, granulation by incorporation into an excipient’s matrix is used to
modify the properties of the raw powder in order to obtain a final dosage form with the
desired stability, disintegration and integrity profile. Granulation can be defined as a size
enlargement process in which particles are physically grouped into strong agglomerates
in which the original raw particles can be distinguished [2].
Why dry granulation
Granulation processes are mainly classified into two main categories: wet and dry
processes. In wet granulation, an external liquid is used in conjunction with agitation to
achieve particle agglomeration. Wet granulation process can be subdivided into three
main approaches: low shear, high shear, and fluid bed granulation. Each of these
processes has its own merits and demerits. Nevertheless, all of the wet granulation
processes exploit the principle of forming cohesive forces between the moist particles
with the added granulation liquid in the form of liquid bridges; these are converted into
more permanent forces during the subsequent drying stage.
Use of wet granulation improves the flow, compression, and density of the powder
particles, as well as, ensuring better distribution of the colouring agent or the active

21
ingredient if it was solubilized in the granulation liquid. Furthermore, the use of this
technique reduces the amount of segregation and dust formation during powder
processing.
Wet granulation processes still suffer from a few disadvantages that might affect its
effectiveness such as the need for huge amounts of energy and processed air for the
subsequent drying stage. This is in addition to the stability issues when heat and moisture
sensitive compounds are processed. Moreover, the use of organic solvent as a granulation
liquid can result in hard restrictions on the residual solvent in the end product. All of these
limitations encourage researchers to adopt dry granulation as an alternative solution that
is more cost-effective and capable of forming good quality granules without the need of
adding liquid during granulation or removing it during drying stage [3].
Dry granulation can be defined as a pressure mediated agglomeration process where
the materials are agglomerated without using any moisture or heat. Initially, the process
started by compressing the powder blend into a large tablet (2.5 cm. diameter, 0.6 cm.
thickness) in a process called slugging where the slugs are milled into smaller particles
known as granules [4]. This method has multiple limitations. It results in a considerable
amount of dust that could lead to cross-contamination issues. Since it is a single batch
process, slugging has very poor process control and poor manufacturing throughput per
hour. Consequently, roller compactor has been introduced to the market to deal with such
limitations. It is a continuous technique, which is the key for more advanced dry
granulation.
It has considerable production capacity, more control over the processing variables,
which is accompanied by the ability of processing material having inconsistent density,
flowability, or compactibility. Thus this technique satisfies the need for the high
processing rate, together with a competitive cost and quality efficiency [5].
Conventional roller compactors usually consist of three systems; the feed system, roll
system, and granulation system. The process starts with the feeding system that delivers
the powder by gravity or by a screw feeder into the compaction area, which is
theoretically divided into three zones (Figure 1-1), while the boundaries between these
zones are defined by their angular positions. The powder within the slip zone moves at
speed slower than the rolls speed by the effect of gravity, friction, or force feeder, which
22
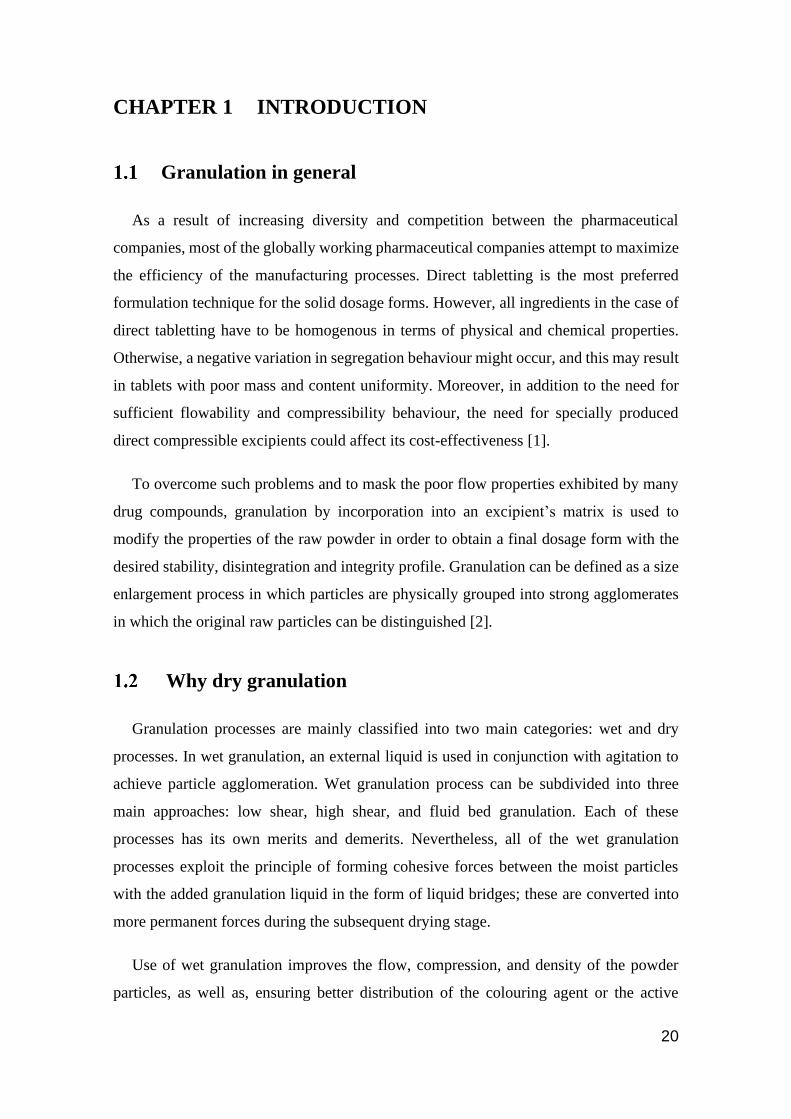
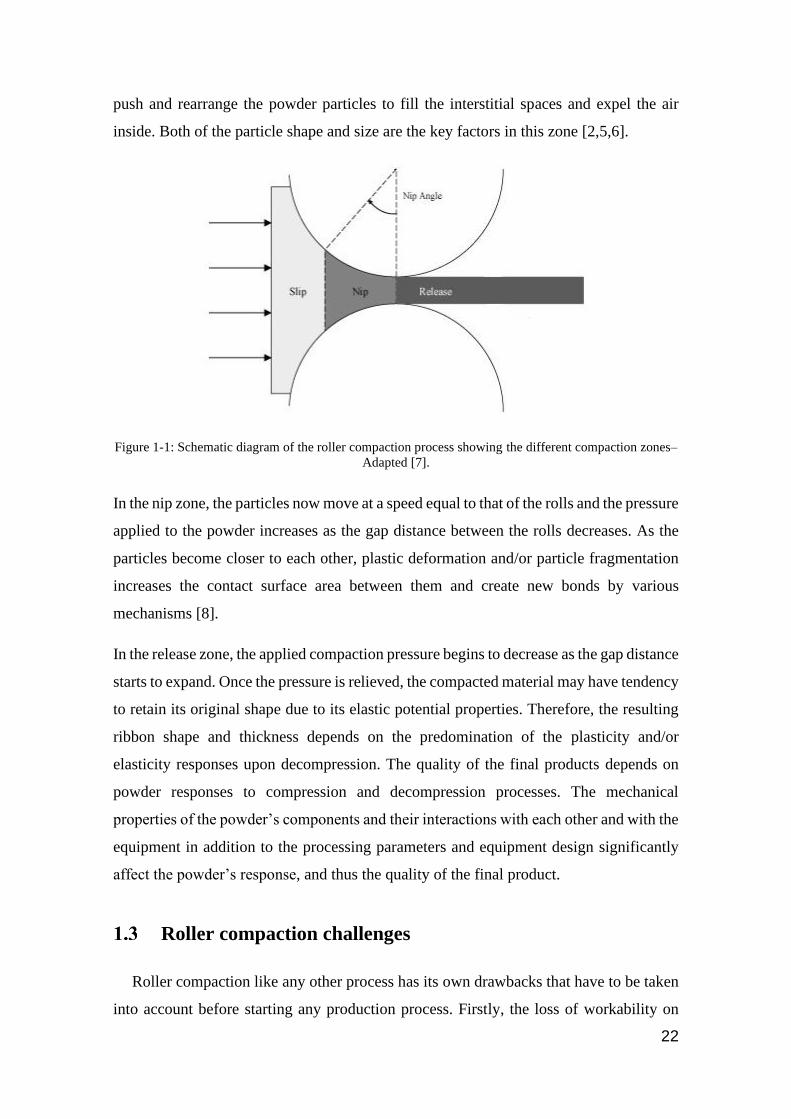
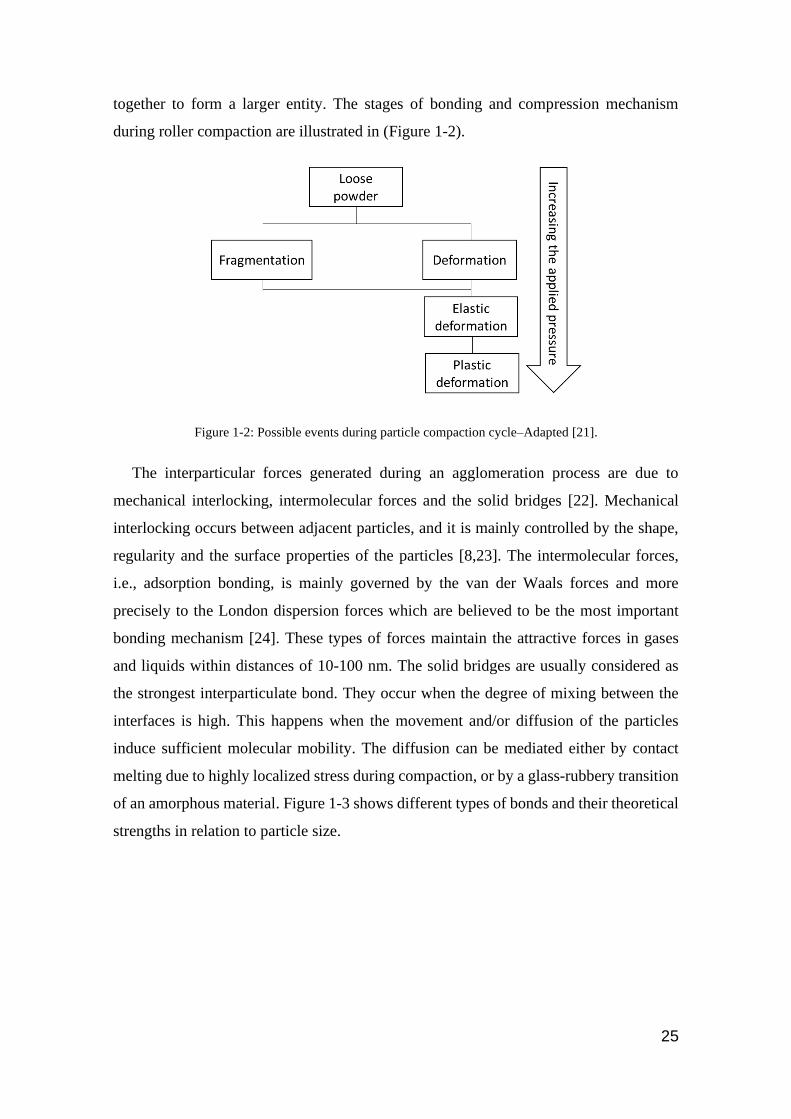
push and rearrange the powder particles to fill the interstitial spaces and expel the air
inside. Both of the particle shape and size are the key factors in this zone [2,5,6].
Figure 1-1: Schematic diagram of the roller compaction process showing the different compaction zones–
Adapted [7].
In the nip zone, the particles now move at a speed equal to that of the rolls and the pressure
applied to the powder increases as the gap distance between the rolls decreases. As the
particles become closer to each other, plastic deformation and/or particle fragmentation
increases the contact surface area between them and create new bonds by various
mechanisms [8].
In the release zone, the applied compaction pressure begins to decrease as the gap distance
starts to expand. Once the pressure is relieved, the compacted material may have tendency
to retain its original shape due to its elastic potential properties. Therefore, the resulting
ribbon shape and thickness depends on the predomination of the plasticity and/or
elasticity responses upon decompression. The quality of the final products depends on
powder responses to compression and decompression processes. The mechanical
properties of the powder’s components and their interactions with each other and with the
equipment in addition to the processing parameters and equipment design significantly
affect the powder’s response, and thus the quality of the final product.
Roller compaction challenges
Roller compaction like any other process has its own drawbacks that have to be taken
into account before starting any production process. Firstly, the loss of workability on
23
recompaction which was referred by many authors as being due to work hardening effect
of the feed materials [9] or to the enlargement in particle size [10]. Secondly, the
heterogeneity of the ribbon in terms of its density distribution, which is usually periodical
in nature and synchronized with the screw feeder period. Heterogeneity is mainly
governed by two main factors, which are the design of the powder feed system [11] and
the powder flow behaviour in the compaction zone [12,13]. Moreover, the leakage of high
amount of uncompacted powder between the roller seals could greatly affect the
efficiency of the process, the main cause of this phenomenon is the weak bonding of
ribbons at its edges as a result of non-homogenous feeding or air entrapment [2].
In addition, splitting and sticking of the compacted ribbons on the roller surface is one
of the main limitations that could hinder the use of roller compactor with many
formulations. It is a complex phenomenon that takes place in the release region; such that
the ribbon might split in different ways and in some cases stick to roller surface [14].
Ribbon splitting could take place across different ribbon dimensions but does not prevent
the ribbons from being milled into granules, however similar to the defects encountered
during a tabletting process; this phenomenon could be a signature of more serious
processing defects such as the heterogeneity of density across compact dimensions [15–
17]. Additionally, ribbon splitting could be related/associated with powder sticking,
which is one of the most important problems encountered during powder compaction
processes in general. It could have various deleterious consequences that range from
losing control over process parameters such as the gap distance in roller compaction [18]
or the force applied in a tabletting process [19], tool wearing, material wasting [20]. Also,
sticking could lead to problems related to product uniformity if one or more of the
formulation components shows a preferential sticking to the tooling surfaces or even
batch failure in case of severe powder sticking to tooling surfaces [19].
Splitting/sticking as one of the compact defects that occur during powder compaction
has been investigated in the field of tabletting but to a very limited extent in the field of
roller compaction where a different combination of shear and normal stresses are applied.

24
Mechanism of bonding
Understanding of inter-particular bonding mechanisms could assist in mitigating many
problems such as the stickiness on the roller surface or the amount of fines produced
during compaction; this could be implemented by modifying the formulation components
or adjusting the processing parameters and/or design in order to have the optimal bonding
mechanism for the intended product quality. For example, changing design of the feeding
system by adding feeding guiders could significantly improve the quality of the produced
ribbons [13]. The bonding adjustment depends on the bonding mechanism and the limit
of the adjustment should fulfil the intended quality of the final products, i.e., porosity,
strength, and dissolution profile.
The particle bonding via roller compaction is mainly controlled by the applied forces
since it is a dry process. Moreover, material properties such as deformability could also
affect bonding strength and subsequently the properties of the final dosage form.
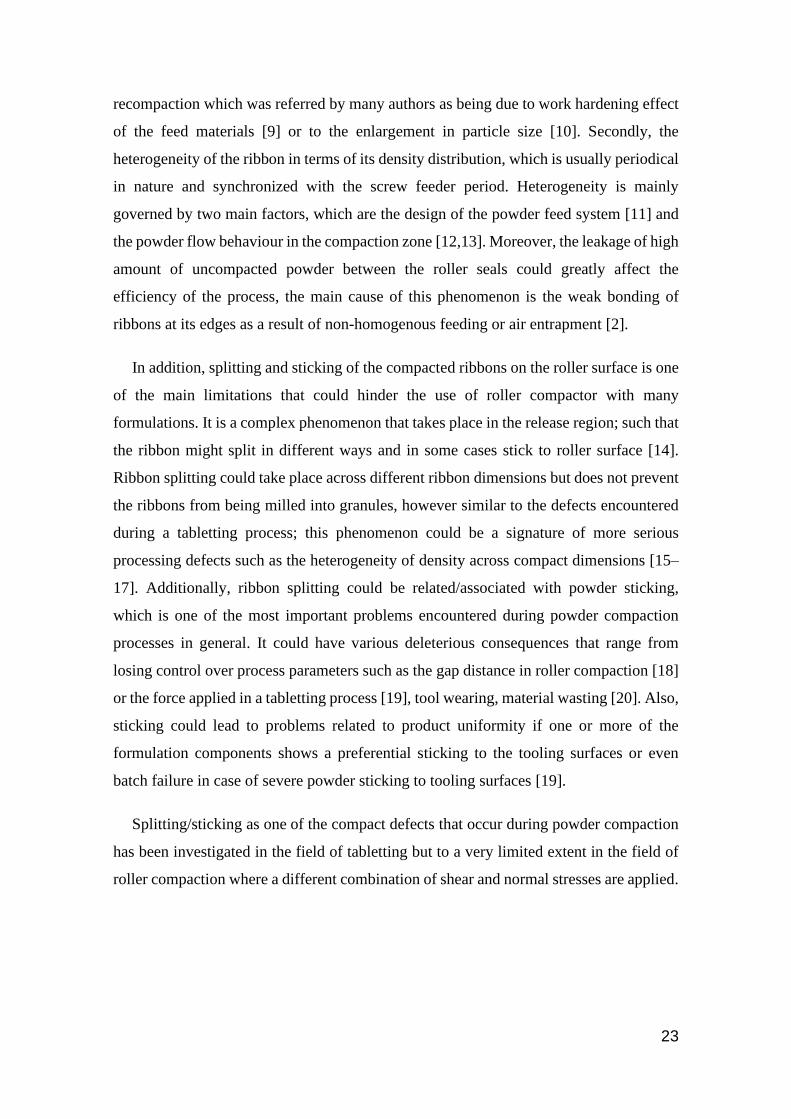
The pressure applied during roller compaction enforces particles to rearrange their
positions to tightly pack by reducing the air voids, this stage is mainly controlled by both
particle shape and size distribution. At a certain limit of the applied force, the free
volumes of particles are minimized and thus prevent particle movement, and so the
particles start to fragment or deform as a response to the applied pressure, and
consequently their contact areas increase. The compacted powder is initially subjected to
elastic deformation according to its Young’s modulus, and at its yield point of pressure,
it deforms plastically. The contact area between powder particles could also be increased
by fragmentation where particles break down to smaller fragments when the applied stress
is greater than their tensile strength, and then they might undergo subsequent stages of
rearrangements, elastic and plastic deformation [2,8]. The mechanical properties of the
powder components control their ability to form permanent bonds due to plastic
deformation (irreversible) or temporary bonds due to elastic deformation (reversible).
Also, the tendency to fracture is responsible for creating a new contact area and modifying
the size distribution to fit the voidage. Generally, the fragmentation phenomenon
predominates over the deformation when the materials are hard and brittle [4]. Bond
formations can be called an agglomeration process because particles agglomerate tightly
25
together to form a larger entity. The stages of bonding and compression mechanism
during roller compaction are illustrated in (Figure 1-2).
Figure 1-2: Possible events during particle compaction cycle–Adapted [21].
The interparticular forces generated during an agglomeration process are due to
mechanical interlocking, intermolecular forces and the solid bridges [22]. Mechanical
interlocking occurs between adjacent particles, and it is mainly controlled by the shape,
regularity and the surface properties of the particles [8,23]. The intermolecular forces,
i.e., adsorption bonding, is mainly governed by the van der Waals forces and more
precisely to the London dispersion forces which are believed to be the most important
bonding mechanism [24]. These types of forces maintain the attractive forces in gases
and liquids within distances of 10-100 nm. The solid bridges are usually considered as
the strongest interparticulate bond. They occur when the degree of mixing between the
interfaces is high. This happens when the movement and/or diffusion of the particles
induce sufficient molecular mobility. The diffusion can be mediated either by contact
melting due to highly localized stress during compaction, or by a glass-rubbery transition
of an amorphous material. Figure 1-3 shows different types of bonds and their theoretical
strengths in relation to particle size.
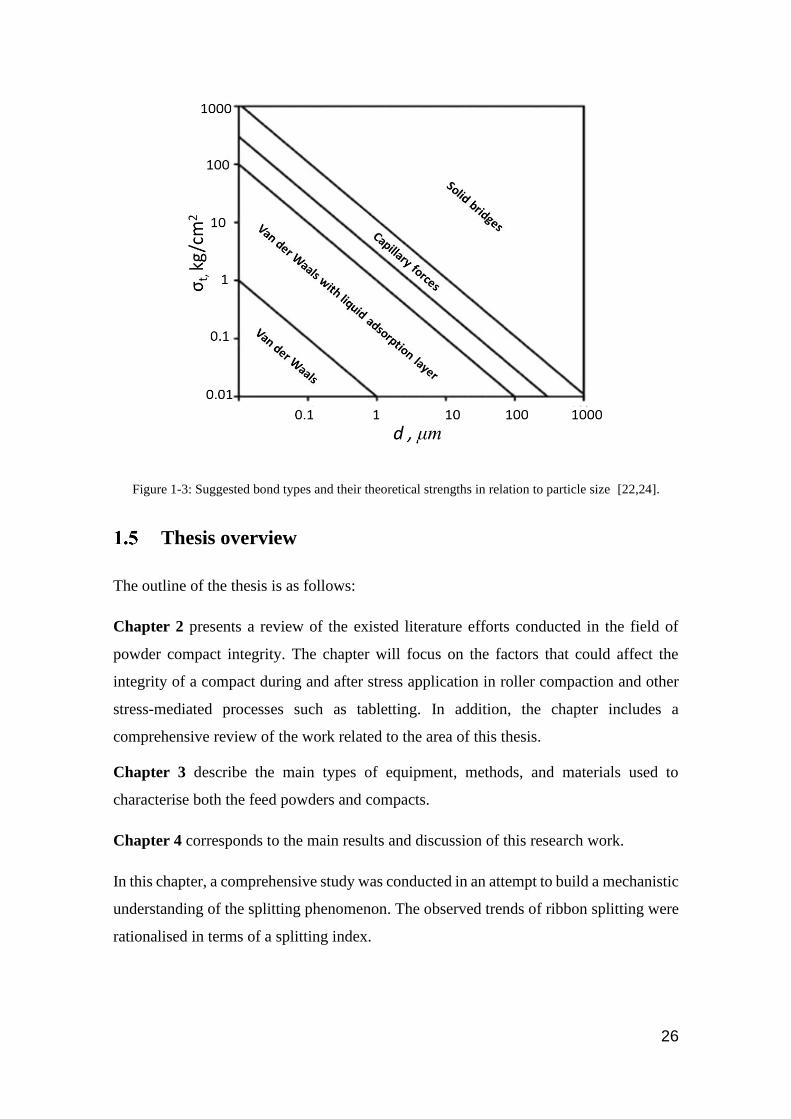
26
Figure 1-3: Suggested bond types and their theoretical strengths in relation to particle size [22,24].
Thesis overview
The outline of the thesis is as follows:
Chapter 2 presents a review of the existed literature efforts conducted in the field of
powder compact integrity. The chapter will focus on the factors that could affect the
integrity of a compact during and after stress application in roller compaction and other
stress-mediated processes such as tabletting. In addition, the chapter includes a
comprehensive review of the work related to the area of this thesis.
Chapter 3 describe the main types of equipment, methods, and materials used to
characterise both the feed powders and compacts.
Chapter 4 corresponds to the main results and discussion of this research work.
In this chapter, a comprehensive study was conducted in an attempt to build a mechanistic
understanding of the splitting phenomenon. The observed trends of ribbon splitting were
rationalised in terms of a splitting index.

27
Chapter 5 investigated the effect of knurled rollers which have a higher roller/powder
contact surface area on the occurrence of ribbon splitting/sticking. The predictability of
the splitting index was applied to the new data.
Chapter 6 focuses on the effect of the intermolecular interactions between feed powder
and metal surface on the occurrence of ribbon sticking. Energies of interaction have been
examined for any correlation with the trend of ribbon sticking.
Chapter 7 looked at the development of a data-driven model to predict the ribbon
porosity distribution using the artificial neural network approach (ANN). The chapter
presents a practical approach that could be implemented in the control system across the
manufacturing line.
Chapter 8 presents the overall conclusion of the thesis and recommends some future
studies.
28
CHAPTER 2 LITERATURE REVIEW
In an attempt to build a mechanistic understanding to the phenomena of ribbon
spitting/sticking, there is a need first to review the existed research efforts conducted in
the field of powder compact integrity during stress-mediated processes. The current
chapter focuses on the work reported in the literature about the factors that could affect
the integrity of a compact during and after stress application in roller compaction and
other stress-mediated processes such as tabletting. Compact integrity could be disrupted
externally by improper bond formation with the tooling surfaces or internally by un-
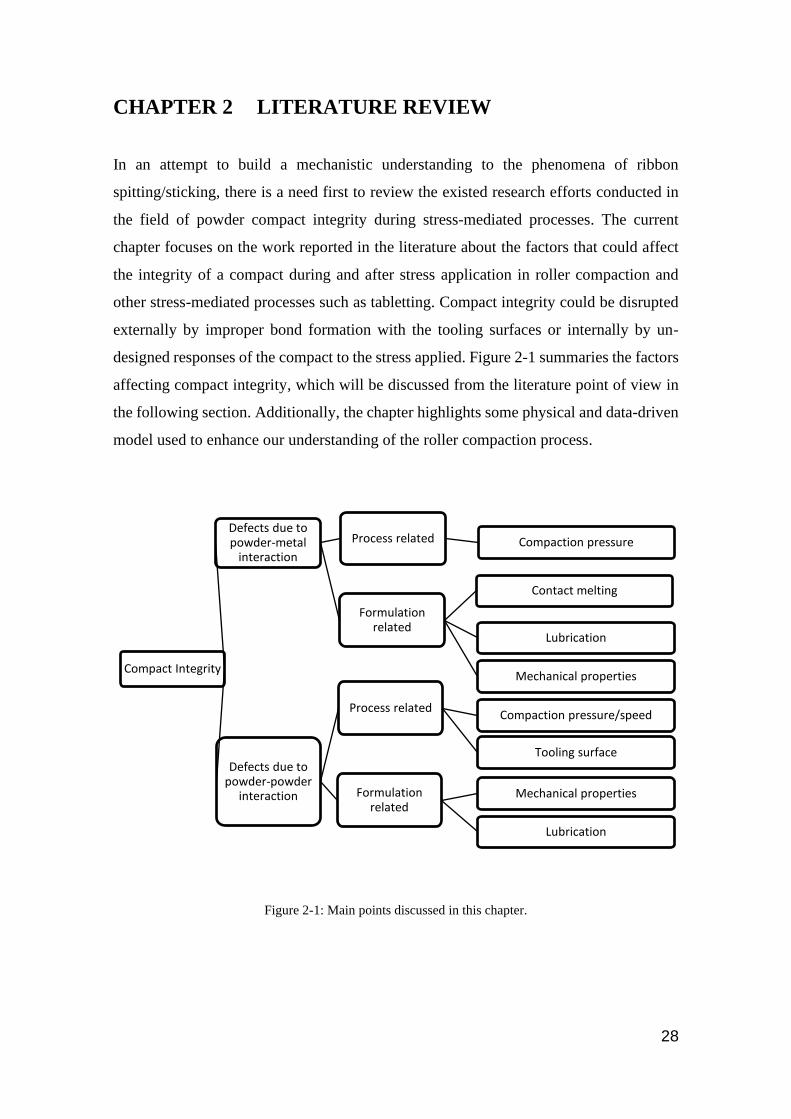
designed responses of the compact to the stress applied. Figure 2-1 summaries the factors
affecting compact integrity, which will be discussed from the literature point of view in
the following section. Additionally, the chapter highlights some physical and data-driven
model used to enhance our understanding of the roller compaction process.
Figure 2-1: Main points discussed in this chapter.
Compact Integrity
Defects due to powder-metal
interaction
Process related Compaction pressure
Formulation related
Contact melting
Lubrication
Mechanical properties
Defects due to powder-powder
interaction
Process relatedCompaction pressure/speed
Tooling surface
Formulation related
Mechanical properties
Lubrication
29
Compact defects due to sticking (powder-metal interaction)
Stickiness or adhesion of powder formulations during compaction is one of the most
common problems that are usually referred to the tablet stickiness. Materials adhere onto
the compression tooling, such as the roller surface, punch surface or the die wall, and
undergo multiple compaction cycles with the new materials being compacted; this may
result in an unacceptable, poor quality condition of the compact and might cause serious
damage to the press machine [19].
At the molecular scale, as hypothesized by Wang et al. [25], the potential of adhesion
during powder compaction is mainly determined by the intermolecular interaction
between the powder molecules and the tooling surface. In other words, the energies of
interaction on the molecular level between the powder and metal surface will determine
the primary adhesion process, and the subsequent mechanical events will affect the extent
of adhesion.
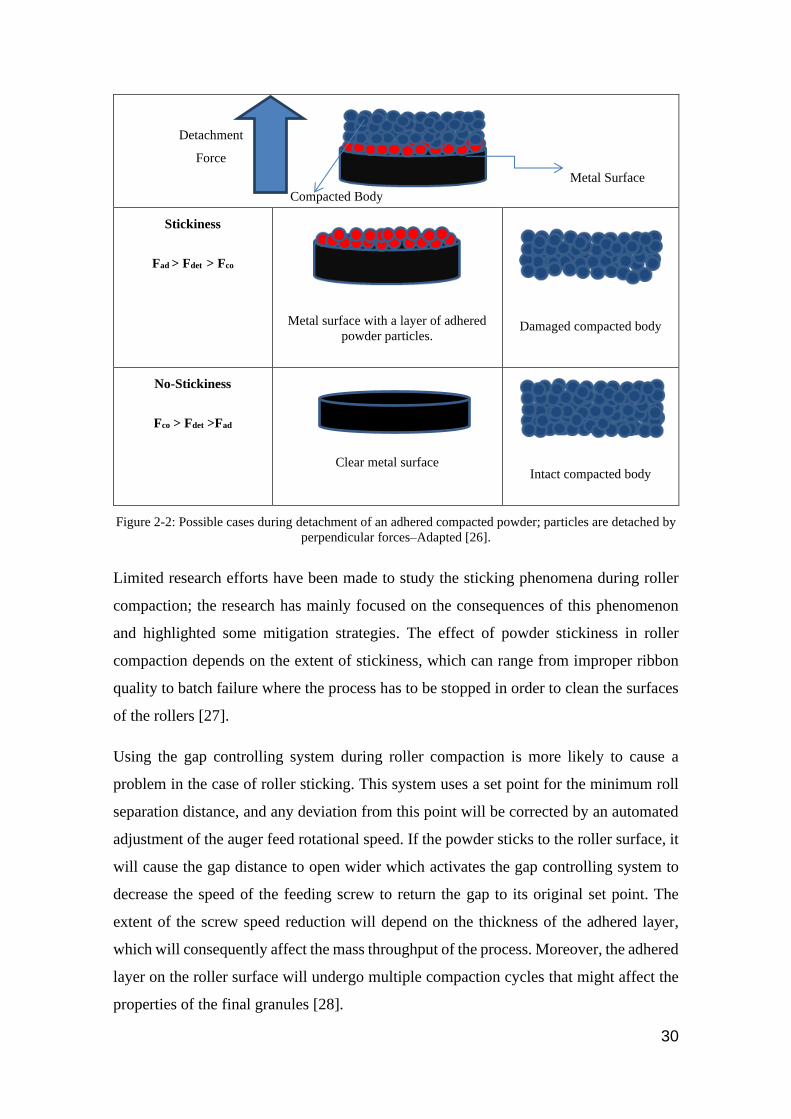
At a higher scale, Waimer et al. [26] explained sticking phenomenon during a tabletting
process; the study mentioned that tablet sticking occurred when there is an imbalance in
the relationship between the detachment force (Fdet), which is applied perpendicularly to
remove the tablet from the punch surface in comparison to the adhesion forces between
surfaces Fad and the cohesion forces inside the tablet (Fco). Thus, if the applied
perpendicular detachment force was higher than the adhesion force but not as high as the
cohesion forces within the tablet, the tablet will be removed freely from the punch surface
with no sticking. The measured detachment force in this case represents the real adhesion
forces between the tablet and the punch surface. However, if the applied detachment force
was lower than the adhesion forces, but higher than the cohesion inside the tablet, the
separation will take place within the tablet and stickiness will happen. In this case, the
measured detachment forces will represent the cohesion within the tablet. Moreover, if
the adhesion and cohesion forces are similar in their extent, separation takes place at the
surface as well as within the tablet and powder sticks partially to the punch face (Figure
2-2).
30
Stickiness
Fad > Fdet > Fco
Metal surface with a layer of adhered
powder particles.
Damaged compacted body
No-Stickiness
Fco > Fdet >Fad
Clear metal surface
Intact compacted body
Figure 2-2: Possible cases during detachment of an adhered compacted powder; particles are detached by
perpendicular forces–Adapted [26].
Limited research efforts have been made to study the sticking phenomena during roller
compaction; the research has mainly focused on the consequences of this phenomenon
and highlighted some mitigation strategies. The effect of powder stickiness in roller
compaction depends on the extent of stickiness, which can range from improper ribbon
quality to batch failure where the process has to be stopped in order to clean the surfaces
of the rollers [27].
Using the gap controlling system during roller compaction is more likely to cause a
problem in the case of roller sticking. This system uses a set point for the minimum roll
separation distance, and any deviation from this point will be corrected by an automated
adjustment of the auger feed rotational speed. If the powder sticks to the roller surface, it
will cause the gap distance to open wider which activates the gap controlling system to
decrease the speed of the feeding screw to return the gap to its original set point. The
extent of the screw speed reduction will depend on the thickness of the adhered layer,
which will consequently affect the mass throughput of the process. Moreover, the adhered
layer on the roller surface will undergo multiple compaction cycles that might affect the
properties of the final granules [28].
Metal Surface
Compacted Body
Detachment
Force
31
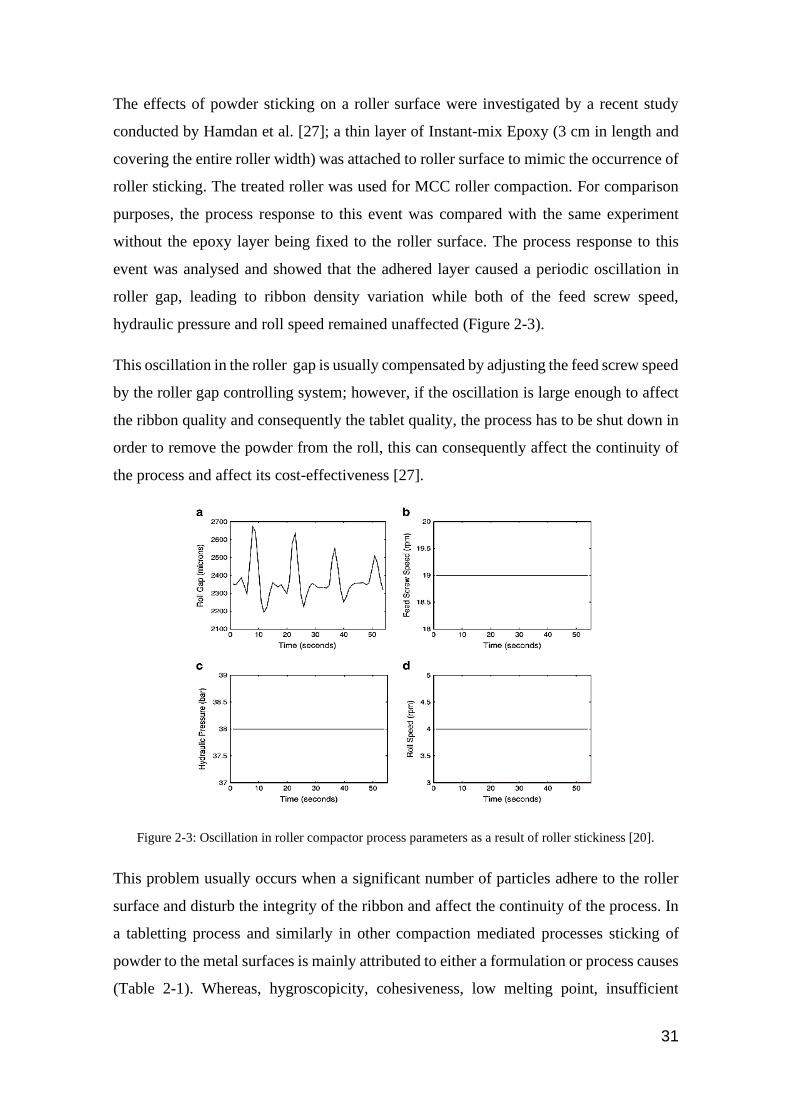
The effects of powder sticking on a roller surface were investigated by a recent study
conducted by Hamdan et al. [27]; a thin layer of Instant-mix Epoxy (3 cm in length and
covering the entire roller width) was attached to roller surface to mimic the occurrence of
roller sticking. The treated roller was used for MCC roller compaction. For comparison
purposes, the process response to this event was compared with the same experiment
without the epoxy layer being fixed to the roller surface. The process response to this
event was analysed and showed that the adhered layer caused a periodic oscillation in
roller gap, leading to ribbon density variation while both of the feed screw speed,
hydraulic pressure and roll speed remained unaffected (Figure 2-3).
This oscillation in the roller gap is usually compensated by adjusting the feed screw speed
by the roller gap controlling system; however, if the oscillation is large enough to affect
the ribbon quality and consequently the tablet quality, the process has to be shut down in
order to remove the powder from the roll, this can consequently affect the continuity of
the process and affect its cost-effectiveness [27].
Figure 2-3: Oscillation in roller compactor process parameters as a result of roller stickiness [20].
This problem usually occurs when a significant number of particles adhere to the roller
surface and disturb the integrity of the ribbon and affect the continuity of the process. In
a tabletting process and similarly in other compaction mediated processes sticking of
powder to the metal surfaces is mainly attributed to either a formulation or process causes
(Table 2-1). Whereas, hygroscopicity, cohesiveness, low melting point, insufficient
32
lubrication and poor powder characteristics; such as particle size and polymorphism are
the main formulation related causes. Using inappropriate scraper adjustment, or surface
configuration, too low compaction pressure, and rough surfaces are the main process-
based causes (Table 2-1).
Table 2-1: The main causes of powder stickiness during the tabletting process [19].
Formulation-related causes Process-related causes
Insufficient lubrication [29] Rough punch surface [19]
Poor powder characteristics [30]
(particle size, crystal structure or crystal habit)
Insufficient compaction force [31]
Contact melting [32] Improper surface engraving [19]
High moisture content [33] Improper compaction speed [31]
It is worth mentioning that both of the cohesion and adhesion are mediated by the same
mechanisms discussed before, but the term adhesion is usually referred to the interaction
between particles of different chemical nature [34].
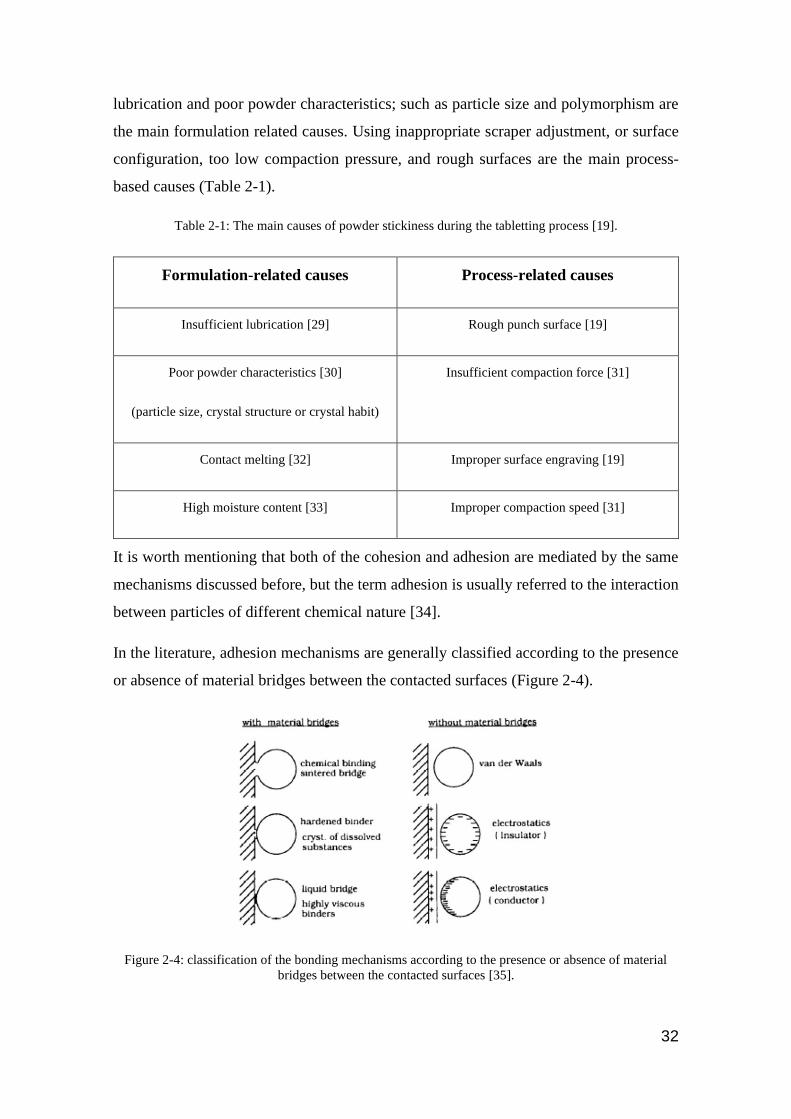
In the literature, adhesion mechanisms are generally classified according to the presence
or absence of material bridges between the contacted surfaces (Figure 2-4).
Figure 2-4: classification of the bonding mechanisms according to the presence or absence of material
bridges between the contacted surfaces [35].
33
However, other studies find it more useful to rank the adhesion forces according to their
strength in the following order (from weakest to strongest); electrostatic forces, van der
Waals, liquid bridges, and solid bridges respectively [35].
During processing, the different types of adhesion mechanisms could be prompted by
discrete mechanisms that could be a formulation or process-related.
Factors affecting sticking (powder-metal interaction)
Process-related factors
Effect of compaction pressure
The main function of the applied force during compaction is to create more contact area,
which will be provided either by the deformation or the breakage in order to increase the
probability of bond formation. Thus the higher the applied pressure, the more the cohesive
forces between the particles will be. However, the same applied force can mediate the
formation of unwanted bonding with the metal surface that can cause the problem of
sticking.
Kakimi et al. [31] investigated the effects of compaction pressure and speed on the tablet
sticking during compaction; a rotatory tabletting machine was used to compact wet
extruded granules made with a formulation of n-Butyl p-hydroxybenzoate, lactose,
anhydrous silicic acid and a binder of hydroxypropyl cellulose. The study showed that
sticking occurs when the adhesive forces between the tablet surface and the metal plate
are stronger than the cohesion forces inside the tablet. This outcome was confirmed by
measuring the scraper force (SCR), which is the shear force between the lower punch
surface and the surface of the tablet. As expected, increasing the compaction pressure
leads to stronger tablets that will result in a lower scraper force (Figure 2-5). At the same
time, the study showed the effects of the compaction speed on the sticking behaviour,
where high compaction speeds led to inadequate time to achieve relaxation within the
tablet and consequently a higher amount of residual pressure imparted to the lower the
punch, which is related to a higher adhesion force between the surfaces of the lower punch
and the tablet.
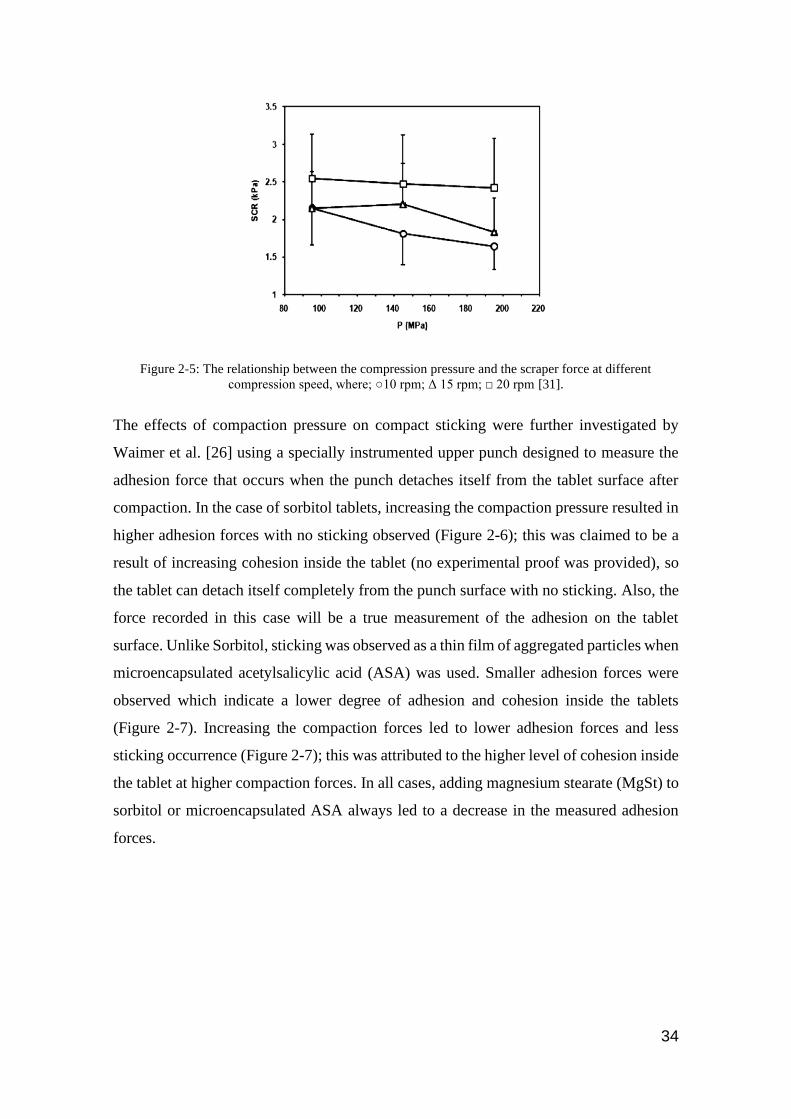
34
Figure 2-5: The relationship between the compression pressure and the scraper force at different
compression speed, where; ○10 rpm; Δ 15 rpm; □ 20 rpm [31].
The effects of compaction pressure on compact sticking were further investigated by
Waimer et al. [26] using a specially instrumented upper punch designed to measure the
adhesion force that occurs when the punch detaches itself from the tablet surface after
compaction. In the case of sorbitol tablets, increasing the compaction pressure resulted in
higher adhesion forces with no sticking observed (Figure 2-6); this was claimed to be a
result of increasing cohesion inside the tablet (no experimental proof was provided), so
the tablet can detach itself completely from the punch surface with no sticking. Also, the
force recorded in this case will be a true measurement of the adhesion on the tablet
surface. Unlike Sorbitol, sticking was observed as a thin film of aggregated particles when
microencapsulated acetylsalicylic acid (ASA) was used. Smaller adhesion forces were
observed which indicate a lower degree of adhesion and cohesion inside the tablets
(Figure 2-7). Increasing the compaction forces led to lower adhesion forces and less
sticking occurrence (Figure 2-7); this was attributed to the higher level of cohesion inside
the tablet at higher compaction forces. In all cases, adding magnesium stearate (MgSt) to
sorbitol or microencapsulated ASA always led to a decrease in the measured adhesion
forces.
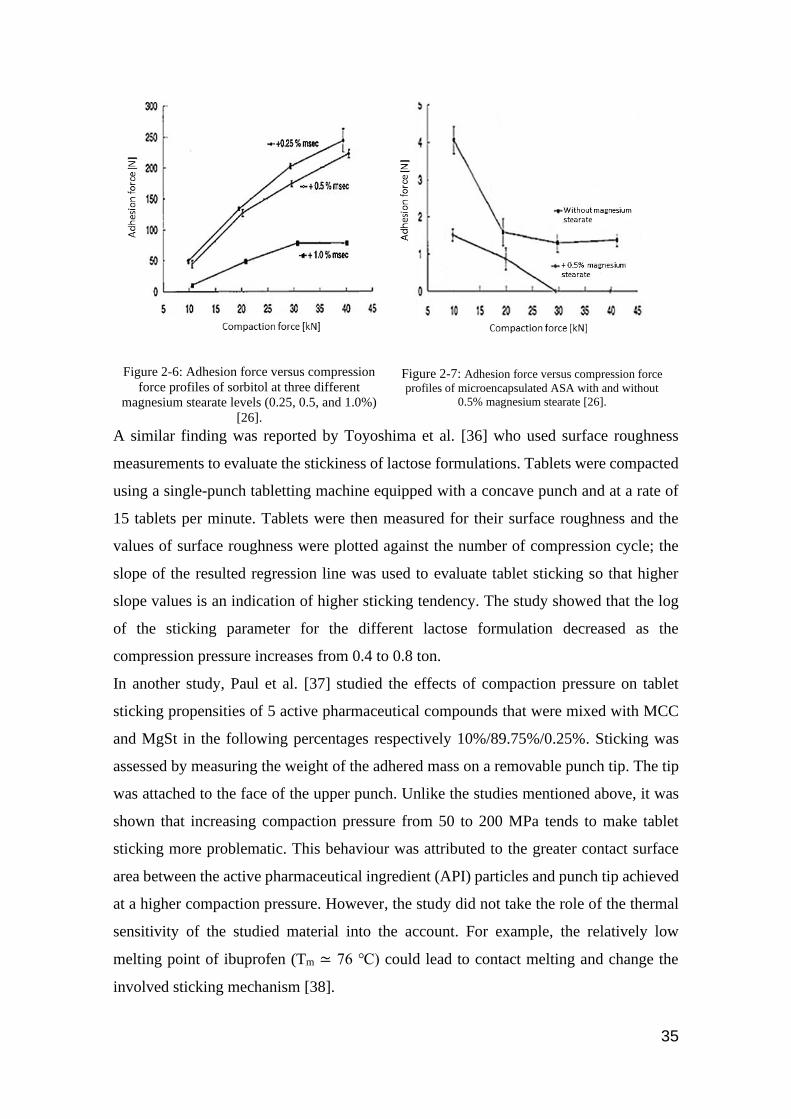
35
Figure 2-6: Adhesion force versus compression
force profiles of sorbitol at three different
magnesium stearate levels (0.25, 0.5, and 1.0%)
[26].
Figure 2-7: Adhesion force versus compression force
profiles of microencapsulated ASA with and without
0.5% magnesium stearate [26].
A similar finding was reported by Toyoshima et al. [36] who used surface roughness
measurements to evaluate the stickiness of lactose formulations. Tablets were compacted
using a single-punch tabletting machine equipped with a concave punch and at a rate of
15 tablets per minute. Tablets were then measured for their surface roughness and the
values of surface roughness were plotted against the number of compression cycle; the
slope of the resulted regression line was used to evaluate tablet sticking so that higher
slope values is an indication of higher sticking tendency. The study showed that the log
of the sticking parameter for the different lactose formulation decreased as the
compression pressure increases from 0.4 to 0.8 ton.
In another study, Paul et al. [37] studied the effects of compaction pressure on tablet
sticking propensities of 5 active pharmaceutical compounds that were mixed with MCC
and MgSt in the following percentages respectively 10%/89.75%/0.25%. Sticking was
assessed by measuring the weight of the adhered mass on a removable punch tip. The tip
was attached to the face of the upper punch. Unlike the studies mentioned above, it was
shown that increasing compaction pressure from 50 to 200 MPa tends to make tablet
sticking more problematic. This behaviour was attributed to the greater contact surface
area between the active pharmaceutical ingredient (API) particles and punch tip achieved
at a higher compaction pressure. However, the study did not take the role of the thermal
sensitivity of the studied material into the account. For example, the relatively low
melting point of ibuprofen (Tm ≃ 76 ℃) could lead to contact melting and change the
involved sticking mechanism [38].

36
Although extensive research has been conducted on the effect of compaction pressure on
the occurrence of sticking during the tabletting process, no attempt has been made to
investigate the effects of the applied stress on the development of sticking in the roller
compaction process in which different combinations of normal and shear stresses are
applied. This creates a research gap that will be addressed in more details in the coming
chapters.
Effect of tooling surface engravings
Fitting imposing or engravings onto the compaction-tooling surface could be essential for
identification purposes or to enhance the efficiency of the process; in the case of tabletting
processes, engravings are applied to the surfaces of the tablets for identification purposes
as ruled by the FDA for all solid oral dosage forms [39,40]. In the case of the roller
compaction process, knurled rollers are usually used to overcome problems associated
with insufficient gripping of feed powder into the gap between rollers. However, such
modifications could deteriorate the sticking problems encountered during powder
compaction [7,14,18,41,42].
Waimer et al. [43] used a specially designed upper punch to investigate the influence of
engraving on the extent of tablet sticking by measuring the tablet pull off force; the punch
was equipped with a small cone that could have different angles between the punch face
and the cones lateral face (Figure 2-8). During unloading, the measured adhesion signal
could either represents a separation at the punch surface (adhesion) or inside the tablet
(cohesion).
Figure 2-8: The instrumented compaction tooling used by Waimer et al. [43]. The figure also shows a
schematic drawing to the shear cone that is fixed to the upper punch surface. α is the angle between the
punch plain surface and the cone lateral surface.
The study concluded that the shape of the shear cones is an important factor for the
occurrence of punch sticking; the two formulations explored in this study showed more

37
tablet sticking when the cone angle increased from 45º to 60 º. The study also mentioned
that the cones create a stress and strength distribution at the tablet surface that could
consequently affect the behaviour of sticking at the engravings of the punch surface.
Similarly, Roberts et al. [44] investigated the effect of punch tip embossments on tablet
stickiness of an ibuprofen formulation. Tablet sticking was quantified by measuring the
weight of the adhered powder on the upper punch tip. The presence of engravings on the
punch faces significantly increased tablet sticking comparing with the non-embossed
punches. This was attributed to the high shear stresses at the lateral faces of the engravings
that enhance the occurrence of sticking during punch retraction. The authors stated that
sticking to embossed punches was less dependent on compaction pressure compared with
the non-embossed punches. The study also showed that sticking to the punch face was
reduced by increasing punch tip curvature but was independent on punch diameter.
In the case of the roller compaction process, using knurled rollers could be advantageous
in terms of increasing friction at powder/roller interface. This could be mandatory for
some lubricated formulation. Otherwise, the powder will build up in the pre-nip area and
block the feeding system [28]. However, the use of knurled rollers was observed by many
researchers to deteriorate the occurrence of roller sticking and affect the efficiency of the
process [7,14,18,28,41,42]. Alternatively, a pair of smooth rollers or a combination of
knurled and smooth rollers are used to reduce roller sticking.
On the basis of the existing literature and experimental observations, further work is
required to understand the impact of using knurled rollers in terms of its influence on the
occurrence of sticking and the properties of the compacted ribbons.
Formulation related factors
Effect of particle mechanical properties
Particle adhesion to a surface can vary according to the mechanical properties of the
contacting materials such as hardness, elasticity and viscoelasticity. These properties
control the response of powder particles to the applied stress and can consequently
influence powder sticking by changing both of bonding area and bonding strength either
between powder particles (cohesion) or between powder particles and the metal surface
(adhesion).
Hardness can be defined as the resistance of the solid material against the indentation
caused by a second solid body [45]. On the other hand, elasticity is the ability of the
38
material to recover its shape and size upon load release and it is usually characterised by
Young’s modulus 𝐸𝑝 [Pa] which is the constant of linear proportionality between the
extensional stress 𝜎 [Nm-2] and the extensional strain ε:
𝜎 = 𝐸𝑝ε (Equation 2-1)
However, during stress application, the nature of particle deformation changes from
elastic to plastic at a certain applied stress called the yield stress (Py). Additionally, if the
mechanical properties of the material such as Young’s modulus of elasticity changed with
time, then the material is referred to as viscoelastic.
Paul et al. [37] studied the sticking propensities of five different APIs to the punch during
tabletting; the API was mixed with MCC at 9.75 w/w%. Sticking was evaluated by the
weight of the adhered powder to a removable punch tip after 25 compactions for a total
of 100 compactions. They investigated tablet sticking at a range of powder deformability
and compaction forces. The powders deformability was assessed by macro-indentation
method using a spherical indenter on tablets made from 1:1 mixture of MCC and API;
tablets have been compacted at a range of pressures, indentation hardness of the
compacted tablets at zero porosity that is obtained by extrapolation was then used to order
materials according to their plasticity. The study showed that the sticking tendency
increases with increasing powder deformability in the moderate to high pressure range
(100-200 MPa), the authors mainly attributed this to the higher contact surface area with
the punch and the higher cohesion of the API to the sticking layer on the punch. However,
it was difficult to show a clear relationship between particle deformability and punch
sticking at lower compaction pressures. Nevertheless, the study neglected the effects of
powder thermal properties, which could affect particle adhesion behaviour during
compaction, for example, the relatively low melting point of ibuprofen (Tm ≃ 76 ℃)
could lead to contact melting and change the sticking mechanism [38].
On the contrary, Chattoraj et al. [39] reported that a large number of compounds that show
a tendency to stick during compaction are among those with the highest yield point in
pharmaceutical formulations. For example, the authors mentioned both α-lactose
monohydrate and mannitol as sticky materials with a relatively high yield-values in
comparison with plastic materials. In another study, Abdel-Hamid and Betz [46] used
the radial die wall pressure as a criterion to evaluate punch sticking; this includes SR (the
stress ratio which is axial to radial stress transmission) and RDP (the residual die pressure

39
measured just after removing the normal stress). Different amounts of a highly sticking
drug (Mefenamic acid) were mixed with various types of fillers that are either brittle
(lactose or mannitol) or elastic-plastic (MCC or starch) in nature. The mixtures were then
compacted using a compaction simulator at a range of compaction pressures. The study
showed that formulations made with brittle fillers showed higher tendencies for punch
sticking than viscoelastic fillers, which showed higher sticking to the die-walls. The
authors ascribed sticking observations to the higher SR in the case of brittle fillers; they
claimed that brittle fillers undergo higher axial to radial stress transmission which offers
a higher chance for this formulations to interact with the punch surface and enhance punch
sticking. This is unlike formulations made with viscoelastic fillers which exhibited higher
tendencies for die wall sticking associated with higher values RDP; this was further
confirmed by the higher ejection forces observed with these formulations.
So far, there are no available studies to investigate the effects of material mechanical
properties on the sticking during roller compaction processes. However, some efforts
were made to correlate powder mechanical properties to the cohesion properties of the
compacted ribbons, which could be helpful to understand the sticking that could take
place during roller compaction. Al-Asady et al. [45] successfully correlated the Nano-
Indentation hardness for six different types of materials to their workability during roller
compaction. The investigated materials ranged from very hard material calcium carbonate
to a very ductile material MCC. Materials were characterised for their flow properties and
compressibility and the maximum stress applied during roller compaction was estimated
using Johanson’s theory [47]. The authors found that if the measured particle hardness
was lower than the maximum stress applied during roller compaction then stronger ribbon
are expected as a result of more plastic deformation (Figure 2-9). Higher particle
deformability was also associated with higher ribbon width and lower ribbon porosity.
This was believed to be due to the higher contact area as a result of more plastic
deformation that provided a higher probability for bonds formation.

40
Figure 2-9: The effect of materials hardness value on its ribbon tensile strength that was produced using
roller compactor at 100 bar hydraulic pressure. (▲Avicel PH 101, ○ Glucidex16, + Tylpor 604, ■
pharmatose 200 M, Δ sodium carbonate, calcium carbonate) [45].
Effect of Lubrication
One of the most obvious causes of sticking during compaction is insufficient lubrication
of the formulation. In the pharmaceutical industry, the most common lubrication
mechanism is boundary lubrication in which the lubricant particles form layers between
the surfaces or at interfaces to reduce the direct contact between the intended surfaces.
Lubricant concentration/mixing time in the formulation has to be optimized so that it can
reduce unnecessary friction/adhesion to the tool surfaces at the minimal adverse effect on
the particle-particle interaction inside the formulation, which could consequently
influence the performance of the lubricated compact in terms of strength and dissolution
[48].
Lubrication has been extensively studied in the field of tabletting processes; most of the
research conducted in this field showed a significant reduction in the occurrence of
sticking as the lubricant content was increased in the formulation [36,49,50]. However,
not all materials show the same effect. Roberts et al. [51] used two different types of
lubricant, namely magnesium stearate and stearic acid to evaluate the sticking tendency
of an ibuprofen/lactose formulation on the punch tips during tabletting. Sticking was
assessed by quantifying the amount of ibuprofen adhered to the upper punch using diode
array spectroscopy. Unexpectedly, the study showed that increasing lubricant content
does not reduce the sticking occurrence. Adding magnesium stearate to the formulation
led to higher punch sticking, the authors attributed this to the lowering of ibuprofen
melting point by magnesium stearate combined with the negative effect of the lubricant

41
on the cohesive forces within the tablet. The authors also mentioned that the presence of
glidant (Aerosil) in the formulation alleviated the deleterious effect of magnesium
stearate on the tablet strength. However this comes at the cost of reducing the lubricating
efficiency and lead to capping problems.
Limited studies were conducted to understand the effect of lubrication on the performance
of roller compaction processes; a study carried out by Dawes et al. [18] investigated the
effect external lubrication on the adhesion behaviour of a pharmaceutical formulation
containing adhesive API. A novel system was designed to spray a controlled quantity of
magnesium stearate on the roller surface; the travel roll distance per shot (dps), which is
the distance the circumference of the roll travels between lubricant shots has been used
as a scalable parameter to ensure consistent lubrication during roller rotation (Equation
2-2).
𝑑𝑝𝑠 = 𝜋. 𝑑𝑟 . 𝑣𝑟
𝑆𝑝𝑚
(Equation 2-2)
where, 𝑑𝑟 is the roll diameter, 𝑣𝑟 is the roll speed (rpm), and 𝑆𝑝𝑚 is the number of shots
per minute (min-1).
A placebo formulation of microcrystalline cellulose, anhydrous β-lactose and
croscarmellose sodium were used in this study. It showed that reducing the dps from 3 to
1 cm led to four different scenarios of roller sticking that ranged from (a) the best case to
(d) the worst case (Figure 2-10). Working with an unlubricated formulation led to the
worst case in which the formulation adhered to the roller surfaces and formed a complete
surface coverage (Figure 2-10-d). The application of external lubricant using a dps of 3
cm decreased the severity of the roller sticking so that the ribbons split in half after leaving
the minimum gap and incompletely removed by the scraper (Figure 2-10-c). A further
decrease of the dps to 2 cm leads to the compacted ribbon appearing to completely adhere
to the roller surface, but it was entirely removed by the scraper and the roll surface
remained clean during its rotation (Figure 2-10-b). At a roller travelling distance of 1 cm,
the ribbon was observed to leave the roller surface immediately after release from the
minimum gap with no splitting and again resulting in a clean roll surface (Figure 2-10-a).

42
Figure 2-10: Suggested scenarios of the roller stickiness ranging from the best case (a) to worst case with
complete roller coverage (d) [18].
The study also reported that sticking to the roller surfaces was associated with variation
in the measured roller gap with time. The use of external lubrication kept the roller gap
relatively constant. However, cessation of external lubrication resulted in a significant
increase in the roller gap that started to fluctuate between 1.6 and 2.2 mm (Figure 2-11).
Figure 2-11: Change in roll gap distance as a response to external lubrication application.
A similar study conducted by the same researchers [28] in which a similar formulation of
anhydrous β-lactose, microcrystalline cellulose and sodium croscarmellose sodium was
used to investigate the effect internal lubrication (magnesium stearate) on the powder

43
feeding during roller compaction. It was shown that roller sticking of the unlubricated
formulation occurred in about 30-60 sec from the start up. However, adding magnesium
stearate to the formulations (from 0.05 to 0.5% w/w) completely impeded roller sticking
during compaction. The authors reported that compared to the un-lubricated formulation,
a lubricated formulation showed a higher mass throughput when a pair of knurled rollers
were used. Nevertheless, this effect was remarkably lowered if one or both rollers were
replaced with smooth rollers.
Contact melting
During compression, particles are subjected to high levels of localized stress that could
create points of high temperature. The generated heat might exceed the melting/glass
transition temperature of the compressed material and subsequently enhance its adhesion
to the roller surface [52]. At relatively low temperatures, and excluding the effects of
moisture, adhesion is dominated by London Lifshitz-van der Waals forces which are
described by the following equation [34]:
𝐹𝑣𝑑𝑊 =ɦѿ𝑟
8𝜋ℎ𝑑2
(Equation 2-3)
where 𝐹𝑣𝑑𝑊 is the Lifshitz-van der Waal force [N], ɦѿ is the Lifshitz-vand der Waal
constant, [J], r is the particle radius [m], and ℎ𝑑 is the distance of separation between the
contiguous bodies [m]. Temperature can affect the interaction constant ɦѿ, as it is a
measure of the energy of the Lifshitz-van der Waal interaction between two bodies of
similar or different geometry. This value may be measured using dielectric spectroscopy
or can be derived from the properties of the materials in contact and can change according
to the medium temperature [34].
At higher temperatures, closer to the thermal transition of the material that could be a
glass transition in the case of amorphous material or melting in the case of crystalline
materials, the heating will excite the molecules to higher vibration energies and
consequently increase the mobility and its plastic deformability [53].
In the case of tabletting processes, the high compaction speed and the build-up of
temperature during long operation times can increase the temperature by 20-30 °C beyond
the ambient temperature [52,54]. This could have an influence on a lower melting point
44
component of the formulation such as ibuprofen (Tm 75-78 °C) and affect both of the
mechanical properties and the sticking behaviour of the compacted materials [19,51].
Danjo et al. [32] studied the effects of operating temperature on the sticking of butyl p-
hydroxybenzoate during tabletting. Punch sticking was evaluated by measuring the
pressure applied by the scraper to detach the tablet from the lower punch. Punch
temperature was controlled using thermocouples that were placed at different parts of the
tabletting machine and then connected to an air dryer. The study showed that the scrapper
pressure indicates a maximum value when the ratio of the lower punch temperature to the
API melting point becomes about 0.9 for every sample. This thermal ratio was
accompanied by a remarkable punch sticking, which was attributed to the occurrence of
sintering between the tablet and punch surfaces. The scraper pressure findings were
further confirmed by conducting a shear test between the tablet and a metal plate surface
at a range of temperatures using specially designed equipment. It showed that both
scrapper pressure and shear strength were maximal at the same thermal ratio.
In another study, Cespi et al. [55] investigated the effect of processing temperature on the
cohesion of tablets, which as explained previously could affect the sticking tendencies
during tabletting. Four different types of pharmaceutical excipients that have different
mechanical behaviours and distinct thermal sensitivities were investigated; this included
both of microcrystalline cellulose (MCC) and dicalcium phosphate dehydrate (PDC)
which do not have any thermal change in the range of 20-150 °C, polyethene oxide (PEO)
which has a melting point between 50-75 °C, and Eudragit RS (EURS) with a glass
transition transformation at 50-60 °C. Tabletting was conducted using a rotary tabletting
machine that was equipped with special sensors and devices to control temperature and
humidity in the compaction area. The authors reported that only materials which have a
thermal change at relatively a low range of temperatures showed a changed in the compact
properties. Yet, this change was less significance for less ductile and negligible for brittle
materials. As shown in Figure 2-12, both PEO and EURS have a significant increase in
the deformability (lower yield strength (Py) values-determined by Heckel analysis) at
lower temperatures. On the other hand, both MCC and PDC were less affected. The effect
of temperature was reflected as a change in tablet tensile strength; an analysis showed a
remarkable increase in tablet strength for materials characterized by a thermal transition
at low temperatures.
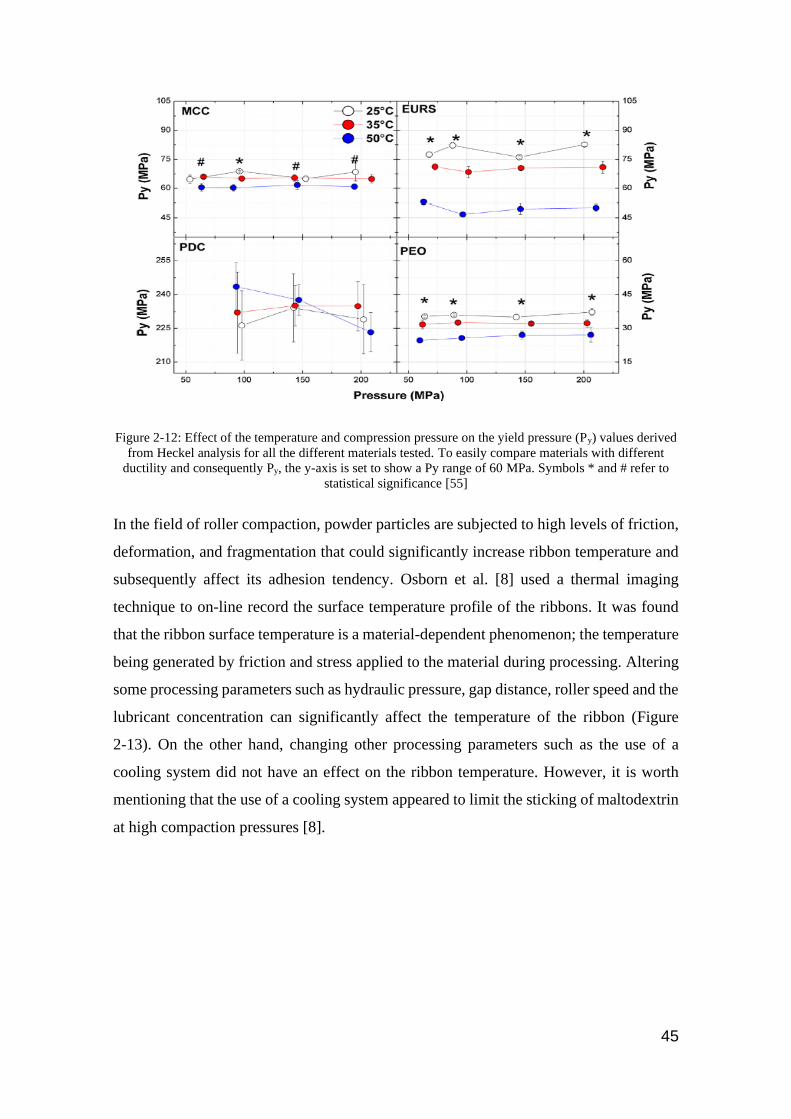
45
Figure 2-12: Effect of the temperature and compression pressure on the yield pressure (Py) values derived
from Heckel analysis for all the different materials tested. To easily compare materials with different
ductility and consequently Py, the y-axis is set to show a Py range of 60 MPa. Symbols * and # refer to
statistical significance [55]
In the field of roller compaction, powder particles are subjected to high levels of friction,
deformation, and fragmentation that could significantly increase ribbon temperature and
subsequently affect its adhesion tendency. Osborn et al. [8] used a thermal imaging
technique to on-line record the surface temperature profile of the ribbons. It was found
that the ribbon surface temperature is a material-dependent phenomenon; the temperature
being generated by friction and stress applied to the material during processing. Altering
some processing parameters such as hydraulic pressure, gap distance, roller speed and the
lubricant concentration can significantly affect the temperature of the ribbon (Figure
2-13). On the other hand, changing other processing parameters such as the use of a
cooling system did not have an effect on the ribbon temperature. However, it is worth
mentioning that the use of a cooling system appeared to limit the sticking of maltodextrin
at high compaction pressures [8].

46
Figure 2-13: Temperature increase of ribbons of different materials during roller compaction at varying
hydraulic pressures [8].
In a more detailed study, Omar et al. [56] employed an online thermal imaging technique
to determine ribbon surface temperatures at a wide range of processing parameters. α-
lactose monohydrate was used as a model material for this study. Ribbon surface
temperature was shown to increase slightly with increasing roller speed; this was
attributed to both 1) the increase in powder internal friction at higher powder velocities
when powder particles pass between the rollers and 2) the increase in the feeder screw
speed at constant gap distance. Similarly and due to the same reasons, increasing either
gap distance or screw speed lead to higher of ribbon surface temperatures.
More recently Wiedey and Kleinebudde [57] evaluated the use of thermography
technology to monitor the cohesion property of the ribbon in terms of its solid fraction.
The applicability of this technique was tested on a wide range of fillers that possess
different mechanical and thermal properties and at various levels of magnesium stearate.
A calibration curve was developed to correlate ribbon surface temperature with the solid
fraction. The curve was then applied to determine ribbon solid fraction at a wide range of
processing parameters. The authors reported that calibration curves varied substantially
in terms of slope and offset so that a new calibration curve has to be devised for every
formulation. For all tested materials, the ribbon surface temperature increased at higher
solid fractions, however this relationship varied significantly in the case of roller sticking
occurrence; plastic materials with no roller sticking showed high R2, whereas moderately
sticking DCPA showed a lower value and the extremely sticking mannitol showed a much
lower correlation value (Table 2-2). The authors referred that to the reduction in the gap

47
distance when material permanently adhere to the roller surface. Moreover, the study
showed that adding magnesium stearate to the powder lead to higher heat development
especially when a pair of smooth rollers were employed; this was claimed to be a result
of the accumulation of powder around the tamping auger, which by friction increased the
temperature of the powder prior to compaction.
Table 2-2: Correlation between sticking to roller surface and the adjusted coefficient of determination
[57].
Material Roller sticking R2
Isomalt None 0.9999
MCC None 0.9884
DCPA Moderate 0.9505
mannitol Massive 0.7893
Compact defect due to improper interaction between powder
particles (cohesion-induced defects)
In addition to the compact defects induced by the powder-metal interaction (adhesion
induced compact defect), a compact defect can also originate from the response of the
compacted material to the applied stress (cohesion-induced defects), this is similar to the
capping and lamination encountered during tabletting processes. Several hypotheses were
made to understand the incidence of such kind of failure. Dwivedi [58] hypothesised that
compact failure during decompression occurs when the bonds formed during compression
cannot withstand the elastic recovery during decompression. Furthermore, Wu et al. [59]
used the finite element method (FEM) to investigate the compaction behaviour of powder
during compaction. Lactose powder was modelled as an elastoplastic continuum using
the Drucker-Prager Cap (DPC) model. The FEM showed a heterogeneous density
distribution across tablet dimensions; very dense zone at the top edge of the tablet and a
relatively low density at the lower edge (Figure 2-14-A).

48
A B
Figure 2-14: the distribution of (A) density at maximum compaction pressure and (B) Shear stresses as
reported in Wu et al. [59].
This heterogeneity was attributed to the friction along the die wall that inhibits powder
movement as the punch moves downwards. The heterogeneity of the density distribution
indicates more relaxation at the tablet top compared with that at the bottom. Tablet
recovery was associated with intensive shear bands that propagate from the surface
towards the centre edge (Figure 2-14-B); this shear band was considered to be the main
cause of capping during de-compaction. The results of the density distribution and
development of failure were all demonstrated experimentally using X-ray
microtomographic images. This mechanism of compact failure has also been reported in
a similar study [17].
It has been suggested that other contributory factors could also participate in the
development of the compact defects such as air entrapment, which prevents strong bond
formation during compaction [60], friction conditions between the powder and the die
wall [17], and the deformation characteristics of the compacted materials [15,61].
On the other hand, so far there is no clear understanding of the cohesion-induced compact
failures that take place in the roller compaction processes. However, a few researches
reported the occurrence of such defects during roller compaction; no clear understanding
of the underlying mechanism was provided. Wu et al. [62] investigated the effects of the
moisture content of microcrystalline cellulose (MCC) as a feed powder and noted that the
ribbons produced at high values (>11.44 %) tended to split across the width. It was
ascribed to the resulting reduction in the tensile strength of the ribbons. Ende et al. [63]
reported that, for a range of powder feeds, the occurrence of ribbon splitting (the exact
location of the splitting was not mentioned) was minimised when the gap was < 2.6 mm.
Cunningham et al. [64] suggested, based on finite element modelling that the reversal of
the direction of the shear stress at the neutral angle could be a contributory factor given
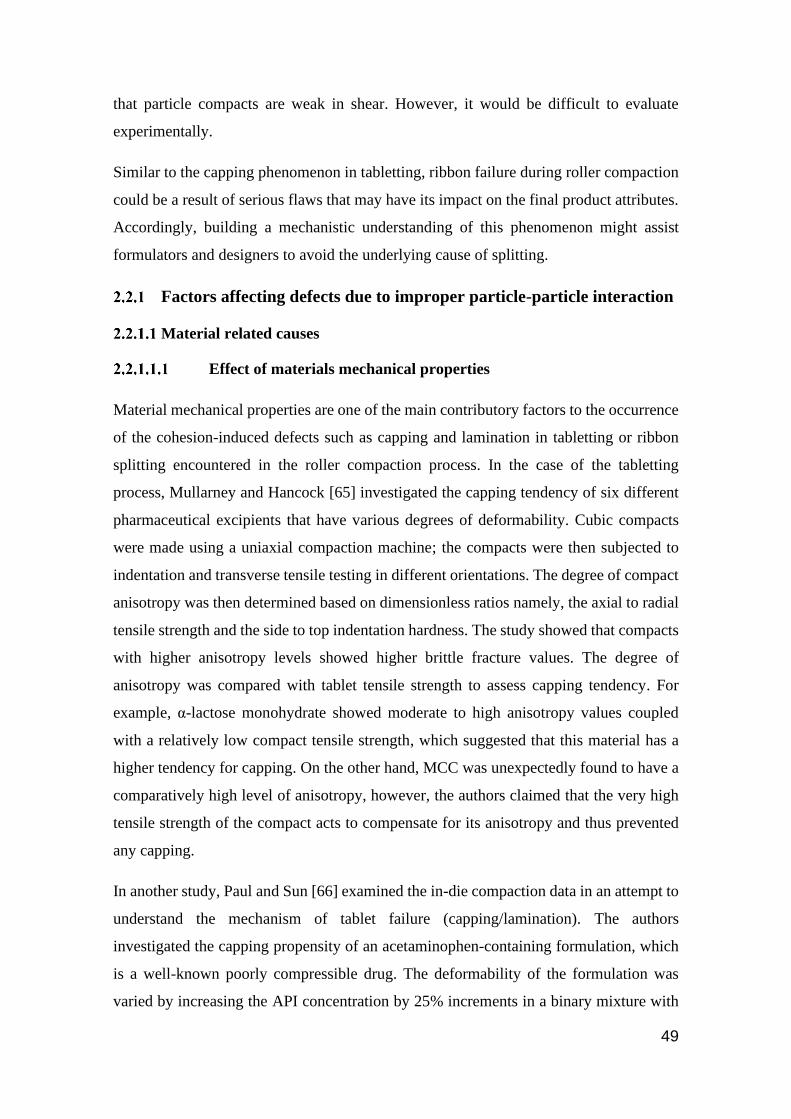
49
that particle compacts are weak in shear. However, it would be difficult to evaluate
experimentally.
Similar to the capping phenomenon in tabletting, ribbon failure during roller compaction
could be a result of serious flaws that may have its impact on the final product attributes.
Accordingly, building a mechanistic understanding of this phenomenon might assist
formulators and designers to avoid the underlying cause of splitting.
Factors affecting defects due to improper particle-particle interaction
Material related causes
Effect of materials mechanical properties
Material mechanical properties are one of the main contributory factors to the occurrence
of the cohesion-induced defects such as capping and lamination in tabletting or ribbon
splitting encountered in the roller compaction process. In the case of the tabletting
process, Mullarney and Hancock [65] investigated the capping tendency of six different
pharmaceutical excipients that have various degrees of deformability. Cubic compacts
were made using a uniaxial compaction machine; the compacts were then subjected to
indentation and transverse tensile testing in different orientations. The degree of compact
anisotropy was then determined based on dimensionless ratios namely, the axial to radial
tensile strength and the side to top indentation hardness. The study showed that compacts
with higher anisotropy levels showed higher brittle fracture values. The degree of
anisotropy was compared with tablet tensile strength to assess capping tendency. For
example, α-lactose monohydrate showed moderate to high anisotropy values coupled
with a relatively low compact tensile strength, which suggested that this material has a
higher tendency for capping. On the other hand, MCC was unexpectedly found to have a
comparatively high level of anisotropy, however, the authors claimed that the very high
tensile strength of the compact acts to compensate for its anisotropy and thus prevented
any capping.
In another study, Paul and Sun [66] examined the in-die compaction data in an attempt to
understand the mechanism of tablet failure (capping/lamination). The authors
investigated the capping propensity of an acetaminophen-containing formulation, which
is a well-known poorly compressible drug. The deformability of the formulation was
varied by increasing the API concentration by 25% increments in a binary mixture with
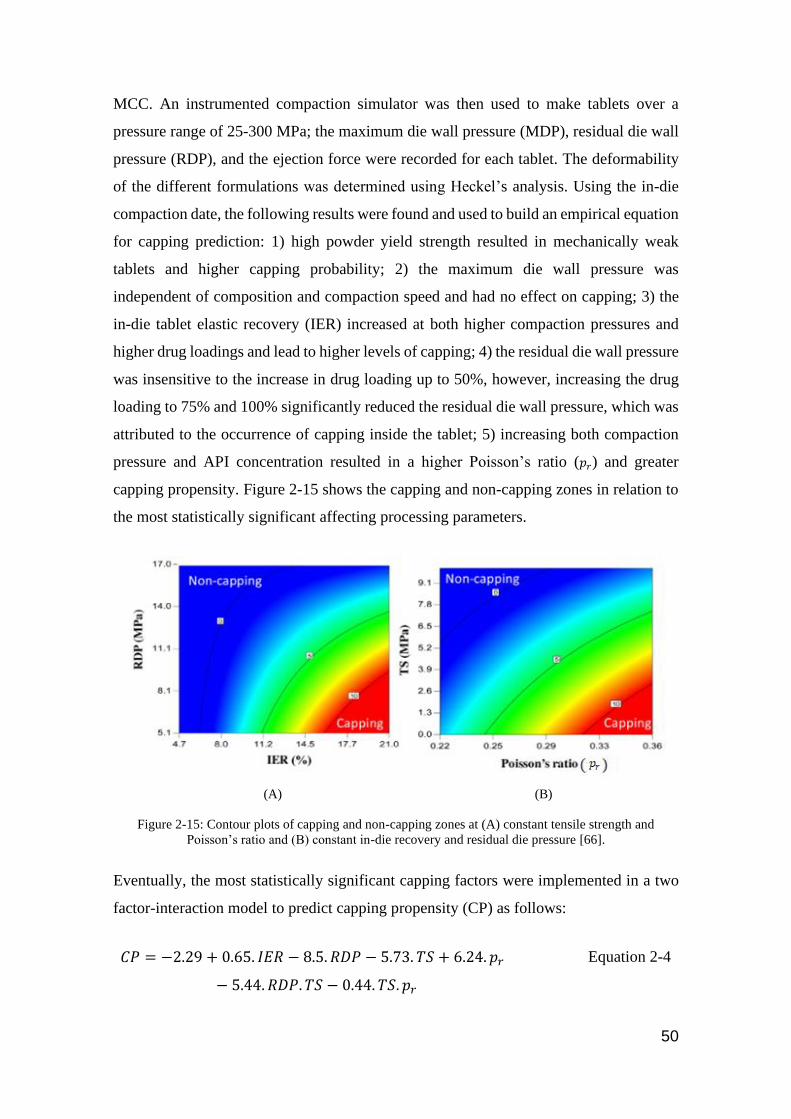
50
MCC. An instrumented compaction simulator was then used to make tablets over a
pressure range of 25-300 MPa; the maximum die wall pressure (MDP), residual die wall
pressure (RDP), and the ejection force were recorded for each tablet. The deformability
of the different formulations was determined using Heckel’s analysis. Using the in-die
compaction date, the following results were found and used to build an empirical equation
for capping prediction: 1) high powder yield strength resulted in mechanically weak
tablets and higher capping probability; 2) the maximum die wall pressure was
independent of composition and compaction speed and had no effect on capping; 3) the
in-die tablet elastic recovery (IER) increased at both higher compaction pressures and
higher drug loadings and lead to higher levels of capping; 4) the residual die wall pressure
was insensitive to the increase in drug loading up to 50%, however, increasing the drug
loading to 75% and 100% significantly reduced the residual die wall pressure, which was
attributed to the occurrence of capping inside the tablet; 5) increasing both compaction
pressure and API concentration resulted in a higher Poisson’s ratio (𝑝𝑟) and greater
capping propensity. Figure 2-15 shows the capping and non-capping zones in relation to
the most statistically significant affecting processing parameters.
(A) (B)
Figure 2-15: Contour plots of capping and non-capping zones at (A) constant tensile strength and
Poisson’s ratio and (B) constant in-die recovery and residual die pressure [66].
Eventually, the most statistically significant capping factors were implemented in a two
factor-interaction model to predict capping propensity (CP) as follows:
𝐶𝑃 = −2.29 + 0.65. 𝐼𝐸𝑅 − 8.5. 𝑅𝐷𝑃 − 5.73. 𝑇𝑆 + 6.24. 𝑝𝑟
− 5.44. 𝑅𝐷𝑃. 𝑇𝑆 − 0.44. 𝑇𝑆. 𝑝𝑟
Equation 2-4
51
Similarly, Kuppuswamy et al. [67] investigated the role of powder mechanical properties
on the capping tendency; three sets of binary mixtures were chosen to represent three
different types of deformation combinations namely, plastic-plastic, brittle-plastic and
brittle-brittle. MCC and magnesium stearate (MgSt) were selected as plastic model
materials, while dicalcium phosphate dihydrate (DCP) and acetaminophen (APAP) were
chosen as brittle materials. The capping propensity was evaluated by conducting
indentation hardness measurements on the surfaces of the different tablets; the study
classified capping tendency according to the indentation depth at which a crack takes
place, while the surface crack is evaluated based on images taken by light and scanning
electron microscopes. If the indentation test leads to cracks at an indentation depth of 0.5
mm or lower, the tested material is then classified as susceptible to fail upon compaction.
Also, if no cracks occurred up to 0.7 mm, this indicates low failure risk. Nevertheless,
cracks initiated between 0.5 and 0.7 mm and then the material has to be treated with
caution. The results are mainly attributed to the ability of the plastic material to prevent
crack propagation.
Similar findings were reported in another study [15]; however, so far, no attempts have
been conducted to understand the developments of such compact defects in the field of
roller compaction.
Effect of lubrication
Lubricants are well known to reduce both powder/tooling and powder/powder friction,
which could be beneficial in minimising compact defects [68]. Factors like lubricant
concentration [69], type [70], method of application [71], and drug-lubricant interaction
[72] are the main factors that should be optimised before lubrication. Takeuchi et al. [71]
assessed the effects of lubrication on the capping tendency of two different
pharmaceutical excipients, namely lactose and mannitol, during tabletting. MgSt was
either added by internal or external methods; in the case of the external method, the
lubricant was applied directly on the die wall using a cotton bud. Whereas in the case of
internal lubrication, each excipient was mixed with different concentrations of MgSt in
the range of 0.1 to 1%. The capping tendency was evaluated based on the several
compaction parameters including MDP (mean die wall pressure), RDP (residual die wall
pressure), and the ratio of RDP/MDP. The study presented RDP/MDP as a novel index
to predict capping propensity even in the case of external lubrication. A lower index value
52
suggests a higher degree of bond formation and lower capping tendency; this is because
of the higher stress transition at the maximum applied normal stress as indicated by the
MDP, in addition to the lower friction with the die wall as presented by the RDP. The
effect of lubricant addition on the suggested capping index is shown in (Figure 2-16); the
use of external lubrication for lactose and mannitol corresponds to 1% and 0.5% for those
internally lubricated tablets. As seen in the figure, adding lubricant either internally or
externally was successful in minimising tablet capping, which extensively happened
without lubrication. Capping occurrence a is represented by (*).
(A) (B)
Figure 2-16: effect of external and internal lubrication on the RDP/MDP for A: lactose and B: mannitol. *
Capping was observed during tabletting [71].
Similar findings were reported by Zuurman et al. [73] who investigated the effect of MgSt
on the level of particle bonding of two materials with different deformation behaviour
namely, MCC (predominantly plastically deformable) and sorbitol (more brittle in
nature). In comparison with sorbitol, MCC tablets showed a higher lubricant sensitivity
as indicated by the higher reduction in tensile strength when lubricant was added (Figure
2-17 A-B). This was attributed to the fragmentation of sorbitol aggregates, which destroys
lubricant films and create new clean particle surfaces that are free for interparticular
bonding. However, the brittle nature of sorbitol made it more susceptible to the
occurrence of capping, which was denoted by the higher discrepancy of the sorbitol tablet
tensile strength data when plotted against its compaction pressure. The data plotted by an
astrix represent unlubricated sorbitol tablets that do not fit the corresponding curve.
Adding MgSt resulted in weaker tablets with more consistent data to the fitting line, which
was associated with no capping incidence (Figure 2-17).

53
(A) (B)
Figure 2-17: Tensile strength of unlubricated (■) and lubricated (▲) tablets of sorbitol (A) and MCC (B)
at a range of compaction pressures. (*) represents unlubricated sorbitol tablets which show start of
capping [73].
A different conclusion was made by Dudhat et al. [74] who evaluated the capping
propensity of the tablets that are made from a blend of pharmaceutical powders
(APAP/MCC) based on their rheological properties and more specifically the powder air
permeability. Powders with higher air permeability are more able to relieve the entrapped
air and reduce the occurrence of compact defects. The permeability of the powder blend
was measured by compacting the blend at a series of normal stresses by a vented piston.
Subsequently the powder bed base was subjected to a constant velocity air stream. The
permeability was then determined according to the pressure drop across the powder bed.
The study showed that increasing APAP (API) contents lead to a significant increase in
the pressure drop at about 80 % API content (Figure 2-18). The authors claimed that this
significant change in the pressure drop was responsible for the high capping propensity
at this API %. Adding 0.5% MgSt to the APAP formulations showed a higher level of
pressure drop compared with the non-lubricated formulation (Figure 2-18), i.e.
lubrication did not ease the ability of the powder bed to relieve the entrapped air. This
could eventually explain the inefficacy of using MgSt to prevent the occurrence of
capping with these formulations.

54
Figure 2-18: Permeability of powder bed expressed as the pressure drop across the powder bed at 15 kPa
as a function of API contents. The measurements were conducted with and without 0.5% MgSt
In conclusion, there is considerable research that has investigated lubrication as a strategy
to alleviate the occurrence of compact defects during tabletting. However, so far, no
research trials were conducted to investigate such a strategy in the field of roller
compaction.
Process related factors
Effect of compaction pressure and speed
During powder compaction, particles are subjected to an increasing pressure by which
particles undergo various deformation mechanisms, including elastic deformation
followed by plastic deformation and/or fragmentation. This is followed by the unloading
stage during which some of the stored elastic strain is restored. Excessive elastic
deformation could lead to compact defects if it is high enough to overcome the
interparticular bonding formed in the compaction phase. The level and rate of pressure
application are critical factors for both the interparticular bonding and elastic recovery in
the unloading phase. Akseli et al. [75] investigated the effect of compaction pressure and
speed on the capping propensity during the tabletting process. The authors developed a
non-destructive method to predict capping propensity based on the acoustic property of
the compact; tablet axial and radial sound wave propagation velocity was determined and
correlated with the elastic property of the compact at different orientations. The degree
of capping was then evaluated using a dimensionless ratio as EG = E axial / E radial which is
the ratio of the axial to radial Young’s modulus of the tablet. Based on the experimental
results higher EG values indicate more homogenous compact and less probability of
capping. A diverse set of pharmaceutical formulations (28 blends) were compacted at a
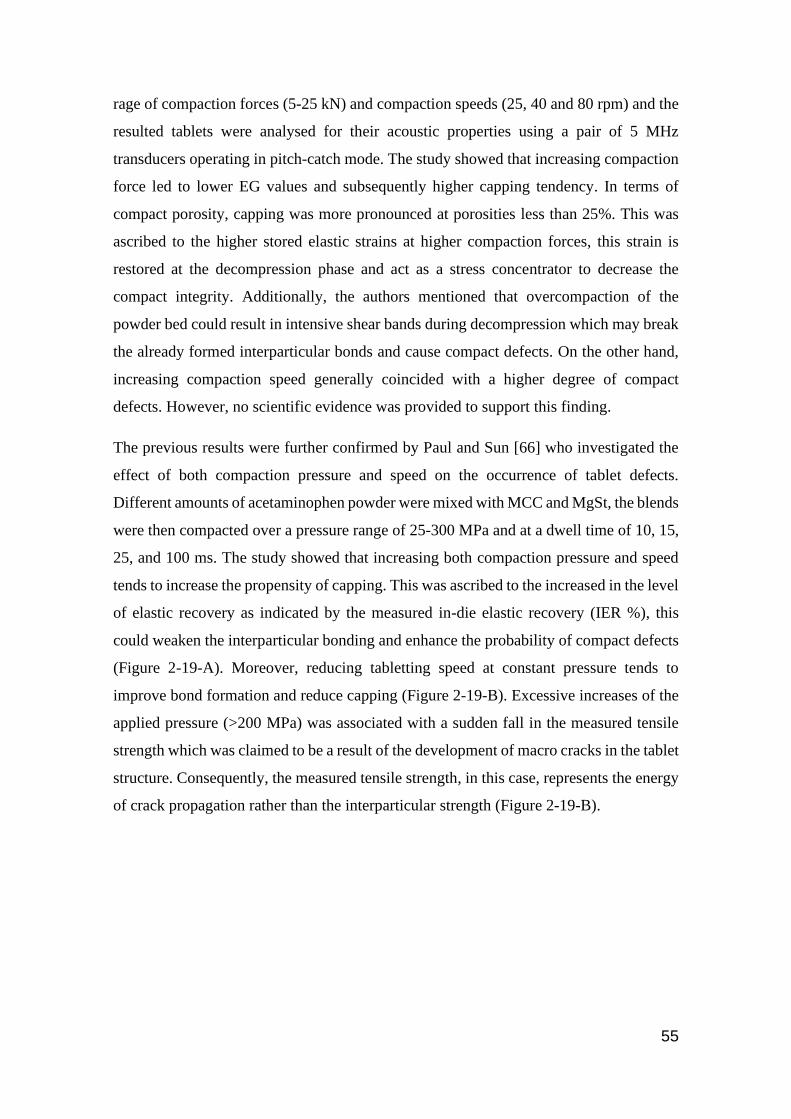
55
rage of compaction forces (5-25 kN) and compaction speeds (25, 40 and 80 rpm) and the
resulted tablets were analysed for their acoustic properties using a pair of 5 MHz
transducers operating in pitch-catch mode. The study showed that increasing compaction
force led to lower EG values and subsequently higher capping tendency. In terms of
compact porosity, capping was more pronounced at porosities less than 25%. This was
ascribed to the higher stored elastic strains at higher compaction forces, this strain is
restored at the decompression phase and act as a stress concentrator to decrease the
compact integrity. Additionally, the authors mentioned that overcompaction of the
powder bed could result in intensive shear bands during decompression which may break
the already formed interparticular bonds and cause compact defects. On the other hand,
increasing compaction speed generally coincided with a higher degree of compact
defects. However, no scientific evidence was provided to support this finding.
The previous results were further confirmed by Paul and Sun [66] who investigated the
effect of both compaction pressure and speed on the occurrence of tablet defects.
Different amounts of acetaminophen powder were mixed with MCC and MgSt, the blends
were then compacted over a pressure range of 25-300 MPa and at a dwell time of 10, 15,
25, and 100 ms. The study showed that increasing both compaction pressure and speed
tends to increase the propensity of capping. This was ascribed to the increased in the level
of elastic recovery as indicated by the measured in-die elastic recovery (IER %), this
could weaken the interparticular bonding and enhance the probability of compact defects
(Figure 2-19-A). Moreover, reducing tabletting speed at constant pressure tends to
improve bond formation and reduce capping (Figure 2-19-B). Excessive increases of the
applied pressure (>200 MPa) was associated with a sudden fall in the measured tensile
strength which was claimed to be a result of the development of macro cracks in the tablet
structure. Consequently, the measured tensile strength, in this case, represents the energy
of crack propagation rather than the interparticular strength (Figure 2-19-B).
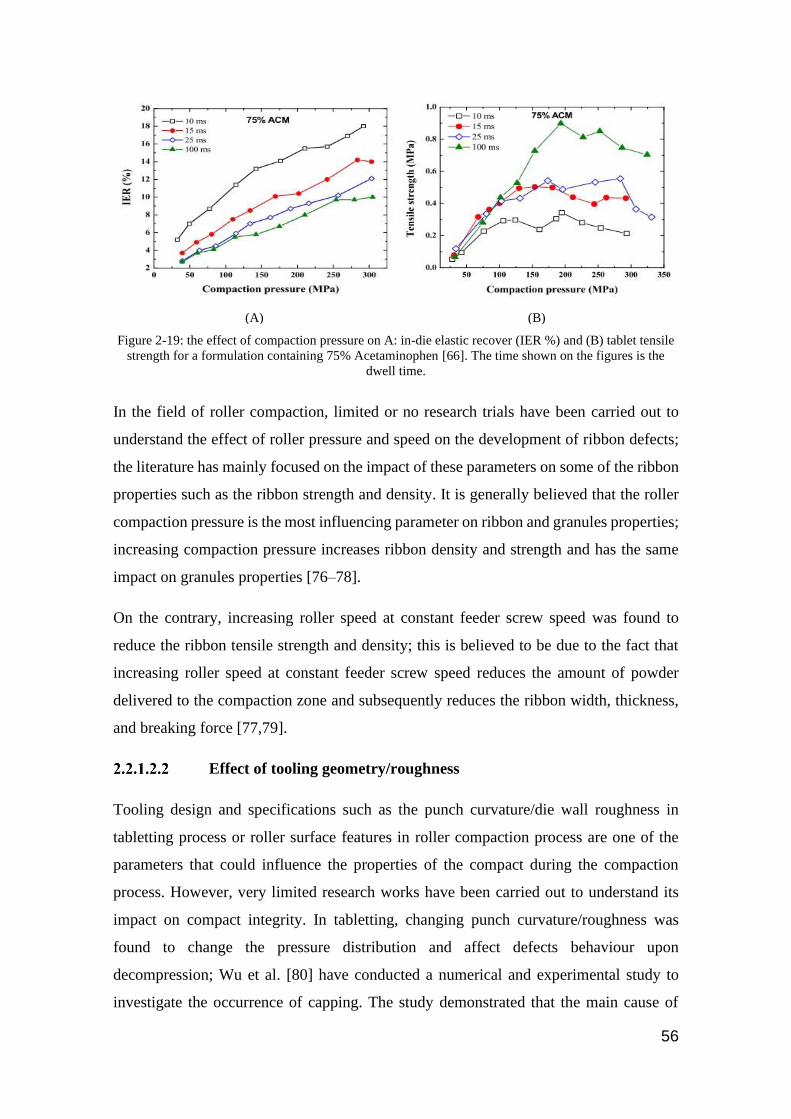
56
(A) (B)
Figure 2-19: the effect of compaction pressure on A: in-die elastic recover (IER %) and (B) tablet tensile
strength for a formulation containing 75% Acetaminophen [66]. The time shown on the figures is the
dwell time.
In the field of roller compaction, limited or no research trials have been carried out to
understand the effect of roller pressure and speed on the development of ribbon defects;
the literature has mainly focused on the impact of these parameters on some of the ribbon
properties such as the ribbon strength and density. It is generally believed that the roller
compaction pressure is the most influencing parameter on ribbon and granules properties;
increasing compaction pressure increases ribbon density and strength and has the same
impact on granules properties [76–78].
On the contrary, increasing roller speed at constant feeder screw speed was found to
reduce the ribbon tensile strength and density; this is believed to be due to the fact that
increasing roller speed at constant feeder screw speed reduces the amount of powder
delivered to the compaction zone and subsequently reduces the ribbon width, thickness,
and breaking force [77,79].
Effect of tooling geometry/roughness
Tooling design and specifications such as the punch curvature/die wall roughness in
tabletting process or roller surface features in roller compaction process are one of the
parameters that could influence the properties of the compact during the compaction
process. However, very limited research works have been carried out to understand its
impact on compact integrity. In tabletting, changing punch curvature/roughness was
found to change the pressure distribution and affect defects behaviour upon
decompression; Wu et al. [80] have conducted a numerical and experimental study to
investigate the occurrence of capping. The study demonstrated that the main cause of
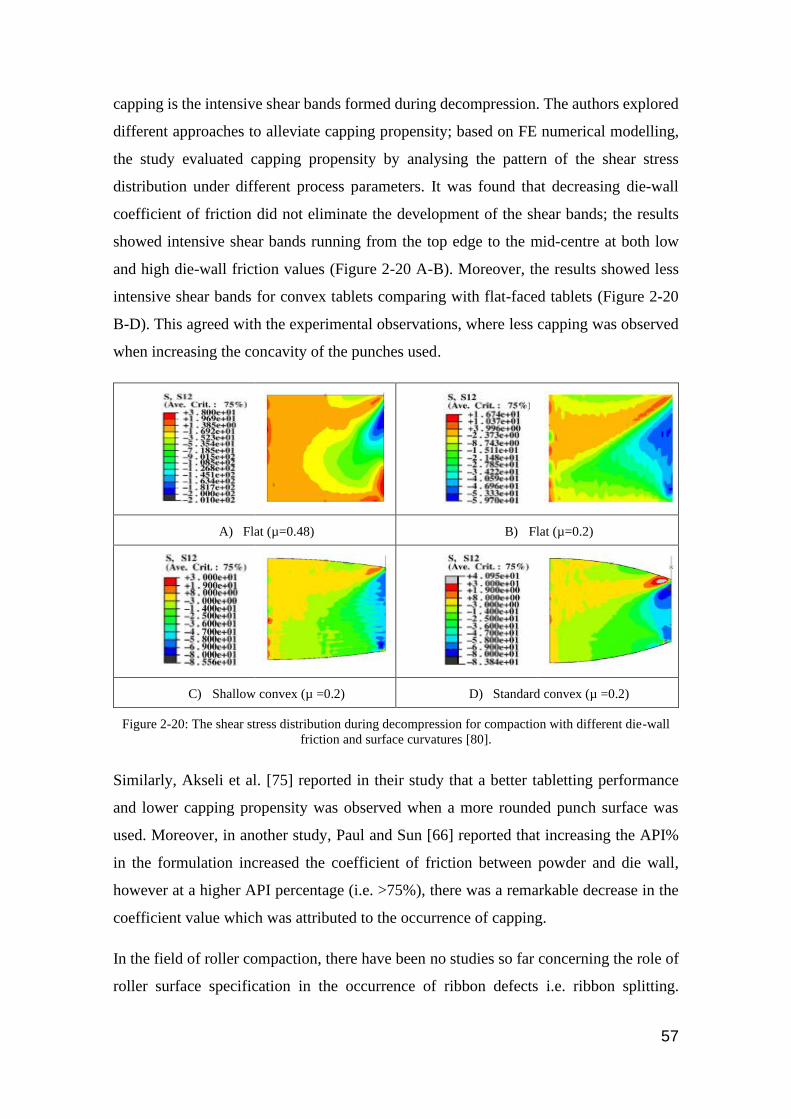
57
capping is the intensive shear bands formed during decompression. The authors explored
different approaches to alleviate capping propensity; based on FE numerical modelling,
the study evaluated capping propensity by analysing the pattern of the shear stress
distribution under different process parameters. It was found that decreasing die-wall
coefficient of friction did not eliminate the development of the shear bands; the results
showed intensive shear bands running from the top edge to the mid-centre at both low
and high die-wall friction values (Figure 2-20 A-B). Moreover, the results showed less
intensive shear bands for convex tablets comparing with flat-faced tablets (Figure 2-20
B-D). This agreed with the experimental observations, where less capping was observed
when increasing the concavity of the punches used.
A) Flat (µ=0.48) B) Flat (µ=0.2)
C) Shallow convex (µ =0.2) D) Standard convex (µ =0.2)
Figure 2-20: The shear stress distribution during decompression for compaction with different die-wall
friction and surface curvatures [80].
Similarly, Akseli et al. [75] reported in their study that a better tabletting performance
and lower capping propensity was observed when a more rounded punch surface was
used. Moreover, in another study, Paul and Sun [66] reported that increasing the API%
in the formulation increased the coefficient of friction between powder and die wall,
however at a higher API percentage (i.e. >75%), there was a remarkable decrease in the
coefficient value which was attributed to the occurrence of capping.
In the field of roller compaction, there have been no studies so far concerning the role of
roller surface specification in the occurrence of ribbon defects i.e. ribbon splitting.
58
However, some efforts have been made to understand the role of roller surface features
such as roller knurling and roughness on ribbon density, which could improve our
understanding to the development of ribbon defects i.e. ribbon splitting. Daugherity and
Chu [81] investigated the effect of roller serration volume on ribbon thickness; a set of
four different rollers with various roller serration volumes were employed to roller
compact a formulation of lactose, MCC and MgSt into ribbons. The results showed that
at the same processing condition i.e. constant roller pressure/auger speed/roller speed,
ribbons produced with more serrated roller surface have higher ribbon thickness. This
was attributed to the fact that more serrated rollers can draw more powders into the
compaction area and increase both gap distance and ribbon thickness. More recently, as
a part of their study, Csordas et al. [82] investigated the effect of roller surface on ribbon
relative density; two pairs of smooth and knurled rollers were used to compact MCC and
mannitol, mixtures of MCC/mannitol into ribbons. Comparing all relative density results
it was found that denser ribbons were obtained for all studied materials when roller
compaction was performed with smooth rollers (Figure 2-21 A-B). The ribbon relative
density was determined from the ratio of the envelope to true density; envelop density
was measured using a Geopyc powder pycnometer, so that only an average value was
taken to represent ribbon density, i.e. the study did not take the effect of the well-reported
density heterogeneity into consideration when making this argument. The authors
attributed this to the greater contact area achieved when knurled rollers are used; this
resulted in less stress than the one exerted by the smooth rollers. Moreover, the study
mentioned that all ribbons made with mannitol showed significantly higher ribbon
relative density than MCC or MCC/mannitol mixture.
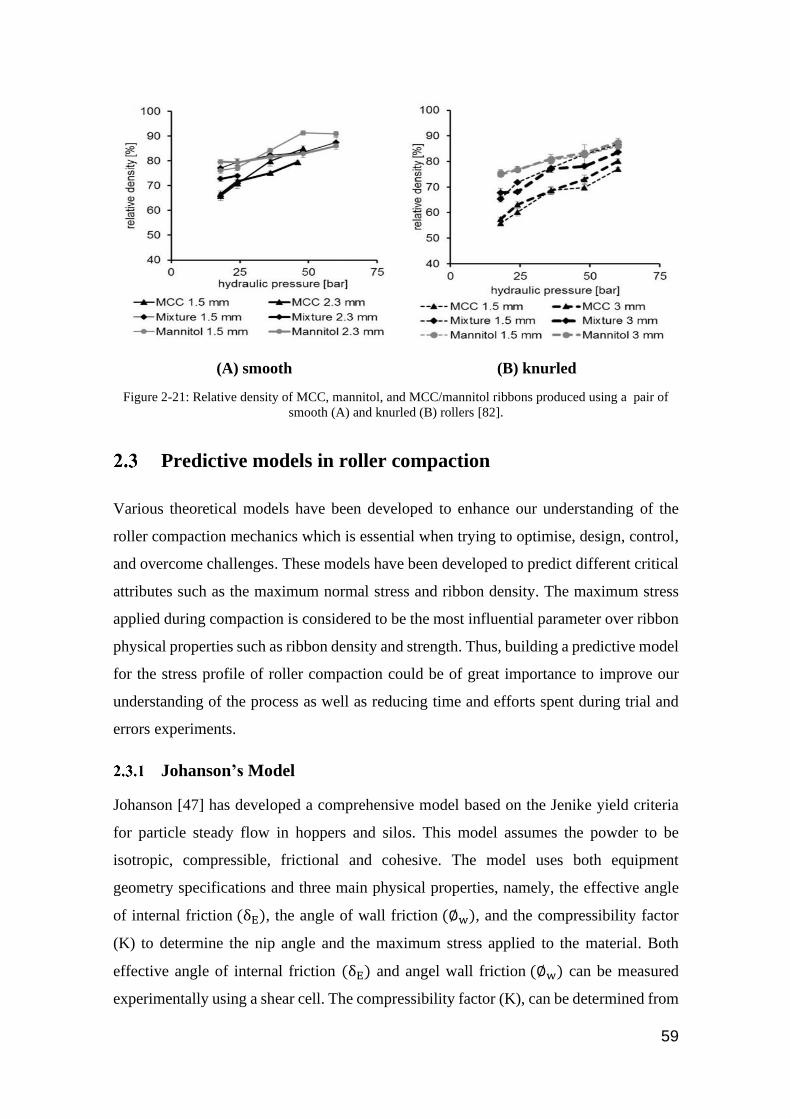
59
(A) smooth (B) knurled
Figure 2-21: Relative density of MCC, mannitol, and MCC/mannitol ribbons produced using a pair of
smooth (A) and knurled (B) rollers [82].
Predictive models in roller compaction
Various theoretical models have been developed to enhance our understanding of the
roller compaction mechanics which is essential when trying to optimise, design, control,
and overcome challenges. These models have been developed to predict different critical
attributes such as the maximum normal stress and ribbon density. The maximum stress
applied during compaction is considered to be the most influential parameter over ribbon
physical properties such as ribbon density and strength. Thus, building a predictive model
for the stress profile of roller compaction could be of great importance to improve our
understanding of the process as well as reducing time and efforts spent during trial and
errors experiments.
Johanson’s Model
Johanson [47] has developed a comprehensive model based on the Jenike yield criteria
for particle steady flow in hoppers and silos. This model assumes the powder to be
isotropic, compressible, frictional and cohesive. The model uses both equipment
geometry specifications and three main physical properties, namely, the effective angle
of internal friction (δE), the angle of wall friction (∅w), and the compressibility factor
(K) to determine the nip angle and the maximum stress applied to the material. Both
effective angle of internal friction (δE) and angel wall friction (∅w) can be measured
experimentally using a shear cell. The compressibility factor (K), can be determined from

60
the slope of the logarithmic plot of the density ρ as a function of the pressure 𝑝 during
uniaxial compression.
log𝑝1
𝑝2= K log
ρ1
ρ2 Equation 2-5
The model divided the compaction zone into two zones according to their angular
positions. Assuming that slip (roller speed is higher than powder speed) is happening
along a certain angular range of the roller surface, Johanson described the pressure
distribution in this area by the following equation [47]:
(𝑑𝜎
𝑑𝑥)
𝑠𝑙𝑖𝑝=
4𝜎𝜃 (𝜋2 − 𝜃 − 𝜈) 𝑡𝑎𝑛𝛿𝐸
𝑑𝑟
2 (1 +𝑠
𝑑𝑟− 𝑐𝑜𝑠𝜃) 𝑐𝑜𝑡(𝐴 − 𝜇) − 𝑐𝑜𝑡(𝐴 + 𝜇)
Equation 2-6
where σθ is the mean normal stress at position 𝜃, 𝜃 is the angular position in roll bite, δE
is the effective angle of the internal friction (related to material flow property), 𝑑𝑟 is the
roll diameter, and 𝑠 is the gap between the rollers.
A is a parameter given by:
A =θ + ν +
π2
2
Equation 2-7
𝜈 is described by the following equation:
𝜈 =1
2(𝜋 − 𝑠𝑖𝑛−1
𝑠𝑖𝑛∅𝑤
𝑠𝑖𝑛𝜎𝜃− ∅𝑤) Equation 2-8
where ∅w is the angle of wall friction (related to material flow property), and μ can be
calculated by the following equation [47]:
μ =π
4−
σθ
2 Equation 2-9
As the materials arrive to the nip area where no slipping is occurring, all materials are
trapped and compressed to the thickness of the roll gap and the stress distribution in this
area is covered by the following equation [47]:
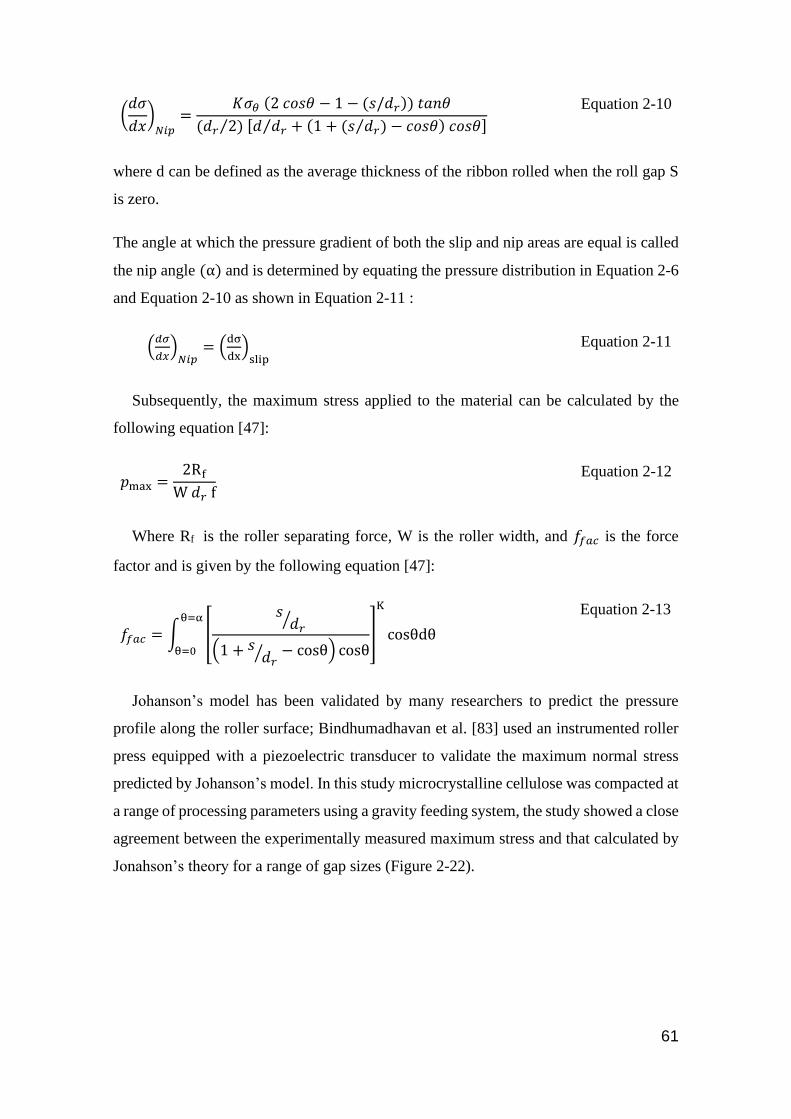
61
(𝑑𝜎
𝑑𝑥)
𝑁𝑖𝑝=
𝐾𝜎𝜃 (2 𝑐𝑜𝑠𝜃 − 1 − (𝑠/𝑑𝑟)) 𝑡𝑎𝑛𝜃
(𝑑𝑟 2⁄ ) [𝑑 𝑑𝑟⁄ + (1 + (𝑠 𝑑𝑟)⁄ − 𝑐𝑜𝑠𝜃) 𝑐𝑜𝑠𝜃]
Equation 2-10
where d can be defined as the average thickness of the ribbon rolled when the roll gap S
is zero.
The angle at which the pressure gradient of both the slip and nip areas are equal is called
the nip angle (α) and is determined by equating the pressure distribution in Equation 2-6
and Equation 2-10 as shown in Equation 2-11 :
(𝑑𝜎
𝑑𝑥)
𝑁𝑖𝑝= (
dσ
dx)
slip Equation 2-11
Subsequently, the maximum stress applied to the material can be calculated by the
following equation [47]:
𝑝max =2Rf
W 𝑑𝑟 f
Equation 2-12
Where Rf is the roller separating force, W is the roller width, and 𝑓𝑓𝑎𝑐 is the force
factor and is given by the following equation [47]:
𝑓𝑓𝑎𝑐 = ∫ [
𝑠𝑑𝑟
⁄
(1 + 𝑠𝑑𝑟
⁄ − cosθ) cosθ]
θ=α
θ=0
K
cosθdθ
Equation 2-13
Johanson’s model has been validated by many researchers to predict the pressure
profile along the roller surface; Bindhumadhavan et al. [83] used an instrumented roller
press equipped with a piezoelectric transducer to validate the maximum normal stress
predicted by Johanson’s model. In this study microcrystalline cellulose was compacted at
a range of processing parameters using a gravity feeding system, the study showed a close
agreement between the experimentally measured maximum stress and that calculated by
Jonahson’s theory for a range of gap sizes (Figure 2-22).

62
Figure 2-22: Comparison between experimentally and predicted stress profile calculated using Johanson’s
model at a range of gap distances [83].
In another study, Yousef et al. validated Johanson’s theory by comparing the predicted
Johanson’s values of roller separating force and roller torque with those measured
experimentally. The study mentioned that the predicted values of the model were in
reasonable agreement with the experimental results.
The theory is widely applied in the field of roller compaction [7,41,84]. However, in
addition to its weakness with respect to predicting variations associated with changing
roller speed, another limitation of Johanson’s theory was introduced by Patel et al. [85];
the authors mentioned that the compressibility determined by the power-law relationship
between the stress and the ribbon density does not capture the behaviour at small
pressures. Alternatively, a uniaxial compaction data was fitted to the relationship
developed by Adams et al. [86] that was adopted in [85]. The relationship is given by the
following equation:
𝑙𝑛 𝜎 = 𝑙𝑛[1 − 𝑒𝑥𝑝 (−𝜅휀)] + 𝑙𝑛 (𝜏0
𝜅) + 𝜅휀 Equation 2-14
where 𝜅 is the modified compressibility factor, 𝜏0 is related to the mechanical strength of
the particles and 휀 is the compressive natural strain given by:
휀 = 𝑙𝑛ℎ𝑖
ℎ𝑐 Equation 2-15
where ℎ𝑖 is the initial height of the powder and ℎ𝑐 is the current powder bed height.

63
If the roll separation distance 𝑠α at the nip angle α is calculated using the following
equation [85]:
𝑠𝜃 = 𝑠 + 𝑑𝑟(1 − 𝑐𝑜𝑠 𝜃) Equation 2-16
where 𝑠𝜃 is roll separation distance at an angular position (𝜃).
The roll separation distance 𝑠β at the true nip angle β can then be calculated using the
following equation [85]:
(𝑠𝛽
𝑠𝛼)
𝑘
{1 − 𝑒𝑥𝑝 [−𝑘 𝑙𝑛𝑠𝛽
𝑠]} = 1
Equation 2-17
and the true nip angle (β) is then calculated accordingly (Equation 2-16).
Finite element Modelling (FEM)
FEM is a numerical method for solving engineering problems. The modelling is based on
subdividing the system using a mesh consisting of smaller elements that are
interconnected by nodes. Each element is assigned certain geometrical and material
properties and analysed under specific boundary conditions that could include force,
temperature and displacement. The solutions of all individual elements are assembled to
describe the response of the whole system [87]. The FEM approach was used by several
researchers to investigate powder behaviour during roller compaction; Dec et al, [84] built
a two dimensional FEM model to investigate MCC powder behaviour during roller
compaction. The model was developed using a commercially available ABAQUS code
based on a modified Drucker-Prager cap model (DBC) as the constitutive model. This
material model is a pressure-dependent yielding plasticity model with linear elasticity
which was calibrated by conducting a series of simple and diametrical compression tests
in an instrumented die. The model assumed no cohesion between powder particles. Also,
while the angle of internal friction was estimated to be 65º, the angle of wall friction was
assumed to follow the Coulomb law of friction with coefficient of friction values ranging
from 0.35 to 0.5. Modelling was conducted until constant values of roll force and roll
torque were obtained.
The study showed that feeding stress has a significant effect on the roller pressure;
increasing feeding stress led to higher roller stresses at constant friction coefficient.

64
Additionally, the study demonstrated that both roll force and roll torque have increased
when increasing the friction coefficient and feeding stress. The authors mentioned that
the main challenge of the FEM approach is to have a constitutional material model that
could better describe material behaviour during compaction.
In another study, Cunningham et al. [64] developed 2D and 3D FEM models to evaluate
the variation in the roller compaction process. The modelling trials were followed by
roller compaction experiments using an instrumented roller that was equipped with load
cells distributed across the roller width. The cells are capable of measuring both normal
and shear stresses across the roller width. The DBC constitutive model was used to
describe the mechanical properties of MCC powder, which is the model powder for this
study. Experimentally, the authors found that the normal pressure started to increase at
about 10º, reached its maximum value at the roll width centre close to 0º, and reduced
back to zero at about 5 to 8º (Figure 2-23). On the other hand, the shear stresses built up
to about 24 MPa close to the entry angle and then decrease to zero at the neutral angle. In
the exit region, the shear stress reversed its direction and increased rapidly to about 28-
100 MPa at about 2º (Figure 2-23). The predicted shear stress after the neutral angle is
about 3 times higher than those before the neutral angle, this is suggested to contribute to
properties of the ribbons in terms of fracture or lamination. Additionally, the modelling
explains the pressure variation across a ribbon width based on the heterogeneity in the
feeding across the width and the frictional properties of the side sealing.
Figure 2-23: Normal and shear pressure distribution as a function of angular position and position across
roll width [64].
65
Michrafy et al. [88] used a 2D FEM model to the roller compaction of MCC powder. The
study theoretically divided the area of compaction into three distinct regions; firstly, the
slip region controlled by sliding of the particles between the rollers. Secondly, the stick
region of the powder moves at the velocity of the rollers. Finally, there is the ejection
phase in which the shear stress reverses its sign and the ribbon is released at a speed higher
than the roller speed. In agreement with Cunningham et al. [64], both the maximum
pressure and maximum ribbon density reached the highest level before the minimum gap
distance when there was no shear stress.
In a more recent study [89], FEM was successfully implemented to investigate MCC
behaviour during compaction; the study included a comparison between Johanson and
FEM modelling. It showed an agreement in the trend between the two approaches except
for some discrepancies when changing the effective friction angle, i.e. unlike Johanson’s
approach; the FEM model predicted nip angle values that decreased when increasing
effective friction angle.
Discrete Element Modelling (DEM)
DEM is a numerical modelling method at the particle scale. It computes the dynamics of
particles (typically spherical) based on their inter-particular interaction, which is
governed by contact models due to external forces such as gravity and interactions with
the surrounding geometrical objects such as walls or mixing blades [90]. Odagi et al. [91]
developed a 2D DEM model to simulate the powder behaviour in roller compaction. The
authors assumed that the particles were spherical and mono-sized. The inter-particular
interactions were expressed as adhesion forces obtained experimentally by measuring the
tensile strength of the ribbons. The study showed that the model failed to simulate
densification and compaction into a ribbon when the adhesion forces were not considered.
However, introducing adhesion forces to the model improved the predictability of the
model; the mass throughput was directly proportional to the roller speed, which followed
the trend of the experimental results. The authors pointed out that a significant variation
between experimental and predicted stress distribution was observed, this was referred to
the modelling assumption that did not take the role of air in account, additionally
assuming spherical particles could also contribute to the variation in the results.
In a more recent study, Mazor et al. [90] exploited the advantages of both DEM and FEM
to model the two mechanisms involved in the roller compaction process; DEM which is

66
more suitable to simulate particle flow was used to model the feeding of particles to the
compaction area. While FEM was implemented to simulate particle deformation under
certain frictional and mechanical properties. The velocity of particles at the end of the
screw feeder was determined by DEM modelling and used as input data for the
subsequent FEM simulation of the compaction zone (Figure 2-24).
Figure 2-24: Schematic representation to the approach used by Mazor et al. [90]; the predicted particle
axial velocity used as an inlet velocity for the FEM model.
The study showed how the inhomogeneity of the feeding velocity due to screw feeder
rotation could affect the density distribution in the resultant ribbons; a sinusoidal pattern
of roll pressure and relative density was observed in which the period of variation was
equal the screw feeder rotation time. However, no experimental validation was conducted
to validate the developed model.
Artificial neural network (ANN) modelling
ANN is a data-driven modelling system that is based on a set of algorithms inspired
by the human brain mechanism of information analysis [92]. Turkoglu et al. [93] used
ANN and genetic algorithm to analyse the data of 42 different experiments in which
acetaminophen had been roller compacted using different binders types, binder
concentrations, and number of roller compactor passes. Data analysis was conducted in
an attempt to optimise the final tablet properties in terms of disintegration time, strength,
ejection force, and friability. The study showed that the ANN was able to predict tablet
crushing strength with R2 = 0.9064, which was comparable with the genetic algorithm
results. However, the authors pointed out that genetic algorithms had higher predictability
for the rest of tablet characteristics in comparison with ANN. In another study,
Inghelbrecht et al. [76] successfully used ANN technology to predict granule quality in

67
terms of friability while the input of this model were four different process parameters,
namely, roller speed, velocities of both horizontal and vertical screw feeders, and air
pressure. The results showed that unlike polynomial fitting, the developed ANN model
was able to predict the friability of the roller compacted granules more accurately. Based
on the ANN inter-correlation, the most two influential parameters on granule’s friability
are both horizontal screw speed and air pressure; these two parameters should be kept low
to maintain high granule quality. The study also mentioned that the quality of granules
could be improved if the ratio between roller speed and horizontal screw speed is
maintained to be around 0.5 (Figure 2-25).
Figure 2-25: ANN predicted granule friability as a function of horizontal screw speed (HS) and roller
speed (RC) [76].
More recently, Sajjia, et al. [94] developed an ANN model to predict MCC ribbon
average density based on two process parameters as inputs including roller force and
screw speed. Ribbon average density was measured using Geopic technology and the data
from 16 roller compaction experiments were divided into 3 data sets; 10 for training, 3
for validation and 3 for testing. ANN topology was optimised and the best results were
obtained when 3 hidden layers were used. The predicted results of the developed ANN
was compared with Johanson’s model results; the average deviation of prediction of ANN
was 0.9% against 4.6% for Johanson’s model. However, roller compaction is a
complicated process which involves more process and material parameters than those
considered in this study. Additionally, the mean envelop density predicted in this study
does not reflect the real quality of the final product as it ignores the variation of ribbon
density caused by the heterogeneous nature of this process.

68
Theoretical Modelling-Summary
Different approaches have been exploited to simulate powder behaviour during
compaction and each method has advantages and disadvantages. In terms of computer
modelling, FEM requires a constitutive model that could accurately prescribe material
mechanical properties. DEM could be beneficial to investigate particle flow mechanisms
involved during the feeding stage of roller compaction process, however, by its nature,
the DEM approach is not suitable to deal with particle deformation and/or breakage that
could develop during roller compaction, this could limit its applicability for compaction
studies.
In spite of the limitations, Johanson’s theory was confirmed by a number of researches to
provide a reasonable agreement with the experimental measurements and is still viewed
by engineers as a satisfactory model to predict product properties as a function of process
variables [41,89,95]. The main advantages of this model being computationally
economical and very simple as only a limited number of powder parameters, which can
easily be measured experimentally, are required to implement this theory. Concurrently,
efforts have been elaborated in order to enhance its predictability [7,85]. The modified
Johanson’s model proposed by Patel et al. [85] was used to calculate the maximum stress
of compaction in this work.
In terms of data-driven modelling and more certainly ANN modelling, there is only
limited research in terms of inputs used, which will diminish the applicability of the
developed model in the field of real process control. Moreover, in terms of model outputs,
most of the existing work focuses on average ribbon porosity and does not take the well-
known variation of porosity across a ribbon width into account. A better model for process
control purposes would predict the variation of ribbon porosity considering more material
and process parameters so that it could respond to both process and formulation related
variations. This will to be discussed in more detail in Chapter-7.

69
Aim of the research
The work is aiming to investigate the following points:
• The aim of the current work is to elucidate the mechanisms of ribbon splitting
by an experimental study involving single-component powders with a range of
yield strengths, including those that are commonly used as excipients.
• Assess the effects of knurled and smooth roller surfaces on ribbon density
distribution and ribbon splitting occurrence.
• Assess the role of powder and metal surface energy in powder sticking during
roller compaction.
• To further improve our understanding of the roller compaction in terms of the
inhomogeneity of ribbon properties. A new neural network model is proposed,
which accounts for different process and material properties.
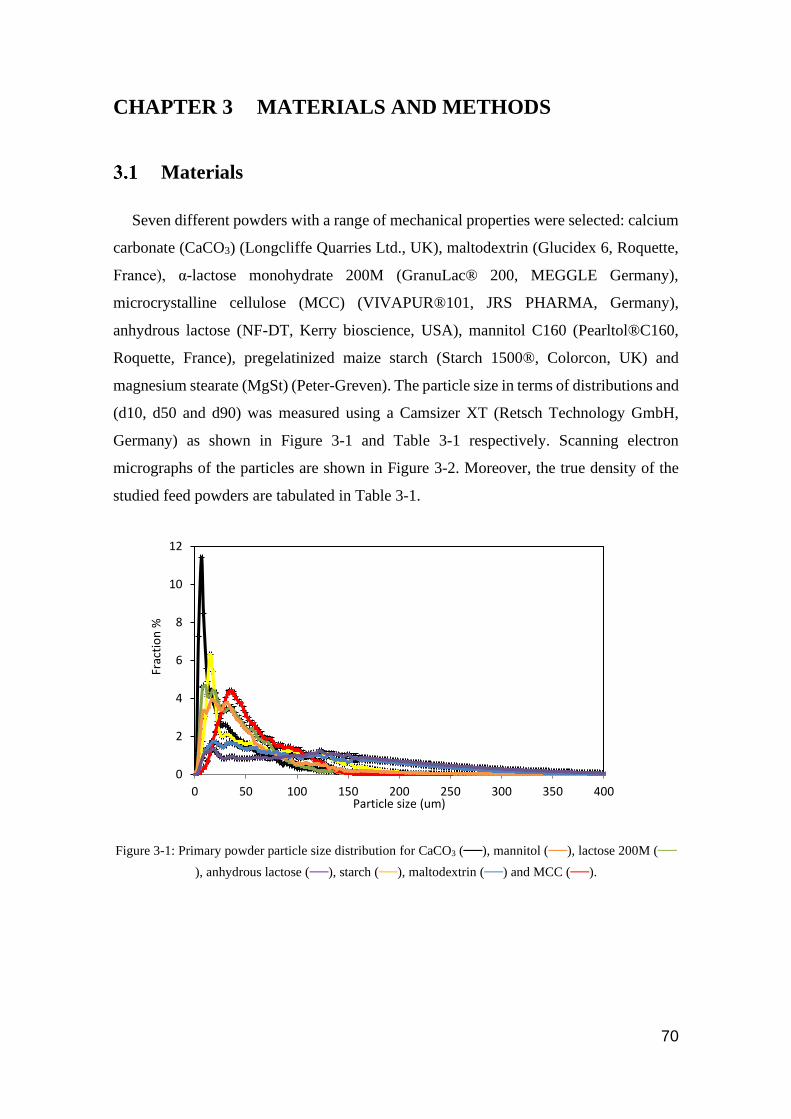
70
CHAPTER 3 MATERIALS AND METHODS
Materials
Seven different powders with a range of mechanical properties were selected: calcium
carbonate (CaCO3) (Longcliffe Quarries Ltd., UK), maltodextrin (Glucidex 6, Roquette,
France), α-lactose monohydrate 200M (GranuLac® 200, MEGGLE Germany),
microcrystalline cellulose (MCC) (VIVAPUR®101, JRS PHARMA, Germany),
anhydrous lactose (NF-DT, Kerry bioscience, USA), mannitol C160 (Pearltol®C160,
Roquette, France), pregelatinized maize starch (Starch 1500®, Colorcon, UK) and
magnesium stearate (MgSt) (Peter-Greven). The particle size in terms of distributions and
(d10, d50 and d90) was measured using a Camsizer XT (Retsch Technology GmbH,
Germany) as shown in Figure 3-1 and Table 3-1 respectively. Scanning electron
micrographs of the particles are shown in Figure 3-2. Moreover, the true density of the
studied feed powders are tabulated in Table 3-1.
Figure 3-1: Primary powder particle size distribution for CaCO3 (—), mannitol (—), lactose 200M (—
), anhydrous lactose (—), starch (—), maltodextrin (—) and MCC (—).
0
2
4
6
8
10
12
0 50 100 150 200 250 300 350 400
Frac
tio
n %
Particle size (um)

71
Table 3-1: Primary powder particle size data.
Material d10 (μm)
μ
μ
d50 (μm) d90 (μm) True density
(kg/m3) [96]
CaCO3 5 23 87 2930
mannitol 12 40 138 1514
lactose 200M 9 35 82 1545
Anhydrous lactose 26.5 132 281 1589
maltodextrin 21.5 100 241 1449
MCC 23 49 104.5 1440
starch 14.8 54 138 1594

72
CaCO3 mannitol
200M lactose anhydrous lactose
starch maltodextrin
MCC
Figure 3-2: SEM images for the primary particles used in this study.

73
Calcium carbonate (CaCO3)
Calcium carbonate is an odourless and tasteless powder. It can be extracted from nature
by mining or chemically prepared using calcium oxide. This powder is used in
pharmaceutical solid dosage forms as a diluent, or as a dissolution aid in dispersible
tablets. Also, in the food industry calcium carbonate can be used as a food additive [96].
Mannitol C160
Mannitol is a white, odourless, water-soluble powder that has a sweet taste. It is widely
used in pharmaceutical and food industry for a variety of purposes. As pharmaceutical
excipient mannitol can be added to the tablet formulation as a filler or sweetening agent
in chewable tablets. Additionally, mannitol can be used as a carrier in dry powder inhalers
or as a bulking agent in the food industry. According to the processing conditions,
mannitol can exist in three different crystalline forms. It is worth mentioning that the
mannitol powder used in this study composed of 99% β-mannitol which known to be the
most stable polymorph of mannitol [97].
Lactose
Lactose is reducing disaccharide which consists of two hexose sugar glucose and
galactose. In the solid-state, lactose powder occurs as odourless and white to off-white
crystalline particles with slightly sweet-tasting. Depending on the processing conditions,
lactose can exist in different amorphous and crystalline forms with different properties in
terms of solubility, mechanical properties and morphology. Changing crystallisation and
drying conditions can result in different crystalline isomeric forms of lactose ranging from
α-lactose monohydrate, anhydrous β-lactose and anhydrous α-lactose [98].
Two different types of lactose were used in this study; firstly, α-lactose monohydrate
which is produced by slow crystallisation from a supersaturated lactose solution below
93.5 °C, the slow crystallization will enable the water molecules to get incorporated in
the crystalline lattice forming what is so-called the water of crystallisation, where each
lactose molecule is strongly bonded to one molecule of water. Secondly, anhydrous β-
lactose (anhydrous lactose NF-DT, Kerry bioscience, USA), which is industrially
produced by roller drying of a supersaturated lactose solution on high temperature above
93.5 °C, is more brittle than the α-lactose monohydrate and has no crystal water in its
crystal lattice. Figure 3-2 shows the difference in particle structure and the surface
74
roughness between the sharp-edged and smooth surface α-lactose monohydrate and the
rough surface and kite shape anhydrous β-lactose.
According to a previous research work [99], the two types of lactose have a different
amount of amorphous content. While anhydrous β-lactose is reported to contain no
amorphous material, α-lactose monohydrate is expected to have ~1-4% amorphous
material. The work also mentioned that the difference in amorphous content has led to
subsequent changes in the final product attributes.
Starch 1500
Starch 1500 is a white free-flowing pregelatinised maize starch that is composed of two
polymers, amylose and amylopectin. This material is commonly used in the
pharmaceutical industry as a filler, disintegrant, binder, or even as flow-aid due to its
lubrication properties [97].
Maltodextrin
Maltodextrin (Glucidex 6, IMCD, UK), is a spray-dried amorphous polysaccharide,
produced by partial enzymatic hydrolysis of the starch. In addition to its application in
food industries as a bulking agent, due to its colourless and flavourless characteristics, it
is preferably used in pharmaceutical tablet industries as a diluent and coating material
[100].
Microcrystalline cellulose (MCC)
Microcrystalline cellulose (VIVAPUR®101) is a free-flowing, plastically deforming
material. It is produced by severe acid hydrolysis of α-celluloses which results in a
polymer with both crystalline and amorphous regions. Using X-ray diffraction, previous
research works have proven that the amorphous content of MCC is about ∼30% which is
almost the same in different commercial grades of MCC [101]. This material has lots of
applications in the pharmaceutical industry where it is primarily used as a binder/diluent
in oral tablet and capsule formulations.

75
Methods
Powder preparation
Prior to any experiment, the powders were equilibrated for three days at a relative
humidity of 40% and temperature of 25°C in a humidity chamber (Binder KMF 240
climatic chamber, Binder, UK).
Powder characterisation
Powder yield strength
The yield strength (𝜎𝑌) of the particles were estimated using Heckle equation, which is
based on the compact density as a function of the applied stress (Equation 3-1) [102].
ln1
1 − 𝑌= 𝑋𝑝 + 𝐶ℎ
Equation 3-1
where Y is the relative density at any given compaction pressure (𝑝), which is the ratio of
the compact envelope to the true density. 𝐶ℎ is a constant related to the volume reduction
of the powder as a result of particle rearrangement and die filling. X is a material related
constant, and it is related to the response of the material to reduce void fraction as a
response to the applied pressure.
So ln(1/1 − 𝑌) is plotted against the compaction pressure 𝑝, the gradient of the linear part
of the plot can be fitted to a straight line where the slope of this line (X) has been used as
an indicator of the material plasticity [103]. Heckel has shown experimentally that the
reciprocal of the slope of this line can be used to determine the yield strength of the
materials (𝜎𝑌).
Although it involves a number of limitations [104] it is still used as a valuable tool for
comparing the mechanical properties of the powders. There are two types of Heckle
analysis in common use namely, in-die and out-die analyses [103]. The difference
between these methods depends on the way of density data collection, i.e. in case of the
in-die analysis; the data is collected during compaction whereas in the other method tablet
density is determined after ejection of the compact. For comparison purposes, both
methods are used in this work.
76
For the out die method, powders of the same mass were added in a 12 mm diameter
polished stainless steel die and compressed at a speed of 1 mm/min using a universal
testing machine (Instron 3367, USA) at different compaction forces ( 1, 3, 5, 7, 10, 12,
and 15 kN). Consequently, the compact density was determined from its mass and
volume; tablet thickness was measured using two decimal points electronic calliper and
used to determine tablet volume. The resulted tablet density was then divided by powder
true density to calculate compact relative density. Eventually, both the stresses applied
on the powder and compacts relative densities were fitted to Equation 3-1; the reciprocal
of the slope of the resulted line is used to determine powder yield strength.
On the hand, for the in-die heckle analysis, force and displacement of tablets prepared at
15 kN have been recorded during compaction and used to determine stress and relative
densities similar to the procedure followed for the in-die analysis.
Single-particle compression test
To further investigate the mechanical properties of the studied feed powders; powders
have been sieved to the sieve size range (212-250 µm). Subsequently, the single powder
particle has been compressed at a compaction speed 0.05 mm/min using Zwick/Roell Z
0.5 (Zwick/Roell, Germany) test machine which was equipped with 5 N capacity load
cell and a rigid metal base fitted with a glass plate (8 mm thickness) in order to place the
particle on it. Moreover, a Dino-Light camera (Premier, AM-4013, Taiwan) has been
fixed under the glass plate in order to record the change in the projection area during the
compression test. The test has been repeated for at least 25 times for each powder
material.
Compressibility factor of the powders
Raw powders have been compacted using a uniaxial compaction machine (Instron 3367,
USA) in a 12 mm inner diameter polished stainless steel die at a force of 15 kN and a
compaction speed of 1 mm/min. The compaction data were fit to Equation 2-14 and the
compressibility constant calculated accordingly. A minimum of five replicates were
conducted for each raw powder.
Powder flow properties: Shear cell tester
A ring-shear cell tester RST-XS.s (Dr Dietmar Schulze, Germany) was used to
measure both the effective angle of internal friction (𝛿𝐸)° and angle of wall friction

77
(∅w)°.To measure 𝛿𝐸, the powder was pre-consolidated by applying a certain normal load
and pre-sheared until a steady state was reached. Subsequently, shearing took place under
reduced normal load steps. Stress of 5000 Pa was used as a pre-shear normal stress and
three different normal stresses of 1500, 2750, and 4000 Pa were applied sequentially.
The measurement of wall friction is based on determining the sliding resistance
between the powder and a metal surface at different applied normal forces with 5000 Pa
as a pre-shear. The shear stress was measured against a smooth stainless steel coupon and
a knurled stainless steel coupon which have similar surface finishing as the rollers. The
knurled coupon was machined using wire-electrical discharge machine (EDM) to have
the same diagonal cross hatch cuts of the knurled rollers.
Work of elastic recovery
Powder sample of the same mass has been poured in a 4 mm die. Consequently, stresses
equivalent to the stresses applied during roller compaction have calculated using
Johanson’s theory (Equation 2-12) and applied on the powder at a speed of 1 mm/min.
Displacement recording started at a force threshold of 2 N when the punch started to touch
the powder bed. The loading and unloading energies were calculated from the recorded
force-displacement data. The elastic recovery was then calculated using the following
expression [105]:
휀R = 휀U/ 휀L Equation 3-2
Where 휀L and 휀U are the loading and unloading energies (J) such that 휀R = 0 corresponds
to perfectly plastic deformation and 휀R = 1 to perfectly elastic deformation. As shown in
Figure 3-3, the loading energy is calculated from the area under the OB curve which
represents the total work input. While the area under the CB curve represents the elastic
recovered work and used for the unloading energy calculation.

78
Figure 3-3: An example of loading /unloading curve that used is to calculate compact elastic recovery.
Roller compaction
Alexanderwerk WP120 (Alexanderwerk, Germany) roller compactor was used, which
incorporates a feeding, compaction, and milling system (Figure 3-4). Additionally, the
roller compactor is equipped with a de-aeration system that can enhance the powder
flowability and play a role in reducing the amount of fines. The counter-rotating rollers
have widths of 4 cm and diameters of 12 cm. The feeding system is a horizontal auger
and the rotational speed and, hence the applied pressure can be varied. The gap between
the two rollers is sealed with two side cheek plates that are designed to prevent powder
leakage during compaction. Metallic scrapers are fixed at about 0.1 mm distance from the
roller surfaces. There is a gap feedback system that controls the screw feeder speed in
order to deliver the powder flow rate that will maintain the required gap between the
rollers. The relationship between roller separating force and hydraulic pressure is given
by the manufacturer (Alexanderwerk) [45] and tabulated in Table 3-2.
0
2000
4000
6000
8000
10000
12000
14000
0 0.5 1 1.5 2
Forc
e (N
)
Displacement (mm)
O
B
C

79
Figure 3-4: Alexanderwerk WP120 Roller Compaction with schematic drawings of the main three
systems involved in roller compaction i.e. feeding, compaction, and milling system.
Table 3-2: The relationship between roller separating force and hydraulic pressure as given by the
manufacturer (Alexanderwerk) [45].
Hydraulic pressure (bar) Roller separating force (kN)
18 7.46
30 12.43
50 20.72
80 33.15
120 49.76
150 62.16
230 95.38
To examine the effects of the surface topography of the rollers, two pairs of rollers with
different surfaces (knurled and smooth) were used in this study (Figure 3-5). The
indentation depth of the knurled roller is about 0.5 mm and it was measured with a digital
microscope (Keyence VHX-5000).
The conditioned powder was compacted at different hydraulic pressures in the range 18 -
230 bar. A fixed roller gap of 2 mm and a fixed roller speed of 3 rpm were employed. In
order to investigate the effects of adhesion between the ribbons and rollers, 0.25 g of
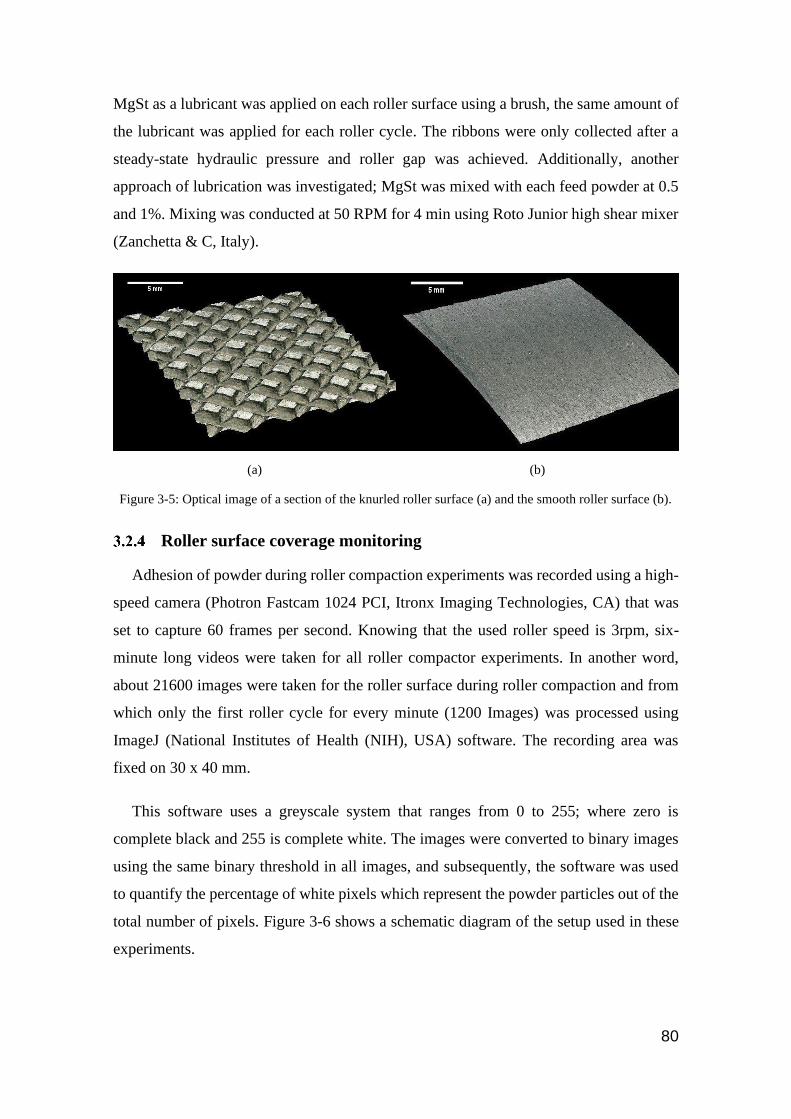
80
MgSt as a lubricant was applied on each roller surface using a brush, the same amount of
the lubricant was applied for each roller cycle. The ribbons were only collected after a
steady-state hydraulic pressure and roller gap was achieved. Additionally, another
approach of lubrication was investigated; MgSt was mixed with each feed powder at 0.5
and 1%. Mixing was conducted at 50 RPM for 4 min using Roto Junior high shear mixer
(Zanchetta & C, Italy).
(a) (b)
Figure 3-5: Optical image of a section of the knurled roller surface (a) and the smooth roller surface (b).
Roller surface coverage monitoring
Adhesion of powder during roller compaction experiments was recorded using a high-
speed camera (Photron Fastcam 1024 PCI, Itronx Imaging Technologies, CA) that was
set to capture 60 frames per second. Knowing that the used roller speed is 3rpm, six-
minute long videos were taken for all roller compactor experiments. In another word,
about 21600 images were taken for the roller surface during roller compaction and from
which only the first roller cycle for every minute (1200 Images) was processed using
ImageJ (National Institutes of Health (NIH), USA) software. The recording area was
fixed on 30 x 40 mm.
This software uses a greyscale system that ranges from 0 to 255; where zero is
complete black and 255 is complete white. The images were converted to binary images
using the same binary threshold in all images, and subsequently, the software was used
to quantify the percentage of white pixels which represent the powder particles out of the
total number of pixels. Figure 3-6 shows a schematic diagram of the setup used in these
experiments.
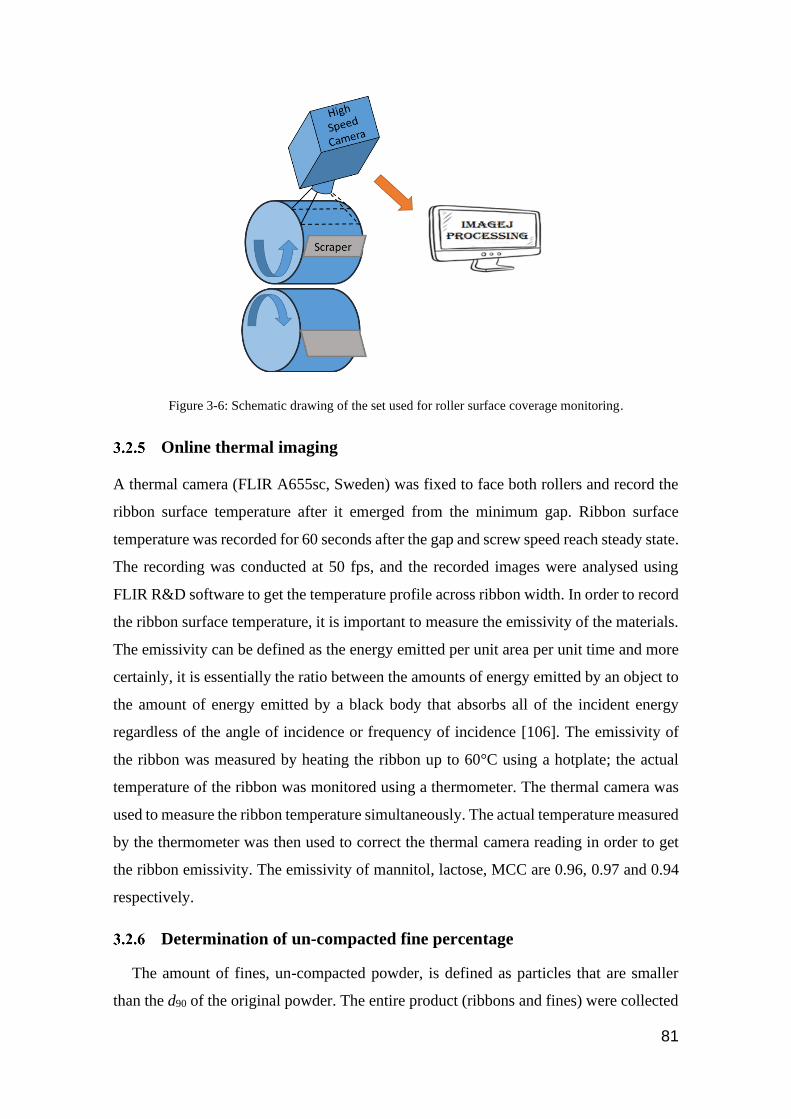
81
Figure 3-6: Schematic drawing of the set used for roller surface coverage monitoring.
Online thermal imaging
A thermal camera (FLIR A655sc, Sweden) was fixed to face both rollers and record the
ribbon surface temperature after it emerged from the minimum gap. Ribbon surface
temperature was recorded for 60 seconds after the gap and screw speed reach steady state.
The recording was conducted at 50 fps, and the recorded images were analysed using
FLIR R&D software to get the temperature profile across ribbon width. In order to record
the ribbon surface temperature, it is important to measure the emissivity of the materials.
The emissivity can be defined as the energy emitted per unit area per unit time and more
certainly, it is essentially the ratio between the amounts of energy emitted by an object to
the amount of energy emitted by a black body that absorbs all of the incident energy
regardless of the angle of incidence or frequency of incidence [106]. The emissivity of
the ribbon was measured by heating the ribbon up to 60°C using a hotplate; the actual
temperature of the ribbon was monitored using a thermometer. The thermal camera was
used to measure the ribbon temperature simultaneously. The actual temperature measured
by the thermometer was then used to correct the thermal camera reading in order to get
the ribbon emissivity. The emissivity of mannitol, lactose, MCC are 0.96, 0.97 and 0.94
respectively.
Determination of un-compacted fine percentage
The amount of fines, un-compacted powder, is defined as particles that are smaller
than the d90 of the original powder. The entire product (ribbons and fines) were collected

82
for a set period of time. The ribbons were separated from the fines by sieving (Retsch
GmbH, Germany) and the mesh size was selected according to the d90 of the used powder.
The mass of the entire product was weighed together with that of the mass of separated
fines to calculate the weight percentage of the fines.
Ribbon strength measurement-three point bend testing
The strength of the ribbons was measured using a three-point bend configuration. This
involved two sharp metal plates to support the ribbon and a sharp metal plate that is
attached to a Zwick/Roell Z 0.5 (Zwick/Roell, Germany) test machine (Figure 3-7). The
test machine applies the load at the centre of the ribbon at a rate of 1 mm/min.
Figure 3-7: Schematic drawing of the setting used for the three points bend test.
The tensile strength was then calculated using the following equation [12, 18, 19]:
𝜎𝑡 =3𝐹𝑚𝑎𝑥𝐿𝑠
2𝑏𝑚2
Equation 3-3
where σ𝑡 is the tensile strength, 𝐹𝑚𝑎𝑥 is the maximum force required to break the ribbon
(N), b and m are the width and thickness of the ribbon respectively, 𝐿𝑠 is the distance
between the two supports. 𝐿𝑠 is set according to the British standards (𝐿𝑠= m (16 ± 1))
[12, 18, 19]; b is the width of the ribbon (mm), and d is the thickness of ribbon (mm). The
measurement procedure was repeated at least ten times for the ribbons produced under
each condition.

83
Ribbon porosity measurement using X-ray tomography
Ribbon porosity was measured using microCT 35 (Scanco Medical AG, Switzerland).
X-ray was operated at a voltage of 45 kV, a power of 8 W, and a current of 177 μA. The
produced images were then analysed using Image J software which was set to a fixed
threshold to distinguish between powder (white pixel) and air (black pixel). The ratio of black
to white pixels indicates the porosity of the selected sample area.
Ribbon porosity distribution measurement using Near Infrared
Chemical Imaging (NIR-CI)
1- NIR-CI instrumentation
Roller compacted ribbons are scanned using an offline NIR diode array spectrometer
(EVK Helios G2-320 class, EVK DI KerschhaggI). The spectrometer has InGaAs
detector with 312 x 256 pixels that determine spatial and spectral resolution respectively.
So using the highest magnification lens provided by the manufacturer with (1 cm-width
FOV), the smallest detectable pixel size is ~32 µm. The spectrometer works in diffuse
reflectance mode and collects spectra in the range between 900 to 2300 nm at a frame rate
of 120 Hz. Moreover, a broadband quartz tungsten halogen (QTH) light source was
positioned so that it could uniformly illuminate the sample surface. The device is
equipped with a moving conveyor on which the sample is placed and moved under the
detector at a constant velocity; the velocity of the belt synchronised with the camera frame
rate to avoid any image shrinking or elongation. The camera records one line of 312
adjacent pixels per frame and the more lines are recorded while the belt is moving. Figure
3-8 shows a schematic representation of the configuration of the hyperspectral imaging
system used in this study.
Figure 3-8: A schematic of the hyperspectral imaging system, Adapted-[107].
84
2- Data processing
(EVK SQALAR software package, Austria) was used for data processing. The software
is based on two main multivariate data analyses (MVDA) to qualitatively and
quantitatively analyse the spectral data:
a- EC3 mode (qualitative analysis): this mode works based on conducting principal
component analysis (PCA) on the spectral data. In summary, PCA is a mathematical
procedure that is used to reduce large sets of data into a smaller set while keeping most
of the information in the large set. For example: based on its spatial resolution InGaAs-
detector collects 312 spectra at the same time, which becomes huge amount of data when
line measurement is repeated to cover the whole sample. PCA is applied to reduce this
data based on the largest variance within the spectra [108,109]. The wavelength of the
highest variation in the spectral data is called the first principle component and the
subsequent component accounts for the second-highest variation and so on.
b- Quantitative chemical imaging (QCI) mode (quantitative analysis): this mode uses partial
least square analyses (PLS) to build a quantitative predicting model. PLS gives a
quantitative dimension to the PCA by assigning each principal component to a reference
value.
3- Calibration: a set of 7 tablets were made by compacting ~ 0.1 g of powder material in 4
mm polished stainless steel die; compression was conducted under a range of stresses
(equal to the calculated stressed used for smooth rollers mediated roller compaction) and
three tablets were compacted at each compaction stress. The same set of tablets was made
for the different types of materials used in this study except for CaCO3 which was found
to be inert to the operable range of wavelength of the spectrometer. A calibration curve
was then created by plotting tablet porosity (1-relative density) against NIR-CI mean
absorbance. The calibration was then validated and used for ribbon porosity measurement
across ribbon width.

85
CHAPTER 4 NOVEL UNDERSTANDING OF RIBBON
SPLITTING/STICKING PHENOMENA
Introduction
Ribbon sticking and splitting are among the major factors that can hinder the use of
this process for some formulations. Ribbon splitting can occur either transversally
(through the ribbon thickness) or longitudinally (through the ribbon width). The current
chapter focusses on elucidating the mechanisms of splitting by an experimental study
involving single-component powders with a range of yield strengths, including those that
are commonly used as excipients. Smooth rollers were employed with and without
lubrication by applying magnesium stearate to the rollers. The minimum gap was fixed
and the maximum roll stress was varied. It was observed that transverse splitting is
commonly associated with sticking of the split ribbons to the rollers and results in an
inferior performance of the process. Longitudinal splitting is associated with an across-
width distribution of the ribbon density so that there may an adverse effect on the
mechanical strength and dissolution properties of the tablets formed from the milled
granules.
The observed trends were rationalised in terms of a splitting index, which is a measure
of the residual stresses driving crack growth relative to the tensile strength of the ribbons.
There was a lower limit at which splitting was observed but the occurrence of transverse
splitting decreased and that for longitudinal splitting increased with increasing values of
the index, which was accompanied by an increase in mixed transverse-longitudinal
splitting. Transverse splitting was always associated with sticking to the rollers and was
prevented by external lubrication. A detailed discussion of the mechanisms involved is
presented.
Hypothesis
In the exit region of the rollers, corresponding to upstream angles greater than that the
minimum gap, a ribbon will undergo elastic recovery. If the residual stresses are greater
than the critical fracture stress, ribbon splitting may be initiated. Moreover, if there is

86
adhesion to the rollers, the resulting bonding stresses will augment the residual stresses;
this may be the case even when there is not visible particle debris on the surfaces of the
rollers since adhesive rather than cohesive failure may still impose small opening stresses.
As a result of these combined stresses, ribbons can split transversally and/or
longitudinally as schematically demonstrated in Figure 4-1.
Longitudinal splitting Transversal splitting
Figure 4-1: A schematic diagram of the two kinds of ribbon splitting investigated.
Methods
As described in section 3.2.1, feed powders have been conditioned and roller compacted
using smooth rollers, fixed roll gap and a variety of maximum roller stresses. The roller
surface was monitored online during compaction, to measure the particle debris coverage
for a specific roller surface area. The collected ribbons were analysed for their strength
using the three-point bending test. A uniaxial compaction test was performed beforehand
on the feed powder to determine their yield strength, elastic recovery, and compressibility
factors. Furthermore, a shear cell test was used to characterise the feed powder for their
flow properties. Full details about the procedures used for characterisation is in chapter-
3.
Results and Discussion
Yield strength
All of the studied powders have been selected to cover a wide range of mechanical
properties; this is ranging from CaCO3 as a hard material to the predominantly plastically
deformable MCC. Heckel analysis [102] was used to evaluate powder deformability in
terms of measuring powder yield strength (𝜎𝑌). Feed powders have compacted at a series
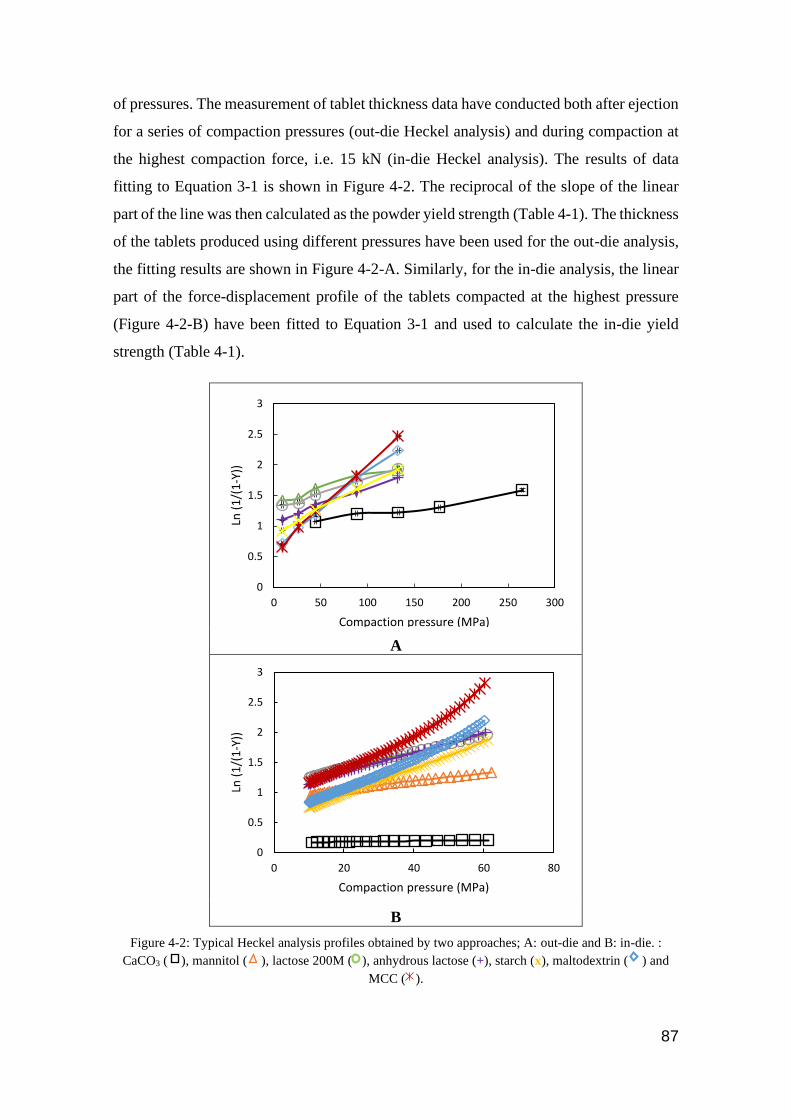
87
of pressures. The measurement of tablet thickness data have conducted both after ejection
for a series of compaction pressures (out-die Heckel analysis) and during compaction at
the highest compaction force, i.e. 15 kN (in-die Heckel analysis). The results of data
fitting to Equation 3-1 is shown in Figure 4-2. The reciprocal of the slope of the linear
part of the line was then calculated as the powder yield strength (Table 4-1). The thickness
of the tablets produced using different pressures have been used for the out-die analysis,
the fitting results are shown in Figure 4-2-A. Similarly, for the in-die analysis, the linear
part of the force-displacement profile of the tablets compacted at the highest pressure
(Figure 4-2-B) have been fitted to Equation 3-1 and used to calculate the in-die yield
strength (Table 4-1).
A
B
Figure 4-2: Typical Heckel analysis profiles obtained by two approaches; A: out-die and B: in-die. :
CaCO3 ( ), mannitol ( ), lactose 200M ( ), anhydrous lactose (+), starch (x), maltodextrin ( ) and
MCC ( ).
0
0.5
1
1.5
2
2.5
3
0 50 100 150 200 250 300
Ln (
1/(
1-Y
))
Compaction pressure (MPa)
0
0.5
1
1.5
2
2.5
3
0 20 40 60 80
Ln (
1/(
1-Y
))
Compaction pressure (MPa)
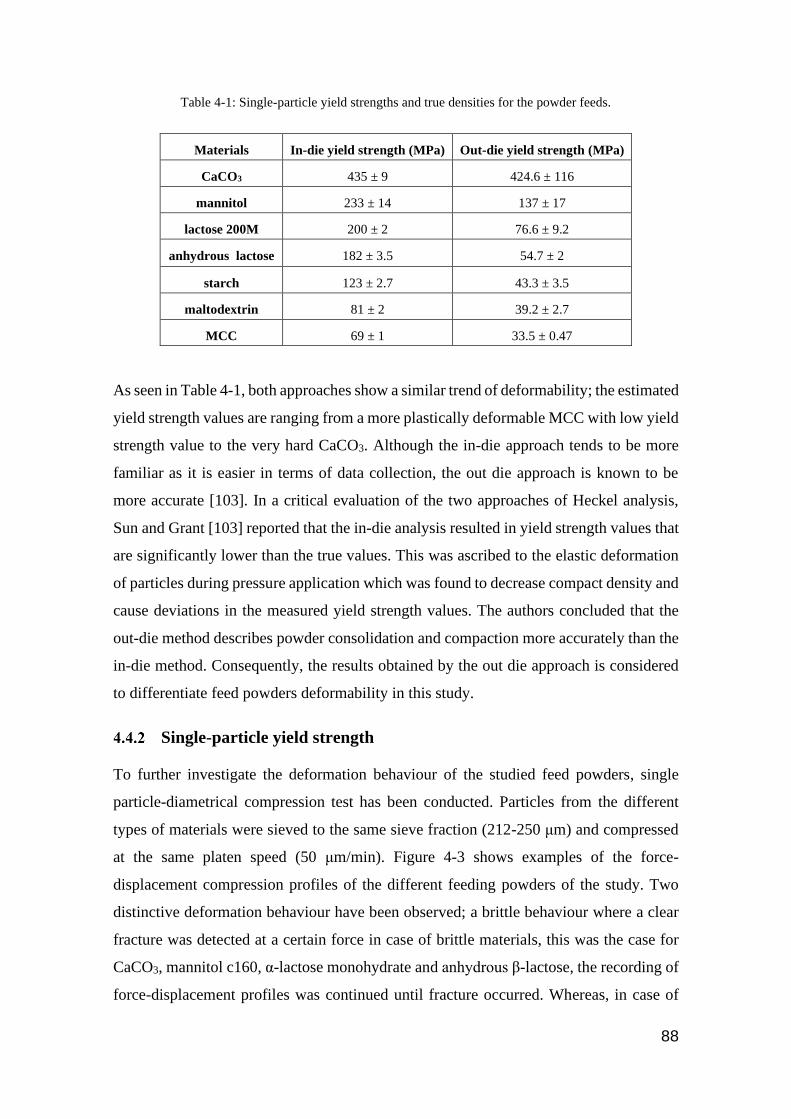
88
Table 4-1: Single-particle yield strengths and true densities for the powder feeds.
Materials In-die yield strength (MPa) Out-die yield strength (MPa)
CaCO3 435 ± 9 424.6 ± 116
mannitol 233 ± 14 137 ± 17
lactose 200M 200 ± 2 76.6 ± 9.2
anhydrous lactose 182 ± 3.5 54.7 ± 2
starch 123 ± 2.7 43.3 ± 3.5
maltodextrin 81 ± 2 39.2 ± 2.7
MCC 69 ± 1 33.5 ± 0.47
As seen in Table 4-1, both approaches show a similar trend of deformability; the estimated
yield strength values are ranging from a more plastically deformable MCC with low yield
strength value to the very hard CaCO3. Although the in-die approach tends to be more
familiar as it is easier in terms of data collection, the out die approach is known to be
more accurate [103]. In a critical evaluation of the two approaches of Heckel analysis,
Sun and Grant [103] reported that the in-die analysis resulted in yield strength values that
are significantly lower than the true values. This was ascribed to the elastic deformation
of particles during pressure application which was found to decrease compact density and
cause deviations in the measured yield strength values. The authors concluded that the
out-die method describes powder consolidation and compaction more accurately than the
in-die method. Consequently, the results obtained by the out die approach is considered
to differentiate feed powders deformability in this study.
Single-particle yield strength
To further investigate the deformation behaviour of the studied feed powders, single
particle-diametrical compression test has been conducted. Particles from the different
types of materials were sieved to the same sieve fraction (212-250 μm) and compressed
at the same platen speed (50 μm/min). Figure 4-3 shows examples of the force-
displacement compression profiles of the different feeding powders of the study. Two
distinctive deformation behaviour have been observed; a brittle behaviour where a clear
fracture was detected at a certain force in case of brittle materials, this was the case for
CaCO3, mannitol c160, α-lactose monohydrate and anhydrous β-lactose, the recording of
force-displacement profiles was continued until fracture occurred. Whereas, in case of
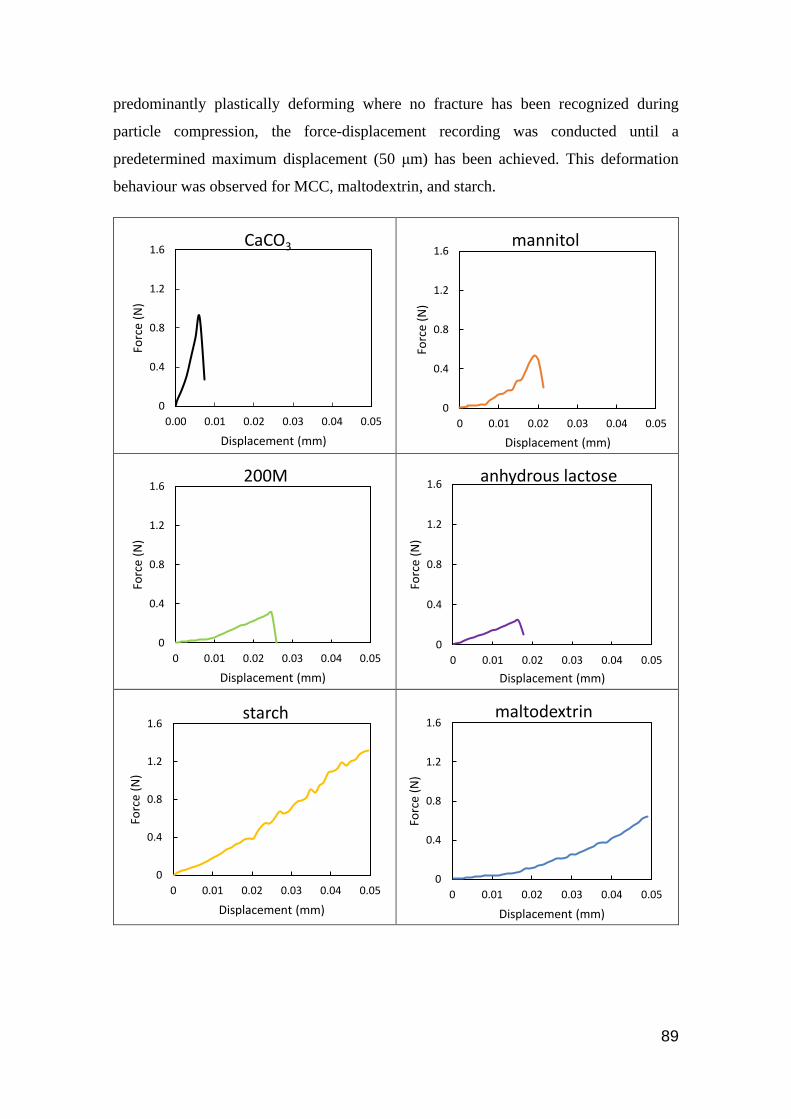
89
predominantly plastically deforming where no fracture has been recognized during
particle compression, the force-displacement recording was conducted until a
predetermined maximum displacement (50 μm) has been achieved. This deformation
behaviour was observed for MCC, maltodextrin, and starch.
0
0.4
0.8
1.2
1.6
0.00 0.01 0.02 0.03 0.04 0.05
Forc
e (N
)
Displacement (mm)
CaCO3
0
0.4
0.8
1.2
1.6
0 0.01 0.02 0.03 0.04 0.05Fo
rce
(N)
Displacement (mm)
mannitol
0
0.4
0.8
1.2
1.6
0 0.01 0.02 0.03 0.04 0.05
Forc
e (N
)
Displacement (mm)
200M
0
0.4
0.8
1.2
1.6
0 0.01 0.02 0.03 0.04 0.05
Forc
e (N
)
Displacement (mm)
anhydrous lactose
0
0.4
0.8
1.2
1.6
0 0.01 0.02 0.03 0.04 0.05
Forc
e (N
)
Displacement (mm)
starch
0
0.4
0.8
1.2
1.6
0 0.01 0.02 0.03 0.04 0.05
Forc
e (N
)
Displacement (mm)
maltodextrin
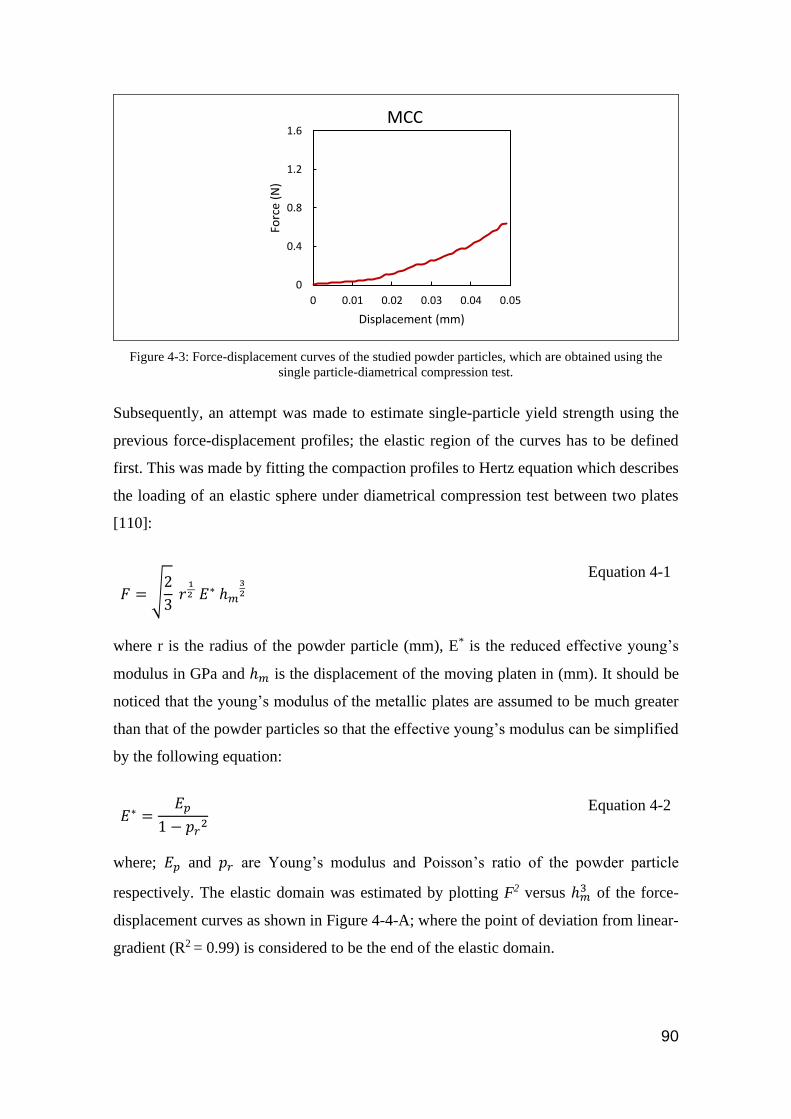
90
Figure 4-3: Force-displacement curves of the studied powder particles, which are obtained using the
single particle-diametrical compression test.
Subsequently, an attempt was made to estimate single-particle yield strength using the
previous force-displacement profiles; the elastic region of the curves has to be defined
first. This was made by fitting the compaction profiles to Hertz equation which describes
the loading of an elastic sphere under diametrical compression test between two plates
[110]:
𝐹 = √2
3 𝑟
12 𝐸∗ ℎ𝑚
32
Equation 4-1
where r is the radius of the powder particle (mm), E* is the reduced effective young’s
modulus in GPa and ℎ𝑚 is the displacement of the moving platen in (mm). It should be
noticed that the young’s modulus of the metallic plates are assumed to be much greater
than that of the powder particles so that the effective young’s modulus can be simplified
by the following equation:
𝐸∗ =𝐸𝑝
1 − 𝑝𝑟2
Equation 4-2
where; 𝐸𝑝 and 𝑝𝑟 are Young’s modulus and Poisson’s ratio of the powder particle
respectively. The elastic domain was estimated by plotting F2 versus ℎ𝑚3 of the force-
displacement curves as shown in Figure 4-4-A; where the point of deviation from linear-
gradient (R2 = 0.99) is considered to be the end of the elastic domain.
0
0.4
0.8
1.2
1.6
0 0.01 0.02 0.03 0.04 0.05
Forc
e (N
)
Displacement (mm)
MCC
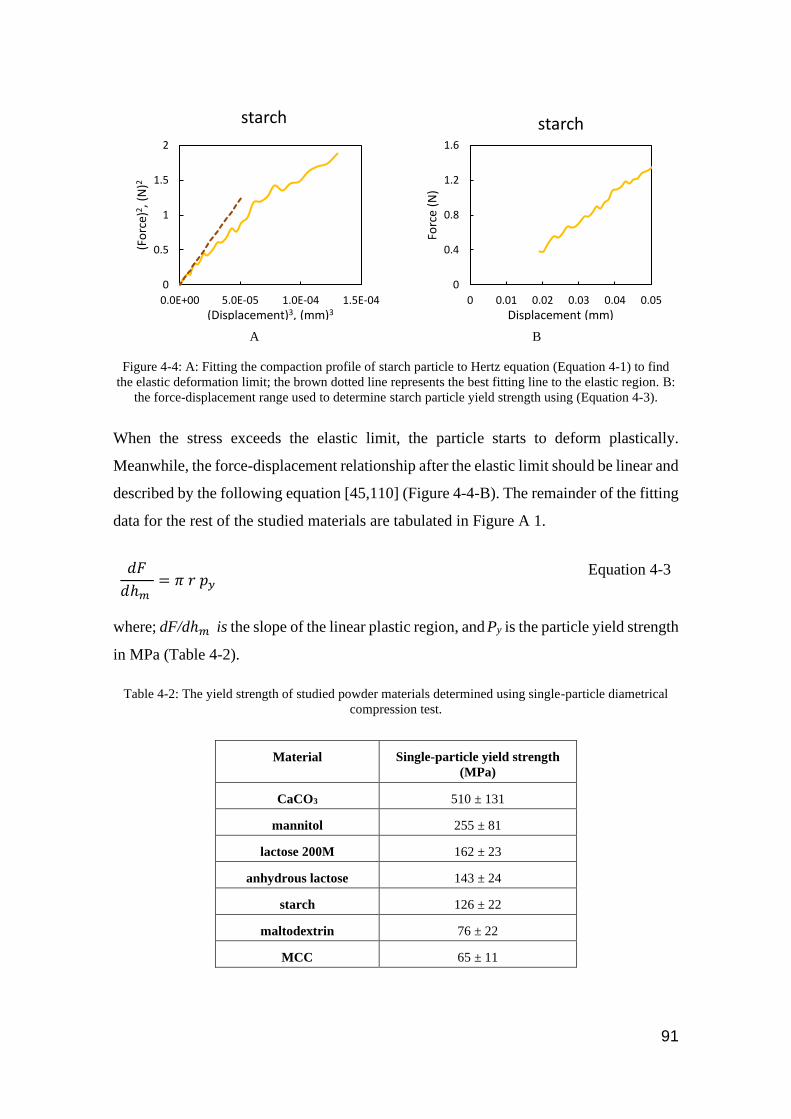
91
A B
Figure 4-4: A: Fitting the compaction profile of starch particle to Hertz equation (Equation 4-1) to find
the elastic deformation limit; the brown dotted line represents the best fitting line to the elastic region. B:
the force-displacement range used to determine starch particle yield strength using (Equation 4-3).
When the stress exceeds the elastic limit, the particle starts to deform plastically.
Meanwhile, the force-displacement relationship after the elastic limit should be linear and
described by the following equation [45,110] (Figure 4-4-B). The remainder of the fitting
data for the rest of the studied materials are tabulated in Figure A 1.
𝑑𝐹
𝑑ℎ𝑚 = 𝜋 𝑟 𝑝𝑦
Equation 4-3
where; dF/dℎ𝑚 is the slope of the linear plastic region, and Py is the particle yield strength
in MPa (Table 4-2).
Table 4-2: The yield strength of studied powder materials determined using single-particle diametrical
compression test.
Material Single-particle yield strength
(MPa)
CaCO3 510 ± 131
mannitol 255 ± 81
lactose 200M 162 ± 23
anhydrous lactose 143 ± 24
starch 126 ± 22
maltodextrin 76 ± 22
MCC 65 ± 11
0
0.5
1
1.5
2
0.0E+00 5.0E-05 1.0E-04 1.5E-04
(Fo
rce)
2 , (
N)2
(Displacement)3, (mm)3
starch
0
0.4
0.8
1.2
1.6
0 0.01 0.02 0.03 0.04 0.05
Forc
e (N
)
Displacement (mm)
starch
92
As clearly seen in Table 4-2 and Table 4-1, both the single-particle compression test and
Heckel analysis showed the same trend of deformability. However, the single-particle
method suffered from some weaknesses that could limit its usefulness; an accurate
determination of the particle yield strength requires a careful evaluation of the contact
surface area, in this case, the particle projected surface area was treated as the contact
surface area for this measurement which can lead to a misleading measurement. On the
other hand, it has to be mentioned that an R2 value of 0.99 was taken as criteria for the
determination of the elastic region of the force-displacement curves (Figure 4-4-A). This
consideration can add to the weakness in the measurement since higher or lower taken R2
can lead to different evaluation of the elastic region. Unlike single-particle measurements
the yield strength values estimated by out-die Heckel analysis are based on compacting
the whole size range of the powder bed which is the case during roller compaction;
consequently, the yield strength values predicted using out-die Heckel analysis was
considered for powder deformability evaluation in the following studies.
Maximum stress in roller compaction
The amount of stress received by any material depends on both the pressure applied by
the rollers and the properties of the compacted material; therefore, it is necessary to
compare the product properties based on the stress applied on them. To determine the
stress applied on the powder during roller compaction, Johanson’s mathematical model
was used, taking into consideration the process parameters and material properties [83].
The maximum applied roll stress and nip angle were calculated using the analysis
developed by Johanson [47] (Equation 2-6 to Equation 2-16), which has been employed
by many researchers [83,95]. Recent work has shown that one limitation of the approach
is the application of a power-law relationship between the stress and the ribbon density
since it does not capture the behaviour at small pressures [85]. Consequently, the uniaxial
compaction data was fitted to an alternative relationship (Equation 2-14), developed by
Adams et al. [86] that was adopted in [85].
An example of fitting anhydrous lactose compaction data to equation (Equation 2-14),
is shown in Figure 4-5. The fitting of the remainder of the studied feed powders is shown
in Figure A 2. The resultant fitting parameter (compressibility factor (κ)) of the die

93
compaction data to Equation 2-14 together with the values of angle of wall and internal
friction that have been measured with a ring shear cell test are given in Table 4-3.
Figure 4-5: Typical stress-strain data for anhydrous lactose during uniaxial compaction test. The blue line
represents the best fit to equation (Equation 2-14) and the black line shows anhydrous lactose compaction
profile.
Table 4-3: Compressibility factor and flow properties of the materials.
Material κ 𝜹𝑬 ∅𝐰
Smooth coupon CaCO3 13.2 ± 0.7 44.8 ± 0.3 17.1 ± 0.5
mannitol 10.3 ± 0.2 39.3 ± 0.1 10.3 ± 0.7
lactose 200M 12.7 ± 0.6 46.3 ± 0.3 16.8 ± 1.1
anhydrous lactose 8.8 ± 0.1 40.6 ± 0.2 13.6 ± 1.1
starch 8.4 ± 0.3 34.2 ± 0.1 9.5 ± 1.9
maltodextrin 6.0 ± 0.3 40 ± 0.1 10.2 ± 1.1
MCC 5.3 ± 0.9 44.5 ± 0.2 6.9 ± 0.3
Subsequently, the maximum roll stress as a function of the hydraulic pressure for the
unlubricated smooth rollers has been calculated using Equation 2-6 to Equation 2-16
(Figure 4-6).
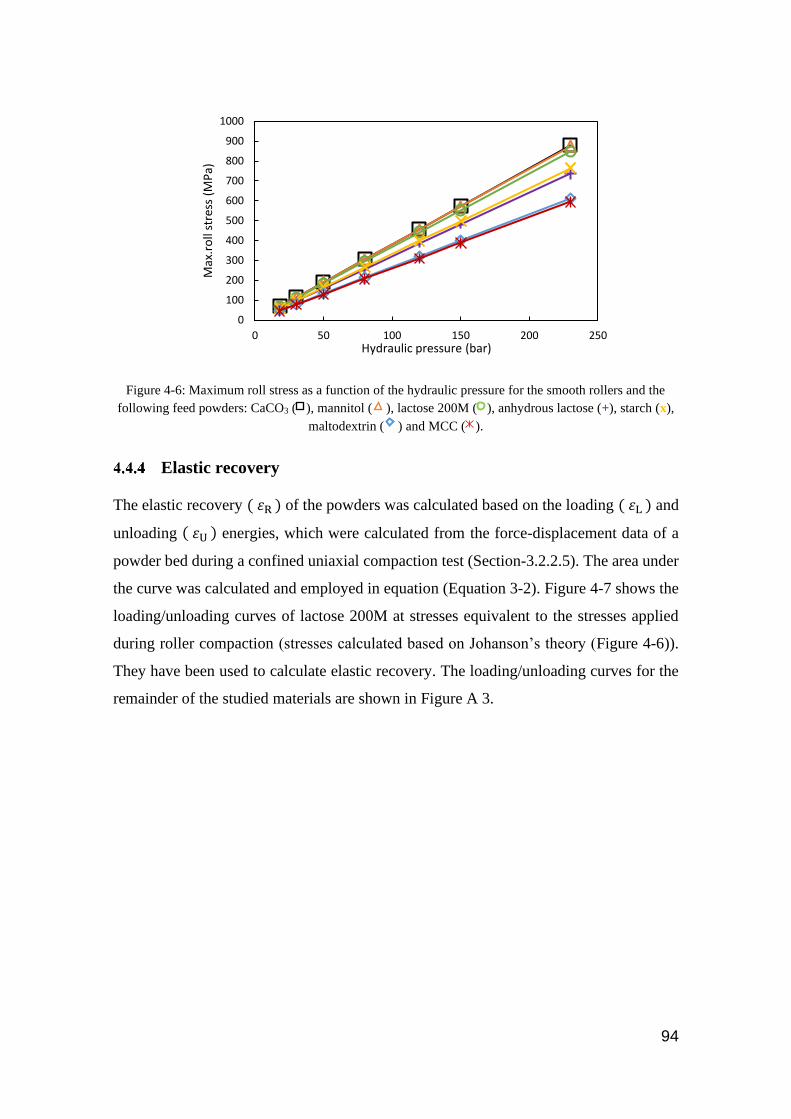
94
Figure 4-6: Maximum roll stress as a function of the hydraulic pressure for the smooth rollers and the
following feed powders: CaCO3 ( ), mannitol ( ), lactose 200M ( ), anhydrous lactose (+), starch (x),
maltodextrin ( ) and MCC ( ).
Elastic recovery
The elastic recovery ( 휀R ) of the powders was calculated based on the loading ( 휀L ) and
unloading ( 휀U ) energies, which were calculated from the force-displacement data of a
powder bed during a confined uniaxial compaction test (Section-3.2.2.5). The area under
the curve was calculated and employed in equation (Equation 3-2). Figure 4-7 shows the
loading/unloading curves of lactose 200M at stresses equivalent to the stresses applied
during roller compaction (stresses calculated based on Johanson’s theory (Figure 4-6)).
They have been used to calculate elastic recovery. The loading/unloading curves for the
remainder of the studied materials are shown in Figure A 3.
0
100
200
300
400
500
600
700
800
900
1000
0 50 100 150 200 250
Max
.ro
ll st
ress
(M
Pa)
Hydraulic pressure (bar)
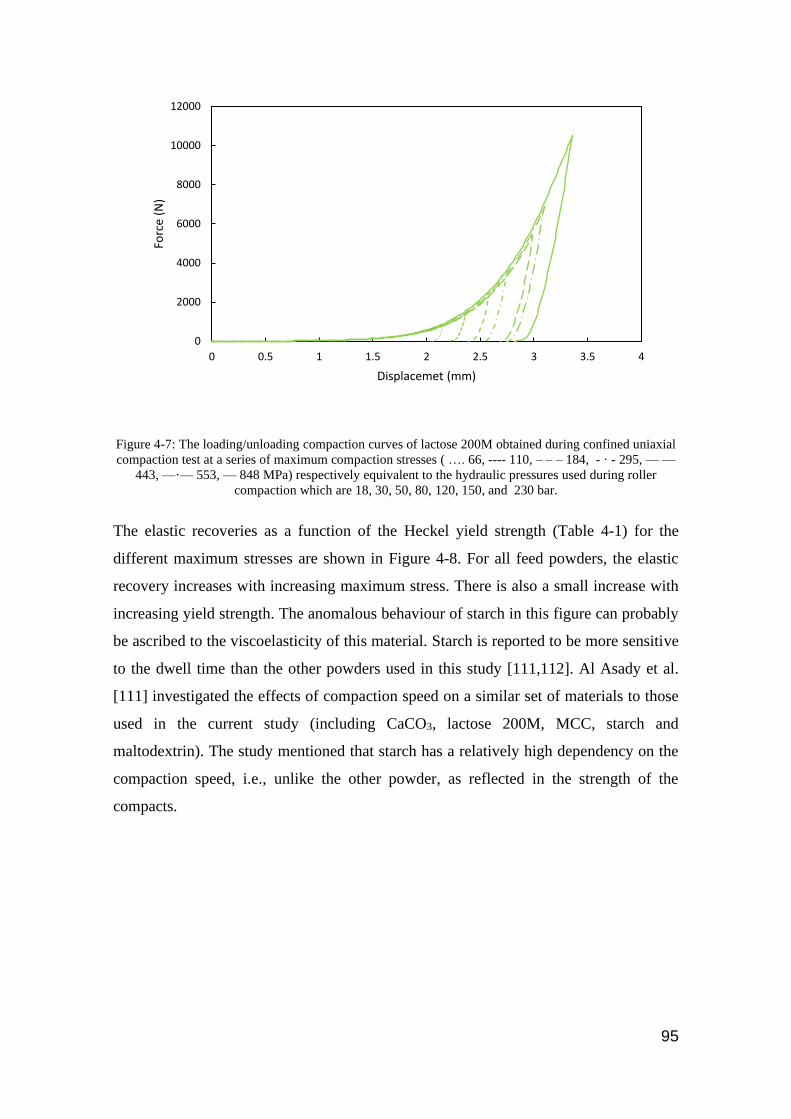
95
Figure 4-7: The loading/unloading compaction curves of lactose 200M obtained during confined uniaxial
compaction test at a series of maximum compaction stresses ( …. 66, ---- 110, ‒ ‒ ‒ 184, - · - 295, — —
443, —·— 553, — 848 MPa) respectively equivalent to the hydraulic pressures used during roller
compaction which are 18, 30, 50, 80, 120, 150, and 230 bar.
The elastic recoveries as a function of the Heckel yield strength (Table 4-1) for the
different maximum stresses are shown in Figure 4-8. For all feed powders, the elastic
recovery increases with increasing maximum stress. There is also a small increase with
increasing yield strength. The anomalous behaviour of starch in this figure can probably
be ascribed to the viscoelasticity of this material. Starch is reported to be more sensitive
to the dwell time than the other powders used in this study [111,112]. Al Asady et al.
[111] investigated the effects of compaction speed on a similar set of materials to those
used in the current study (including CaCO3, lactose 200M, MCC, starch and
maltodextrin). The study mentioned that starch has a relatively high dependency on the
compaction speed, i.e., unlike the other powder, as reflected in the strength of the
compacts.
0
2000
4000
6000
8000
10000
12000
0 0.5 1 1.5 2 2.5 3 3.5 4
Forc
e (N
)
Displacemet (mm)
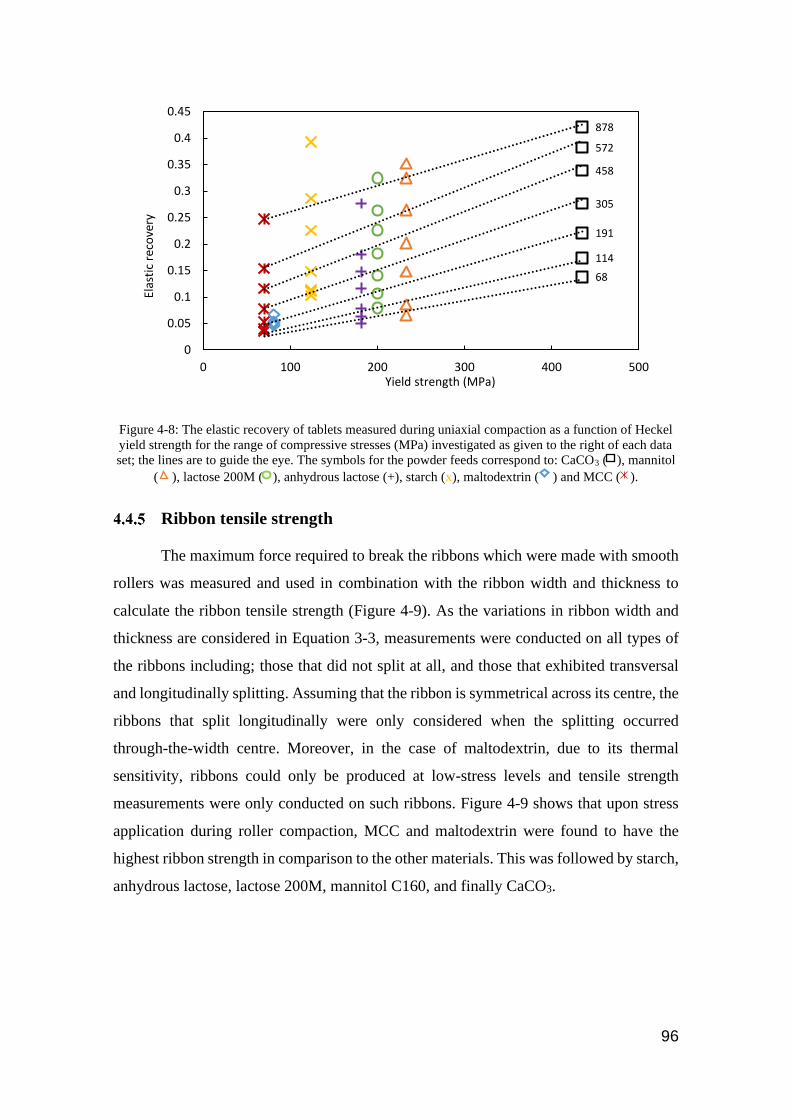
96
Figure 4-8: The elastic recovery of tablets measured during uniaxial compaction as a function of Heckel
yield strength for the range of compressive stresses (MPa) investigated as given to the right of each data
set; the lines are to guide the eye. The symbols for the powder feeds correspond to: CaCO3 ( ), mannitol
( ), lactose 200M ( ), anhydrous lactose (+), starch (x), maltodextrin ( ) and MCC ( ).
Ribbon tensile strength
The maximum force required to break the ribbons which were made with smooth
rollers was measured and used in combination with the ribbon width and thickness to
calculate the ribbon tensile strength (Figure 4-9). As the variations in ribbon width and
thickness are considered in Equation 3-3, measurements were conducted on all types of
the ribbons including; those that did not split at all, and those that exhibited transversal
and longitudinally splitting. Assuming that the ribbon is symmetrical across its centre, the
ribbons that split longitudinally were only considered when the splitting occurred
through-the-width centre. Moreover, in the case of maltodextrin, due to its thermal
sensitivity, ribbons could only be produced at low-stress levels and tensile strength
measurements were only conducted on such ribbons. Figure 4-9 shows that upon stress
application during roller compaction, MCC and maltodextrin were found to have the
highest ribbon strength in comparison to the other materials. This was followed by starch,
anhydrous lactose, lactose 200M, mannitol C160, and finally CaCO3.
68
191
305
458
572
878
114
0
0.05
0.1
0.15
0.2
0.25
0.3
0.35
0.4
0.45
0 100 200 300 400 500
Elas
tic
reco
very
Yield strength (MPa)

97
Figure 4-9: The effect of maximum compaction stress on the tensile strength of ribbons.
To first order, the tensile strength of the ribbons increased linearly with increasing
maximum roll stress and the mean ratio increases with increasing values of the reciprocal
of the yield strength (Figure 4-10). The line in Figure 4-10 is the best linear fit to the data
(R2 = 0.94) and corresponds to the following expression, where the intercept represents
the minimum yield strength required to form a coherent ribbon:
𝜎T
𝜎max= 2.90𝐾−1 − 0.01 (Equation 4-4)
0
2
4
6
8
10
12
14
16
0 200 400 600 800 1000
Ten
sile
str
engt
h (
MP
a)
Maximum stress (MPa)

98
Figure 4-10: The mean ratio of the tensile strength and the maximum roll stress as a function of the
reciprocal of the yield strength for CaCO3 ( ), mannitol ( ), lactose 200M ( ), anhydrous lactose (+),
starch (x), maltodextrin ( ) and MCC ( ); the line is the best linear fit (Equation 4-4).
Ribbon splitting and sticking observations
As previously explained in section 3.2.3, all ribbons were produced using a fixed
minimum gap distance and a variety of hydraulic pressures. Subsequently, ribbons were
collected and all observations of ribbon sticking and splitting were recorded. Table 4-4
summarises the effects of the hydraulic pressure on the sticking and splitting behaviour
of the different powder feeds in descending order of their Heckel yield strength for the
unlubricated smooth rollers. Sticking refers to the physical adhesion of the ribbon to the
two rollers and it is more likely associated with transverse splitting. The transversal
(through-thickness) and longitudinal (through-width) splitting are classified as ‘T’ and
‘L’ respectively. Shaded areas in red indicate the occurrence of the splitting or sticking.
Shaded areas in green correspond to conditions under which splitting or sticking does not
occur.
0
0.005
0.01
0.015
0.02
0.025
0.03
0.035
0.04
0.045
0.05
0 0.002 0.004 0.006 0.008 0.01 0.012 0.014 0.016
Ten
sile
str
engt
h /
Max
. ro
ll st
ress
1/Heckel yield strength (MPa-1)

99
Table 4-4: Effect of the maximum roll stress on the splitting and sticking behaviour of the ribbons formed from unlubricated smooth rollers. Grey dotted areas indicate a non-
achievable condition. Red regions indicate the occurrence of splitting/sticking. Green regions indicate the non-occurrence of splitting/sticking. Spitting is designated by T
(transversal splitting), Ln (longitudinal splitting into n pieces) and L J (longitudinally joined splitting).
100
As can be seen in Table 4-4, for all of the produced ribbons with the exception of the
CaCO3 ribbons, transverse splitting only occurs when there is sticking to the rollers and
thus only longitudinal splitting is possible when the rollers are lubricated. Ribbons made
from CaCO3 are the exception in exhibiting transverse splitting even though sticking to
the rollers does not occur. The images from Figure 4-11 show the top and the bottom
surface of splitting ribbons that were produced at different stress levels. It can be seen
that the bottom surface is evidently rougher compared with the top surface (Figure 4-11-
B). Because of the limited deformability of this material, the increase in the applied stress
was not sufficient to create strong enough bonds to save the integrity of the compacted
ribbon (non-splitting ribbon).
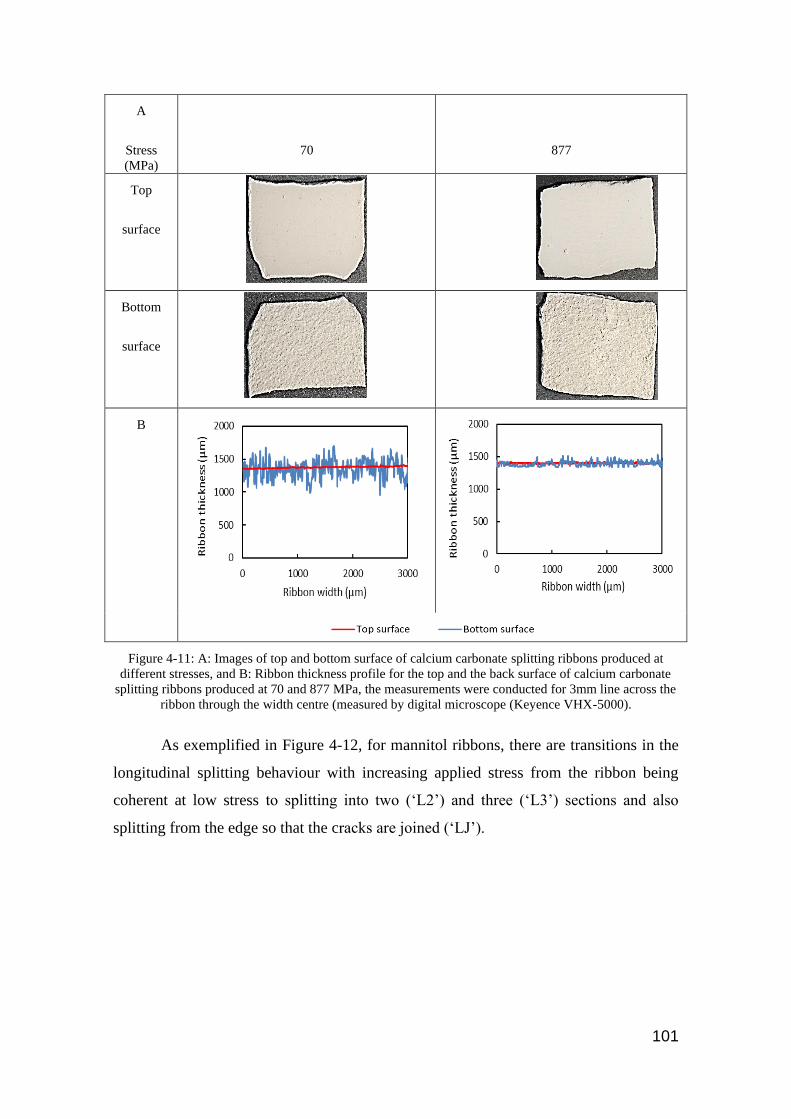
101
A
Stress
(MPa)
70
877
Top
surface
Bottom
surface
B
Figure 4-11: A: Images of top and bottom surface of calcium carbonate splitting ribbons produced at
different stresses, and B: Ribbon thickness profile for the top and the back surface of calcium carbonate
splitting ribbons produced at 70 and 877 MPa, the measurements were conducted for 3mm line across the
ribbon through the width centre (measured by digital microscope (Keyence VHX-5000).
As exemplified in Figure 4-12, for mannitol ribbons, there are transitions in the
longitudinal splitting behaviour with increasing applied stress from the ribbon being
coherent at low stress to splitting into two (‘L2’) and three (‘L3’) sections and also
splitting from the edge so that the cracks are joined (‘LJ’).
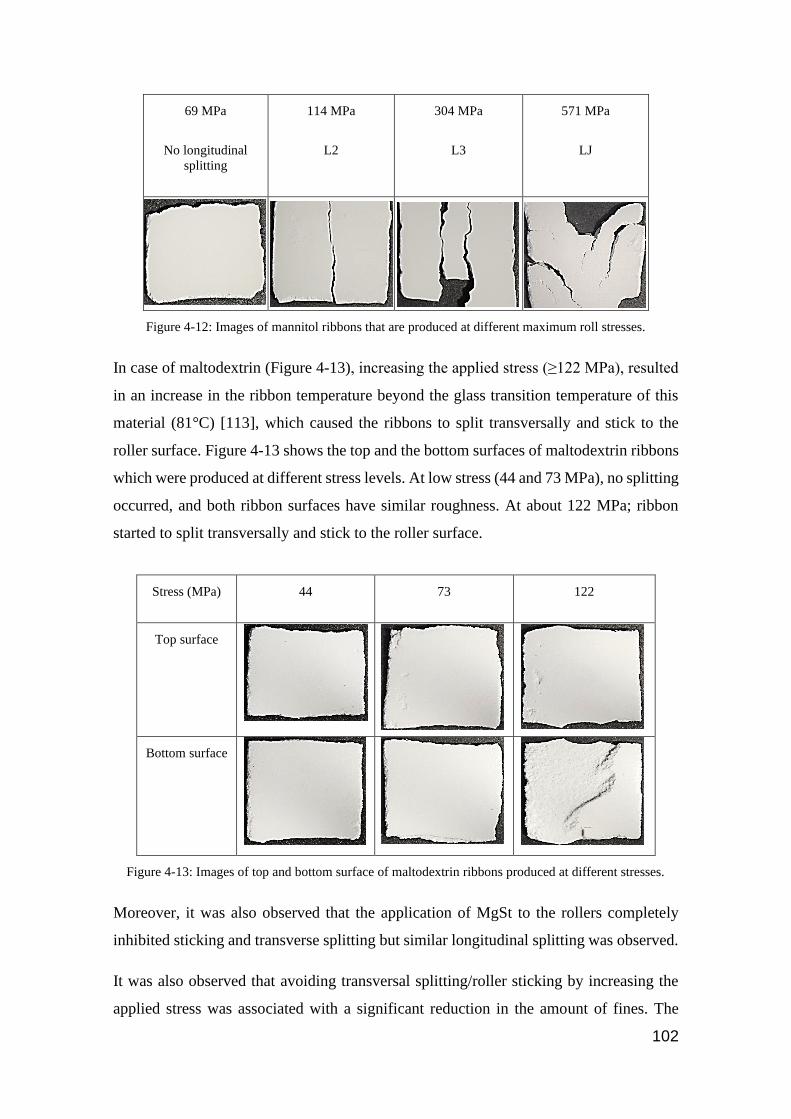
102
69 MPa
No longitudinal
splitting
114 MPa
L2
304 MPa
L3
571 MPa
LJ
Figure 4-12: Images of mannitol ribbons that are produced at different maximum roll stresses.
In case of maltodextrin (Figure 4-13), increasing the applied stress (≥122 MPa), resulted
in an increase in the ribbon temperature beyond the glass transition temperature of this
material (81°C) [113], which caused the ribbons to split transversally and stick to the
roller surface. Figure 4-13 shows the top and the bottom surfaces of maltodextrin ribbons
which were produced at different stress levels. At low stress (44 and 73 MPa), no splitting
occurred, and both ribbon surfaces have similar roughness. At about 122 MPa; ribbon
started to split transversally and stick to the roller surface.
Stress (MPa) 44 73 122
Top surface
Bottom surface
Figure 4-13: Images of top and bottom surface of maltodextrin ribbons produced at different stresses.
Moreover, it was also observed that the application of MgSt to the rollers completely
inhibited sticking and transverse splitting but similar longitudinal splitting was observed.
It was also observed that avoiding transversal splitting/roller sticking by increasing the
applied stress was associated with a significant reduction in the amount of fines. The
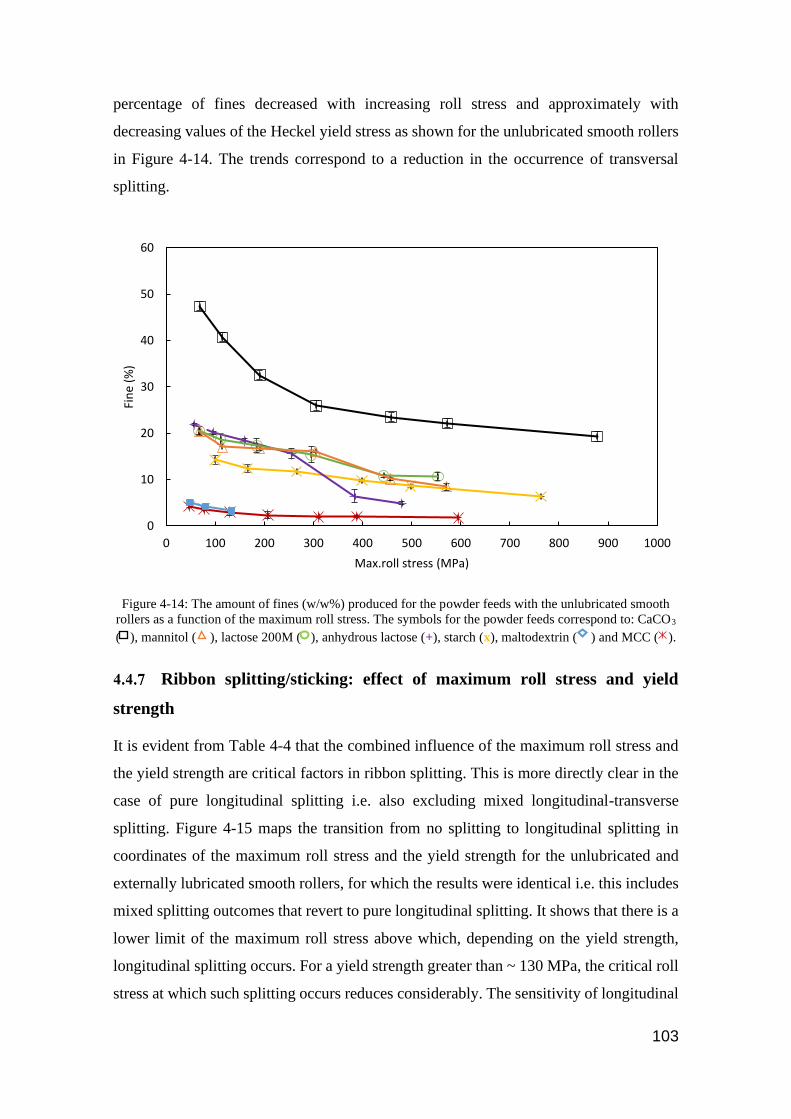
103
percentage of fines decreased with increasing roll stress and approximately with
decreasing values of the Heckel yield stress as shown for the unlubricated smooth rollers
in Figure 4-14. The trends correspond to a reduction in the occurrence of transversal
splitting.
Figure 4-14: The amount of fines (w/w%) produced for the powder feeds with the unlubricated smooth
rollers as a function of the maximum roll stress. The symbols for the powder feeds correspond to: CaCO3
( ), mannitol ( ), lactose 200M ( ), anhydrous lactose (+), starch (x), maltodextrin ( ) and MCC ( ).
Ribbon splitting/sticking: effect of maximum roll stress and yield
strength
It is evident from Table 4-4 that the combined influence of the maximum roll stress and
the yield strength are critical factors in ribbon splitting. This is more directly clear in the
case of pure longitudinal splitting i.e. also excluding mixed longitudinal-transverse
splitting. Figure 4-15 maps the transition from no splitting to longitudinal splitting in
coordinates of the maximum roll stress and the yield strength for the unlubricated and
externally lubricated smooth rollers, for which the results were identical i.e. this includes
mixed splitting outcomes that revert to pure longitudinal splitting. It shows that there is a
lower limit of the maximum roll stress above which, depending on the yield strength,
longitudinal splitting occurs. For a yield strength greater than ~ 130 MPa, the critical roll
stress at which such splitting occurs reduces considerably. The sensitivity of longitudinal
0
10
20
30
40
50
60
0 100 200 300 400 500 600 700 800 900 1000
Fin
e (%
)
Max.roll stress (MPa)

104
splitting to increasing the roll stress and the yield strength is clearly related to the increase
in the elastic recovery (Figure 4-8).
Figure 4-15: A map of the transition from no splitting to longitudinal splitting in coordinates of the
maximum roll stress and the Heckel particle yield strength for the unlubricated and externally lubricated
smooth rollers. The symbols for the powder feeds correspond to: mannitol ( ), lactose 200M ( ),
anhydrous lactose (+), starch (x), MCC ( ). Longitudinal splitting was not observed for CaCO3.
The compaction of powder assemblies is accommodated by a combination of a number
of mechanisms that may include the rearrangement, elastic or elastoplastic deformation
and fracture of the particles. It is well established that the stress is not transmitted
uniformly but through force chains that increase in number density with increasing stress.
Thus, as particles become progressively subjected to increasing stress, it will eventually
cause them to deform plastically rather elastically when their yield strength is exceeded,
and thus reducing the contribution to the elastic recovery. This would also be the case for
particle rearrangement and fracture. Moreover, greater yield strengths are associated with
less cohesion of the compacted particles so that the tensile strength of the ribbons
decreases with increasing values of the yield strength (Figure 4-10).
A critical factor in longitudinal splitting is the relative difference in the porosity across
the ribbons since it is related to the variation in the elastic recovery. Figure 4-16 shows
X-ray images of MCC ribbon produced at 204 MPa. The images show a clear difference
0
50
100
150
200
250
300
350
400
450
50 100 150 200 250
Max
. ro
ll st
ress
(M
Pa)
Yield Strength (MPa)
Longitudinal splitting
No longitudinal splitting

105
in ribbon porosity between the ribbon through-the-width centre and its sides; more air
(black pixels) at both edges compared to more powder (white pixels) at the centre.
Left side Centre Right side
Figure 4-16: X-ray tomography images of MCC ribbon produced at 204 MPa across its width.
To understand the origin of the relative difference in the porosity, which has been
observed previously [114], it is useful to consider roller compaction as a combination of
shear and squeeze flow. The squeeze flow component exerts back pressure upstream
resulting in the maximum pressure occurring at an angle that is greater than that
corresponding to the minimum gap, which is normally taken as zero. This angle is
approximately equal to the neutral angle at which the shear stress is zero due to its change
of direction [64]. More importantly, the squeeze component results in a lateral pressure
distribution that has a maximum value in the centre of the width of the ribbon. Such non-
uniform pressure distributions are observed in the compression of all fluids, solids, and
granular systems e.g. metals [115] and pastes [116]. They arise from the resistance to
deformation/flow caused by no-slip or friction at the contacting walls. As a result, the
powder feed in a roller compactor is more compressed in the centre of the ribbon
compared to the edges as demonstrated in Figure 4-16. This has important implications
for ribbon splitting as discussed below.
Since the porosity is lowest in the centre of a ribbon, the maximum roll stress must be
greater in this region compared to the edges. Thus, in the exit region, the stored elastic
strain, and hence the expansion of the ribbon, will be greatest in the centre of a ribbon.
As a result, longitudinal splitting always occurs in the centre of the width of the ribbons
where the crack opening stresses will be greatest. Consequently, bending stresses are
developed that increase from zero in the centre of the width to a maximum value on the
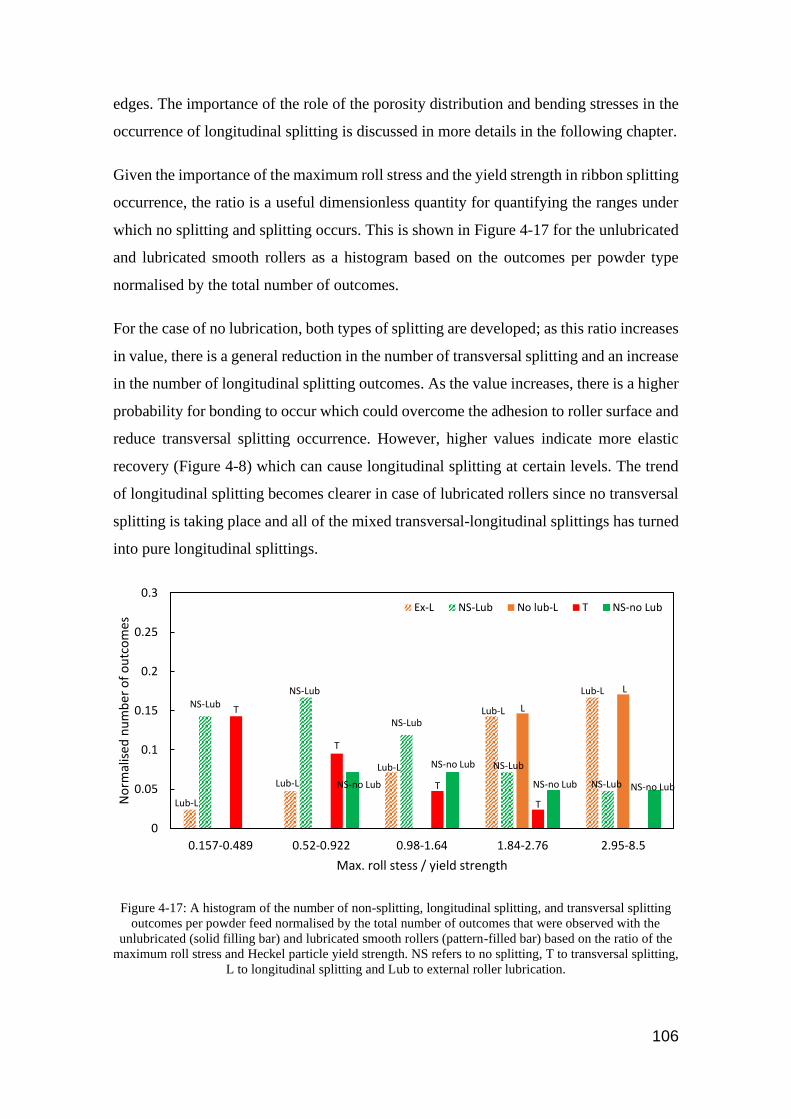
106
edges. The importance of the role of the porosity distribution and bending stresses in the
occurrence of longitudinal splitting is discussed in more details in the following chapter.
Given the importance of the maximum roll stress and the yield strength in ribbon splitting
occurrence, the ratio is a useful dimensionless quantity for quantifying the ranges under
which no splitting and splitting occurs. This is shown in Figure 4-17 for the unlubricated
and lubricated smooth rollers as a histogram based on the outcomes per powder type
normalised by the total number of outcomes.
For the case of no lubrication, both types of splitting are developed; as this ratio increases
in value, there is a general reduction in the number of transversal splitting and an increase
in the number of longitudinal splitting outcomes. As the value increases, there is a higher
probability for bonding to occur which could overcome the adhesion to roller surface and
reduce transversal splitting occurrence. However, higher values indicate more elastic
recovery (Figure 4-8) which can cause longitudinal splitting at certain levels. The trend
of longitudinal splitting becomes clearer in case of lubricated rollers since no transversal
splitting is taking place and all of the mixed transversal-longitudinal splittings has turned
into pure longitudinal splittings.
Figure 4-17: A histogram of the number of non-splitting, longitudinal splitting, and transversal splitting
outcomes per powder feed normalised by the total number of outcomes that were observed with the
unlubricated (solid filling bar) and lubricated smooth rollers (pattern-filled bar) based on the ratio of the
maximum roll stress and Heckel particle yield strength. NS refers to no splitting, T to transversal splitting,
L to longitudinal splitting and Lub to external roller lubrication.
Lub-L
Lub-L
Lub-L
Lub-L
Lub-LNS-Lub
NS-Lub
NS-Lub
NS-Lub
NS-Lub
L
L
T
T
T
T
NS-no Lub
NS-no Lub
NS-no Lub NS-no Lub
0
0.05
0.1
0.15
0.2
0.25
0.3
0.157-0.489 0.52-0.922 0.98-1.64 1.84-2.76 2.95-8.5
No
rmal
ised
nu
mb
er o
f o
utc
om
es
Max. roll stess / yield strength
Ex-L NS-Lub No lub-L T NS-no Lub

107
Splitting index
An alternative dimensionless quantity is a splitting index, 𝐼S:
𝐼S = 휀R𝜎max /𝜎t Equation 4-5
It is more fundamental in terms of its mechanistic interpretation than the ratio 𝜎max/𝜎Y
but requires that roller compaction has to be carried out in order to measure 𝜎t before it
can be employed for assessing formulations and operating conditions.
This index is based on estimating residual stress and ribbon tensile strength to predict
splitting occurrence. However, despite having the largest yield strength (Table 4-1), and
hence the highest elastic recovery (Figure 4-8) and weakest ribbons (Figure 4-9), CaCO3
ribbons never split longitudinally (Table 4-4). The probable cause is that the ribbons
exhibit stable fracture unlike those formed by the other powder feeds (Figure 4-18).
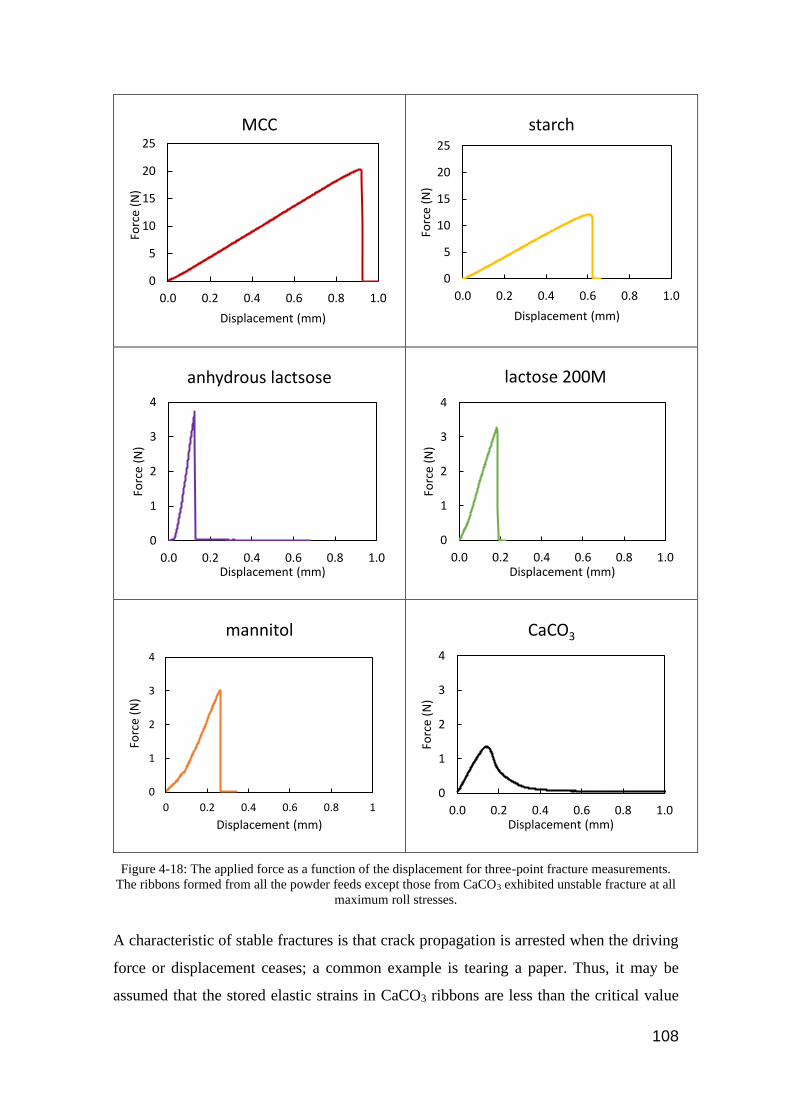
108
Figure 4-18: The applied force as a function of the displacement for three-point fracture measurements.
The ribbons formed from all the powder feeds except those from CaCO3 exhibited unstable fracture at all
maximum roll stresses.
A characteristic of stable fractures is that crack propagation is arrested when the driving
force or displacement ceases; a common example is tearing a paper. Thus, it may be
assumed that the stored elastic strains in CaCO3 ribbons are less than the critical value
0
5
10
15
20
25
0.0 0.2 0.4 0.6 0.8 1.0
Forc
e (N
)
Displacement (mm)
MCC
0
5
10
15
20
25
0.0 0.2 0.4 0.6 0.8 1.0
Forc
e (N
)
Displacement (mm)
starch
0
1
2
3
4
0.0 0.2 0.4 0.6 0.8 1.0
Forc
e (N
)
Displacement (mm)
anhydrous lactsose
0
1
2
3
4
0.0 0.2 0.4 0.6 0.8 1.0
Forc
e (N
)
Displacement (mm)
lactose 200M
0
1
2
3
4
0 0.2 0.4 0.6 0.8 1
Forc
e (N
)
Displacement (mm)
mannitol
0
1
2
3
4
0.0 0.2 0.4 0.6 0.8 1.0
Forc
e (N
)
Displacement (mm)
CaCO3

109
required to significantly propagate a longitudinal crack. In the case of the ribbons made
from the other powders, the instability of the crack growth will result in catastrophic crack
propagating once it is initiated. It is more difficult to understand the factors that result in
the CaCO3 ribbons splitting transversely in the absence of observable adhesion to the
rollers. It has been argued, on the basis of finite element modelling, that the reversal of
the shear stress and strain at the neutral angle may result in fracture/lamination since
pharmaceutical powder compacts are generally weak under shear [64]. That is, weak
adhesion forces to the rollers may be sufficient to cause such a weak plane to fracture
transversely. The CaCO3 ribbons would be particularly susceptible to such a mechanism
since they are so mechanically weak in any case. Consequently, CaCO3 splitting data has
been excluded for its anomalous splitting behaviour.
When applied, the splitting index leads to a trend of decreasing no splitting and increasing
longitudinal splitting as the values of this parameter increases (Figure 4-19). However,
there is an upper limit at which splitting always occurs. That the values increase to ~45
rather than the ideal case of the critical condition for splitting being approximately unity
arises because the numerator in Equation 4-5 is some measure of the residual stress acting
vertically rather than the actual crack opening stress acting at the two surfaces of a ribbon.
Figure 4-19: A histogram of the number of non-splitting ( ) and longitudinal splitting outcomes per
powder feed normalised by the total number of outcomes that were observed with the unlubricated ( )
and lubricated smooth rollers ( ) based on the splitting index. NS refers to no splitting, L to longitudinal.
The data for CaCO3 ribbons are not included since its splitting behaviour is anomalous.
As mentioned previously, with the exception of CaCO3, transverse splitting and also
mixed transverse-longitudinal splitting is always associated with sticking of the spilt
Lub-L
Lub-LLub-L
NS-Lub NS-Lub
Ns-LubL L
L
L
0
0.05
0.1
0.15
0.2
0.25
0.3
0.96-4.27 5.4-10.26 11.88-20.5 22.15-44.97
No
rmal
ised
nu
mb
er o
f o
utc
om
es
Splitting index
Lub-L NS-Lub L
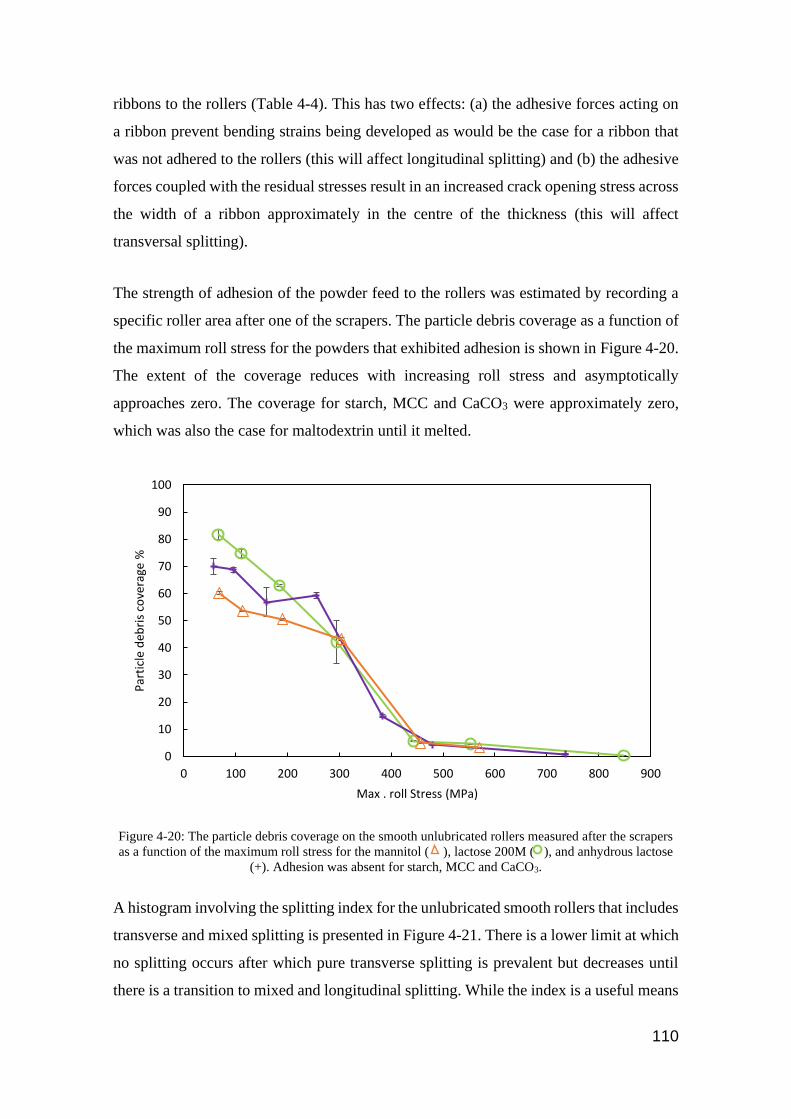
110
ribbons to the rollers (Table 4-4). This has two effects: (a) the adhesive forces acting on
a ribbon prevent bending strains being developed as would be the case for a ribbon that
was not adhered to the rollers (this will affect longitudinal splitting) and (b) the adhesive
forces coupled with the residual stresses result in an increased crack opening stress across
the width of a ribbon approximately in the centre of the thickness (this will affect
transversal splitting).
The strength of adhesion of the powder feed to the rollers was estimated by recording a
specific roller area after one of the scrapers. The particle debris coverage as a function of
the maximum roll stress for the powders that exhibited adhesion is shown in Figure 4-20.
The extent of the coverage reduces with increasing roll stress and asymptotically
approaches zero. The coverage for starch, MCC and CaCO3 were approximately zero,
which was also the case for maltodextrin until it melted.
Figure 4-20: The particle debris coverage on the smooth unlubricated rollers measured after the scrapers
as a function of the maximum roll stress for the mannitol ( ), lactose 200M ( ), and anhydrous lactose
(+). Adhesion was absent for starch, MCC and CaCO3.
A histogram involving the splitting index for the unlubricated smooth rollers that includes
transverse and mixed splitting is presented in Figure 4-21. There is a lower limit at which
no splitting occurs after which pure transverse splitting is prevalent but decreases until
there is a transition to mixed and longitudinal splitting. While the index is a useful means
0
10
20
30
40
50
60
70
80
90
100
0 100 200 300 400 500 600 700 800 900
Par
ticl
e d
ebri
s co
vera
ge %
Max . roll Stress (MPa)
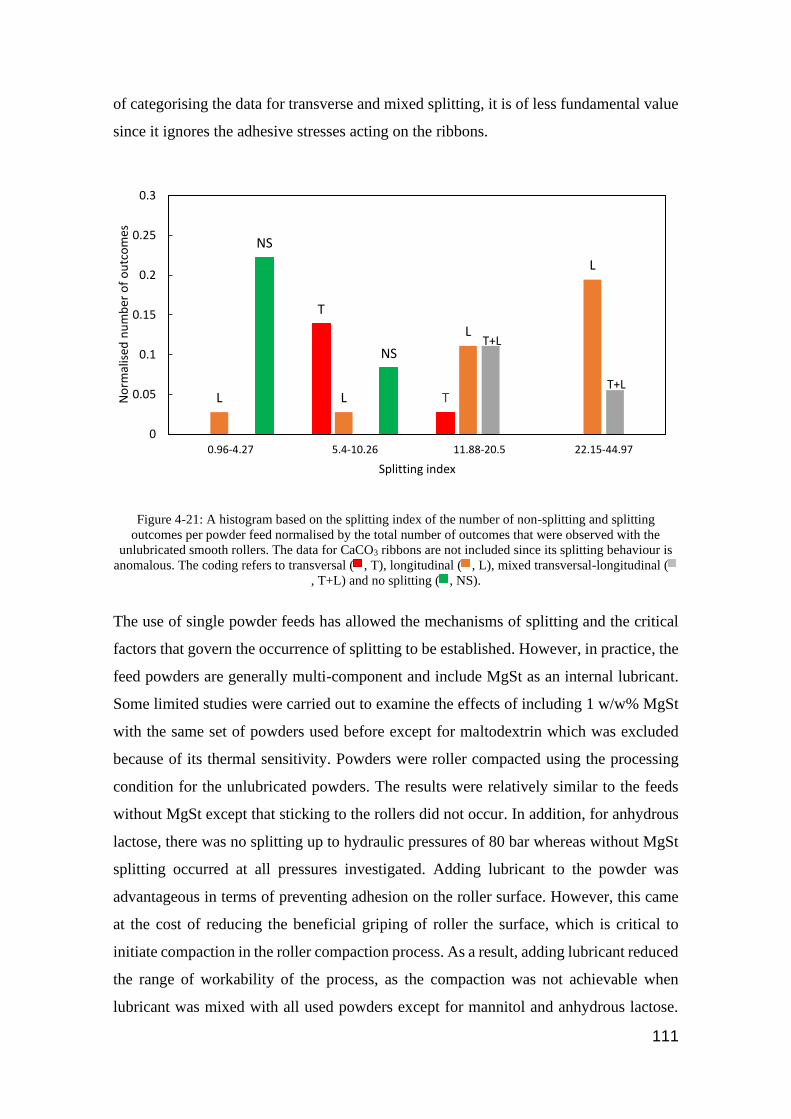
111
of categorising the data for transverse and mixed splitting, it is of less fundamental value
since it ignores the adhesive stresses acting on the ribbons.
Figure 4-21: A histogram based on the splitting index of the number of non-splitting and splitting
outcomes per powder feed normalised by the total number of outcomes that were observed with the
unlubricated smooth rollers. The data for CaCO3 ribbons are not included since its splitting behaviour is
anomalous. The coding refers to transversal ( , T), longitudinal ( , L), mixed transversal-longitudinal (
, T+L) and no splitting ( , NS).
The use of single powder feeds has allowed the mechanisms of splitting and the critical
factors that govern the occurrence of splitting to be established. However, in practice, the
feed powders are generally multi-component and include MgSt as an internal lubricant.
Some limited studies were carried out to examine the effects of including 1 w/w% MgSt
with the same set of powders used before except for maltodextrin which was excluded
because of its thermal sensitivity. Powders were roller compacted using the processing
condition for the unlubricated powders. The results were relatively similar to the feeds
without MgSt except that sticking to the rollers did not occur. In addition, for anhydrous
lactose, there was no splitting up to hydraulic pressures of 80 bar whereas without MgSt
splitting occurred at all pressures investigated. Adding lubricant to the powder was
advantageous in terms of preventing adhesion on the roller surface. However, this came
at the cost of reducing the beneficial griping of roller the surface, which is critical to
initiate compaction in the roller compaction process. As a result, adding lubricant reduced
the range of workability of the process, as the compaction was not achievable when
lubricant was mixed with all used powders except for mannitol and anhydrous lactose.
T
TL L
L
L
T+L
T+L
NS
NS
0
0.05
0.1
0.15
0.2
0.25
0.3
0.96-4.27 5.4-10.26 11.88-20.5 22.15-44.97
No
rmal
ised
nu
mb
er o
f o
utc
om
es
Splitting index

112
Table 4-5 summarises the effect of hydraulic pressure on the splitting behaviour of the
different powder feeds for the lubricated formulations. Shaded areas in red indicate the
occurrence of the splitting. Shaded areas in green correspond to conditions under which
splitting does not occur.
The compression of practical formulations involving mixtures of powders is complex
because it is likely to involve particles of different mechanical properties, shapes and size
distributions. Systematic studies over a wide range of mixtures have not been reported
for either roller compaction or tabletting although there is some evidence that simple
mixture models could be applied [117]. In extending the current work to mixtures,
measurements of the effective compressibility factor and yield strength by confined
uniaxial compaction would be the most appropriate approach to adopt initially.
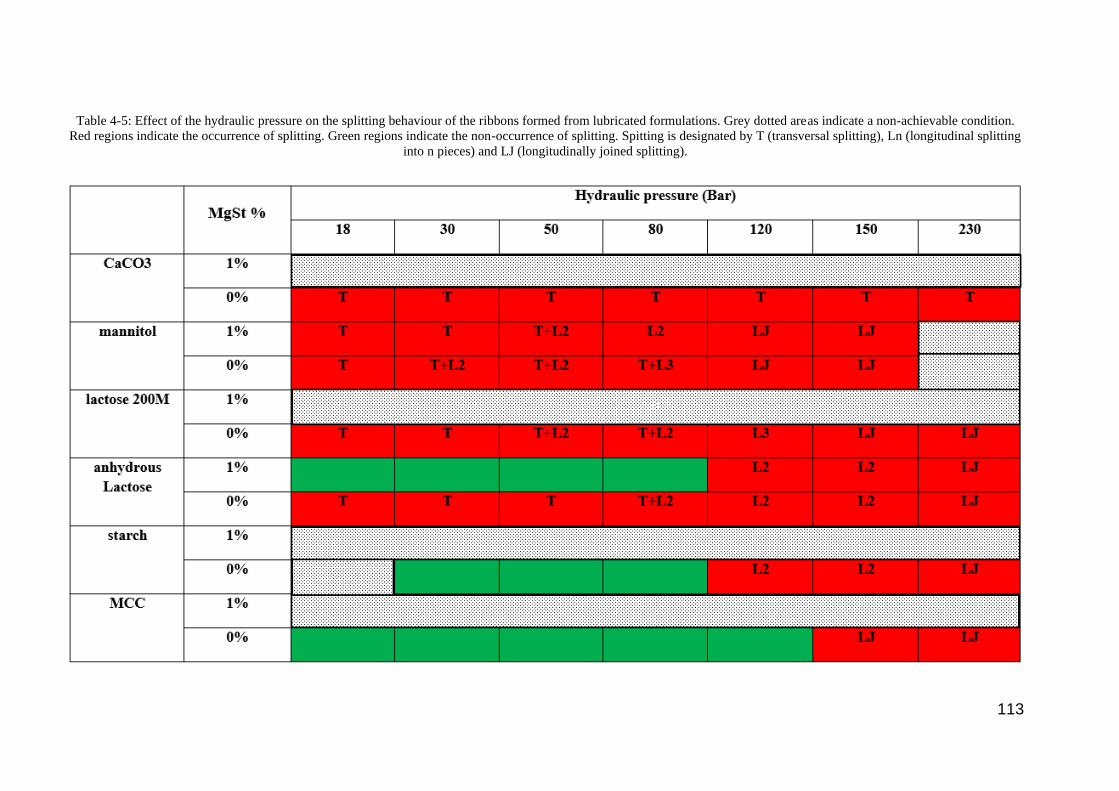
113
Table 4-5: Effect of the hydraulic pressure on the splitting behaviour of the ribbons formed from lubricated formulations. Grey dotted areas indicate a non-achievable condition.
Red regions indicate the occurrence of splitting. Green regions indicate the non-occurrence of splitting. Spitting is designated by T (transversal splitting), Ln (longitudinal splitting
into n pieces) and LJ (longitudinally joined splitting).

114
Conclusions
The phenomenon of ribbon splitting/sticking during roller compaction was investigated
in a comprehensive perspective. Both longitudinal and transversal splitting are
problematic; while transverse splitting is generally associated with adhesion to the rollers
that has a serious detrimental effect on the performance of the process, longitudinal
splitting does not prevent the ribbons from being milled, it is a result of a distribution of
the ribbon density across the width. Consequently, it is not possible to make granules that
all have optimal properties in terms of the mechanical strength and dissolution
characteristics of the tablets. Transverse splitting/sticking happens at low stresses when
there is no enough bonding/deformation across the ribbon thickness that could overcome
the adhesion to roller surfaces. This effect was very clear when the rollers are lubricated
since transversal splitting/sticking was completely eradicated in case of external
lubrication. Increasing the applied stress and/or reducing the yield strength of feed powder
increases the inter-particle cohesive strength and thus reduces the probability of adhesion
to the rollers and hence transverse splitting. However, this increase in the applied stress
increased the probability for longitudinal splitting which is believed to be due to
heterogeneous extents of elastic recovery across the ribbon width. The observed trends of
splitting were rationalised in terms of a splitting index, which is a measure of the stored
elastic energy driving fracture relative to the fracture stress of the ribbons. The elastic
recovery increases as the yield strength increases, which is associated with a reduction in
the tensile strength of the ribbons and higher probability of longitudinal splitting.

115
CHAPTER 5 RIBBON SPLITTING: ROLE OF
POROSITY DISTRIBUTION
Introduction
While the main focus of the previous chapter was on elucidating the mechanisms of
ribbon splitting, the focus in the current chapter is to further investigate the role of
porosity distribution homogeneity in relation to ribbon splitting. The effect of changing
roller surface on ribbon splitting behaviour is examined; knurled rollers were employed
with and without lubrication by manually applying MgSt to the rollers. The compaction
was conducted at the same processing conditions used during smooth rollers experiments
and the behaviour of ribbon splitting and sticking was recorded accordingly.
In comparison to the smooth rollers, the application of knurled rollers reduced the
occurrence of longitudinal splitting and extended the range of transversal splitting which
in some cases occurred without sticking.
The porosity distribution of ribbons was measured by two different approaches namely,
X-ray tomography and Near Infrared Chemical Imaging (NIR-CI). An improved splitting
index has been developed to cope with the effect of ribbon porosity distribution.
Hypothesis
As discussed in the previous chapter, the varying degree of densification across a ribbon
width was due to a non-homogenous stress distribution. This heterogeneity is expected to
reflect in a distribution of strain recovery across a ribbon width and subsequently create
bending stress that affects the trend of ribbon splitting. Figure 5-1 shows a schematic
drawing for the development of bending stress as a result of heterogeneous strain
recovery.
In an attempt to investigate the role of porosity heterogeneity in the occurrence of ribbon
splitting, a pair of knurled rollers, which in comparison with the smooth rollers have a
higher powder-metal contact surface area, were used. Due to the surface engravings,
knurled rollers are expected to grip powder more homogenously in the compaction zone;
this is expected to reflect in a more uniform porosity distribution across the ribbon width.

116
Eventually, upon stress release, the ribbon will experience a more uniform strain recovery
and less bending stress across its width, which will influence the longitudinal splitting
behaviour.
At the same time, increasing the roller surface area by using knurled rollers is expected
to change the extent of powder-metal interaction that can affect the occurrence of
transversal splitting.
Figure 5-1: A schematic drawing of the development of the proposed bending stress across ribbon width.
Methods
All primary powders were analysed for their angle of wall friction with the knurled rollers.
A specially made shear cell disk to measure the angle of wall friction was used during the
test. The values were used with the compressibility factor (K) and the effective angle of
internal friction (δE) that were measured previously, to calculate the maximum stress
applied between the knurled rollers.
Prior to compaction, all powder feeds were conditioned in terms of the humidity as
described in section 3.2.1. Powders are then roller compacted at the same processing
conditions of that used for smooth rollers experiments: fixed roller gap (2 mm) and roller
speed (3 rpm) while activating the feedback-gap controlling system during experiments.
All produced ribbons are analysed for their porosity distribution using X-ray tomography
(samples were taken every ~3.5 mm across ribbon width). NIR-chemical imaging was
also used in an attempt to overcome some of the X-ray tomography limitations. The NIR
needs to be calibrated beforehand; therefore a set of tablets were compressed at a known
series of stresses, the tablets were then scanned using NIR-CI and then an intensity vs

117
porosity relationship was established and used to quantify ribbon porosity distribution
across ribbon width.
Results and discussion
Max stress with knurled rollers
To examine the effect of roller surface on the ribbon splitting behaviour, a pair of knurled
rollers with a surface roughness (Ra ~ 119.4 ± 5.9 µm) were used to produce ribbons
using the same materials and processing conditions used with the smooth rollers
experiments. The roller surface area was measured for a certain section and the whole
roller surface area was calculated accordingly (Figure 5-2).
A B
Figure 5-2: A: The surface area of 25 mm2 roller area measured by a digital microscope (Keyence VHX-
5000). B: Calculated roller surface area of smooth and knurled rollers used in this study.
The maximum stress applied between the two knurled rollers was determined using
Johanson’s theory. To apply this theory, the angle of wall friction (∅w) was measured
using a specially made shear cell coupon which has a similar surface to the knurled rollers
(Table 5-1). These values were implemented in combination with the effective angle of
internal friction (𝛿𝐸) and compressibility factor (𝜅) to calculate the maximum stress
(Equation 2-6 to Equation 2-14).
14000
14500
15000
15500
16000
16500
17000
17500
Smooth rollers Knurled rollers
Ro
ller
surf
ace
area
(m
m2)

118
Table 5-1: Angles of wall friction for all powders used.
Material (∅𝐰) knurled coupon
CaCO3 34.35 ± 0.23
mannitol 31.57 ± 0.12
lactose 200M 34.51 ± 0.43
anhydrous lactose 32.19 ± 0.1
starch 27.79 ± 0.11
maltodextrin 31.1 ± 0.29
MCC 35.1 ± 0.21
To calculate the nip angle for the knurled rollers, (d), the thickness of the ribbon when
the roll gap (s) is zero, was changed from 0 mm for smooth roller to 1 mm for the knurled
roller (Equation 2-10), where each roller has an indentation depth of 0.5 mm. Figure 5-3
shows the maximum stress applied to the material as a function of hydraulic pressure for
smooth rollers (A) and knurled rollers (B).
A) B)
Figure 5-3: Maximum roll stress as a function of the hydraulic pressure for the (A) smooth and (B)
knurled rollers and the following feed powders: CaCO3 ( ), mannitol ( ), lactose 200M ( ), anhydrous
lactose (+), starch (x), maltodextrin ( ) and MCC ( ).
All feed powders exhibit a linear relationship with the gradients for a given feed powder
being greater for the smooth rollers since the nip angles are less (Figure 5-4), i.e. the
contact area with the rollers is smaller at a given roll force as defined by the set hydraulic
0
100
200
300
400
500
600
700
800
900
1000
0 50 100 150 200 250
Max
.ro
ll st
ress
(M
Pa)
Hydraulic pressure (bar)
0
100
200
300
400
500
600
700
800
900
1000
0 50 100 150 200 250
Max
.ro
ll st
ress
(M
Pa)
Hydraulic pressure (bar)

119
pressure. Figure 5-4 shows that using knurled rollers could be more advantageous in terms
of increasing the nip area, which could enhance the mass throughput of the process [28].
Figure 5-4: The calculated nip angles for the different types of powder feed materials, which were
compacted using knurled ( ) and smooth ( ) rollers.
Assessing the roller compaction process using knurled rollers
(comparison with smooth rollers mediated RC)
Strength of the ribbon
Applying the same hydraulic pressure on both types of rollers i.e. knurled or smooth
rollers resulted in stronger ribbons when smooth rollers are used as can be seen in Figure
5-5, this is due to lower nip angle and higher amount of stress applied (Figure 5-3 and
Figure 5-4).
0
5
10
15
20
25
30
CaCO3 mannitol lactose200M
anhydrouslactose
starch maltodextrin MCC
Nip
an
gle
(°)
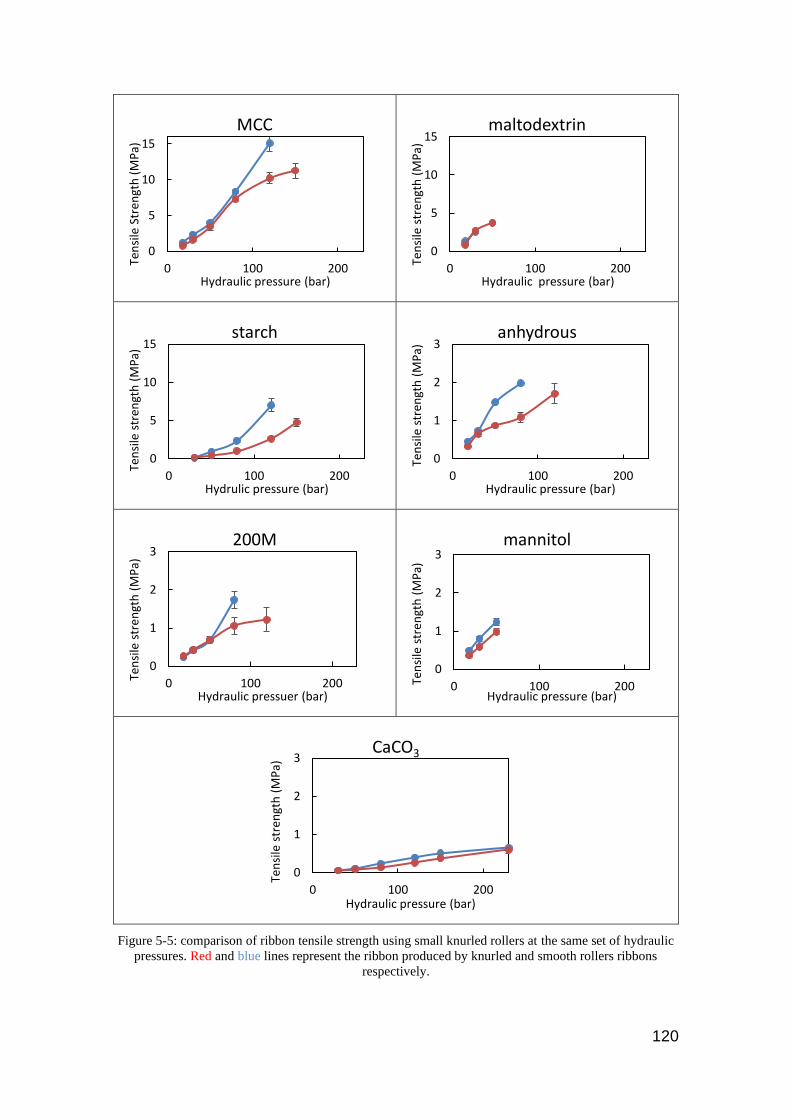
120
Figure 5-5: comparison of ribbon tensile strength using small knurled rollers at the same set of hydraulic
pressures. Red and blue lines represent the ribbon produced by knurled and smooth rollers ribbons
respectively.
0
5
10
15
0 100 200
Ten
sile
Str
engt
h (
MP
a)
Hydraulic pressure (bar)
MCC
0
5
10
15
0 100 200
Ten
sile
str
engt
h (
MP
a)
Hydraulic pressure (bar)
maltodextrin
0
5
10
15
0 100 200
Ten
sile
str
engt
h (
MP
a)
Hydrulic pressure (bar)
starch
0
1
2
3
0 100 200
Ten
sile
str
engt
h (
MP
a)
Hydraulic pressure (bar)
anhydrous
0
1
2
3
0 100 200Ten
sile
str
engt
h (
MP
a)
Hydraulic pressuer (bar)
200M
0
1
2
3
0 100 200Ten
sile
str
engt
h (
MP
a)
Hydraulic pressure (bar)
mannitol
0
1
2
3
0 100 200
Ten
sile
str
engt
h (
MP
a)
Hydraulic pressure (bar)
CaCO3
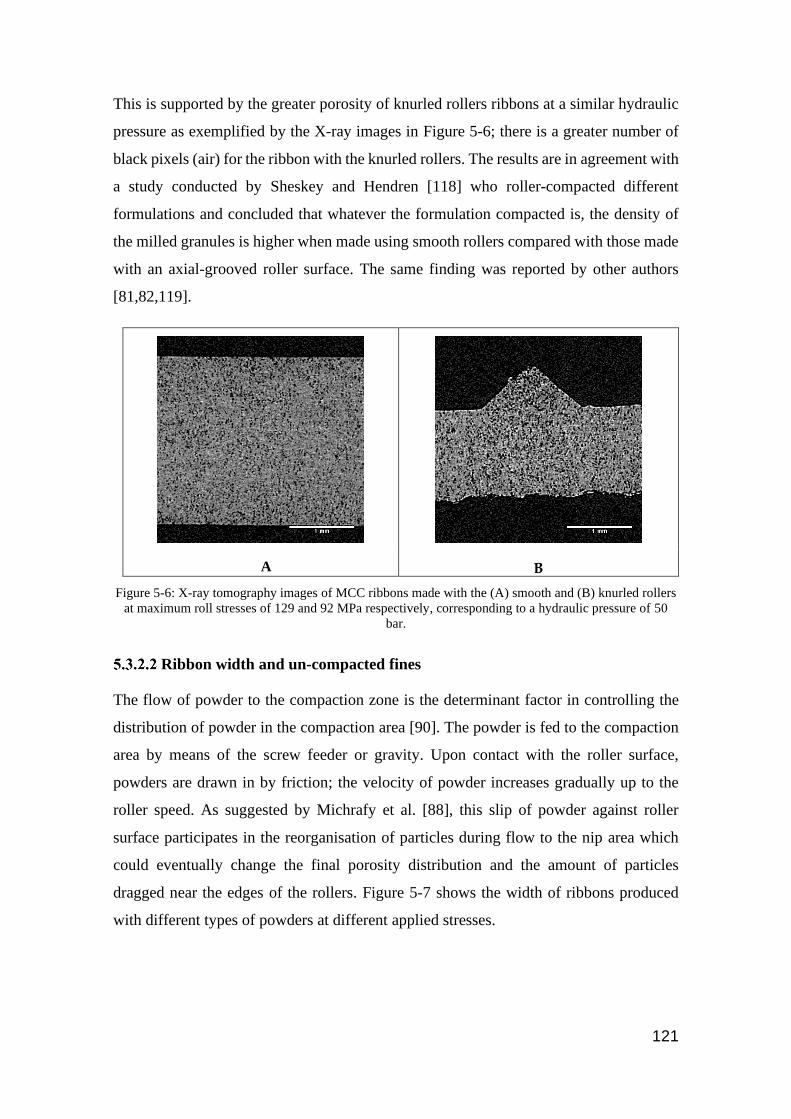
121
This is supported by the greater porosity of knurled rollers ribbons at a similar hydraulic
pressure as exemplified by the X-ray images in Figure 5-6; there is a greater number of
black pixels (air) for the ribbon with the knurled rollers. The results are in agreement with
a study conducted by Sheskey and Hendren [118] who roller-compacted different
formulations and concluded that whatever the formulation compacted is, the density of
the milled granules is higher when made using smooth rollers compared with those made
with an axial-grooved roller surface. The same finding was reported by other authors
[81,82,119].
A B
Figure 5-6: X-ray tomography images of MCC ribbons made with the (A) smooth and (B) knurled rollers
at maximum roll stresses of 129 and 92 MPa respectively, corresponding to a hydraulic pressure of 50
bar.
Ribbon width and un-compacted fines
The flow of powder to the compaction zone is the determinant factor in controlling the
distribution of powder in the compaction area [90]. The powder is fed to the compaction
area by means of the screw feeder or gravity. Upon contact with the roller surface,
powders are drawn in by friction; the velocity of powder increases gradually up to the
roller speed. As suggested by Michrafy et al. [88], this slip of powder against roller
surface participates in the reorganisation of particles during flow to the nip area which
could eventually change the final porosity distribution and the amount of particles
dragged near the edges of the rollers. Figure 5-7 shows the width of ribbons produced
with different types of powders at different applied stresses.

122
Figure 5-7: Effect of roller maximum stress on the ribbon width. Red and blue lines represent the ribbon
produced by knurled and smooth rollers ribbons respectively.
28
33
38
0 250 500 750 1,000
Rib
bo
n w
idth
(m
m)
Max.roll stress (MPa)
CaCO3
28
33
38
0 250 500 750 1,000
Rib
bo
n w
idth
(m
m)
Max.roll stress (MPa)
mannitol
28
33
38
0 250 500 750 1,000
Rib
bo
n w
idth
(m
m)
Max.roll stress (MPa)
200M lactose
28
33
38
0 250 500 750 1,000
Rib
bo
n w
idth
(m
m)
Max.roll stress (MPa)
anhydrous lactose
28
33
38
0 250 500 750 1,000
Rib
bo
n w
idth
(m
m)
Max.roll stress (MPa)
starch
28
33
38
0 250 500 750 1,000
Rib
bo
n w
idth
(m
m)
Max.roll stress (MPa)
maltodextrin
28
33
38
0 250 500 750 1,000
Rib
bo
n w
idth
(m
m)
Max.roll stress (MPa)
MCC
123
It can be seen that increasing the applied stress or using more deformable material
increased the width of the ribbon; this could be due to the higher particle-particle bonding
that could save the integrity of the ribbon near the roller edge.
Despite the lower stress applied by the knurled rollers, which resulted in weaker ribbons
(Figure 5-3 and Figure 5-5), using this pair of rollers has slightly increased the ribbon
width. This could be ascribed to the better gripping ability of the knurled rollers, which
could draw more powder near the roller edge and increase the ribbon width. The increase
in ribbon width is reflected in a lower amount of un-compacted fines produced when
knurled rollers are used (Figure 5-8). The fines usually come from ribbon edges at which
knurled rollers grip higher amounts of powder than smooth rollers, and subsequently
produce wider ribbons and therefore result in lower amounts of fines.

124
Figure 5-8: Effect of roller maximum stress on the amount of un-compacted fines. Red and blue lines
represent the ribbon produced by knurled and smooth rollers ribbons respectively.
0
10
20
30
40
50
0 250 500 750 1,000
Fin
e(%
)
Max.roll stress (MPa)
CaCO3
0
10
20
30
40
50
0 250 500 750 1,000
Fin
e(%
)
Max.roll stress (MPa)
mannitol
0
10
20
30
40
50
0 250 500 750 1,000
Fin
e(%
)
Max.roll stress (MPa)
200M lactose
0
10
20
30
40
50
0 250 500 750 1,000
Fin
e(%
)
Max.roll stress (MPa)
anhydrous lactose
0
10
20
30
40
50
0 250 500 750 1,000
Fin
e(%
)
Max.roll stress (MPa)
starch
0
10
20
30
40
50
0 250 500 750 1,000
Fin
e(%
)
Max.roll stress (MPa)
maltodextrin
0
10
20
30
40
50
0 250 500 750 1,000
Fin
e(%
)
Max.roll stress (MPa)
MCC

125
It is also interesting to report that in comparison with knurled rollers, using smooth rollers
has associated with relatively higher values of feeder screw speed (Figure 5-9); smooth
rollers have lower levels of wall friction (Table 5-1 and Table 4-3), subsequently higher
screw speeds were required to grab the powder to the nip area and maintain the same
roller gap to that used when knurled rollers were implemented. The difference in screw
speed values between the two rollers types was less noticeable in case of CaCO3 this could
be due to the relatively higher wall friction of this powder for both smooth and knurled
rollers (Table 5-1 and Table 4-3). The results are in agreement with a recent study
conducted by Csordas et.al [82] using spray-dried mannitol and MCC; the authors
mentioned that using of smooth rollers have always been accompanied with higher feeder
screw speeds to that of the knurled rollers when both are implemented at the same
processing conditions.

126
Figure 5-9: Effect of hydraulic pressure on the feeder screw speed at constant gap distance (2 mm) for the
different studied powder materials. Red and blue lines represent the ribbon produced by knurled and
smooth rollers ribbons respectively.
18
38
58
78
0 100 200
Scre
w s
pee
d (
rpm
)
Hydraulic pressure (bar)
CaCO3
18
38
58
78
0 100 200
Scre
w s
pee
d (
rpm
)
Hydraulic pressure (bar)
mannitol
18
38
58
78
0 100 200
Scre
w s
pee
d (
rpm
)
Hydraulic pressure (bar)
200M
18
38
58
78
0 100 200
Scre
w s
pee
d (
rpm
)
Hydraulic pressure (bar)
anhydrous lactose
18
38
58
78
0 100 200
Scre
w s
pee
d (
rpm
)
Hydraulic pressure (bar)
starch
18
38
58
78
0 100 200
Scre
w s
pee
d (
rpm
)
Hydraulic pressure (bar)
maltodextrin
18
38
58
78
0 100 200
Scre
w s
pee
d (
rpm
)
Hydraulic pressure (bar)
MCC
127
Ribbon splitting/sticking observations
Table 5-2 shows that the use of knurled rollers produced a similar transversal splitting
trend to that of the smooth rollers except that the more plastically deformable powder
exhibited such splitting up to greater maximum roll stresses (see Table 4-4 for smooth
rollers splitting behaviour). Unlike smooth rollers, where ribbon transversal splitting is
always associated with roller sticking, in some cases of knurled rollers, transverse
splitting occurred without sticking to the rollers, i.e., ribbons made with starch and MCC.
Nevertheless, roller sticking/transversal splitting in both rollers was always prevented by
external lubrication.
Similar to the smooth rollers, avoiding transversal splitting/roller sticking by increasing
the applied stress significantly reduced the amount of un-compacted fines (Figure 5-8).
In terms of longitudinal splitting, in agreement to the trend noticed with smooth rollers,
ribbons made with knurled rollers started to split longitudinally at stress proportional to
its feed powder yield stress (Table 5-2). For example, mannitol with relatively high yield
stress started to split longitudinally at lower maximum roller stress compared to lactose
200M, which started to split at relatively higher stress, yet the use of knurled rollers
improved the compaction performance in terms of reducing the occurrence of
longitudinal splitting.

128
Table 5-2: Effect of the maximum roll stress on the splitting and sticking behaviour of the ribbons formed from unlubricated knurled rollers. Grey dotted areas indicate a non-
achievable condition. Red regions indicate the occurrence of splitting/sticking. Green regions indicate the non-occurrence of splitting/sticking. Spitting is designated by T
(transversal splitting), Ln (longitudinal splitting into n pieces) and LJ (longitudinally joined splitting).

129
For a better understanding of the underlying mechanisms of splitting, the observed trends
for the knurled rollers were rationalised using the splitting index proposed in section
4.4.8. CaCO3 was excluded due to its anomalous splitting behaviour (see section 4.4.8).
Ribbon tensile strength and elastic recovery have been determined for all knurled rollers
ribbons; (Equation 4-4) and used to calculate the tensile strength of the ribbons from the
knurled rollers ribbon tensile strength. The elastic recovery of each material in Figure 4-8
was fitted to a linear relationship with the maximum compaction stress; the relationship
was then used to determine the elastic recovery at the stresses used to make the knurled
rollers ribbons
A histogram involving the splitting index for the unlubricated and lubricated smooth and
knurled rollers that includes longitudinal, transversal, and mixed splitting is presented in
Figure 5-10. While applying lubricant on the roller surface has eradicated any
sticking/transversal splitting.
Figure 5-10: A histogram based on the splitting index of the number of non-splitting and splitting
outcomes per powder feed normalised by the total number of outcomes that were observed with the
smooth (A) and knurled rollers (B). The data for CaCO3 ribbons are not included since its splitting
behaviour is anomalous. The coding refers to transversal (T), longitudinal (L), mixed transversal-
longitudinal (T+L) and no splitting (NS). Solid and patterned filled bars refer to unlubricated and
lubricated cases respectively.
NS-Lub NS-Lub
NS-LubL-Lub L-Lub
L-Lub
L-Lub
L L
L
L
T
T
T+L
T+L
0
0.05
0.1
0.15
0.2
0.25
0.3
1.0-4.3 5.4-10.3 11.9-20.5 22.2-45.0
No
rmal
ised
nu
mb
er o
f o
utc
om
es
Smooth rollers
NS-Lub Lub-L L T T+L
𝐼S 1
A
NS-Lub NS-Lub NS-Lub
NS-Lub
L-Lub
L-Lub
LT
T
T
T
T+L
T+L
0
0.05
0.1
0.15
0.2
0.25
0.3
0.5-2.6 3.2-12.5 13.8-24.6 24.9-62.1
No
rmal
ised
nu
mb
er o
f o
utc
om
es
Knurled rollers
NS-Lub L-Lub L T T+L
𝐼S 1
B

130
Similar to the smooth rollers, knurled rollers produced a trend of decreasing no splitting
and increasing longitudinal splitting as the values of this parameter increases (Figure 5-10
(A-B)). There was a limit at which the occurrence of transverse splitting decreased and
that for longitudinal splitting increased with increasing values of the index, which was
accompanied by mixed transverse-longitudinal splitting. Transverse splitting was always
associated with sticking to the rollers and was prevented by external lubrication. The main
difference with the knurled rollers was that in some cases transverse splitting occurred
without sticking to the rollers. Figure 5-10 shows that changing to the knurled roller
surface increased the transversal splitting and reduced the amount of longitudinal
splitting.
The proposed index was poor in terms of predicting the starting value of longitudinal
splitting occurrence. In the case of smooth rollers, longitudinal splitting started at a
splitting index value between 0.9-4.27 while for knurled rollers, splitting took place
between 13.8-24.5. This is believed to be due to the index not accounting for the bending
stress. In an attempt to improve this index, it was modified multiplying the splitting index
by the relative solid fraction difference. The relative solid fraction difference between
ribbon centre and edges is related to the recovery strain difference across the ribbon width
which, could develop into bending stress across ribbon thickness. Measurement of
ribbons relative solid fraction difference and the application of the modified splitting
index (𝐼𝑆′) is discussed in the following sections.
Ribbon heterogeneity across ribbon width
Ribbons made with smooth and knurled rollers were analysed for their porosity
distribution using different techniques. The measured porosity is used as an explanation
of ribbon splitting phenomenon. The heterogeneity could be investigated using different
approaches each have its advantages and disadvantages.
X-ray tomography
All ribbons except for CaCO3 which was excluded due to its anomalous splitting
behaviour was scanned using X-rays every ~3.5 mm across the width (Figure 5-11). In
all cases, the porosity of the ribbons decreased when higher stress was applied and the
lowest porosity was concentrated at the ribbon through-the-width ribbon centre. This
variation in porosity distribution indicates that the applied stress was always higher in the
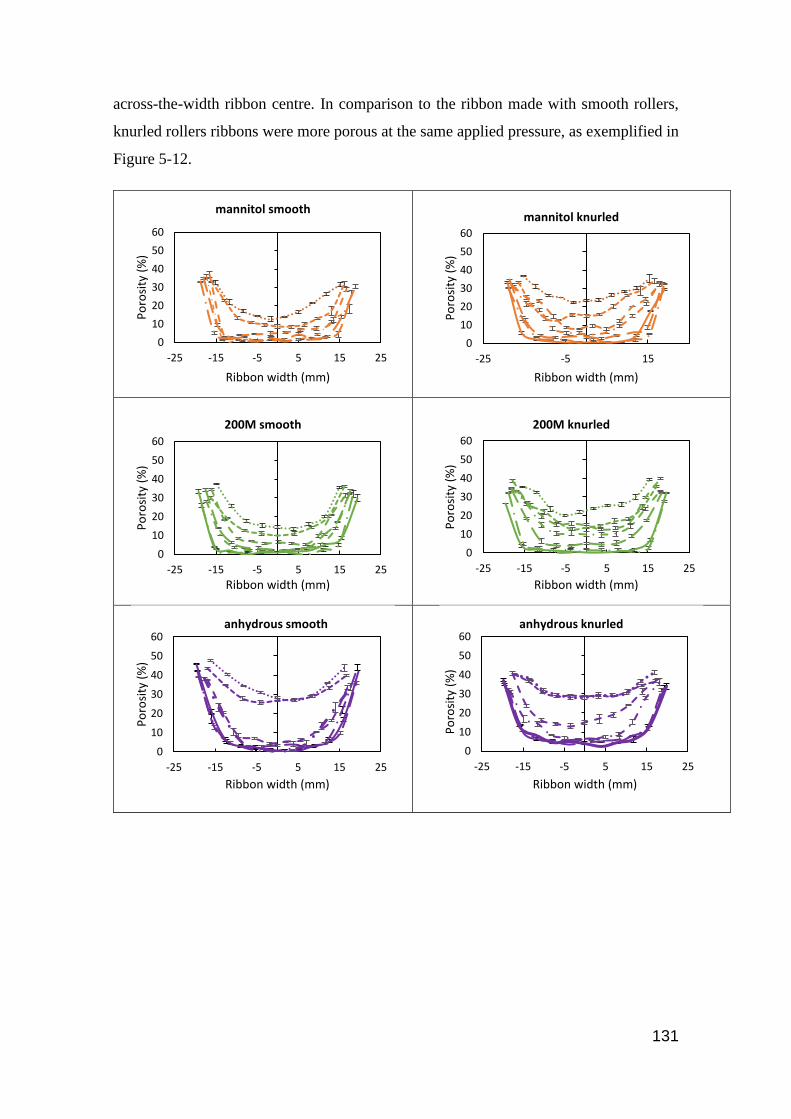
131
across-the-width ribbon centre. In comparison to the ribbon made with smooth rollers,
knurled rollers ribbons were more porous at the same applied pressure, as exemplified in
Figure 5-12.
0
10
20
30
40
50
60
-25 -15 -5 5 15 25
Po
rosi
ty (
%)
Ribbon width (mm)
mannitol smooth
0
10
20
30
40
50
60
-25 -5 15
Po
rosi
ty (
%)
Ribbon width (mm)
mannitol knurled
0
10
20
30
40
50
60
-25 -15 -5 5 15 25
Po
rosi
ty (
%)
Ribbon width (mm)
200M smooth
0
10
20
30
40
50
60
-25 -15 -5 5 15 25
Po
rosi
ty (
%)
Ribbon width (mm)
200M knurled
0
10
20
30
40
50
60
-25 -15 -5 5 15 25
Po
rosi
ty (
%)
Ribbon width (mm)
anhydrous smooth
0
10
20
30
40
50
60
-25 -15 -5 5 15 25
Po
rosi
ty (
%)
Ribbon width (mm)
anhydrous knurled
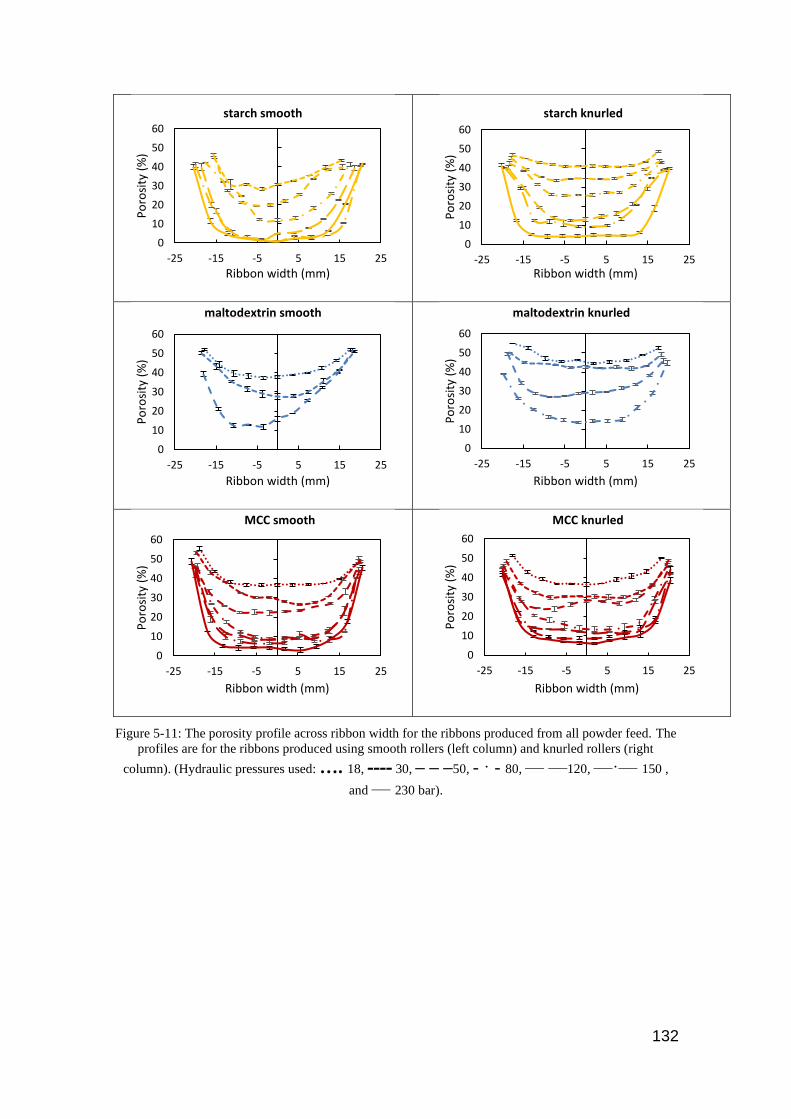
132
Figure 5-11: The porosity profile across ribbon width for the ribbons produced from all powder feed. The
profiles are for the ribbons produced using smooth rollers (left column) and knurled rollers (right
column). (Hydraulic pressures used: …. 18, ---- 30, ‒ ‒ ‒50, - · - 80, — —120, —·— 150 ,
and — 230 bar).
0
10
20
30
40
50
60
-25 -15 -5 5 15 25
Po
rosi
ty (
%)
Ribbon width (mm)
MCC smooth
0
10
20
30
40
50
60
-25 -15 -5 5 15 25
Po
rosi
ty (
%)
Ribbon width (mm)
MCC knurled
0
10
20
30
40
50
60
-25 -15 -5 5 15 25
Po
rosi
ty (
%)
Ribbon width (mm)
maltodextrin knurled
0
10
20
30
40
50
60
-25 -15 -5 5 15 25
Po
rosi
ty (
%)
Ribbon width (mm)
maltodextrin smooth
0
10
20
30
40
50
60
-25 -15 -5 5 15 25
Po
rosi
ty (
%)
Ribbon width (mm)
starch knurled
0
10
20
30
40
50
60
-25 -15 -5 5 15 25
Po
rosi
ty (
%)
Ribbon width (mm)
starch smooth

133
Figure 5-12: Ribbon porosity profiles for ribbons produced at 30 bar using smooth and knurled rollers.
The porosity variation across a ribbon width was quantified using the relative solid
fraction difference,∆𝛽, which is defined by the following relationship:
∆𝛽 = (𝛽C − 𝛽E)/𝛽C Equation 5-1
where 𝛽C and 𝛽E are the solid fractions at the centre and edges of the ribbons.
0
10
20
30
40
50
60
-25 -15 -5 5 15 25
Po
rosi
ty (
%)
Ribbon width (mm)
mannitol smooth Vs knurled
knurled
smooth0
10
20
30
40
50
60
-25 -15 -5 5 15 25
Po
rosi
ty (
%)
Ribbon width (mm)
200M smooth Vs knurled
knurled
smooth
0
10
20
30
40
50
60
-25 -15 -5 5 15 25
Po
rosi
ty (
%)
Ribbon width (mm)
anhydrous smooth Vs knurled
knurled
smooth
0
10
20
30
40
50
60
-25 -15 -5 5 15 25
Po
rosi
ty (
%)
Ribbon width (mm)
starch smooth Vs knurled
smooth
knurled
0
10
20
30
40
50
60
-25 -15 -5 5 15 25
Po
rosi
ty (
%)
Ribbon width (mm)
maltodextrin smooth Vs knurled
smooth
knurled
0
10
20
30
40
50
60
-25 -15 -5 5 15 25
Po
rosi
ty (
%)
Ribbon width (mm)
MCC smooth Vs knurled
knurled
smooth

134
The relative difference in the solid fraction across the width of the ribbons as a function
of the maximum roll stress is shown in Figure 5-13 for the smooth and knurled rollers.
Figure 5-13 shows that the relative differences across the widths of the knurled rollers
ribbons were less than for the corresponding ribbons formed with the smooth rollers.
Figure 5-13: The relative solid fraction difference across the ribbons (Equation 5-1) as a function of the
maximum roll stress for the ribbons formed with the unlubricated (solid line) smooth and (dashed line)
knurled rollers.
Measuring ribbon porosity with X-ray tomography was advantageous in terms of
providing high-resolution porosity determination of the internal matrix (up to 16 µm).
This is in addition to various advantages of the XµCT technique compared with other
porosity measuring techniques [120]. However, there is a trade-off between the sample
size, resolution, and scanning time. In this case, the sample size was about 1.3 mm which
0.1
0.2
0.3
0.4
0.5
0 500 1000
Rel
ativ
e so
lid f
ract
ion
d
iffe
ren
ce
Max. roll stress (MPa)
mannitol
0.1
0.2
0.3
0.4
0.5
0 200 400 600 800 1000
Rel
ativ
e so
lid f
ract
ion
d
iffe
ren
ce
Max. roll stress (MPa)
200M
0.1
0.2
0.3
0.4
0.5
0 500 1000
Rel
ativ
e so
lid f
ract
ion
d
iffe
ren
ce
Max. roll stress (MPa)
anhydrous lactose
0.1
0.2
0.3
0.4
0.5
0 500 1000
Rel
ativ
e so
lid f
ract
ion
d
iffe
ren
ce
Max. roll stress (MPa)
starch
0.1
0.2
0.3
0.4
0.5
0 500 1000
Rel
ativ
e so
lid f
ract
ion
d
iffe
ren
ce
Max. roll stress (MPa)
maltodextrin
0.1
0.2
0.3
0.4
0.5
0 200 400 600 800 1000
Rel
ativ
e so
lid f
ract
ion
d
iffe
ren
ce
Max. roll stress (MPa)
MCC

135
at a resolution of 6 µm requires approximately 75 minutes for scanning and 15 minutes
for image reconstruction which makes XµCT extremely time-consuming. Thus, a
scanning time of about 18 hours is needed to scan a 40 mm width ribbon by taking a scan
every ~3.5 mm. Moreover, sample preparation was another artefact; the sample should fit
into the sample holder tube and the sample should be strong enough to survive during the
cutting stage. In an attempt to overcome these challenges, a faster technique with pixel
grade information was used as described in the following section.
Near-Infrared Chemical Imaging (NIR-CI)
Theoretical background
In principle, NIR-CI technology combines conventional digital imaging with NIR
spectroscopy to provide both spatial and spectral information. Unlike conventional NIR
probes, which average the spectral information for a certain sample area in one spectrum,
NIR-CI technology collects and presents the spectral information while preserving their
spatial dimension so that each pixel of the captured image contains the NIR spectrum of
this specific location. This can be used as a fingerprint to qualitatively and quantitatively
characterise every pixel in that image [109,121,122].
The captured images are usually termed in literature as hypercubes. These images are
constructed in two main ways, namely pushbroom (the method used in the current work)
and staring approaches. The former involves the spectral information of a group of
adjacent points in a line; as the sample is moved using a conveyor belt system and the
line measurement is repeated so it can cover the whole sample. For the staring approach,
the field of view is fixed and a stack of images are taken at one wavelength after another.
The non-destructive and fast nature features of this technology mean that it is very
attractive to be used for a wide range of applications such as content uniformity [123,124],
porosity in tablets and roller compaction ribbons [125,126], and counterfeit analysis
[127,128].
Technical challenges
As previously discussed, this technology has been used for a wide range of applications,
however, NIR-CI still suffers from certain challenges that must be taken into
consideration prior to any measurement.
136
1- Sample preparation: this involved correct positioning of the sample in the field of view
of the lens. Additionally, due to the limited penetrating nature of the NIR radiation,
sample cross-sectioning is necessary when core information is needed.
2- Sample illumination: illumination should be intense enough so that it can reflect an
adequate detectible signal to the detector. However, the intensity should not be too high
as it could damage the sample. Moreover, the illumination should be relatively uniform
across the sampling area, otherwise, the intensity of the reflected light could vary
significantly [109]. This variation could be problematic as most of the data processing
systems do not take illumination uniformity into account and inherently assume
equivalence between the quality of the collected spectra.
3- Sample surface topography: an irregular surface geometry of the sample could produce
similar effect to that of the non-uniform illumination; surface roughness and/or curvature
could change the relative path length between the sample surface and the detector, which
consequently affects the quality of the reflected signal [122,129]. Wang and Paliwal [129]
reported such that light does not reflect back uniformly when scanning a curved surface
with NIR-CI; subsequently, no meaningful conclusion can be made. For this reason, a
processing algorithm was developed to correct the effect of surface curvature on the
quality of the reflected spectra. It successfully reduced spectral variation caused by the
inhomogeneous surface geometry. Surface irregularity becomes problematic if the
fluctuations of a scanned surface geometry exceed the depth of field of the lens (DOF).
DOF is defined as the volume within which the reflected light is sharply focused on the
detector [130]. Figure 5-14 shows a schematic example of reflection from two points
localised within and out of DOF range. When the reflection takes place from a point
within the DOF, the reflected light is sharply focused on the detector; otherwise, the
reflected light diverges after the lens and localised at a certain detector distance.
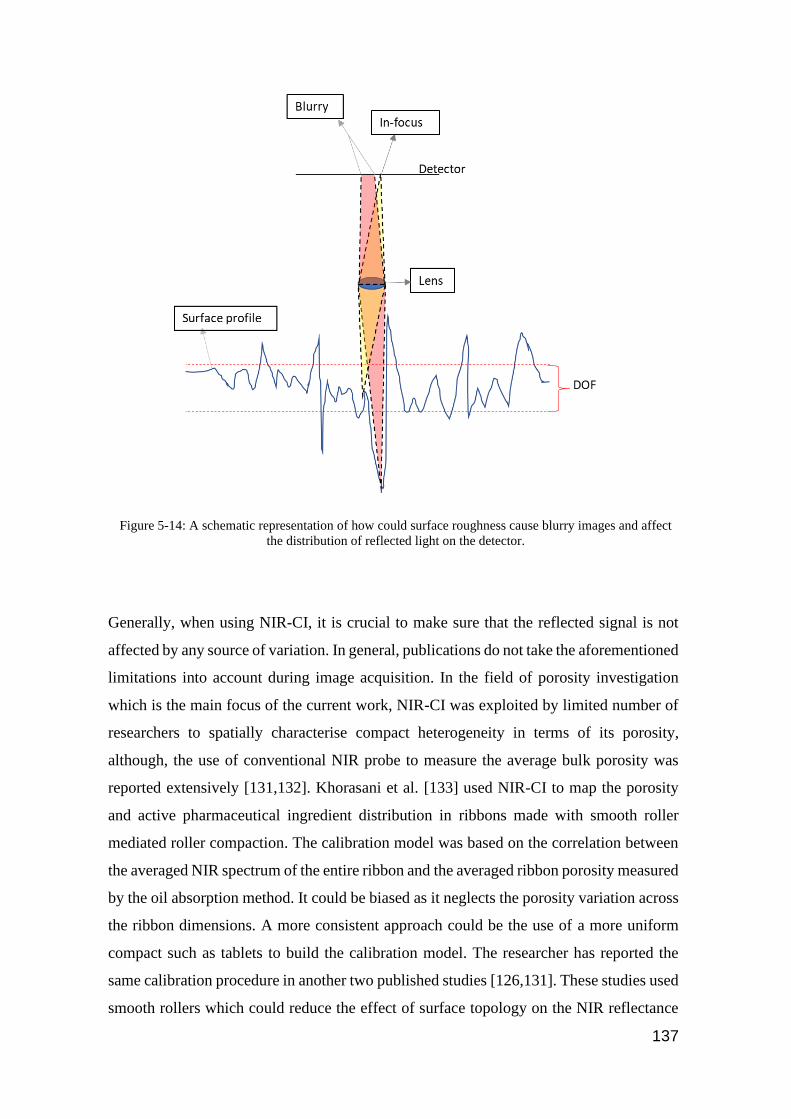
137
Figure 5-14: A schematic representation of how could surface roughness cause blurry images and affect
the distribution of reflected light on the detector.
Generally, when using NIR-CI, it is crucial to make sure that the reflected signal is not
affected by any source of variation. In general, publications do not take the aforementioned
limitations into account during image acquisition. In the field of porosity investigation
which is the main focus of the current work, NIR-CI was exploited by limited number of
researchers to spatially characterise compact heterogeneity in terms of its porosity,
although, the use of conventional NIR probe to measure the average bulk porosity was
reported extensively [131,132]. Khorasani et al. [133] used NIR-CI to map the porosity
and active pharmaceutical ingredient distribution in ribbons made with smooth roller
mediated roller compaction. The calibration model was based on the correlation between
the averaged NIR spectrum of the entire ribbon and the averaged ribbon porosity measured
by the oil absorption method. It could be biased as it neglects the porosity variation across
the ribbon dimensions. A more consistent approach could be the use of a more uniform
compact such as tablets to build the calibration model. The researcher has reported the
same calibration procedure in another two published studies [126,131]. These studies used
smooth rollers which could reduce the effect of surface topology on the NIR reflectance
138
however, no information was mentioned about the surface roughness or lens depth of field.
Another trial using NIR-CI for ribbon porosity mapping was conducted by Lim et al. [119]
for assessing the variation of porosity of roller-compacted MCC ribbons. It successfully
predicted ribbon porosity with a correlation of 0.9258 where regions of higher porosity
showed higher intensity of reflected NIR light. Although knurled rollers where used
(indentation depth was not mentioned), the study did not report any information about the
DOF of the lens as this could affect the intensity of the reflected light. Moreover, In a
similar study conducted by Khorasani et al. [133], the average pycnometer ribbon porosity
was plotted against its mean NIR absorbance. Souihi et al. [134] used NIR-CI for the same
purpose and mentioned that despite the use of knurled rollers, the study successfully
predicted porosity at the bottom and top of the knurling areas. This could be related to the
high DOF of the lens (not mentioned). Based on the discussed limitations and the existing
literature, there is a need to assess the role of surface irregularity on the predictability of
NIR-CI for the porosity of the ribbon. For this reason, the surface roughness of the scanned
surfaces should be measured and compared with the lens DOF in order to evaluate the
quality of reflected light and subsequently the appropriateness for predicting the density.
Determining lens depth of field (DOF)
The lens depth of field was determined by focusing on a plastic micro-scaled ruler, the
ruler was then moved gradually (50 µm in each step) toward the detector by placing a
number of plates (~50 µm thickness) under the ruler in a stepwise manner. Figure 5-15
shows how the image becomes blurry when the distance to the detector (focus distance)
was changed by ~ 350 to 400 µm which was taken as the lens depth of field.
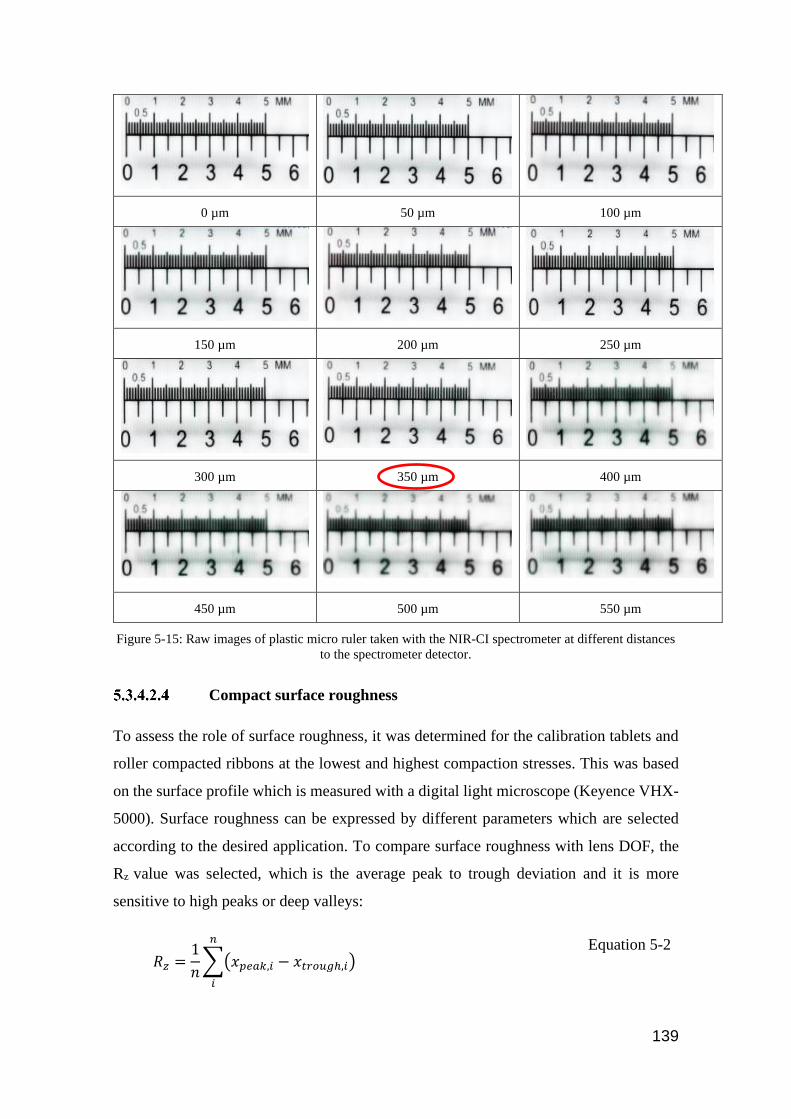
139
0 µm 50 µm 100 µm
150 µm 200 µm 250 µm
300 µm 350 µm 400 µm
450 µm 500 µm 550 µm
Figure 5-15: Raw images of plastic micro ruler taken with the NIR-CI spectrometer at different distances
to the spectrometer detector.
Compact surface roughness
To assess the role of surface roughness, it was determined for the calibration tablets and
roller compacted ribbons at the lowest and highest compaction stresses. This was based
on the surface profile which is measured with a digital light microscope (Keyence VHX-
5000). Surface roughness can be expressed by different parameters which are selected
according to the desired application. To compare surface roughness with lens DOF, the
Rz value was selected, which is the average peak to trough deviation and it is more
sensitive to high peaks or deep valleys:
𝑅𝑧 =1
𝑛∑(𝑥𝑝𝑒𝑎𝑘,𝑖 − 𝑥𝑡𝑟𝑜𝑢𝑔ℎ,𝑖)
𝑛
𝑖
Equation 5-2

140
where Rz is the surface roughness parameter for the mean distance between the peaks and
troughs, i is the ith segment, n is the number of segments, xpeak and xtrough are the deviation
for the peak and the trough in the segment considered, respectively.
Example of mannitol tablets surface profiles at the highest and lowest compaction stresses
are shown in Figure 5-16. They were evenly divided into five segments according to the
length; subsequently the largest and lowest values of each of the 5 segments were
determined and applied in Equation 5-2 to compute Rz value.
Figure 5-16: Surface profile of mannitol tablet compacted at a stress equivalent to 18 bar (lowest) and 230
bar (Highest) hydraulic pressure in the roller compactor. The profile is divided into five segments to
calculate Rz value.
The roughness (Rz) values of all tablets produced at the highest and lowest compaction
stresses are shown in Figure 5-17-A. These tablets were later used to calibrate the NIR-
CI.
4120
4130
4140
4150
4160
0 700 1400 2100 2800 3500
Hei
ght
(µm
)
Length (µm)
Lowest stress
3470
3480
3490
3500
3510
0 700 1400 2100 2800 3500
Hei
ght
(µm
)
Length (µm)
Highest stress
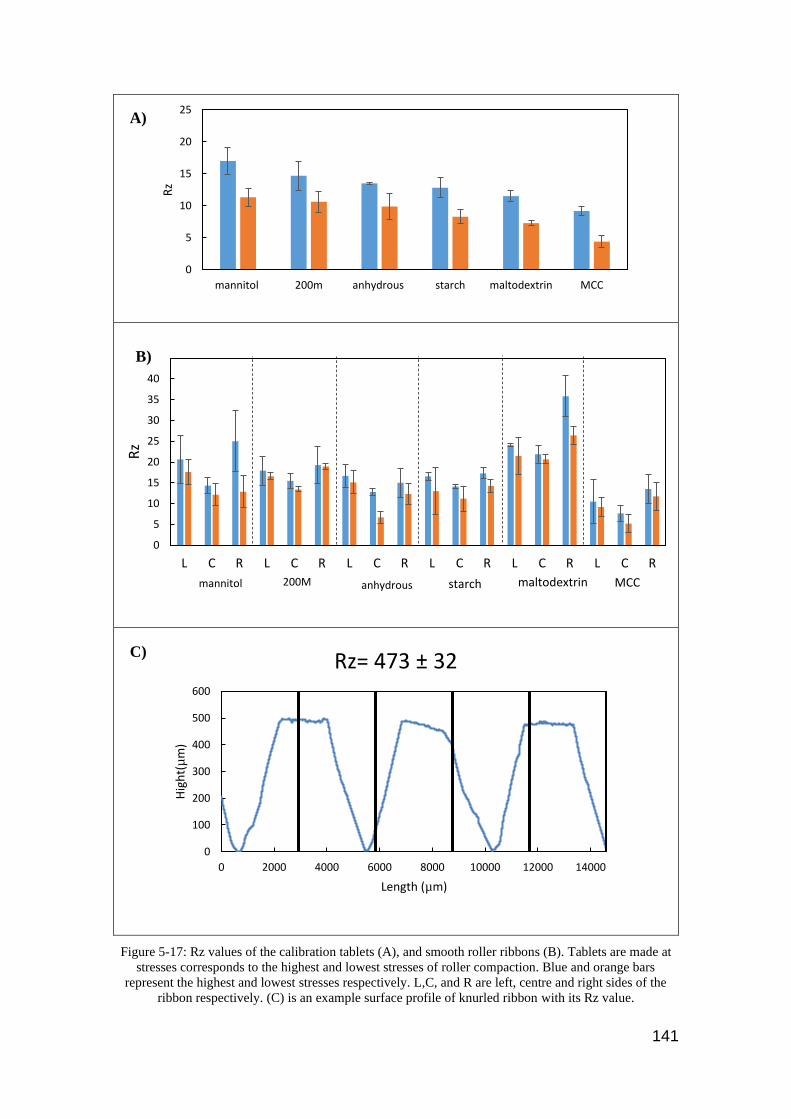
141
Figure 5-17: Rz values of the calibration tablets (A), and smooth roller ribbons (B). Tablets are made at
stresses corresponds to the highest and lowest stresses of roller compaction. Blue and orange bars
represent the highest and lowest stresses respectively. L,C, and R are left, centre and right sides of the
ribbon respectively. (C) is an example surface profile of knurled ribbon with its Rz value.
0
5
10
15
20
25
mannitol 200m anhydrous starch maltodextrin MCC
Rz
0
5
10
15
20
25
30
35
40
45
L C R L C R L C R L C R L C R L C R
Rz
200M anhydrous starch maltodextrin MCC mannitol
B)
0
100
200
300
400
500
600
0 2000 4000 6000 8000 10000 12000 14000
Hig
ht(
µm
)
Length (µm)
Rz= 473 ± 32C)
A)
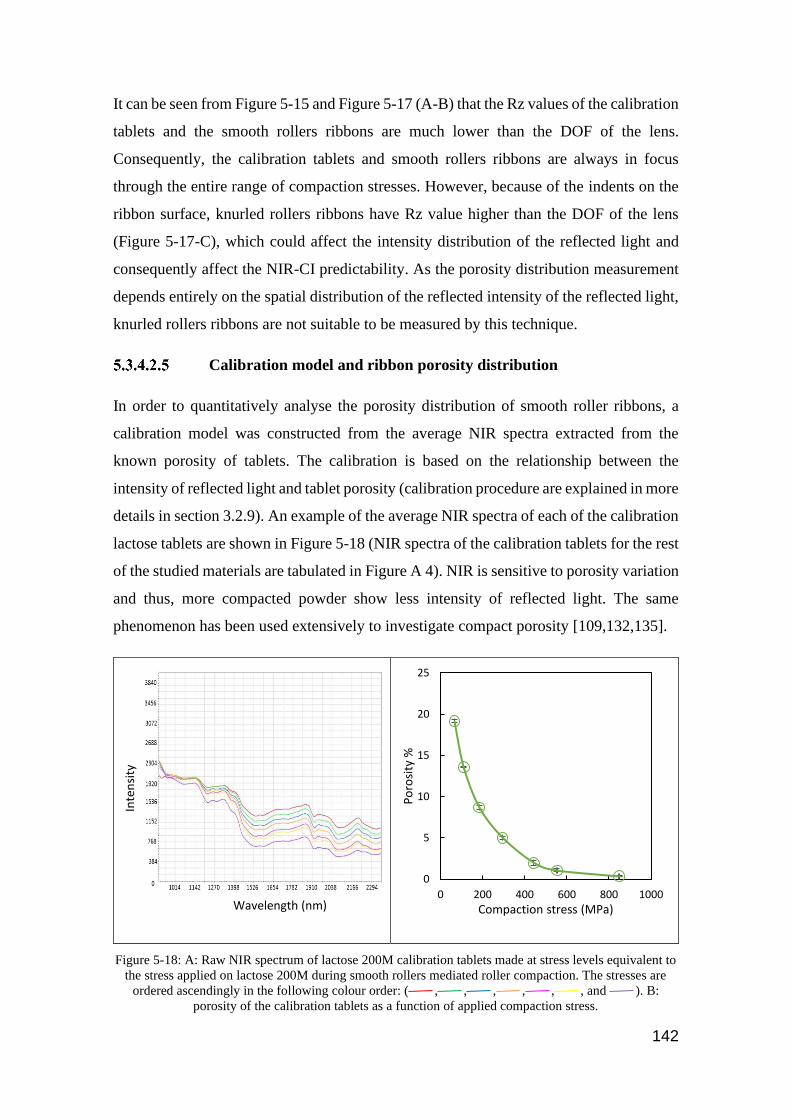
142
It can be seen from Figure 5-15 and Figure 5-17 (A-B) that the Rz values of the calibration
tablets and the smooth rollers ribbons are much lower than the DOF of the lens.
Consequently, the calibration tablets and smooth rollers ribbons are always in focus
through the entire range of compaction stresses. However, because of the indents on the
ribbon surface, knurled rollers ribbons have Rz value higher than the DOF of the lens
(Figure 5-17-C), which could affect the intensity distribution of the reflected light and
consequently affect the NIR-CI predictability. As the porosity distribution measurement
depends entirely on the spatial distribution of the reflected intensity of the reflected light,
knurled rollers ribbons are not suitable to be measured by this technique.
Calibration model and ribbon porosity distribution
In order to quantitatively analyse the porosity distribution of smooth roller ribbons, a
calibration model was constructed from the average NIR spectra extracted from the
known porosity of tablets. The calibration is based on the relationship between the
intensity of reflected light and tablet porosity (calibration procedure are explained in more
details in section 3.2.9). An example of the average NIR spectra of each of the calibration
lactose tablets are shown in Figure 5-18 (NIR spectra of the calibration tablets for the rest
of the studied materials are tabulated in Figure A 4). NIR is sensitive to porosity variation
and thus, more compacted powder show less intensity of reflected light. The same
phenomenon has been used extensively to investigate compact porosity [109,132,135].
Figure 5-18: A: Raw NIR spectrum of lactose 200M calibration tablets made at stress levels equivalent to
the stress applied on lactose 200M during smooth rollers mediated roller compaction. The stresses are
ordered ascendingly in the following colour order: ( , , , , , , and ). B:
porosity of the calibration tablets as a function of applied compaction stress.
0
5
10
15
20
25
0 200 400 600 800 1000
Po
rosi
ty %
Compaction stress (MPa)
Inte
nsi
ty
Wavelength (nm)
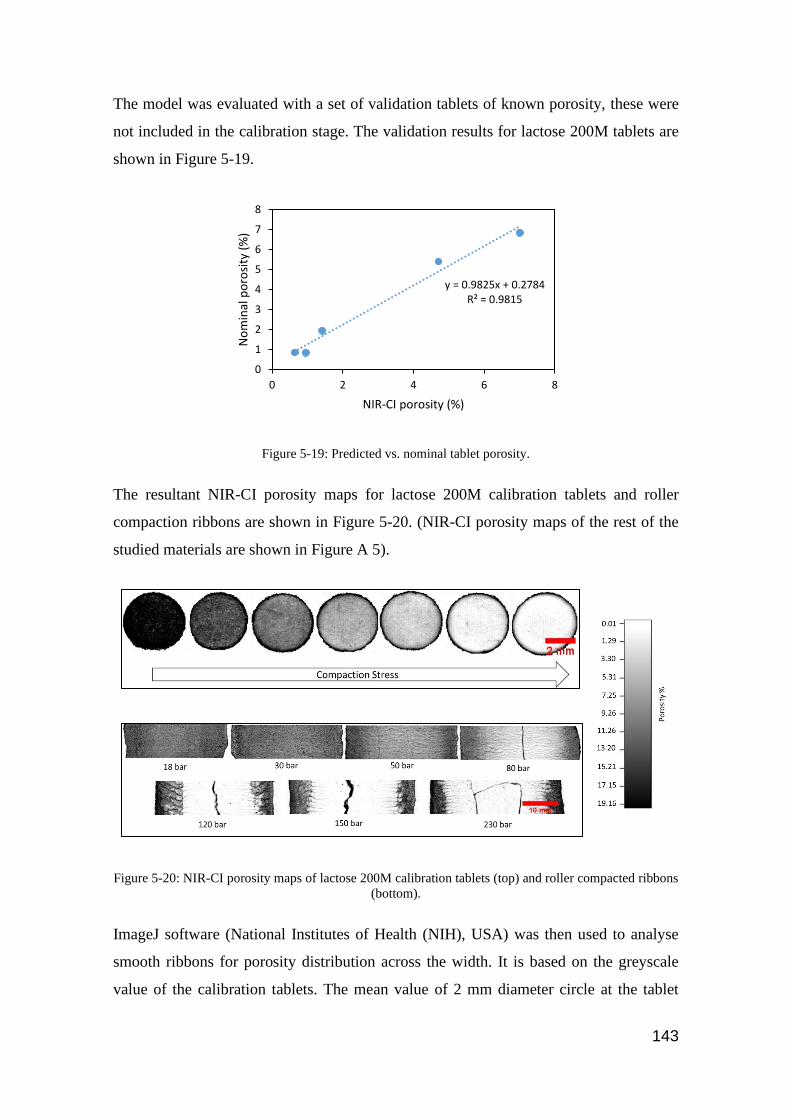
143
The model was evaluated with a set of validation tablets of known porosity, these were
not included in the calibration stage. The validation results for lactose 200M tablets are
shown in Figure 5-19.
Figure 5-19: Predicted vs. nominal tablet porosity.
The resultant NIR-CI porosity maps for lactose 200M calibration tablets and roller
compaction ribbons are shown in Figure 5-20. (NIR-CI porosity maps of the rest of the
studied materials are shown in Figure A 5).
Figure 5-20: NIR-CI porosity maps of lactose 200M calibration tablets (top) and roller compacted ribbons
(bottom).
ImageJ software (National Institutes of Health (NIH), USA) was then used to analyse
smooth ribbons for porosity distribution across the width. It is based on the greyscale
value of the calibration tablets. The mean value of 2 mm diameter circle at the tablet
y = 0.9825x + 0.2784R² = 0.9815
0
1
2
3
4
5
6
7
8
0 2 4 6 8
No
min
al p
oro
sity
(%
)
NIR-CI porosity (%)
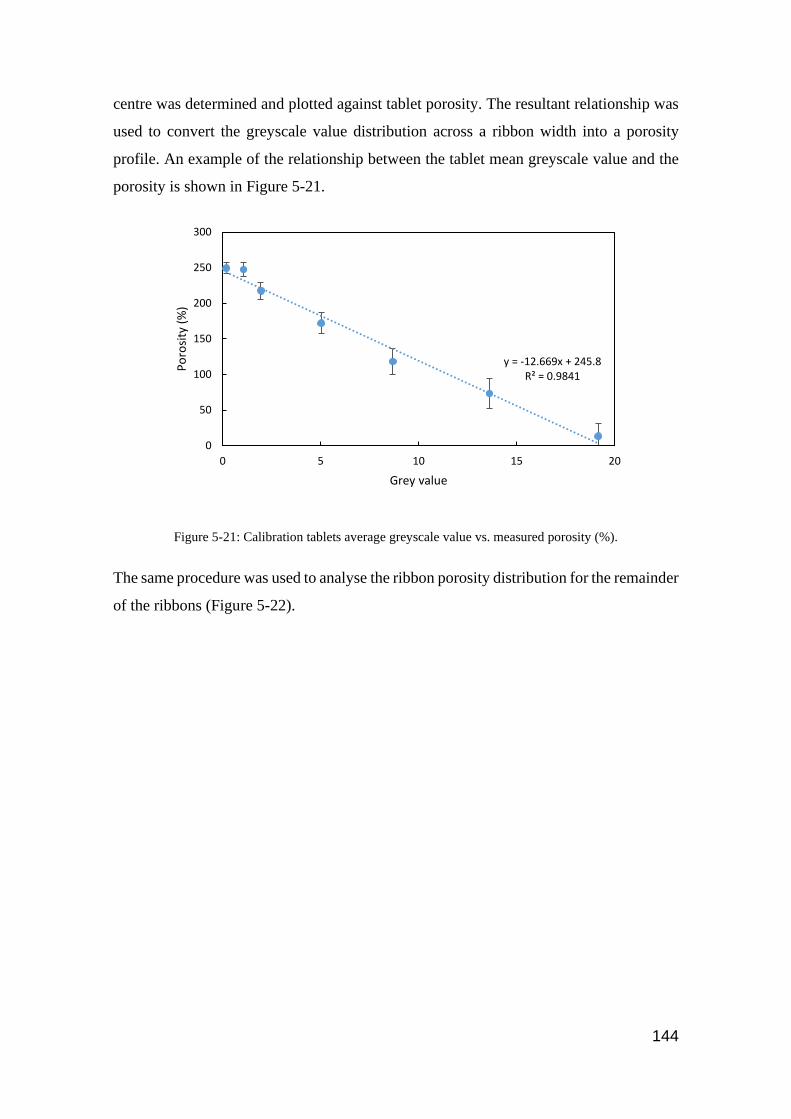
144
centre was determined and plotted against tablet porosity. The resultant relationship was
used to convert the greyscale value distribution across a ribbon width into a porosity
profile. An example of the relationship between the tablet mean greyscale value and the
porosity is shown in Figure 5-21.
Figure 5-21: Calibration tablets average greyscale value vs. measured porosity (%).
The same procedure was used to analyse the ribbon porosity distribution for the remainder
of the ribbons (Figure 5-22).
y = -12.669x + 245.8R² = 0.9841
0
50
100
150
200
250
300
0 5 10 15 20
Po
rosi
ty (
%)
Grey value

145
Figure 5-22: Porosity profile as measured by NIR-CI technique. The colour coding are in the following
order; : 18 bar, : 30, : 50 bar, : 80 bar, :120, : 150 bar ).
Thermal imaging
The homogeneity across the ribbon width was further investigated by thermal imaging to
measure the temperature profile. The stress acting on the material during compaction
brings powder particles closer to each other and generates heat by increasing the frictional
interaction at three interfaces: (i) between moving particles, (ii) between powder particles
and tool walls and (iii) within the powder particle itself due to plastic deformation and/or
breakage [54]. The amount of heat generated is a function of the stress applied, therefore
0
10
20
30
40
50
60
-25 -15 -5 5 15 25
Po
rosi
ty (
%)
Ribbon width (mm)
mannitol
0
10
20
30
40
50
60
-25 -15 -5 5 15 25
Po
rosi
ty (
%)
Ribbon width (mm)
200M
0
10
20
30
40
50
60
-25 -15 -5 5 15 25
Po
rosi
ty (
%)
Ribbon width (mm)
anhydrous
0
10
20
30
40
50
60
-25 -15 -5 5 15 25
Po
rosi
ty (
%)
Ribbon width (mm)
starch
0
10
20
30
40
50
60
-25 -15 -5 5 15 25
Po
rosi
ty (
%)
Ribbon width (mm)
maltodextrin
0
10
20
30
40
50
60
-25 -15 -5 5 15 25
Po
rosi
ty (
%)
Ribbon width (mm)
MCC
146
the profile of across-the-width ribbon temperature could be a powerful characterization
technique of the heterogeneity of the applied stress during roller compaction.
Figure 5-23 shows the surface temperature profile across the width of ribbons for four
different types of materials compacted using two different pairs of rollers (knurled and
smooth) and at the same level of hydraulic pressure. All materials showed higher ribbon
surface temperature when smooth rollers were used, this is correlated to the higher
amount of stress applied when smooth rollers were used (Figure 5-3).
It can be seen from Figure 5-23 that the uniformity of temperature profile was different
when different rollers were used; compared with smooth rollers, knurled rollers showed
greater of temperature homogeneity i.e. less temperature difference between the centre
and edges. This suggests a more homogenous stress distribution across the ribbon width
and this consequently leads to more uniform density distribution as was seen in Figure
5-13.

147
Figure 5-23: The surface temperature profile for four materials across ribbon width; compaction
conducted using two different pairs of rollers (smooth and knurled) at 30 bar hydraulic pressure. The
dashed line represents knurled rollers whereas continuous line represents smooth rollers.
Modified ribbon splitting index
It was shown that the predictability of the splitting index to the initiation of longitudinal
splitting was not adequate when knurled rollers were used; for smooth rollers,
longitudinal splitting was initiated at a value of the splitting index in the range between
0.9-4.27 while for knurled rollers, it was 13.8-24.5 (Figure 5-24 (A-C)). This may be due
to the index not taking account of the bending stresses. In an attempt to improve the
generalisation of the splitting index, the index was modified by incorporating the relative
solid fraction difference since the bending stresses should scale with parameter.
20
25
30
35
40
45
50
55
60
-20 -10 0 10 20
Tem
per
atu
re (
℃)
Ribbon width (mm)
mannitol
20
25
30
35
40
45
50
55
60
-20 -10 0 10 20
Tem
per
atu
re (
℃)
Ribbon Width (mm)
200M
20
25
30
35
40
45
50
55
60
-20 -10 0 10 20
Tem
per
aure
(℃
)
Ribbon width (mm)
anhydrous lactose
20
25
30
35
40
45
50
55
60
-20 -10 0 10 20
Tem
per
atu
re (
℃)
Ribbon width (mm)
MCC

148
The relative solid fraction, ∆𝛽, measured by X-ray was preferred over NIR-CI results
due to the limitations encountered when NIR-CI has been used i.e. the limited depth of
field of the lens compared with the surface the geometry of the knurled rollers ribbons.
The modified splitting index, 𝐼𝑆′ , is defined as follows:
𝐼𝑆′ = ∆𝛽휀R𝜎max /𝜎T Equation 5-3
Figure 5-24: A histogram of the number of non-splitting and splitting outcomes per powder feed
normalised by the total number of outcomes that were observed with the smooth and knurled rollers . The
data for CaCO3 ribbons are not included since its splitting behaviour is anomalous. This based on the
splitting index 𝐼S : (A-C) and modified splitting index 𝐼𝑆′ (B-D). NS refers to no splitting, L to
longitudinal. Coding refers to transversal (T), longitudinal (L), mixed transversal-longitudinal (T+L) and
no splitting (NS). Solid and patterned filled bars refer to unlubricated and lubricated cases respectively.
NS-Lub NS-Lub
NS-LubL-Lub L-Lub
L-Lub
L-Lub
L L
L
L
T
T
T+L
T+L
0
0.05
0.1
0.15
0.2
0.25
0.3
1.0-4.3 5.4-10.3 11.9-20.5 22.2-45.0
No
rmal
ised
nu
mb
er o
f o
utc
om
es
Smooth rollers
NS-Lub Lub-L L T T+L
𝐼S 1
A
NS-Lub
NS-Lub
NS-Lub
L-Lub
L-Lub
L-Lub
L
L
L
T
T
TT+L
T+L
T+L
0
0.05
0.1
0.15
0.2
0.25
0.3
0.3-1.6 1.6-3.2 3.5-8 8.8-14.7
No
rmal
ised
nu
mb
er o
f o
utc
om
es
Smooth rollers
NS-Lub L-Lub L T T+L
𝐼𝑆′ 1
B
NS-Lub NS-Lub NS-Lub
NS-Lub
L-Lub
L-Lub
LT
T
T
T
T+L
T+L
0
0.05
0.1
0.15
0.2
0.25
0.3
0.5-2.6 3.2-12.5 13.8-24.6 24.9-62.1
No
rmal
ised
nu
mb
er o
f o
utc
om
es
Knurled rollers
NS-Lub L-Lub L T T+L
𝐼S 1
C
NS-Lub NS-Lub
NS-Lub
NS-Lub
L-Lub
L-Lub
L
T
T
T
T
T+L
T+L
0
0.05
0.1
0.15
0.2
0.25
0.3
0.1-0.9 1.0-3.2 3.6-7.1 7.1-20.6
No
rmal
ised
nu
mb
er o
f o
utc
om
es
Knurled rollers
NS-Lub L-Lub L T T+L
𝐼𝑆′ 1
D

149
The advantage of this index is that the values correspond to the initiation of longitudinal
splitting are more similar for the smooth (1.6 – 3.2) and knurled (1.6 – 7.11) compared
with those for the unmodified index, which had values of (1.0 – 4.2) and (13.8 – 24.6).
That is, the modified index is more generalised and covers most of the splitting causing
factors including maximum applied compaction stress, elastic recovery, bending stress
due to non-uniform elastic recovery across ribbon width, and ribbon tensile strength.
(Figure 5-24 (B-D)).
Conclusion
The chapter focuses on extending the predictability of the splitting index developed in
Chapter 4 by introducing a factor relating to the bending stresses induced at the exit by
incorporating the ribbon solid fraction difference. Knurled rollers have a higher
powder/metal contact area that leads to more homogenous stress distribution in
comparison with the smooth rollers investigated in Chapter 4. However, the increase in
the contact area extends the range of transversal splitting/roller sticking when compared
with the smooth rollers and reduces the extent of longitudinal splitting. The ribbons were
characterised for their heterogeneity in terms of the porosity distribution using different
techniques. X-ray tomography was challenging in terms of being time-consuming, but
the use of NIR-CI was promising for providing pixel scale information. Nevertheless, its
use for testing knurled rollers ribbons was not possible due to the optical functioning
limitation in terms of the low DOF of the lens compared with Rz value of the scanned
compact surface. The incorporation of the heterogeneity factor in the splitting index
successfully enhanced the predictability for longitudinal splitting initiation.
A reduction in the occurrence of the longitudinal splitting will probably correspond to
more homogenous ribbons, which is essential for producing uniform granules properties.

150
CHAPTER 6 ROLLER STICKING-ROLE OF SURFACE
ENERGY
Introduction
Physical adhesion of powder to equipment surfaces is reported as one of the main
problems encountered during powder compaction processes and could lead to serious
problems such as poor quality condition of the compact and might cause serious damage
to the press machine [19]. The previous chapters demonstrated that the occurrence of
sticking/transversal splitting is affected by the stress applied and the mechanical
properties of the compacted materials. Therefore, it would be a significant benefit if the
sticking problem could be identified from the intermolecular interaction between the
contacted bodies i.e. the metal tooling surface and powder particles. Understanding the
energies of interaction between contacted bodies has been reported as one of the assisting
strategies for predicting sticking problems during tabletting processes [136–138]. It is
hypothesised in this chapter that favourable energies of the interaction either between
powder particles (cohesion) or between powder particles and a roller surface should
follow the trend of sticking/transversal splitting during roller compaction. Inverse gas
chromatography (IGC) coupled with a thin-film cell model was used to evaluate energies
of interaction between powder particles (Wco) and between powder particles and the metal
surface (Wad). The trend of the energies of interaction was compared with the sticking
behaviour observed in chapter-4.
Theoretical background
Whenever two solids come into intimate contact, the surface energy of the system will
influence their interaction in terms of the stability, adhesion, and cohesion. Surface free
energy, γ (mJ/m2) by definition is a measure of the excess energy of the surface of a
material or its the energy required to create a unit area of a surface [139]. It is important
in a wide range of applications including; granulation [140,141], crystallisation [142],
and tabletting [136,143].
151
The total surface energy (γ) consists of polar surface energy for acid-base interaction
(γ𝑎𝑏) and non-polar surface energy for the dispersive interaction (γ𝑑), and it is calculated
by the following equation:
γ =γ𝑑 + γ𝑎𝑏 Equation 6-1
The dispersive surface energy is mainly due to Van der Waals forces and more
specifically due to London dispersion forces, on the other hand, the polar surface energy
is described by both acidic (γ𝑎+) and basic properties of the surface (γ𝑏
−).
While surface free energy is referring to the energy of interaction of atoms and molecules
at the surface, interfacial surface energy is the energy required to separate two surfaces in
a certain medium from intimate molecular contact to infinite separation. This includes the
work of cohesion (Wco) for the interaction between two surfaces of the same phase and
the work of adhesion (w𝑎𝑑1−2) for the interaction between two different phases 1 and 2.
Both interactions can be calculated using the following equations [144]:
w𝑐𝑜 = 2[γ𝑑+ (γ𝑎+ ∗ γ𝑏
−)1
2 + (γ𝑏− ∗ γ𝑎
+)1
2 ] Equation 6-2
and
w𝑎𝑑1−2= 2[(γ𝑑
1 ∗ γ𝑑2)
1
2 + (γ𝑎+
1∗ γ𝑏
−2
)1
2 + (γ𝑏−
1∗ γ𝑎
+2
)1
2 ] Equation 6-3
Methods of measuring surface energies and its relation to sticking
studies
Contact angle
This method is based on placing a liquid droplet on a smooth, flat, isotropic and non-
deformable surface. As described by Young [145], once settled on the surface, the droplet
will thermodynamically equilibrate with its vapour and possess a unique profile. The
angle formed by the tangent of the liquid-vapour interface with the solid-gas interface is
the contact angle. The contact angle (Q) is defined by the mechanical equilibrium of the
drop that is subjected to the interfacial energies between three interfaces; liquid-
vapor(γ𝑙𝑣), solid-vapor(γ𝑠𝑣), and solid-liquid (γ𝑠𝑙) (Equation 6-4).
152
γ𝑙𝑣 cos Q = γ𝑠𝑣 − γ𝑠𝑙 Equation 6-4
Once determined, the contact angles of known property liquids on the solid surface can
then be applied in different approaches to calculate solid surface energy. The approaches
existing in the literature vary according to the number of liquids used and subsequently
the measured surface energy components, i.e. dispersive, acidic, and basic surface free
energy. The most common widely used approaches are Fowkes, Owens-Wendt, and Van
Oss-Chaudhury-Good methods [146,147].
In terms of its application in understanding compact stickiness during compaction,
Bunker et al. [148] studied the adhesion forces between lactose monohydrate and coated
tabletting punches at various RH values. The punches were coated with different materials
having various degrees of hydrophilicity/hydrophobicity, which was assessed by
measuring static water contact angles on the surface of the punches. The study mentioned
that lactose showed a higher adhesion to diamond-like carbon-coated punches in
comparison to the other coating materials investigated. This was ascribed to as the
formation of capillary bridges due to moisture condensation with the more hydrophilic
punch face. Additionally, Matjie et al. [138] investigated the adhesion of aluminium
silicate on stainless coupons, which were coated with different materials. The theory of
van Oss was used to determine the surface energy of the coated surfaces; this was
achieved by measuring the contact angles of known-property polar and non-polar liquids
on the coated and non-coated stainless steel coupons. The study showed that coating
decreased the surface energy of the coupons surfaces from 43.3 mJ/m2 for uncoated
coupons to values between 23.3-40.7 mJ/m2 depending on the coating material. The
reduction in the surface energy was associated with a 97% decrease in aluminium silicate
sticking. The same conclusion was made by Al-Karawi [149], where the contact angles
of molten ibuprofen showed a close correlation with the sticking tendencies of various
punch tip coatings.
Atomic Force Microscopy (AFM)
For this technique, a probe is either coated or loaded with the substrate of interest and it
is brought into contact with the studied surface. The movement of the cantilever is
monitored by a laser beam reflected off the cantilever on which the probe is mounted.
Because of its high sensitivity, the AFM can be used to investigate various types of

153
interactions such as van der Waal, capillary and electrical forces [147]. Wang et.al [136]
used AFM to study the adhesion forces between three different profen compounds and an
AFM tip that was coated with iron to resemble the tabletting punches. The profen surface
was prepared by the melting /recrystallisation of the material on a glass cover. The
measured work of adhesion was reported to be in agreement with the rank order of
adhesion measured in a subsequent study [25]; in which a compaction simulator was used
to compact the same set of materials and the tablet removal force was considered as the
criteria for punch face adhesion. Moreover, Weber et.al [150] investigated the lubrication
mechanism of MgSt by studying different combinations of particle interactions; the
results showed stronger interaction forces between MgSt and a steel surface when
compared to the interaction with MCC or MgSt particles itself. The author suggested that
the resultant adhesion interactions are responsible for the lubrication mechanism of MgSt
as it reduces the ejection force and sticking to the tabletting punches.
Generally, AFM is useful for investigating the molecular interaction at different levels,
while subsequent compaction stresses determine the extent of sticking. However, AFM
still suffers from some limitations that should be taken into account prior to any force
measurement; this includes the geometry of the particle attached to the probe tip, the
limited scanning area, and the difficulty in controlling the electrostatic charges.
Inverse Gas Chromatography (IGC)
For this technique, the sample under investigation is packed into a column and acts as a
stationary phase while an inert gas (usually helium) passes through the column as a
mobile phase. Known property probes are injected through the mobile phase to interact
with the investigated stationary phase. A series of non-polar probes such as n-alkanes is
be used to investigate the dispersive property of the solid sample. In addition, polar probes
are then injected in the column to study the acid-base interactions. The retention time (𝑡𝑟)
is that taken by the gaseous probe to pass through the chromatography column and is
obtained as the fundamental parameter measured. The retention time can be converted
into a retention volume (𝑉𝑁) (Equation 6-5), which is directly related to several
physiochemical properties of the solid (adsorbent) such as the surface energy [151,152].
𝑉𝑁 = 𝐹𝐶 . 𝐽(𝑡𝑟 − 𝑡0) Equation 6-5
where,

154
𝐹𝐶 is the carrier gas flow rate (ml/min) and 𝑡0 is the dead time which is that needed for a
non-interacting probe (e.g., methane) to pass through the column. J is the James-Martin
correction factor which describes the effect of the carrier gas compressibility and is added
to the above equation to correct the effect of pressure drop and the packing density of the
stationary phase on the retention time, this factor is calculated by the following equation
[153]:
𝐽 = 3
2∗
(𝑃𝑖 𝑃𝑜⁄ )2 − 1
(𝑃𝑖 𝑃𝑜⁄ )3 − 1 Equation 6-6
where, 𝑃0 and 𝑃𝑖 are the outlet and inlet pressures respectively.
Once the retention volume is determined, it can be applied in one of the two commonly
used methods in the literature, namely the Doris-Gray and Schultz methods [151], to
calculate the dispersive surface energy of the solid packed material. The former one is
applied in this study which involves plotting RgTln(VN) a function of the carbon number
(of the injected alkane probe), which should produce a linear correlation (Figure 6-1).
Where Rg is the gas constant (8.314 J.mol-1) and T is the column temperature (kelvin).
Figure 6-1: Determination of surface free energy based on Dorris-Gray approach [151].
The slope of the alkane line in Figure 6-1 can be used to determine the dispersive
component of the surface energy (γ𝑠𝑑) using the following equation [153]:
γ𝑠𝑑 = 𝑠𝑙𝑜𝑝𝑒2 4𝑁𝐴
2⁄ ∗ γ𝐶𝐻2 ∗ (𝛼𝐶𝐻2)2 Equation 6-7

155
where, γ𝐶𝐻2 is the surface free energy of a solid contains methylene groups only such as
polyethylene, 𝑁𝐴 is Avogadro’s number (6.022 × 10²³ mol−1), and 𝛼𝐶𝐻2 is the cross-
sectional area of a methylene molecule (6 Å2).
This method can only be used to calculate the dispersive component of surface energy so
that methods such as polarisation can be used to determine the specific part of the surface
energy. The same parameter (RgTln(VN)) used with Dorris-Gray method is plotted against
the molar deformation polarisation of the gaseous probe (PD, cm3 mol-1), which is an
intrinsic parameter given by the following equation [153] :
𝑃𝐷 =𝑤𝑟𝑖
2 − 1
𝑤𝑟𝑖2 + 2
𝑀
𝜌
Equation 6-8
where M, w and 𝜌 are the molar mass (g mol-1), refractive index, and density (g cm-3) of
the probe molecule respectively. The resultant plot should be a straight line for the
injected alkanes, while the points representing the polar probes are located above the
alkane straight line; the vertical distance to the straight line is equal to the specific
component of the free energy of adsorption (𝛥𝐺𝑎𝑠𝑝
) (Figure 6-2).
Figure 6-2: The typical plot of the polarisation method which is used to determine the specific surface
energy of adsorption 𝛥𝐺𝑎𝑠𝑝
[153].

156
Subsequently, based on the van Oss approach, the specific surface energies (γ𝑠𝑎𝑏) of the
samples can be calculated, in which the specific contribution is subdivided into an acidic
(γ𝑎+) and a basic (γ𝑏
− ) parameter of the surface energy:
𝛥𝐺𝑎𝑠𝑝 = 2𝑁𝐴[(γ𝑔
+)1/2
∗ (γ𝑠−)
12⁄ + (γ𝑔
−)1/2
∗ (γ𝑠+)1/2] Equation 6-9
Two main probes should be used to solve Equation 6-9; a monopolar electron acceptor
probe which has no (γ𝑔−) such as dichloromethane and monopolar electron donor probe
which has no (𝛾𝑔+).
If the specific surface area of the sample is provided, the IGC can be automatically
programmed to inject the precise amount of probe vapour in order to achieve different
user-defined surface coverages. The measurement of surface properties at different
surface coverages will result in a surface heterogeneity profile of the sample. The
understanding of energy distributions is particularly useful at interface boundaries of
formulations, as well as to distinguish subtle differences in the surface chemistry of
samples. Sample specific surface area is commonly determined using BET theory, in
which a monolayer of a weakly adsorbing gas is adsorbed on the sample solid surface
while adsorption isotherm is assumed to follow type II or IV adsorption mechanism. Any
gas can be used if the gas is physically adsorbed by weak bonds and can be desorbed by
decreasing the pressure at the same temperature. The theory relates condensation and
evaporation rates of the gas molecules in the adsorbed layer, the linear form of this
relationship is called the BET equation [154,155]:
𝑃𝑒𝑞
𝑛(𝑃𝑠𝑎𝑡 − 𝑃𝑒𝑞)=
1
𝑛𝑚𝐶+
𝐶 − 1
𝑛𝑚𝐶(
𝑃𝑒𝑞
𝑃𝑠𝑎𝑡)
Equation 6-10
where, 𝑃𝑒𝑞 and 𝑃𝑠𝑎𝑡 are the equilibrium and saturation pressure of adsorbates at a constant
temperature. 𝑛 is the amount of gas adsorbed at equilibrium pressure and 𝑛𝑚 is the
amount of gas adsorbed in a monolayer. C is the BET or sorption constant related to the
heat of adsorption and condensation.
BET theory is only valid at arrange of relative pressure (𝑃𝑒𝑞
𝑃𝑠𝑎𝑡) between 0.05-0.35, at which
the relationship between 𝑃𝑒𝑞
𝑛(𝑃𝑠𝑎𝑡−𝑃𝑒𝑞) and (
𝑃𝑒𝑞
𝑃𝑠𝑎𝑡) is suggested to be linear. The slope and

157
intercept of this linear relationship can be used to calculate (𝑛𝑚) as shown in the
following equation:
𝑛𝑚 = 1 − 𝑖𝑛𝑡𝑒𝑟𝑐𝑒𝑝𝑡
𝑠𝑙𝑜𝑝𝑒
Equation 6-11
Subsequently the BET specific surface area (𝑠𝐵𝐸𝑇) is calculated from:
𝑠𝐵𝐸𝑇 = 𝑛𝑚𝑁𝐴𝛼𝑎𝑑𝑠
𝑉𝑚𝑎𝑑𝑠
Equation 6-12
where 𝛼𝑎𝑑𝑠 is the cross-sectional area of the adsorbing gas molecule, 𝑁𝐴 is the Avogadro
number (6.022 × 10²³ mol−1), V is the molar volume of the adsorbed gas and 𝑚𝑎𝑑𝑠 is the
mass of the adsorbent in (g). The monolayer capacity, 𝑛𝑚 is the amount of the adsorbent
used to occupy all adsorption sites on the solid sample, It can then be used as a criterion
for the IGC to achieve different user-defined surface coverages [154].
In terms of its use to understand particle-particle interaction involved in compact
formation, IGC was used by Fichtner et.al [143] to study the impact of surface energy on
the compactibility of lactose monohydrate. Three powders of lactose with different levels
of surface energy were prepared by spray drying with different proportions of surfactant
polysorbate 80. All powder properties were similar in terms of particle size, shape and
surface area. The produced powders of lactose were compacted with the same compaction
pressure; the study showed a lower tablet tensile strength at higher surfactant
concentrations. This was attributed to the decrease in the powder surface energy, which
led to a lower formation of intermolecular forces at the same compaction pressure.
Moreover, Jacob and Berg [156] discussed the limitations associated with determining
the work of adhesion of porous and granular material using the contact angle technique.
They compared the results of the work of adhesion measured by contact angle and IGC
approaches. Both techniques have been used to measure the work of adhesion between
different polymers ((polyvinyl chloride) PVC and polymethyl methacrylate (PMMA))
and chemi-thermo-mechanical wood pulp fibres (CTMP). The study showed a close
agreement between the works of adhesion values determined by both techniques.

158
Summary
In summary, the aforementioned techniques suffer from some limitations that should be
considered prior to any surface energy determination; using the contact angle approach
on powder particles or granules is complicated by the presence of porous architecture that
still exists even when powder particles are compacted into a tablet. Rougher surfaces have
been reported to produce higher contact angle values when compared with smooth
surfaces with the same composition [157]. Additionally, when compressed, the topmost
particles could undergo plastic deformation which could give different results when
compared with an uncompacted powder [158]. On the other hand, AFM force resolution
is limited by the properties of the cantilever used including stiffness and sensitivity to
thermal noise [159].
As mentioned previously, both AFM and contact angle techniques were used as assisting
approaches to understand adhesion between surfaces in terms of intermolecular
interactions and more specifically by measuring the thermodynamic work of adhesion. In
an attempt to overcome some of the challenges associated with these techniques, the
inverse gas chromatography has been utilised as an alternative technique. It has been
shown in the literature that determining intermolecular interaction between powder and
metal surfaces could be beneficial in terms of predicting sticking during the compaction
processes; metal-powder interaction determines the potential of the interaction and any
subsequent mechanical process affect the extent of adhesion. In an attempt to extend our
understanding to ribbon transversal splitting/sticking, powder-powder and powder-metal
intermolecular interaction in terms of thermodynamic work of cohesion/adhesion were
determined using IGC. Energies of interaction have been examined for any correlation
with the trend of roller sticking described in Chapter-4.
Methods
A commercial inverse gas chromatography (IGC SEA, Surface Measurement Systems
Ltd., London, UK) was used to analyse the surface energy of both powders and metal
surface.
To determine the powder surface energy, about 600 mg of powder was packed into a
standard IGC salinized glass column of 4 mm inner diameter and 300 mm in length. All
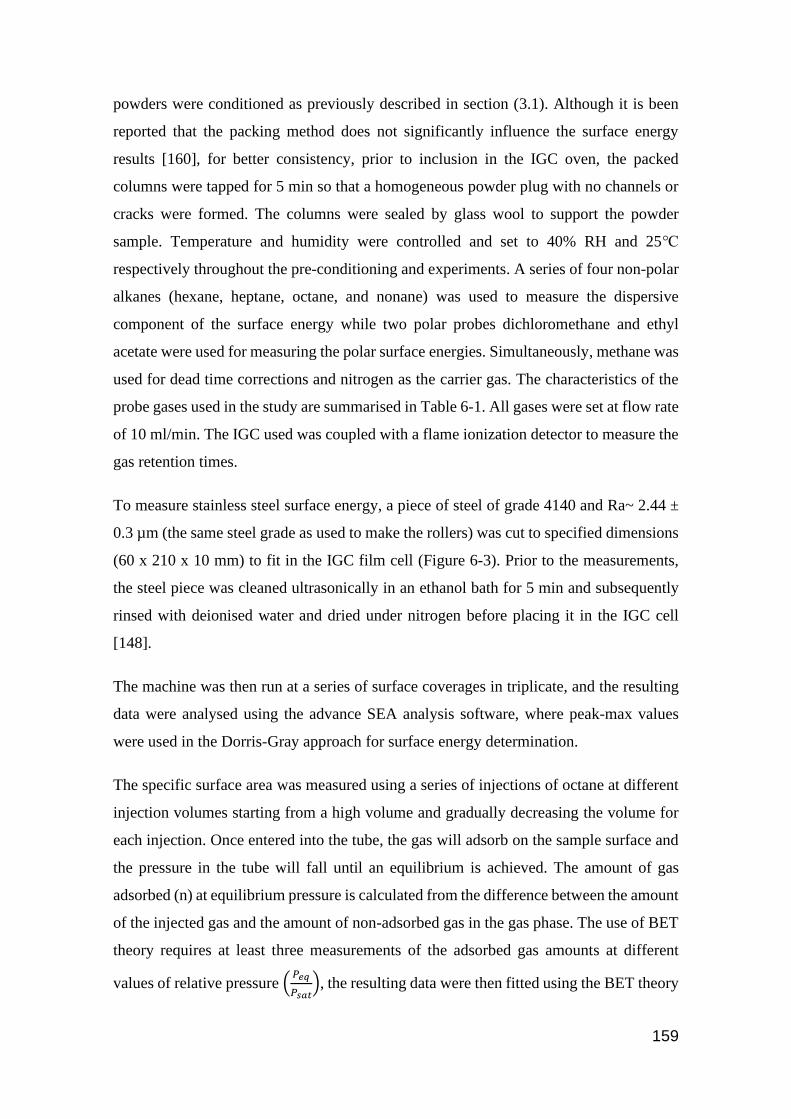
159
powders were conditioned as previously described in section (3.1). Although it is been
reported that the packing method does not significantly influence the surface energy
results [160], for better consistency, prior to inclusion in the IGC oven, the packed
columns were tapped for 5 min so that a homogeneous powder plug with no channels or
cracks were formed. The columns were sealed by glass wool to support the powder
sample. Temperature and humidity were controlled and set to 40% RH and 25℃
respectively throughout the pre-conditioning and experiments. A series of four non-polar
alkanes (hexane, heptane, octane, and nonane) was used to measure the dispersive
component of the surface energy while two polar probes dichloromethane and ethyl
acetate were used for measuring the polar surface energies. Simultaneously, methane was
used for dead time corrections and nitrogen as the carrier gas. The characteristics of the
probe gases used in the study are summarised in Table 6-1. All gases were set at flow rate
of 10 ml/min. The IGC used was coupled with a flame ionization detector to measure the
gas retention times.
To measure stainless steel surface energy, a piece of steel of grade 4140 and Ra~ 2.44 ±
0.3 µm (the same steel grade as used to make the rollers) was cut to specified dimensions
(60 x 210 x 10 mm) to fit in the IGC film cell (Figure 6-3). Prior to the measurements,
the steel piece was cleaned ultrasonically in an ethanol bath for 5 min and subsequently
rinsed with deionised water and dried under nitrogen before placing it in the IGC cell
[148].
The machine was then run at a series of surface coverages in triplicate, and the resulting
data were analysed using the advance SEA analysis software, where peak-max values
were used in the Dorris-Gray approach for surface energy determination.
The specific surface area was measured using a series of injections of octane at different
injection volumes starting from a high volume and gradually decreasing the volume for
each injection. Once entered into the tube, the gas will adsorb on the sample surface and
the pressure in the tube will fall until an equilibrium is achieved. The amount of gas
adsorbed (n) at equilibrium pressure is calculated from the difference between the amount
of the injected gas and the amount of non-adsorbed gas in the gas phase. The use of BET
theory requires at least three measurements of the adsorbed gas amounts at different
values of relative pressure (𝑃𝑒𝑞
𝑃𝑠𝑎𝑡), the resulting data were then fitted using the BET theory

160
(Equation 6-10) and the specific surface area calculated accordingly. Once this is
measured, the system can accurately inject a specific amount of probe vapour in order to
achieve the predefined surface coverages. The experiments were conducted in triplicate
and the results were analysed using the SMS analysis software V1.3 (SMS, Middlesex,
London, UK).
Table 6-1: Characteristics of probes gases used in the IGC study [161].
Test compound 𝛼𝑎𝑑𝑠 [m2] (γ𝑔𝑑) [J/m2] (γ𝑔
+) [mJ/m2] (γ𝑔−) [mJ/m2] Character
hexane 5.15×10⁻¹⁹ 0.0179 – – nonpolar
heptane 5.73×10⁻¹⁹ 0.0203 – – nonpolar
octane 6.30×10⁻¹⁹ 0.0213 – – nonpolar
nonane 6.90×10⁻¹⁹ 0.0227 – – nonpolar
Dichloromethane 2.45×10⁻¹⁹ 0.0245 124.58 0.0 acceptor of
electron
ethyl acetate 3.30×10⁻¹⁹ 0.0196 0.0 457.67 donor of
electron
Figure 6-3: Technical drawing of the film cell module for IGC (60 × 210 × 11 mm). The arrows show gas
flow [162].
Results and Discussion:
BET specific surface area

161
The BET specific surface areas of all samples were determined using octane adsorption
isotherm. The use of IGC for surface area determination has been previously reported to
give acceptable and reproducible results [163,164]. As an example, Figure 6-4 shows the
adsorption isotherm of starch which was used to calculate the specific surface area using
Equation 6-10 to Equation 6-12. The BET specific surface area and the fitting parameters
for all the studied materials are summarised in Table 6-2.
Figure 6-4: Octane isotherms (amount adsorbed n as a function of partial pressure Peq/Psat) for starch
sample 298 K)
Table 6-2: Specific surface area parameters determined using octane isotherm.
Material Sorption
constant (C)
Monolayer capacity (nm)
(mMol/g)
BET surface area (m2/g)
Steel 2.0122 0.0034 1.3407
CaCO3 11.6807 0.0025 0.9554
mannitol 2.0745 0.0029 1.0826
200M 4.3443 0.0018 0.6963
anhydrous lactose 2.4619 0.0022 0.8254
starch 3.373 0.0014 0.517
maltodextrin 2.0584 0.0031 1.1905
MCC 2.1048 0.0039 1.3407
MgSt 4.4208 0.1862 7.24235
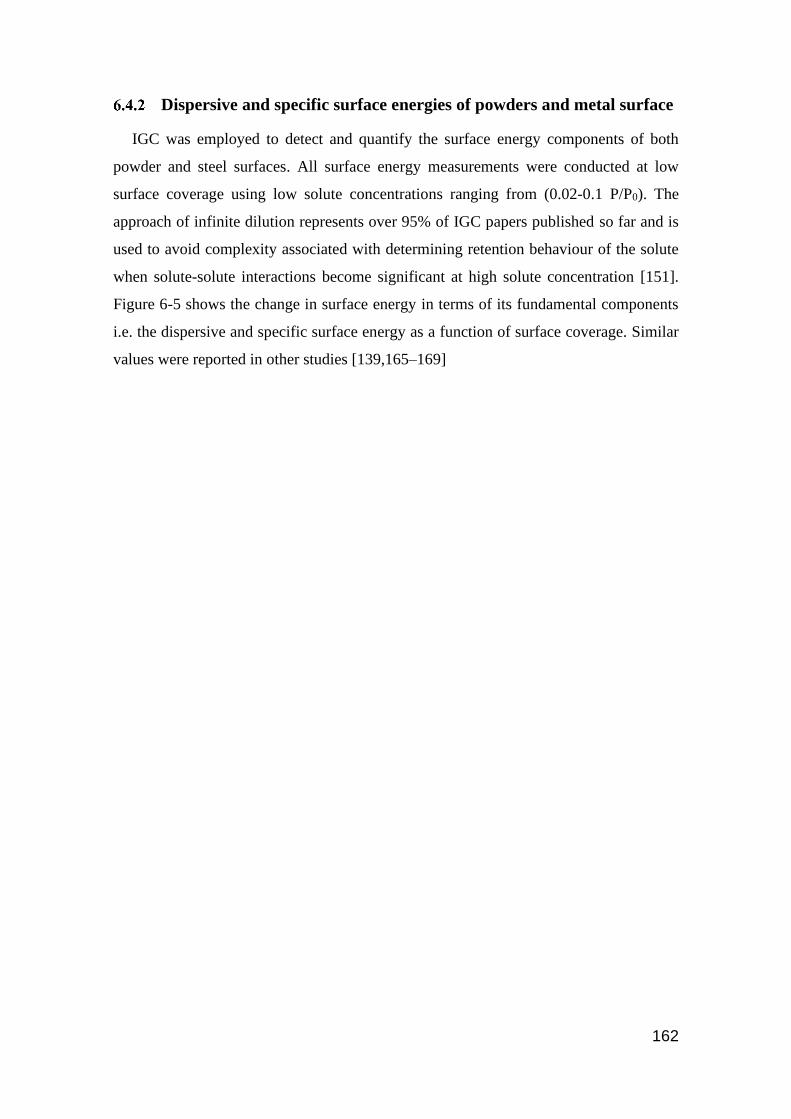
162
Dispersive and specific surface energies of powders and metal surface
IGC was employed to detect and quantify the surface energy components of both
powder and steel surfaces. All surface energy measurements were conducted at low
surface coverage using low solute concentrations ranging from (0.02-0.1 P/P0). The
approach of infinite dilution represents over 95% of IGC papers published so far and is
used to avoid complexity associated with determining retention behaviour of the solute
when solute-solute interactions become significant at high solute concentration [151].
Figure 6-5 shows the change in surface energy in terms of its fundamental components
i.e. the dispersive and specific surface energy as a function of surface coverage. Similar
values were reported in other studies [139,165–169]
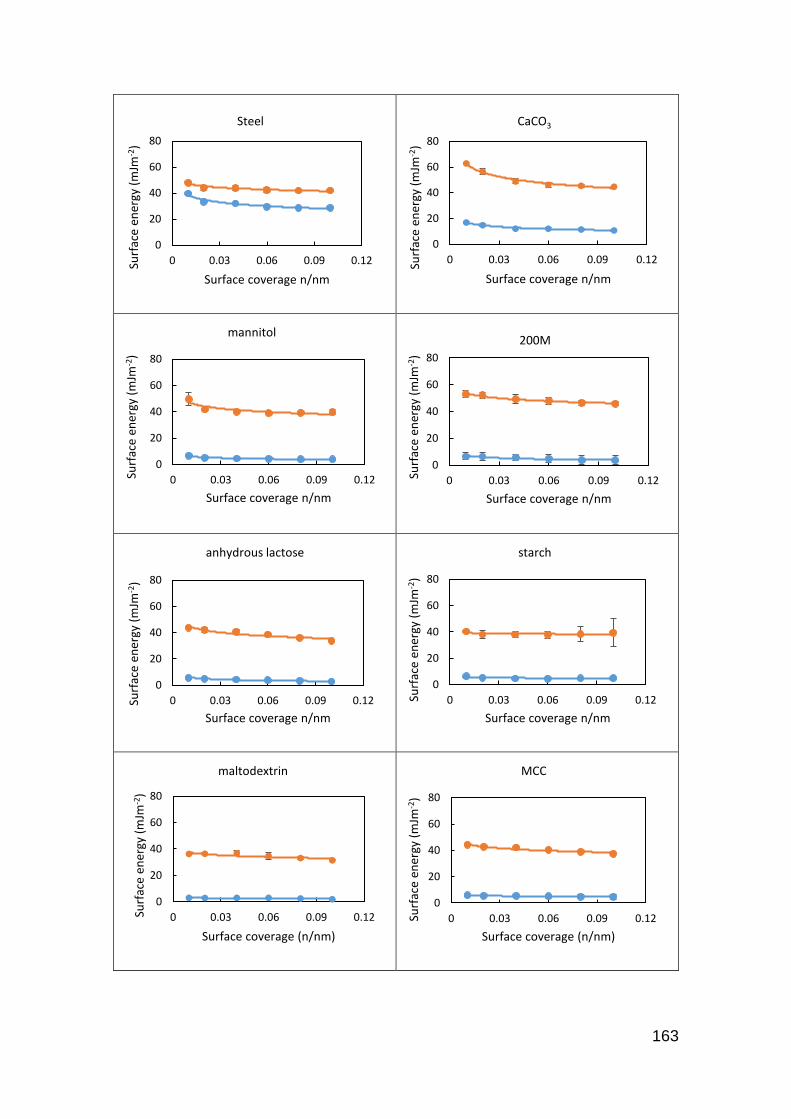
163
0
20
40
60
80
0 0.03 0.06 0.09 0.12Surf
ace
ener
gy (
mJm
-2)
Surface coverage n/nm
Steel
0
20
40
60
80
0 0.03 0.06 0.09 0.12Surf
ace
ener
gy (
mJm
-2)
Surface coverage n/nm
CaCO3
0
20
40
60
80
0 0.03 0.06 0.09 0.12Surf
ace
ener
gy (
mJm
-2)
Surface coverage n/nm
mannitol
0
20
40
60
80
0 0.03 0.06 0.09 0.12Surf
ace
ener
gy (
mJm
-2)
Surface coverage n/nm
200M
0
20
40
60
80
0 0.03 0.06 0.09 0.12Surf
ace
ener
gy (
mJm
-2)
Surface coverage n/nm
anhydrous lactose
0
20
40
60
80
0 0.03 0.06 0.09 0.12Surf
ace
ener
gy (
mJm
-2)
Surface coverage n/nm
starch
0
20
40
60
80
0 0.03 0.06 0.09 0.12Surf
ace
ener
gy (
mJm
-2)
Surface coverage (n/nm)
maltodextrin
0
20
40
60
80
0 0.03 0.06 0.09 0.12Surf
ace
ener
gy (
mJm
-2)
Surface coverage (n/nm)
MCC
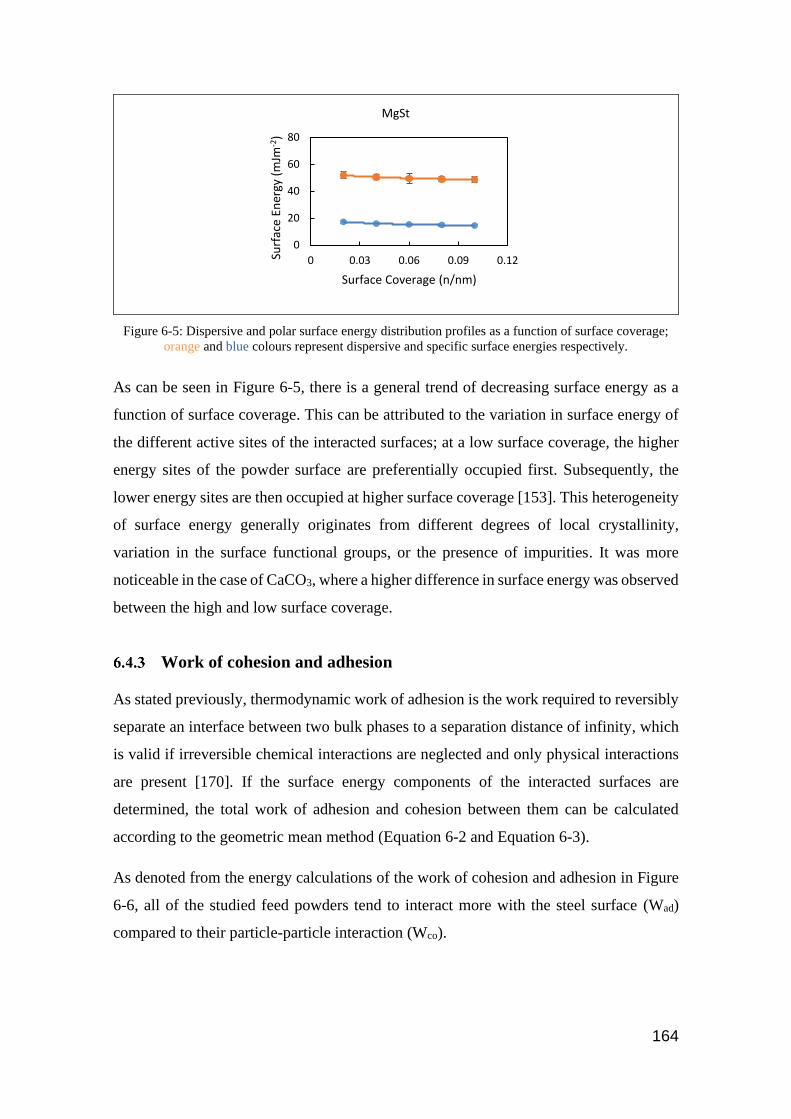
164
Figure 6-5: Dispersive and polar surface energy distribution profiles as a function of surface coverage;
orange and blue colours represent dispersive and specific surface energies respectively.
As can be seen in Figure 6-5, there is a general trend of decreasing surface energy as a
function of surface coverage. This can be attributed to the variation in surface energy of
the different active sites of the interacted surfaces; at a low surface coverage, the higher
energy sites of the powder surface are preferentially occupied first. Subsequently, the
lower energy sites are then occupied at higher surface coverage [153]. This heterogeneity
of surface energy generally originates from different degrees of local crystallinity,
variation in the surface functional groups, or the presence of impurities. It was more
noticeable in the case of CaCO3, where a higher difference in surface energy was observed
between the high and low surface coverage.
Work of cohesion and adhesion
As stated previously, thermodynamic work of adhesion is the work required to reversibly
separate an interface between two bulk phases to a separation distance of infinity, which
is valid if irreversible chemical interactions are neglected and only physical interactions
are present [170]. If the surface energy components of the interacted surfaces are
determined, the total work of adhesion and cohesion between them can be calculated
according to the geometric mean method (Equation 6-2 and Equation 6-3).
As denoted from the energy calculations of the work of cohesion and adhesion in Figure
6-6, all of the studied feed powders tend to interact more with the steel surface (Wad)
compared to their particle-particle interaction (Wco).
0
20
40
60
80
0 0.03 0.06 0.09 0.12Surf
ace
Ener
gy (
mJm
-2)
Surface Coverage (n/nm)
MgSt

165
Figure 6-6: The profiles of work of adhesion and cohesion between the powders and metal surface
determined by IGC. Red and green colours represent work of adhesion and work of cohesion respectively.
6080
100120140160180200
0 0.03 0.06 0.09 0.12Tota
l Wco
or
Wad
(m
Jm-2
)
Surface coverage n/nm
CaCO3
60
80
100
120
140
160
180
200
0 0.03 0.06 0.09 0.12
Tota
l Wco
or
Wad
(m
Jm-2
)
Surface coverage (n/nm)
mannitol
6080
100120
140
160180
200
0 0.03 0.06 0.09 0.12
Tota
l Wco
or
Wad
(m
Jm-2
)
Surface coverage (n/nm)
200M
60
80
100
120
140
160
180
200
0 0.03 0.06 0.09 0.12
Tota
l Wco
or
Wad
(m
Jm-2
)
Surface coverage (n/nm)
anhydrous lactose
60
80100
120140160
180
200
0 0.03 0.06 0.09 0.12Tota
l Wco
or
Wad
(m
Jm-2
)
Surface coverage (n/nm)
starch
60
80
100120
140
160
180
200
0 0.03 0.06 0.09 0.12
Tota
l Wco
or
Wad
(m
Jm-2
)
Surface coverage (n/nm)
maltodextrin
60
80
100
120
140
160
180
200
0 0.03 0.06 0.09 0.12
Tota
l Wco
or
Wad
(m
Jm-2
)
Surface coverage (n/nm)
MCC
6080
100120140160180200
0 0.03 0.06 0.09 0.12
Tota
l Wco
or
Wad
(m
Jm-2
)
Surface Coverage (n/nm)
MgSt
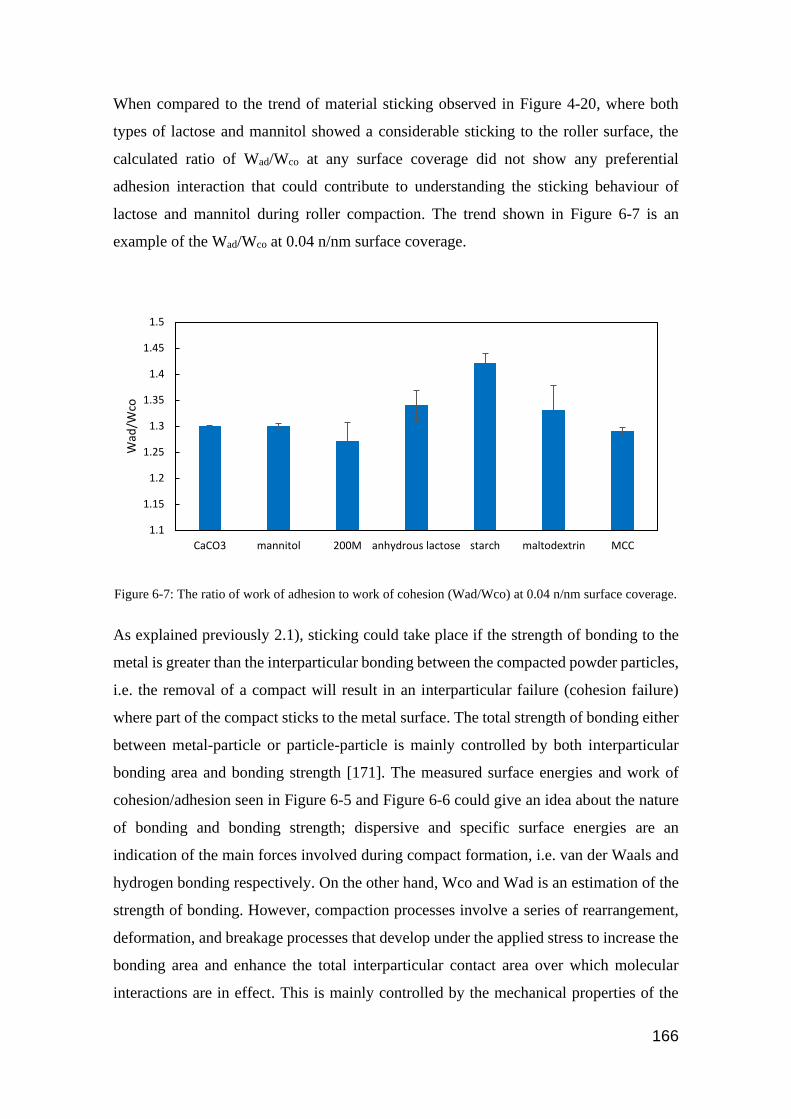
166
When compared to the trend of material sticking observed in Figure 4-20, where both
types of lactose and mannitol showed a considerable sticking to the roller surface, the
calculated ratio of Wad/Wco at any surface coverage did not show any preferential
adhesion interaction that could contribute to understanding the sticking behaviour of
lactose and mannitol during roller compaction. The trend shown in Figure 6-7 is an
example of the Wad/Wco at 0.04 n/nm surface coverage.
Figure 6-7: The ratio of work of adhesion to work of cohesion (Wad/Wco) at 0.04 n/nm surface coverage.
As explained previously 2.1), sticking could take place if the strength of bonding to the
metal is greater than the interparticular bonding between the compacted powder particles,
i.e. the removal of a compact will result in an interparticular failure (cohesion failure)
where part of the compact sticks to the metal surface. The total strength of bonding either
between metal-particle or particle-particle is mainly controlled by both interparticular
bonding area and bonding strength [171]. The measured surface energies and work of
cohesion/adhesion seen in Figure 6-5 and Figure 6-6 could give an idea about the nature
of bonding and bonding strength; dispersive and specific surface energies are an
indication of the main forces involved during compact formation, i.e. van der Waals and
hydrogen bonding respectively. On the other hand, Wco and Wad is an estimation of the
strength of bonding. However, compaction processes involve a series of rearrangement,
deformation, and breakage processes that develop under the applied stress to increase the
bonding area and enhance the total interparticular contact area over which molecular
interactions are in effect. This is mainly controlled by the mechanical properties of the
1.1
1.15
1.2
1.25
1.3
1.35
1.4
1.45
1.5
CaCO3 mannitol 200M anhydrous lactose starch maltodextrin MCC
Wad
/Wco

167
compacted materials where more plastically deformable materials such MCC respond to
the applied stress by generating higher surface area for bonding.
The results suggest that the studies conducted in the literature which correlates
interparticular bonding to the sticking tendency [136,148,149], could only be valid when
dealing with particles of similar mechanical properties. However, for materials that
possess various mechanical properties, it is necessary to incorporate the effects of
deformation that seems to be the limiting step for sticking as most of the studied materials
have a similar range of surface energies.
In summary, the data in Figure 6-7 would suggest that the release of all compacts of the
powders considered would involve cohesive rather than interfacial failure. However, the
values of Wad and Wco could be reduced by the asperities on the surfaces of the powder
particles, which will store elastic energy when compacted. Moreover, any failure
including the release of compacts involves crack propagation, and the values could be
increased by dissipative processes, e.g. viscoelastic or plastic deformation, at the crack
tip, which would increase the values of these parameters. Such effects are not taken into
account by measurements of the interfacial free energy.
Understanding the mechanism of lubrication as a function of surface
energy
As suggested by Weber et.al [150], the lubrication mechanism of MgSt can be elaborated
by considering the different interactions between the contacting surfaces. The study
showed that MgSt interaction with the steel is greater than most of the possible
interparticular interactions that could take place during compaction including; MgSt-
MgSt, MCC-MCC, MCC-steel, and MgSt-steel (Figure 6-8). According to the authors,
this could contribute to the explanation of the lubrication mechanism of MgSt during
compaction processes.

168
Figure 6-8: Cohesion energy measured between different particle combinations [150].
In this study, the work of cohesion and adhesion of MgSt to the steel and to all of the
studied feed powders have been calculated using the IGC surface energy measurements
shown in Figure 6-5, according to Equation 6-2 and Equation 6-3. The results are
presented in Figure 6-9; the figure also shows the work of cohesion between feed powder
particles and work of adhesion between powder particles and steel to compare all of the
possible interactions.

169
Figure 6-9: Work of cohesion and adhesion between MgSt-MgSt (—), MgSt-steel (—), PP-PP (—), PP-
steel (—), and MgSt-PP (—). (PP: stands for powder particle).
6080
100
120
140
160
180200
0 0.03 0.06 0.09 0.12Tota
l Wco
or
Wad
(m
Jm-2
)
Surface coverage n/nm
CaCO3
6080
100120140160180200
0 0.03 0.06 0.09 0.12Tota
l Wco
or
Wad
(m
Jm-2
)
Surface coverage n/nm
mannitol
6080
100120140160180200
0 0.03 0.06 0.09 0.12
Tota
l Wco
or
Wad
(m
Jm-2
)
Surface coverage (n/nm)
200M
6080
100120140160180200
0 0.03 0.06 0.09 0.12Tota
l Wco
or
Wad
(m
Jm-2
)
Surface coverage n/nm
anhydrous lanctose
60
80
100
120
140
160
180
200
0 0.03 0.06 0.09 0.12
Tota
l Wco
or
Wad
(m
Jm-2
)
Surface coverage n/nm
starch
60
80
100
120
140
160
180
200
0 0.03 0.06 0.09 0.12Tota
l Wco
or
Wad
(m
Jm-2
)
Surface coverage n/nm
maltodextrin
60
80
100
120
140
160
180
200
0 0.03 0.06 0.09 0.12Tota
l Wco
or
Wad
(m
Jm-2
)
Surface coverage n/nm
MCC

170
The results in Figure 6-9 show that in most of the cases MgSt tends to interact more
preferentially to the steel surface in comparison with its interaction to the other surfaces.
The results support the main mechanism of lubrication suggested in the literature i.e.
boundary lubrication mechanism by which the lubricant forms a layer around the
compacted particles or on the metal surface. According to JKR theory [70], there are two
main approaches by which this layer can reduce the adhesive interactions; 1) reducing the
interfacial interactions between powder particles and the metal surface, which could apply
to all of the tested powders except for the case of CaCO3 since there is a greater interaction
between all of the tested powders and the metal surface compared to the other interactions
(Figure 6-9); 2) reducing the contact area between powder particles and metal surface.
The anomalous behaviour of CaCO3 can be attributed to its high degree of impurity; the
used CaCO3 in this study was sourced by grinding of marbles. It is known to contain
MgCO3 and Fe2O3 which could explain its high polar surface energy values [172,173].
Conclusions
IGC SEA was used to determine the surface energetics and surface chemistry of the
samples in an attempt to determine if there were any preferential intermolecular
interaction between steel surface and compacted powder that could lead to powder
sticking on the roller surface. This study was able to differentiate the differences in
surface energetics and surface chemistry of the samples. The surface energetics and
surface chemistry of materials are known to have important implications in processes
involving interfacial interactions such as in wetting, coating, cohesion/adhesion etc.
The surface energy profiles show that all the samples are energetically heterogeneous
since the surface energies change as a function of surface coverage. In addition, it can be
clearly observed that the dispersive component contributes a major part of the surface
energy.
No clear correlation between the work of adhesion/cohesion and sticking probability was
found which suggests that particle deformation is a dominant factor in sticking during
compaction. However, the result could contribute to the elaboration of the lubrication
mechanism of MgSt during powder compaction, as MgSt tends to interact more
preferentially with the steel when compared to the other possible surface interactions.
171
CHAPTER 7 PRDICTIVE MODEL FOR THE RIBBON
POROSITY DISTRIBUTION USING THE ARTIFICIAL
NEURAL NETWORK
Abstract
It was shown in Chapter 5 that the heterogeneous distribution porosity across ribbon width
can affect the trend of ribbon splitting. Such heterogeneity may also have a negative effect
on the properties of the downstream granules [174,175]. In this chapter, a data-driven
model was developed to predict the ribbon porosity distribution using the artificial neural
network approach (ANN). Various process-related parameters (e.g. roller force and roller
surface indent depth) and material properties (e.g. the angle of wall friction, effective
angle of internal friction and the material compressibility) were considered as the inputs
of the ANN. While the outputs of such a network were the porosity which was
experimentally measured by X-ray tomography at every 3.5 mm across the ribbon width.
It is worth mentioning that the best number of hidden neurons was the one that
corresponded to the minimum error. Once the model is successfully developed and
optimized, one can accurately predict the porosity distribution across the ribbon width.
Experimental results showed that the ANN was able to successfully map various material
and process parameters to the ribbon porosity distribution across ribbon width, which is
considered to be one of the most important quality attributes in the roller compaction
process. Furthermore, the obtained results are considered as a promising development in
the roller compaction that may positively affect the design, control and the scale-up of
the roller compaction process.
Introduction
Roller compaction is a continuous compaction process. However, incorporating
this process in a continuous manufacturing line requires effective control strategy that
controls the process through a feedback control systems, this is essential to achieve the
designed critical quality attributes in the presence of disturbances generated by the
process and/or feed materials. Model predictive control (MPC) is one of the most
powerful control technique; this system relies on the models of each unit operation within

172
the contentious line to take a control action [176]. Therefore, to apply such a control
system there is a need to develop robust and rapid models so it can be implemented in the
controlling system [177].
Various predictive modelling approaches have been used to simulate the roller
compaction process. Finite element method (FEM) has been used extensively by many
researchers to model the roller compaction process in order to investigate variation of
normal and shear stresses across ribbon width [64], predicting three-dimensional ribbon
density distribution [175] and examining the effect of varying material parameters on the
maximum stress and nip angle [88]. Additionally, DEM approach was also implemented
to simulate the roller compaction process; Odagi et al. [91] developed a 2D-DEM model
to evaluate the effect of cohesion force and roll speed on the particle flow rate and
pressure distribution on the roller surface. In a more recent study [90], a combined three
dimensional DEM/FEM model was utilised to model the relative density of the roller
compacted ribbons; DEM was used to simulate the flow of material in the feeding zone
and the results of this model was used as a boundary inlet condition for the subsequent
FEM modelling. (The use of these modelling approach in the field of roller compaction
process is highlighted in more details in section 2.3).
All of the aforementioned models are of great importance for enhancing the mechanistic
understanding of the roller compaction process. However, these models still suffer from
the long processing time which hinders its applicability in the control system of the
manufacturing line. Providing that MPC system requires any process model to run in a
few seconds so it can be implemented in the controlling system. From here comes the
strength of data-driven models such as ANN to overcome such a problem. ANN can be
trained and exploited to simulate complex processes with multiple inputs and outputs.
A limited number of researchers attempted to use ANN to model such a complicated
process; Turkoglu et al. [93] used ANN and genetic algorithm approach to optimise the
tablet tensile strength; binder type, concentration, and the number of roller passes were
used as inputs in a multilayer feedforward network. Inghelbrecht et al. [76] utilized ANN
modelling to study the effect of roll speed, horizontal and vertical screw speeds and air
pressure on the friability of the produced granules. In a more recent attempt Sajjia, et al.
[94] used roller force and screw speed as inputs, and average envelope density of MCC
ribbons as outputs. Though, the developed network is greatly limited in terms of its

173
application as it did not take into consideration material properties and the variation of
density across ribbon width.
In summary, ANN can be trained to predict complex trends; this study revisits ANN
approach to provide a fast and reliable model that link various material and process
proprieties to predict porosity distribution across the ribbon width. Many theoretical
models addressed this problem; nevertheless, these models are of great value in terms of
providing a detailed mechanistic understanding of the process, due to their long
processing time, it still hard to implement them in the control system across the
manufacturing line.
Theoretical background
Machine learning and ANN
Since physical models may not exist or may be too complex to be developed and
implemented, data-based models are, more often than not, used to represent complex
processes by utilising the computing capacity of computers. An artificial Neural network
(ANN), as a data-driven model, is a set of algorithms that are inspired by the biological
neural networks. In case of biological neurons, neurons are connected to each other by
the so-called synapses, signals can only be transmitted between neurons when the
intensity of the received signals exceed the neuron threshold, the neuron then becomes
active and the signal will be allowed to pass to the neighbouring neuron. Similarly, the
artificial neural network consists of interconnected nodes, synapses that are represented
by a single number or weight and each input is multiplied by a certain weight before being
sent to the node body. In the node body, the sum of the weighted signals is processed
using a certain activation function. Figure 7-1 shows a schematic representation of the
neuron of both the biological and the artificial network. An example of the activation
function is the step function, where the sum of all weighted signals is compared to a
predefined threshold. The node output is “1” when the sum of the weighted signals is
higher than the defined threshold otherwise the node output is “0” [92].
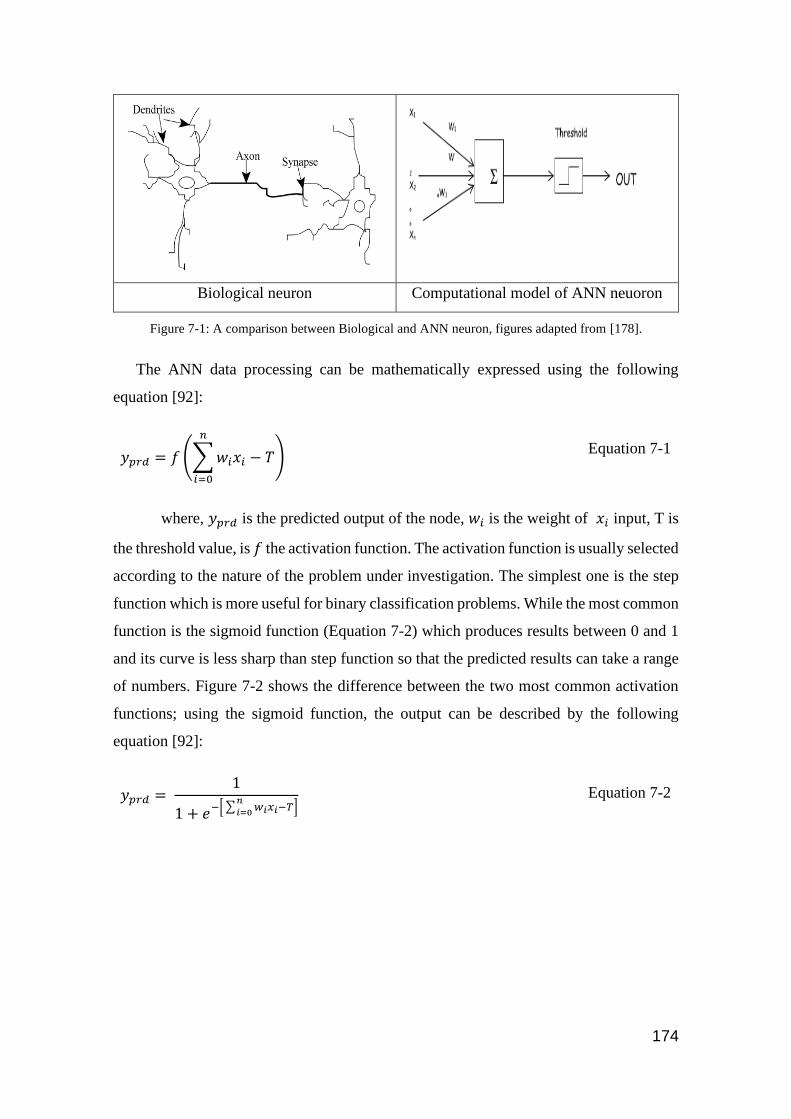
174
Biological neuron Computational model of ANN neuoron
Figure 7-1: A comparison between Biological and ANN neuron, figures adapted from [178].
The ANN data processing can be mathematically expressed using the following
equation [92]:
𝑦𝑝𝑟𝑑 = 𝑓 (∑ 𝑤𝑖𝑥𝑖 − 𝑇
𝑛
𝑖=0
) Equation 7-1
where, 𝑦𝑝𝑟𝑑 is the predicted output of the node, 𝑤𝑖 is the weight of 𝑥𝑖 input, T is
the threshold value, is 𝑓 the activation function. The activation function is usually selected
according to the nature of the problem under investigation. The simplest one is the step
function which is more useful for binary classification problems. While the most common
function is the sigmoid function (Equation 7-2) which produces results between 0 and 1
and its curve is less sharp than step function so that the predicted results can take a range
of numbers. Figure 7-2 shows the difference between the two most common activation
functions; using the sigmoid function, the output can be described by the following
equation [92]:
𝑦𝑝𝑟𝑑 = 1
1 + 𝑒−[∑ 𝑤𝑖𝑥𝑖−𝑇𝑛
𝑖=0] Equation 7-2

175
Figure 7-2: Sigmoid and step activations functions [92].
In summary, each network is characterized by three main factors:
1- Node character: this determines the signal processing by the node, which is
controlled by many variables such as the number of inputs and outputs connected
with the node, the weight of each input, and the activation function.
2- Network topology: In the ANN, nodes are distributed in three main layers: input,
hidden and output layer (Figure 7-3). Designing a neural network involves
determining the number of nodes, number hidden layers, and the way they are
connected. Figure 7-3 shows the two main types of connection between nodes:
feedforward connection in which the signal travels in one-way with no-loop back
and feedback connection where the output of the node could be an input for another
node [92].
Feedforward ANN Feedback ANN
Figure 7-3: The two main types of topologies of ANN networks [92].
176
3- Learning: During this stage, the available data are classified and used in three main
separate processes i.e. training, validation and testing. Firstly, the training process
of the network has two main categories; supervised learning (the approach used to
develop neural network in this work) in which a set of examples of inputs and their
associated outputs are introduced to the network; the set of inputs are used to
estimate the predicted outputs, then the difference between the predicted and the
target outputs are utilized in a weight adjustment process in order to minimize the
error between predicted and actual output. Such a process is governed by an
algorithm called backpropagation learning algorithm. Once this is performed, the
adjusted weights are then utilized to re-estimate the predicted output. In the case
of unsupervised learning, there is no target output, alternatively, the network will
try to learn some internal features or patterns from the inputs provided. The next
set of data is used to validate the trained model in a process called validation, this
is to make sure that the trained model is not overtrained to the training set and
developed model parameters are tuned accordingly. This step also helps in
adjusting the weights associated with the inputs. The last step is the test process
and is used to assess the performance of the validated model in terms of its
prediction power [23,178].
Experimental
Method
A range of materials with different mechanical properties was roller compacted using two
different roller surfaces (knurled and smooth) using a range of roller forces. The roller
speed of 3 rpm and a gap distance of 2 mm were applied and kept constant throughout
the whole experiments. Prior to compaction, feed powders were conditioned and analysed
for their flow properties in terms of their wall and internal friction using shear cell tester.
Additionally, a uniaxial compaction test was performed to determine their compressibility
values. The produced ribbons were then analysed for their across the width ribbon
porosity profile, and this is performed by conducting an X-ray scan at every about 3.5
mm across ribbon width (12 outputs). More details about the ribbon production and
characterisation procedures can be found in Chapter-3.

177
Modelling and simulation
Matlab R2018a was utilised to develop an ANN model using the following parameters as
inputs: roller force (kN), roller surface indentation depth (mm), material yield strength
(MPa), effective angle of internal friction (º), angle of wall friction (º), and the
compressibility factor (K). On the other hand, ribbon porosities at about every 3.5 mm
across the ribbon width were considered as outputs. All input and output data are tabulated
in Table A 1.
In order to improve network performance for porosity prediction, multiple inputs single-
output (MISO) structure was used [179]; 12 multilayer feedforward networks with
backpropagation learning algorithm (scaled conjugate gradient) were optimized for their
topology [180]. Figure 7-4 depicts the ANN structure developed to predict porosity at a
specific location across the ribbon width.
Figure 7-4: Schematic diagram of the ANN simulation process.
Each network link the inputs with one local porosity across the ribbon width. To cope
with different magnitudes in the input and output data, normalisation of data were carried
out according to the following formula:

178
𝑥𝑛 = 𝑥𝑖 − min(𝑥)
max(𝑥) − min (𝑥)
Equation 7-3
where 𝑥𝑛 is the normalised value of the input, 𝑥 refers to the actual values of the inputs,
and i represents the set of experimental runs.
Optimizing network topology in terms of finding the best number of hidden layers and
nodes within each layer is challenging; a trial and error approach is performed to estimate
the best network topology. Therefore, the number of hidden layers and nodes within each
hidden layer were increased systematically, and the optimum network topology was
determined according to the value of the error between actual and predicted outputs
throughout all the regression results including; training, validation, and testing. This error
was represented in terms of coefficient of correlation (R) which is given by the following
equation:
𝑅 = ∑ (𝑥𝑖 − 𝑥𝑖)𝑛
𝑖=0 (𝑦𝑝𝑟𝑑 − 𝑦𝑝𝑟𝑑)
√∑ ((𝑥𝑖 − 𝑥𝑖)2(𝑦𝑝𝑟𝑑 − 𝑦𝑝𝑟𝑑)2
)𝑛𝑖=0
Equation 7-4
Where 𝑥𝑖 and 𝑦𝑝𝑟𝑑 are the means of 𝑥𝑖 and 𝑦𝑝𝑟𝑑 respectively.
The training was performed on the developed networks, the number of nodes and layers
was increased systematically to improve the prediction performance in terms of R-value.
The training has proceeded in the range between 1-25 nodes on single and double hidden
layer networks and the best performing network in terms of its (R-value) was selected for
ribbon porosity profile prediction.
Results and Discussion
Statistical analysis
Simpler regression models were used in an attempt to predict porosity distribution across
ribbon width. Thus, input and output data were correlated using simpler statistical tests
i.e. Pearson correlation and quadratic data fitting. By definition, Pearson correlation can
be used to assess the strength of the linear relationship between two numeric variables.
The coefficient of this correlation (R) can take on values between -1 to +1 depending on
the strength and direction of the linear relationship. The further R-value away from zero,

179
the stronger the linearity will be. Positive and negative R-value indicates direct and
inverse relationship respectively. On the other hand, quadratic regression is the process
of finding the equation of the parabola that best fit the relationship in a set of data. In this
case, the closer the R-value to 1 the more accurate the fitting is.
All inputs including; roller force, angle of wall friction, angle of internal friction, powder
compressibility, powder yield strength, and roller’s indentation depth were correlated
with one output which is the porosity at a single position across ribbon width (Table A
1). The same procedure has been repeated on all outputs. The results for both Pearson
correlation and quadratic regression are shown in Figure 7-5.
Figure 7-5: Prediction performance of Pearson correlation (green-line) and quadratic fitting (red-line).
It can be seen from the fitting results that in comparison with the Pearson correlation, the
quadratic approach provided higher correlation between inputs and outputs. However,
both approaches poorly prescribed the correlation in the last three points across the ribbon
width, this is believed to be due to the absence of some points when narrower ribbons are
analysed. In an attempt to build an improved model with higher predictability, the ANN
approach has been employed.
Neural network topology optimization
Network consists of layers and nodes; determining the number of hidden layers is a
compromise between network accuracy and generalisation. Increasing the number of
hidden layers, enhance network accuracy but diminish its predictability outside the
boundaries of data set. On the other hand, a lower number of hidden layer improve the
generalisation of the network, but this comes at the cost of lower accuracy [23]. The 65
0
0.2
0.4
0.6
0.8
1
0 2 4 6 8 10 12 14
R
Position number across ribbon width

180
data sets used in this study (Table A 1) were normalised using Equation 7-3 and
distributed between 3 data sets 70% for training, 15% validation, and 15% for testing.
Once divided, the data was then used to model a one hidden layer network. The number
of nodes in the hidden layer was increased from 1 to 25 while recording the resulted model
performance in terms of (R) value. Figure 7-6 shows the performance values of these 25
hidden layer networks.
Figure 7-6: Performance of the 25- single hidden layer networks; Number of nodes was increased while
recording R-value. corresponds to training, to validation, to testing, and to all.
As seen in Figure 7-6, the obtained performance values were not satisfactory, as none of
these networks has high (R) values for training, validation and testing together.
Considering this, an attempt was made to enhance the accuracy of the model by adding
another hidden layer. Subsequently, an optimisation of the number of nodes within the
two hidden layers was conducted; the number of nodes was systematically increased
while monitoring its performance in terms of (R) value.
Subsequently, once the best network in terms of R-value was determined, the run was
repeated for 10 times and the average predicted results were calculated accordingly. The
resulted optimised networks with their regression results are shown in Table 7-1.
Compared with the single hidden layer networks performance (Figure 7-6), the developed
networks showed a better performance in terms of the coefficient of correlation (R). The
results showed that adding another hidden layer is advantageous for making more
accurate and robust ANN.
0
0.1
0.2
0.3
0.4
0.5
0.6
0.7
0.8
0.9
1
1 2 3 4 5 6 7 8 9 10 11 12 13 14 15 16 17 18 19 20 21 22 23 24 25
(R)
Number of nodes
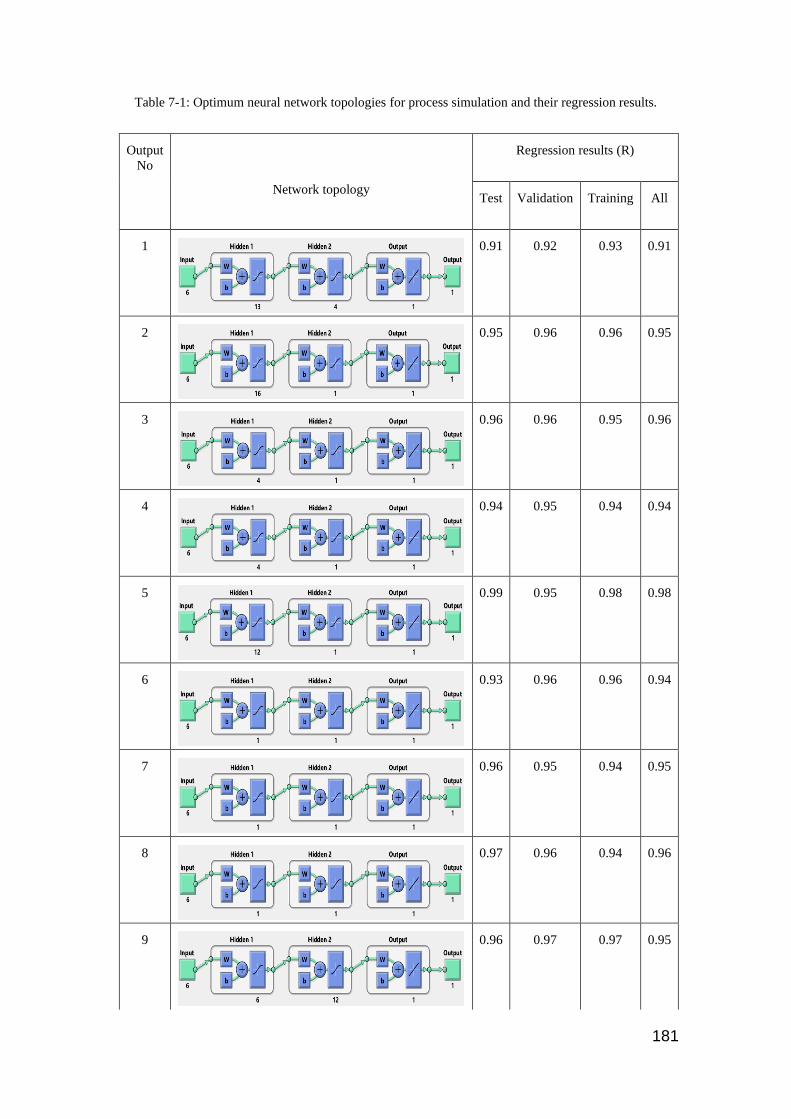
181
Table 7-1: Optimum neural network topologies for process simulation and their regression results.
Output
No
Network topology
Regression results (R)
Test Validation Training All
1
0.91 0.92 0.93 0.91
2
0.95 0.96 0.96 0.95
3
0.96 0.96 0.95 0.96
4
0.94 0.95 0.94 0.94
5
0.99 0.95 0.98 0.98
6
0.93 0.96 0.96 0.94
7
0.96 0.95 0.94 0.95
8
0.97 0.96 0.94 0.96
9
0.96 0.97 0.97 0.95
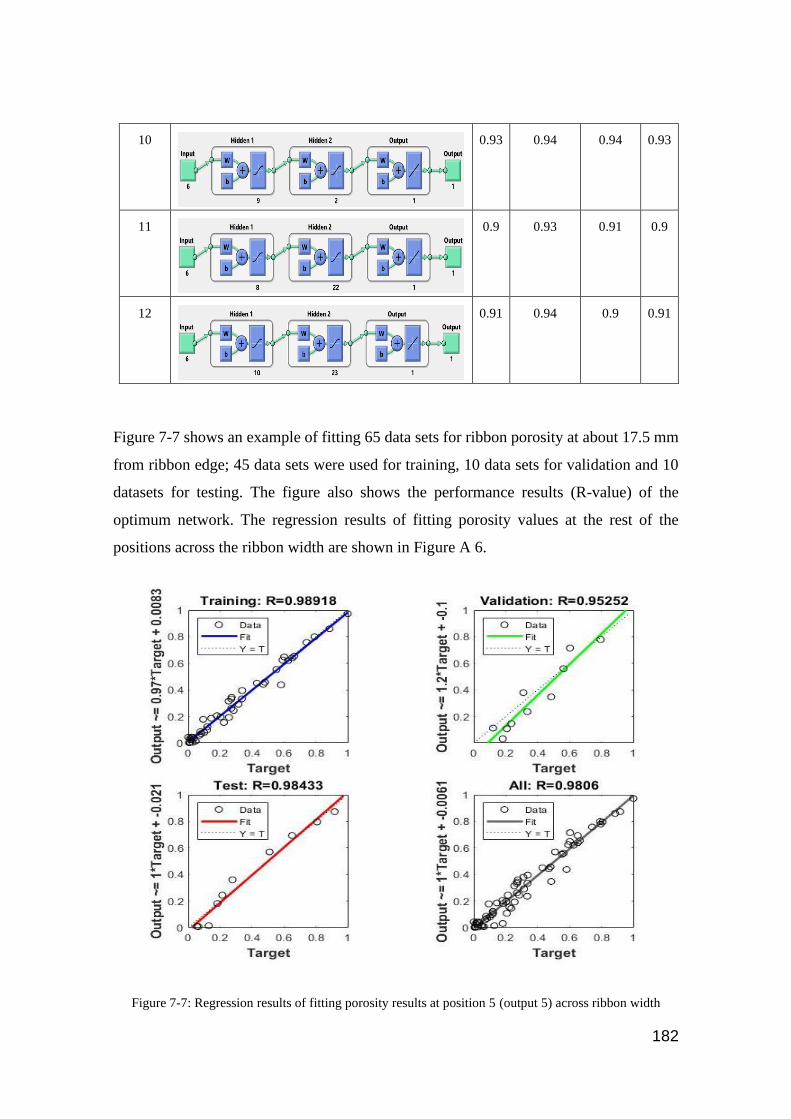
182
10
0.93 0.94 0.94 0.93
11
0.9 0.93 0.91 0.9
12
0.91 0.94 0.9 0.91
Figure 7-7 shows an example of fitting 65 data sets for ribbon porosity at about 17.5 mm
from ribbon edge; 45 data sets were used for training, 10 data sets for validation and 10
datasets for testing. The figure also shows the performance results (R-value) of the
optimum network. The regression results of fitting porosity values at the rest of the
positions across the ribbon width are shown in Figure A 6.
Figure 7-7: Regression results of fitting porosity results at position 5 (output 5) across ribbon width
183
Prediction results
The predicted results developed by ANN were compared with the actual experimental
results to evaluate the accuracy of the networks in predicting porosity across ribbon width.
Figure 7-8 and Figure 7-9 show a comparison example between the predicted (de-
normalised using Equation 7-3) and experimentally measured ribbon porosity profiles for
the six different materials used in this study, this is for ribbons produced using the two
different pairs of rollers i.e. knurled and smooth rollers at 20.72 kN roller force. The rest
of the prediction results are tabulated in Table A 2.
The developed model successfully predicted porosity distribution across ribbon width; as
presented in Figure 7-8 and Figure 7-9, a high degree of matching could be observed
between predicted and experimentally measured results for almost all cases. However, a
high variation between predicted and experimental results can be observed for
maltodextrin ribbons which were produced using smooth rollers (Figure 7-8). This could
be referred to the thermal sensitivity of this material as it is expected to melt at a relatively
low temperature (Tg ≃ 81℃)[113]. This matched with the observations of ribbon sticking
at equivalent processing conditions (Table 4-4). In extending the current work for better
predictability, a material thermal property such as melting point or glass transition
temperature could be combined with the model inputs to cover any temperature effect
developed upon stress application. Once developed, the ANN model can be used to
predict the effect of various process and material parameters on the heterogeneity of
porosity across ribbon width. To the best of our knowledge, the application of ANN to
predict porosity distribution homogeneity has not been reported yet.
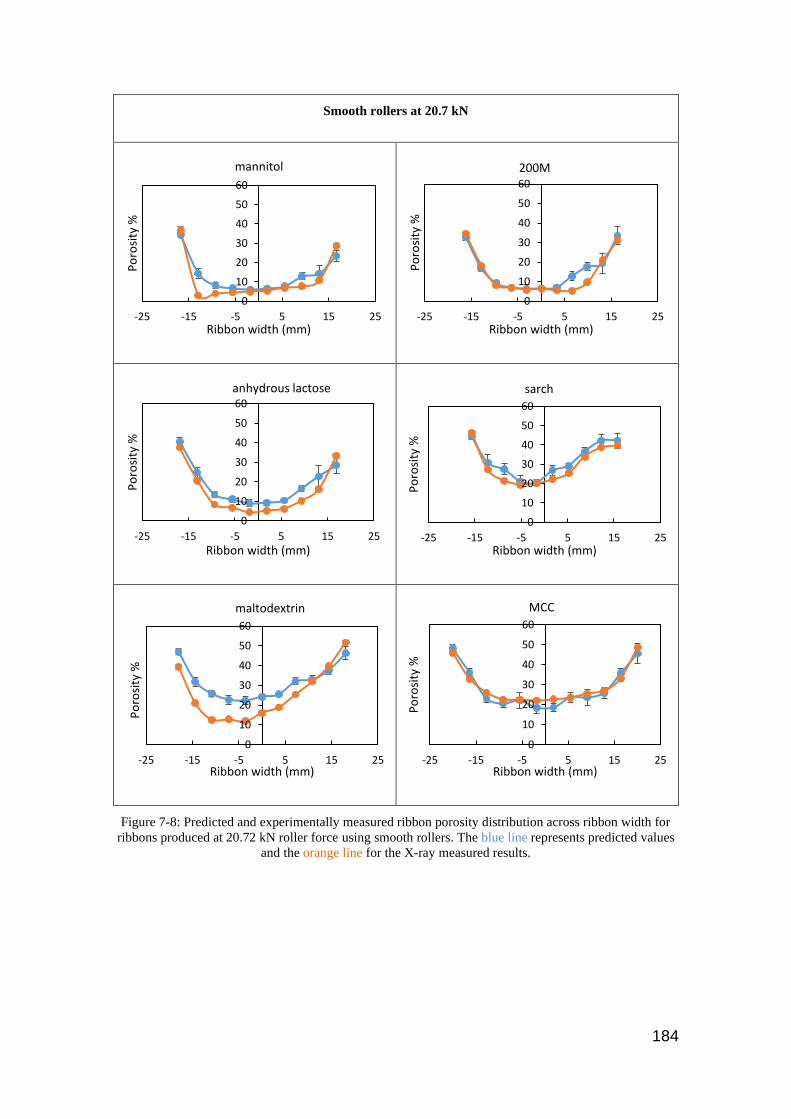
184
Smooth rollers at 20.7 kN
Figure 7-8: Predicted and experimentally measured ribbon porosity distribution across ribbon width for
ribbons produced at 20.72 kN roller force using smooth rollers. The blue line represents predicted values
and the orange line for the X-ray measured results.
0
10
20
30
40
50
60
-25 -15 -5 5 15 25
Po
rosi
ty %
Ribbon width (mm)
mannitol
0
10
20
30
40
50
60
-25 -15 -5 5 15 25
Po
rosi
ty %
Ribbon width (mm)
200M
0
10
20
30
40
50
60
-25 -15 -5 5 15 25
Po
rosi
ty %
Ribbon width (mm)
anhydrous lactose
0
10
20
30
40
50
60
-25 -15 -5 5 15 25
Po
rosi
ty %
Ribbon width (mm)
sarch
0
10
20
30
40
50
60
-25 -15 -5 5 15 25
Po
rosi
ty %
Ribbon width (mm)
maltodextrin
0
10
20
30
40
50
60
-25 -15 -5 5 15 25
Po
rosi
ty %
Ribbon width (mm)
MCC

185
Knurled rollers at 20.7 kN
Figure 7-9: Predicted and experimentally measured ribbon porosity distribution across ribbon width for
ribbons produced at 20.72 kN roller force using knurled rollers. Blueline represents predicted values and
the orange line for the X-ray measured results.
0
10
20
30
40
50
60
-25 -15 -5 5 15 25
Po
rosi
ty %
Ribbon width (mm)
mannitol
0
10
20
30
40
50
60
-25 -15 -5 5 15 25
Po
rosi
ty %
Ribbon width (mm)
200M
0
10
20
30
40
50
60
-25 -15 -5 5 15 25
Po
rosi
ty %
Ribbon width (mm)
anhydrous lactose
0
10
20
30
40
50
60
-25 -15 -5 5 15 25
Po
rosi
ty %
Ribbon width (mm)
starch
0
10
20
30
40
50
60
-25 -15 -5 5 15 25
Po
rosi
ty %
Ribbon width (mm)
maltodextrin
0
10
20
30
40
50
60
-25 -15 -5 5 15 25
Po
rosi
ty %
Ribbon width (mm)
MCC

186
Conclusions
ANN model was successfully developed to predict porosity distribution across ribbon
width. A series of 12 networks were optimised for the best topology and used to link
various material and process parameters with experimentally measured ribbon porosity at
different positions across ribbon width. The developed model showed high robustness,
accuracy, and low processing time so it can be implemented in the manufacturing
controlling system to predict and control ribbon porosity heterogeneity during processing.
In agreement with theoretically develop model, ANN developed model could also be used
improve our understanding about the effect of different material and processing
parameters on the heterogeneity of the produced ribbons which is one of the most
important ribbon quality attributes. This revealed that the developed ANN model is an
attractive tool for the design, optimisation, and scale-up of the roller compaction process,
applicable to the pharmaceutical processing for the achievement of quality-by-design
approach in this industry.

187
CHAPTER 8 GENERAL CONCLUSIONS AND FUTURE
WORK
Conclusions
The phenomenon of ribbon splitting/sticking during roller compaction was investigated
in a comprehensive perspective. Both longitudinal and transversal splitting have been
mapped for their occurrence as a function of yield strength and maximum applied stress
during smooth roller mediated roller compaction. Subsequently, the observed trends of
splitting were rationalised in terms of a splitting index, which is a measure of the stored
elastic ener gy driving fracture relative to the fracture stress of the ribbons. The splitting
index leads to a trend of decreasing no splitting and increasing longitudinal splitting as
the values of this parameter increases. However, the index did not mechanistically
interpret the occurrence of transversal splitting as increasing the index lead to a lower
occurrence of the transversal splitting. This could be due to the index not taking into
account the role of adhesion acting on the ribbons. The observed trend of splitting was
also rationalised in terms of the ratio of roll stress/powder yield strength. An increase in
its value is an indication for a higher level of bonding to occur which could overcome the
adhesion to roller surface and reduce the occurrence transversal splitting. However,
higher values indicate more elastic recovery which can cause longitudinal splitting at
certain levels.
This approach of analysis is a useful means of categorising the data for transversal and
longitudinal splitting. However, in practice, the feed powders are generally multi-
component and the formulation could contain a variety of excipients, APIs and lubricants,
therefore there is a need to investigate its effect on the splitting occurrence and
applicability of splitting index prediction.
A similar map has been developed using knurled rollers; the map showed an increase in
the probability of transversal splitting/roller sticking when compared to the smooth rollers
and reduction in the occurrence of longitudinal splitting. The incorporation of solid
fraction heterogeneity factor in the splitting index successfully enhanced the
predictability for splitting initiation.

188
Powder/metal interaction was further investigated using inverse gas chromatography to
determine the surface energy of the feed powders and steel (roller surface), this was
conducted in an attempt to determine if there is any preferential intermolecular interaction
between the steel surface and the compacted powder that could lead to ribbon
sticking/transversal splitting on the roller surface. No clear correlation between the work
of adhesion/cohesion and sticking probability was found which suggests that particle
deformation/contact area is a dominant factor in sticking during compaction. However,
the results could contribute to the elaboration of the lubrication mechanism of MgSt
during powder compaction as MgSt tends to interact more preferentially with the steel
when compared to the other possible surface interactions.
The work also investigated the use of ANN to predict the porosity distribution across
ribbon width which is a critical factor for the longitudinal splitting occurrence. To benefit
from the contribution of this approach, the constitution of a large database on material
properties is useful. ANN model was successfully developed to predict porosity
distribution across ribbon width. The developed model showed high robustness and
accuracy so that it could be implemented in the manufacturing controlling system to
predict and control ribbon porosity heterogeneity during processing.

189
Future work
1- It was shown in chapter-4 that transversal splitting/sticking is more noticeable with
brittle materials, this was attributed to the insufficient bonding/deformation across ribbon
thickness to overcome the adhesion to the roller surface. Using spherical particles such
as PMMA (Viscoelastic in nature) could help to investigate the different extents of
breakage across ribbon dimensions.
2- It was shown in chapter-5 that the longitudinal splitting is affected by the heterogeneity
of density distribution across ribbon width. It is also of interest to investigate the effect
of improving the homogeneity of density distribution as a mitigating approach to the
occurrence of longitudinal splitting. This can be conducted using curved rollers [181] or
feeding guiders [13].
3- The work involved in chapter-6 showed the thermodynamic work of
cohesion/adhesion is not significant in predicting the sticking behaviour of the materials
after stress application. Therefore, there is a need to compliment the trend of energies of
interaction by taking the change in contact surface area after compaction into account.
This could be done by computational modelling such as DEM. The increase in contact
surface areas as a result of plastic deformation and fragmentation affect the extent of
particle bonding whether it was between the powder particles such as (2, 3, and 4 Figure
8-1) or between the powder particles and touching metal surface (1-Figure 8-1). During
compaction, the stress distribution will always be maximum on the powder/metal
interface and this will cause a higher contact surface area and a higher degree of adhesion
with the metal surface unless the summation of the contact surface areas with the
neighbouring particles is higher (i.e. 2+3+4 > 1). In this case, the particle will detach from
the metal surface.
As it is difficult to model the inter-particle forces using continuum models and at the same
time it is difficult to handle fragmentation of particles using DEM, in the future work the
particle will be treated as an assembly of small cohesive powder particles in order to deal
with particle fragmentation using DEM.
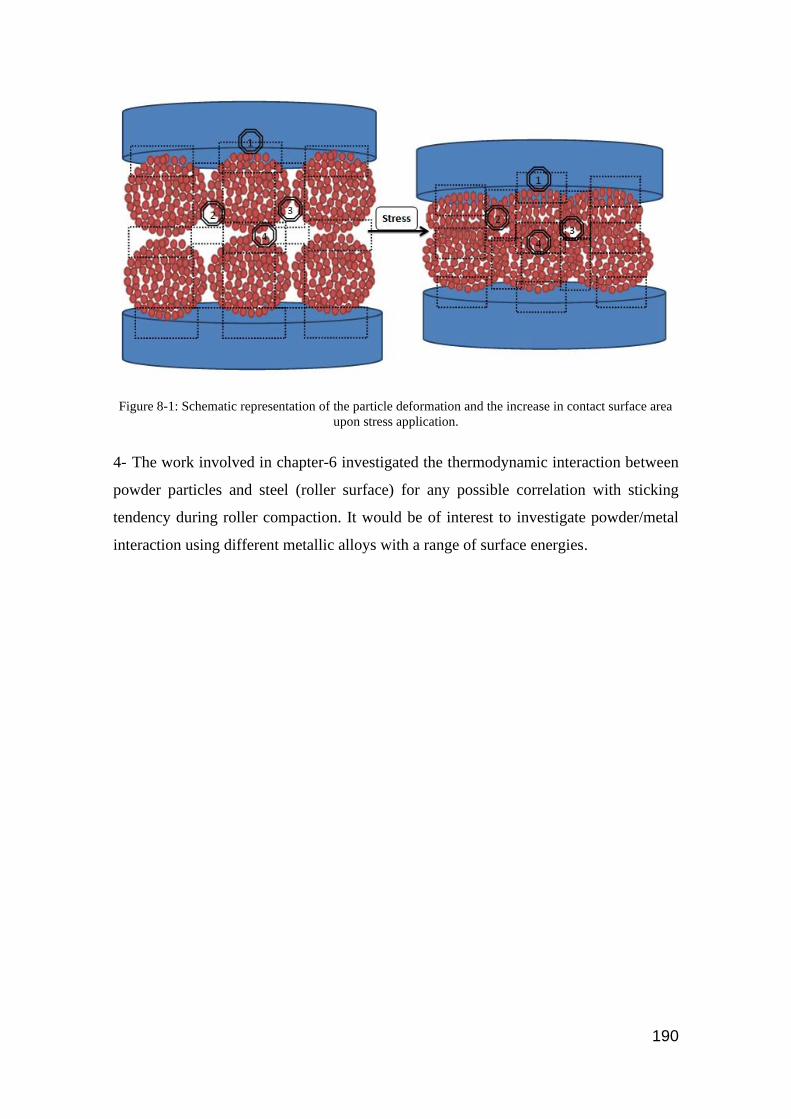
190
Figure 8-1: Schematic representation of the particle deformation and the increase in contact surface area
upon stress application.
4- The work involved in chapter-6 investigated the thermodynamic interaction between
powder particles and steel (roller surface) for any possible correlation with sticking
tendency during roller compaction. It would be of interest to investigate powder/metal
interaction using different metallic alloys with a range of surface energies.

191
REFERENCES
[1] M. Jivraj, L.G. Martini, C.M. Thomson, An overview of the different excipients
useful for the direct compression of tablets, Pharmaceutical Science and
Technology Today. 3 (2000) 58–63.
[2] R.W. Miller, Roller Compaction Technology, in: D.M. Parikh (Ed.), Handbook of
Pharmaceutical Granulation Technology, 2nd ed., Taylor & Francis Group, North
Calorina: Boca Raton, 2005.
[3] P. Guigon, O. Simon, K. Saleh, G. Bindhumadhavan, M.J. Adams, J.P.K. Seville,
Roll Pressing, in: A.D. Salman, M.J. Hounslow, J.P.K. SevillE (Eds.), Handbook
of Powder Technology-Granulation, Elsevier, Amsterdam, 1996.
[4] G. Peck, J.P. Soh, K. Morris, Dry Granulation, in: S.W.H. Larry L. Augsburger
(Ed.), Pharmaceutical Dosage Forms - Tablets, CRC Press, Boca Raton, 2008.
[5] J.C. Cunningham, Experimental studies and modeling of the roller compaction of
pharmaceutical powders. PhD Thesis, Drexel University, 2005.
[6] P. Kleinebudde, Roll compaction/dry granulation: Pharmaceutical applications,
European Journal of Pharmaceutics and Biopharmaceutics. 58 (2004) 317–326.
[7] G. Reynolds, R. Ingale, R. Roberts, S. Kothari, B. Gururajan, Practical application
of roller compaction process modeling, Computers and Chemical Engineering. 34
(2010) 1049–1057.
[8] J. Osborne, Bonding Mechanisms Involved in the Roller Compaction of an
Amorphous Food Material. PhD Thesis., The Uniersity of Sheffield, 2013.
[9] S. Malkowska, K. a. Khan, R. Lentle, J. Marchant, G. Elger, Effect of Re-
Compression on the Properties of Tablets Prepared by Moist Granulation, Drug
Development and Industrial Pharmacy. 9 (1983) 349–361.
[10] C. Sun, M.W. Himmelspach, Reduced tabletability of roller compacted granules
as a result of granule size enlargement, Journal of Pharmaceutical Sciences. 95
(2006) 200–206.
192
[11] P. Guigon, O. Simon, Roll press design - Influence of force feed systems on
compaction, Powder Technology. 130 (2003) 41–48.
[12] A. Michrafy, H. Diarra, J.A. Dodds, M. Michrafy, Experimental and numerical
analyses of homogeneity over strip width in roll compaction, Powder Technology.
206 (2011) 154–160.
[13] M. Yu, C. Omar, A. Schmidt, J.D. Litster, A.D. Salman, Improving feeding powder
distribution to the compaction zone in the roller compaction, European Journal of
Pharmaceutics and Biopharmaceutics. 128 (2018) 57–68.
[14] O. Mahmah, M.J. Adams, C.S. Omar, B. Gururajan, A.D. Salman, Roller
compaction: Ribbon splitting and sticking, International Journal of Pharmaceutics.
559 (2019) 156–172.
[15] I. Akseli, N. Ladyzhynsky, J. Katz, X. He, Development of predictive tools to
assess capping tendency of tablet formulations, Powder Technology. 236 (2013)
139–148.
[16] B.C. Hancock, A.C. Bentham, A. Mills, G.E. Amidon, R. Cameron, S. Best, L.H.
Han, J. Elliott, Numerical Simulation on Pharmaceutical Powder Compaction,
Materials Science Forum. 575–578 (2009) 560–565.
[17] I.C. Sinka, J.C. Cunningham, A. Zavaliangos, Analysis of tablet compaction. II.
Finite element analysis of density distributions in convex tablets, Journal of
Pharmaceutical Sciences. 93 (2004) 2040–2053.
[18] J. Dawes, C. Allenspach, J.F. Gamble, R. Greenwood, P. Robbins, M. Tobyn,
Application of external lubrication during the roller compaction of adhesive
pharmaceutical formulations, Pharmaceutical Development and Technology. 18
(2012) 1–11.
[19] I. Saniocki, New Insights into Tablet Sticking : Characterization and
Quantification of Sticking to Punch Surfaces during Tablet Manufacture by Direct
Compaction. PhD thesis., University of Hamburg, 2014.
[20] J. V Thomas, Evaluation and study on the adhesion of powder onto punch faces
during tablet compaction. PhD Thesis., Drexel University, 2015.

193
[21] R.B. Al Asady, NRoller compaction: Mechanical Properties of Primery Particles,
Pre-compacted Body and Ribbon. PhD Thesiso Title, The University of Sheffield,
2016.
[22] H. Rumpf, The strength of granules and agglomerates, in: Knepper WA (Ed.),
Agglomeration, John Wiley and Sons, New York, 1962: p. 379.
[23] G. Buckton, Pharmaceutical Powder Compaction Technology, in: M. Çelik (Ed.),
Informa, North Carolina, 2016.
[24] G. Buckton, Aulton’s Pharmaceutics: The Design and Manufacture of Medicines,
in: M.E. Aulton, K. Taylor (Eds.), 4th ed., Elsevier, Edinbugh: Churchill
Livingstone, 2013.
[25] J.J. Wang, M. a. Guillot, S.D. Bateman, K.R. Morris, Modeling of Adhesion in
Tablet Compression. II. Compaction Studies Using a Compaction Simulator and
an Instrumented Tablet Press, Journal of Pharmaceutical Sciences. 93 (2004) 407–
417.
[26] F. Waimer, M. Krumme, P. Danz, U. Tenter, P.C. Schmidt, A novel method for
the detection of sticking of tablets., Pharmaceutical Development and Technology.
4 (1999) 359–367.
[27] I.M. Hamdan, G. V. Reklaitis, V. Venkatasubramanian, Exceptional events
management applied to roller compaction of pharmaceutical powders, Journal of
Pharmaceutical Innovation. 5 (2010) 147–160.
[28] J. Dawes, J.F. Gamble, R. Greenwood, P. Robbins, M. Tobyn, An investigation
into the impact of magnesium stearate on powder feeding during roller
compaction., Drug Development and Industrial Pharmacy. 38 (2012) 111–22.
[29] Na. Armstrong, Lubricants, Glidants and Antiadherents, in: S.W.H. Larry L.
Augsburger (Ed.), Pharmaceutical Dosage Forms - Tablets, Third Edition, CRC
Press, Raton, Boca, 2008.
[30] N. Rasenack, B.W. Müller, Crystal habit and tableting behavior, International
Journal of Pharmaceutics. 244 (2002) 45–57.
[31] K. Kakimi, T. Niwa, K. Danjo, Influence of compression pressure and die-wall
194
pressure on tablet sticking, Chemical & Pharmaceutical Bulletin. 131 (2011) 597–
601.
[32] K. Danjo, K. Kamiya, A. Otsuka, Effect of Temperature on the Sticking of Low
Melting Point Materials, Chemical & Pharmaceutical Bulletin. 41 (1993) 1423–
1427.
[33] K. Danjo, S. Kojima, cheng Y. Chen, H. Sunada, Effect of Water Content on
Sticking during Compression, Chemical & Pharmaceutical Bulletin. 45 (1997).
[34] Fridrun Podczeck, Fuundimental of adhesion of particles to surfaces, in: F.
Podczeck (Ed.), Particle-Particle Adhesion in Pharmaceutical Powder Handling,
Iimperial College Press, London, 1998.
[35] S. Berbner, F. Löffler, Influence of high temperatures on particle adhesion, Powder
Technology. 78 (1994) 273–280.
[36] K. Toyoshima, M. Yasumura, N. Ohnishi, Y. Ueda, Quantitative evaluation of
tablet sticking by surface roughness measurement, International Journal of
Pharmaceutics. 46 (1988) 211–215.
[37] S. Paul, K. Wang, L.J. Taylor, B. Murphy, J. Krzyzaniak, N. Dawson, M.P.
Mullarney, P. Meenan, C.C. Sun, Dependence of Punch Sticking on Compaction
Pressure—Roles of Particle Deformability and Tablet Tensile Strength, Journal of
Pharmaceutical Sciences. 106 (2017) 2060–2067.
[38] T. Gengenbach, K.P. Hapgood, J.A. Denman, Q. (Tony) Zhou, D.A. V. Morton,
M. Gamlen, P.J. Stewart, L. Qu, Investigation of the potential for direct
compaction of a fine ibuprofen powder dry-coated with magnesium stearate, Drug
Development and Industrial Pharmacy. 41 (2014) 825–837.
[39] S. Chattoraj, P. Daugherity, T. McDermott, A. Olsofsky, W.J. Roth, M. Tobyn,
Sticking and Picking in Pharmaceutical Tablet Compression: An IQ Consortium
Review, Journal of Pharmaceutical Sciences. 107 (2018) 2267–2282.
[40] A.P. Association, Tableting Specification Manual, 5th ed., American pharmacist
association, Washington, D.C, 2001.
[41] N. Souihi, G. Reynolds, P. Tajarobi, H. Wikström, G. Haeffler, M. Josefson, J.

195
Trygg, Roll compaction process modeling: Transfer between equipment and
impact of process parameters, International Journal of Pharmaceutics. 484 (2015)
192–206.
[42] E. Hadzovic, Roller Compaction of Theophylline. PhD Thesis., The University of
Basel, 2008.
[43] F. Waimer, M. Krumme, P. Danz, U. Tenter, P.C. Chmidt, The Influence of
Engravings on the Sticking of Tablets. Investigations with an Instrumented Upper
Punch, Pharmaceutical Development and Technology. 4 (2002) 369–375.
[44] M. Roberts, J.L. Ford, G.S. MacLeod, J.T. Fell, G.W. Smith, P.H. Rowe, Effects
of surface roughness and chrome plating of punch tips on the sticking tendencies
of model ibuprofen formulations., The Journal of Pharmacy and Pharmacology. 55
(2003) 1223–1228.
[45] R.B. Al-Asady, J.D. Osborne, M.J. Hounslow, A.D. Salman, Roller compactor:
The effect of mechanical properties of primary particles., International Journal of
Pharmaceutics. 496 (2015) 124–136.
[46] S. Abdel-hamid, G. Betz, A novel tool for the prediction of tablet sticking during
high speed compaction, Pharmaceutical Development and Technology. 17 (2012)
747–754.
[47] J.R. Johanson, A Rolling Theory for Granular Solids, Journal of Applied
Mechanics. 32 (1965) 842.
[48] J. Li, Y. Wu, Lubricants in Pharmaceutical Solid Dosage Forms, Lubricants. 2
(2014) 21–43.
[49] M.P. Mullarney, bruce C. MacDonald, A. Hutchins, Assessing Tablet-Sticking
Propensity: weighing accumulated powder on a removable punch tip,
Pharmaceutical Technology. 36 (2012) 57–62.
[50] T.S. McDermott, J. Farrenkopf, A. Hlinak, J.P. Neilly, D. Sauer, A material sparing
method for quantitatively measuring tablet sticking, Powder Technology. 212
(2011) 240–252.
[51] M. Roberts, J.L. Ford, G.S. MacLeod, J.T. Fell, G.W. Smith, P.H. Rowe, A.M.
196
Dyas, Effect of lubricant type and concentration on the punch tip adherence of
model ibuprofen formulations, Journal of Pharmacy and Pharmacology. 56 (2004)
299–305.
[52] S.R. Bechard, G.R.B. Down, Infrared Imaging of Pharmaceutical Materials
Undergoing Compaction, Pharmaceutical Research. 9 (1992) 521–528.
[53] S. Esezobo, N. Pilpel, The effect of temperature on the plasto-elasticity of some
pharmaceutical powders and on the tensile strengths of their tablets, Journal of
Pharmacy and Pharmacology. 38 (1986) 409–413.
[54] A. Zavaliangos, S. Galen, J. Cunningham, D. Winstead, Temperature Evolution
during Compaction of Pharmaceutical Powders, Journal of Pharmaceutical
Sciences. 97 (2007).
[55] M. Cespi, G. Bonacucina, L. Casettari, S. Ronchi, G.F. Palmieri, Effect of
temperature increase during the tableting of pharmaceutical materials,
International Journal of Pharmaceutics. 448 (2013) 320–326.
[56] C.S. Omar, M.J. Hounslow, A.D. Salman, Implementation of an online thermal
imaging to study the effect of process parameters of roller compactor, Drug
Delivery and Translational Research. 8 (2018) 1604–1614.
[57] R. Wiedey, P. Kleinebudde, Potentials and limitations of thermography as an in-
line tool for determining ribbon solid fraction, Powder Technology. 341 (2019) 2–
10.
[58] S.K. Dwivedi, R.J. Oates, A.G. Mitchell, Estimation of Elastic Recovery, Work of
Decompression and Young’s Modulus Using a Rotary Tablet Press, Journal of
Pharmacy and Pharmacology. 44 (1992) 459–466.
[59] C.-Y. Wu, O.M. Ruddy, A.C. Bentham, B.C. Hancock, S.M. Best, J.A. Elliott,
Modelling the mechanical behaviour of pharmaceutical powders during
compaction, Powder Technology. 152 (2005) 107–117.
[60] V. Mazel, V. Busignies, H. Diarra, P. Tchoreloff, Lamination of pharmaceutical
tablets due to air entrapment: Direct visualization and influence of the compact
thickness, International Journal of Pharmaceutics. 478 (2015) 702–704.
197
[61] I. Akseli, D. Dey, C. Cetinkaya, Mechanical Property Characterization of
Bilayered Tablets using Nondestructive Air-Coupled Acoustics, American
Association of Pharmaceutical Scientists. 11 (2010) 90–102.
[62] C.Y. Wu, W.L. Hung, A.M. Miguélez-Morán, B. Gururajan, J.P.K. Seville, Roller
compaction of moist pharmaceutical powders, International Journal of
Pharmaceutics. 391 (2010) 90–97.
[63] M.T.A. Ende, S.K. Moses, A.J. Carella, R.A. Gadkari, T.W. Graul, A.L. Otano,
R.J. Timpano, Improving the content uniformity of a low-dose tablet formulation
through roller compaction optimization, Pharmaceutical Development and
Technology. 12 (2007) 391–404.
[64] J.C. Cunningham, D. Winstead, A. Zavaliangos, Understanding variation in roller
compaction through finite element-based process modeling, Computers and
Chemical Engineering. 34 (2010) 1058–1071.
[65] M.P. Mullarney, B.C. Hancock, Mechanical property anisotropy of pharmaceutical
excipient compacts, International Journal of Pharmaceutics. 314 (2006) 9–14.
[66] S. Paul, C.C. Sun, Gaining insight into tablet capping tendency from compaction
simulation, International Journal of Pharmaceutics. 524 (2017) 111–120.
[67] R. Kuppuswamy, S.R. Anderson, L.L. Augsburger, S.W. Hoag, Estimation of
capping incidence by indentation fracture tests, American Association of
Pharmaceutical Scientists. 3 (2003) 54–65.
[68] F. Ebba, P. Piccerelle, P. Prinderre, D. Opota, J. Joachim, Stress relaxation studies
of granules as a function of different lubricants, European Journal of
Pharmaceutics and Biopharmaceutics. 52 (2001) 211–220.
[69] J. Mosig, P. Kleinebudde, Evaluation of lubrication methods: How to generate a
comparable lubrication for dry granules and powder material for tableting
processes, Powder Technology. 266 (2014) 156–166.
[70] J. Wang, H. Wen, D. Desai, Lubrication in tablet formulations, European Journal
of Pharmaceutics and Biopharmaceutics. 75 (2010) 1–15.
[71] H. Takeuchi, S. Nagira, M. Aikawa, H. Yamamoto, Y. Kawashima, Effect of
198
lubrication on the compaction properties of pharmaceutical excipients as measured
by die wall pressure, Journal of Drug Delivery Science and Technology. 15 (2015)
177–182.
[72] Z.T. Chowhan, L.H. Chi, Drug‐excipient interactions resulting from powder
mixing IV: Role of lubricants and their effect on in vitro dissolution, Journal of
Pharmaceutical Sciences. 75 (1986) 542–545.
[73] K. Zuurman, K.V. der V. Maarschalk, G.K. Bolhuis, Effect of magnesium stearate
on bonding and porosity expansion of tablets produced from materials with
different consolidation properties, 179 (1999) 107–115.
[74] S.M. Dudhat, C.N. Kettler, R.H. Dave, To Study Capping or Lamination Tendency
of Tablets Through Evaluation of Powder Rheological Properties and Tablet
Mechanical Properties of Directly Compressible Blends, American Association of
Pharmaceutical Scientists. 18 (2016) 1177–1189.
[75] I. Akseli, A. Stecuła, X. He, N. Ladyzhynsky, Quantitative correlation of the effect
of process conditions on the capping tendencies of tablet formulations, Journal of
Pharmaceutical Sciences. 103 (2014) 1652–1663.
[76] S. Inghelbrecht, J.P. Remon, P. Fernandes De Aguiar, B. Walczak, D.L. Massart,
F. Van De Velde, P. De Baets, H. Vermeersch, P. De Backer, Instrumentation of a
roll compactor and the evaluation of the parameter settings by neural networks,
International Journal of Pharmaceutics. 148 (1997) 103–115.
[77] A. Gupta, G.E. Peck, R.W. Miller, K.R. Morris, Effect of the variation in the
ambient moisture on the compaction behavior of powder undergoing roller-
compaction and on the characteristics of tablets produced from the post-milled
granules, Journal of Pharmaceutical Sciences. 94 (2005) 2314–2326.
[78] J.D. Osborne, T. Althaus, L. Forny, G. Niederreiter, S. Palzer, M.J. Hounslow,
A.D. Salman, Investigating the influence of moisture content and pressure on the
bonding mechanisms during roller compaction of an amorphous material,
Chemical Engineering Science. 86 (2013) 61–69.
[79] A. Gupta, G.E. Peck, R.W. Miller, K.R. Morris, Nondestructive Measurements of
the Compact Strength and the Particle-Size Distribution after Milling of Roller

199
Compacted Powders by Near-Infrared Spectroscopy, Journal of Pharmaceutical
Sciences. 93 (2004) 1047–1053.
[80] C.Y. Wu, B.C. Hancock, A. Mills, A.C. Bentham, S.M. Best, J.A. Elliott,
Numerical and experimental investigation of capping mechanisms during
pharmaceutical tablet compaction, Powder Technology. 181 (2008) 121–129.
[81] P.D. Daugherity, J.H. Chu, Investigation of serrated roll surface differences on
ribbon thickness during roller compaction., Pharmaceutical Development and
Technology. 12 (2007) 603–608.
[82] K. Csordas, R. Wiedey, P. Kleinebudde, Impact of roll compaction design, process
parameters, and material deformation behaviour on ribbon relative density, Drug
Development and Industrial Pharmacy. 44 (2018) 1295–1306.
[83] G. Bindhumadhavan, J.P.K. Seville, M.J. Adams, R.W. Greenwood, S. Fitzpatrick,
Roll compaction of a pharmaceutical excipient: Experimental validation of rolling
theory for granular solids, Chemical Engineering Science. 60 (2005) 3891–3897.
[84] R.T. Dec, A. Zavaliangos, J.C. Cunningham, Comparison of various modeling
methods for analysis of powder compaction in roller press, Powder Technology.
130 (2003) 265–271.
[85] B.A. Patel, M.J. Adams, N. Turnbull, A.C. Bentham, C.Y. Wu, Predicting the
pressure distribution during roll compaction from uniaxial compaction
measurements, Chemical Engineering Journal. 164 (2010) 410–417.
[86] M.J. Adams, M.A. Mullier, J.P.K. Seville, Agglomerate strength measurement
using a uniaxial confined compression test, Powder Technology. 78 (1994) 5–13.
[87] T.M. Nejad, C. Foster, D. Gongal, Finite element modelling of cornea mechanics:
A review, Arquivos Brasileiros de Oftalmologia. 77 (2014) 60–65.
[88] A. Michrafy, H. Diarra, J.A. Dodds, M. Michrafy, L. Penazzi, Analysis of strain
stress state in roller compaction process, Powder Technology. 208 (2011) 417–
422.
[89] A.R. Muliadi, J.D. Litster, C.R. Wassgren, Modeling the powder roll compaction
process: Comparison of 2-D finite element method and the rolling theory for

200
granular solids (Johanson’s model), Powder Technology. 221 (2012) 90–100.
[90] A. Mazor, L. Orefice, A. Michrafy, A. de Ryck, J.G. Khinast, A combined DEM
& FEM approach for modelling roll compaction process, Powder Technology. 337
(2018) 3–16.
[91] K. Odagi, T. Tanaka, Y. Tsuji, Compressive Flow Property of Powder in Roll-type
Presses, Journal of the Society of Powder Technology. 38 (2001) 150–159.
[92] J. Zou, Y. Han, S.-S. So, Overview of Artificial Neural Networks, in: David J.
Lvingstone (Ed.), Artificial Neural Networks: Methods and Applications, Humana
Press, Sandown, 2009.
[93] M. Turkoglu, I. Aydin, M. Murray, A. Sakr, Modeling of a roller-compaction
process using neural networks and genetic algorithms, European Journal of
Pharmaceutics and Biopharmaceutics. 48 (1999) 239–45.
[94] M. Sajjia, S. Shirazian, C.B. Kelly, A.B. Albadarin, G. Walker, ANN Analysis of
a Roller Compaction Process in the Pharmaceutical Industry, Chemical
Engineering and Technology. 40 (2017) 487–492.
[95] Y.A. Yusof, A.C. Smith, B.J. Briscoe, Roll compaction of maize powder,
Chemical Engineering Science. 60 (2005) 3919–3931.
[96] N. Armstrong, Handbook Pharmaceutical Excipients, Sixth Edition, in: R.C.
Rowe, P.J. Sheskey, M.E. Quinn (Eds.), Pharmaceutical Press, London, 2009.
[97] M.G. Cares-Pacheco, G. Vaca-Medina, R. Calvet, F. Espitalier, J.J. Letourneau, A.
Rouilly, E. Rodier, Physicochemical characterization of d-mannitol polymorphs:
The challenging surface energy determination by inverse gas chromatography in
the infinite dilution region, International Journal of Pharmaceutics. 475 (2014) 69–
81.
[98] K.D. Foster, The prediction of sticking in dairy powders. PhD Thesis., Massey
University, 2002.
[99] C.S. Omar, R.M. Dhenge, J.D. Osborne, T.O. Althaus, S. Palzer, M.J. Hounslow,
A.D. Salman, Roller compaction: Effect of morphology and amorphous content of
lactose powder on product quality., International Journal of Pharmaceutics. 496

201
(2015) 63–74.
[100] A. Parikh, S. Agarwal, K. Raut, a Review on Applications of Maltodextrin in
Pharmaceutical Industry, International Journal of Pharmacy and Biological
Sciences. 4 (2014) 67–74.
[101] K.M. Picker, S.W. Hoag, Characterization of the thermal properties of
microcrystalline cellulose by modulated temperature differential scanning
calorimetry, Journal of Pharmaceutical Sciences. 91 (2002) 342–349.
[102] R.W. Heckel, Density-Pressure Relationships in Powder Compaction,
Transactions of the Metallurgical Society of AIME. 221 (1961) 671–675.
[103] C. Sun, D.J.W. Grant, Influence of elastic deformation of particles on Heckel
analysis, Pharmaceutical Development and Technology. 6 (2001) 193–200.
[104] J.M. Sonnergaard, A critical evaluation of the Heckel equation, International
Journal of Pharmaceutics. 193 (1999) 63–71.
[105] A. Aburub, D. Mishra, I. Buckner, Use of compaction energetics for understanding
particle deformation mechanism, Pharmaceutical Development and Technology.
12 (2007) 405–414.
[106] J.P. Holman, Heat Transfer, McGraw-Hill, New York, 2010.
[107] G.M. Elmasry, S. Nakauchi, Image analysis operations applied to hyperspectral
images for non-invasive sensing of food quality - A comprehensive review,
Biosystems Engineering. 142 (2015) 53–82.
[108] J. Moor, Application of NIR Imaging and multivariate data analysis for
pharmaceutical products. Diploma Thesis., University of Applied Sciences
Munchen, 2010.
[109] A. Gerich, J. Dubois, L.H. Kidder, NIR Imaging Applications in the
Pharmaceutical Industry, in: S. Sasic, Y. Ozaki (Eds.), Raman, Infrared, and Near
Infrared Chemical Imaging, WILEY, New Jersey, 2010.
[110] C. Mangwandi, Y.S. Cheong, M.J. Adams, M.J. Hounslow, A.D. Salman, The
coefficient of restitution of different representative types of granules, Chemical
202
Engineering Science. 62 (2007) 437–450.
[111] R.B. Al Asady, M.J. Hounslow, A.D. Salman, Roller compaction: the effect of
plastic deformation of primary particles with wide range of mechanical properties,
Drug Delivery and Translational Research. 8 (2018) 1615–1634.
[112] C.K. Chang, F.A. Alvarez–Nunez, J. V. Rinella Jr., L.-E. Magnusson, K. Sueda,
Roller Compaction, Granulation and Capsule Product Dissolution of Drug
Formulations Containing a Lactose or Mannitol Filler, Starch, and Talc, American
Association of Pharmaceutical Scientists. 9 (2008) 597–604.
[113] N. Castro, V. Durrieu, C. Raynaud, A. Rouilly, Influence of DE-value on the
physicochemical properties of maltodextrin for melt extrusion processes,
Carbohydrate Polymers. 144 (2016) 464–473.
[114] A.M. Miguélez-Morán, C.Y. Wu, H. Dong, J.P.K. Seville, Characterisation of
density distributions in roller-compacted ribbons using micro-indentation and X-
ray micro-computed tomography, European Journal of Pharmaceutics and
Biopharmaceutics. 72 (2009) 173–182.
[115] W. Johnson, P.B. Mellor, Engineering plasticity, in: Van Nostrand-Reinhold,
London, 1973.
[116] M.J. Adams, I. Aydin, B.J. Briscoe, S.K. Sinha, A finite element analysis of the
squeeze flow of an elasto-viscoplastic paste material, Journal of Non-Newtonian
Fluid Mechanics. 71 (1997) 41–57.
[117] G. Frenning, J. Nordström, G. Alderborn, Effective Kawakita parameters for
binary mixtures, Powder Technology. 189 (2009) 270–275.
[118] P.J. Sheskey, J. Hendren, The effects of roll compaction equipment variables,
granulation technique, and HPMC polymer level on a controlled-release matrix
model drug formulation, Pharmaceutical Technology. 23 (1999) 90–106.
[119] H. Lim, V.S. Dave, L. Kidder, E. Neil Lewis, R. Fahmy, S.W. Hoag, Assessment
of the critical factors affecting the porosity of roller compacted ribbons and the
feasibility of using NIR chemical imaging to evaluate the porosity distribution,
International Journal of Pharmaceutics. 410 (2011) 1–8.

203
[120] D. Markl, A. Strobel, R. Schlossnikl, J. Bøtker, P. Bawuah, C. Ridgway, J.
Rantanen, T. Rades, P. Gane, K.E. Peiponen, J.A. Zeitler, Characterisation of pore
structures of pharmaceutical tablets: A review, International Journal of
Pharmaceutics. 538 (2018) 188–214.
[121] A.A. Gowen, C.P.O. Donnell, P.J. Cullen, G. Downey, J.M. Frias, Hyperspectral
imaging - an emerging process analytical tool for food quality and safety control,
Trends in Food Science & Technology. 18 (2007) 590–598.
[122] A.A. Gowen, C.P. O’Donnell, J.C. P, S.E.J. Bell, Recent applications of Chemical
Imaging to pharmaceutical process monitoring and quality control, European
Journal of Pharmaceutics and Biopharmaceutics. 69 (2008) 10–22.
[123] H. Ma, C. Anderson, Characterization of Pharmaceutical Powder Blends by NIR
Chemical Imaging, Journal of Pharmaceutical Sciences. 97 (2008) 3305–3320.
[124] L.R. Hilden, C.J. Pommier, S.I.F. Badawy, E.M. Friedman, NIR chemical imaging
to guide / support BMS-561389 tablet formulation development, International
Journal of Pharmaceutics. 353 (2008) 283–290.
[125] J. Ropero, Y. Colón, B. Johnson-Restrepo, R.J. Romañch, Near-infrared chemical
imaging slope as a new method to study tablet compaction and tablet relaxation,
Applied Spectroscopy. 65 (2011) 459–465.
[126] M. Khorasani, J.M. Amigo, J. Sonnergaard, P. Olsen, P. Bertelsen, J. Rantanen,
Visualization and prediction of porosity in roller compacted ribbons with near-
infrared chemical imaging (NIR-CI), Journal of Pharmaceutical and Biomedical
Analysis. 109 (2015) 11–17.
[127] M.B. Lopes, J. Wolff, Investigation into classification / sourcing of suspect
counterfeit Heptodin TM tablets by near infrared chemical imaging, Analytica
Chimica Acta. 633 (2009) 149–155.
[128] O. Ye, L.P. Houmøller, A.L. Pomerantsev, P. Geladi, J. Burger, V.L. Dorofeyev,
A.P. Arzamastsev, NIR spectrometry for counterfeit drug detection A feasibility
study, Analytica Chimica Acta. 549 (2005) 151–158.
[129] W. Wang, J. Paliwal, Correction of Curvature-Induced Spectral Variability in

204
Hyperspectral Images of Wheat Kernels, in: ASAE Annual International Meeting.
Paper Number: 053070., Tampa, Florida, 2005.
[130] J.B. Phillips, H. Eliasson, Camera Image Quality Benchmarking, WILEY, West
Sussex, 2018.
[131] M. Khorasani, J.M. Amigo, P. Bertelsen, C.C. Sun, J. Rantanen, Process
optimization of dry granulation based tableting line: Extracting physical material
characteristics from granules, ribbons and tablets using near-IR (NIR)
spectroscopic measurement, Powder Technology. 300 (2016) 120–125.
[132] M. Donoso, D.O. Kildsig, E.S. Ghaly, Prediction of Tablet Hardness and Porosity
Using Near-Infrared Diffuse Reflectance Spectroscopy as a Nondestructive
Method, 8 (2003) 357–366.
[133] M. Khorasani, J.M. Amigo, C.C. Sun, P. Bertelsen, J. Rantanen, Near-infrared
chemical imaging (NIR-CI) as a process monitoring solution for a production line
of roll compaction and tableting, European Journal of Pharmaceutics and
Biopharmaceutics. 93 (2015) 293–302.
[134] N. Souihi, D. Nilsson, M. Josefson, J. Trygg, Near-infrared chemical imaging (
NIR-CI ) on roll compacted ribbons and tablets – multivariate mapping of physical
and chemical properties, International Journal of Pharmaceutics. 483 (2015) 200–
211.
[135] G. Reich, Near-infrared spectroscopy and imaging : Basic principles and
pharmaceutical applications, Advanced Drug Delivery Reviews. 57 (2005) 1109–
1143.
[136] J.J. Wang, T. Li, S.D. Bateman, R. Erck, K.R. Morris, Modeling of adhesion in
tablet compression-I. Atomic force microscopy and molecular simulation., Journal
of Pharmaceutical Sciences. 92 (2003) 798–814.
[137] M.B. Tejedor, N. Nordgren, M. Schuleit, M.W. Rutland, A. Millqvist-Fureby,
Tablet mechanics depend on nano and micro scale adhesion, lubrication and
structure, International Journal of Pharmaceutics. 486 (2015) 315–323.
[138] R. Matjie, S. Zhang, Q. Zhao, N. Mabuza, J.R. Bunt, Tailored surface energy of
205
stainless steel plate coupons to reduce the adhesion of aluminium silicate deposit,
Fuel. 181 (2016) 573–578.
[139] I.M. Grimsey, J.C. Feeley, P. York, Analysis of the surface energy of
pharmaceutical powders by inverse gas chromatography, Journal of
Pharmaceutical Sciences. 91 (2002) 571–583.
[140] R.C. Rowe, Binder-substrate interactions in granulation: a theoretical approach
based on surface free energy and polarity, International Journal of Pharmaceutics.
52 (1989) 149–154.
[141] L. Zajic, G. Buckton, The use of surface energy values to predict optimum binder
selection for granulations, International Journal of Pharmaceutics. 59 (1990) 155–
164.
[142] J.C. Hooton, C.S. German, M.C. Davies, C.J. Roberts, A comparison of
morphology and surface energy characteristics of sulfathiazole polymorphs based
upon single particle studies, European Journal of Pharmaceutical Sciences. 28
(2006) 315–324.
[143] F. Fichtner, D. Mahlin, K. Welch, S. Gaisford, G. Alderborn, Effect of surface
energy on powder compactibility, Pharmaceutical Research. 25 (2008) 2750–2759.
[144] B. Strzemiecka, A. Voelkel, Estimation of the work of adhesion by means of
inverse gas chromatography for polymer complex systems, International Journal
of Adhesion and Adhesives. 38 (2012).
[145] T. Young, An Essay on the Cohesion of Fluids, Philosophical Transactions of the
Royal Society of London. 95 (2016) 65–87.
[146] Ż. Marian, Methods for the calculation of surface free energy of solids, JOurnal of
Achievements in Materials and Manufacturing Engineering. 24 (2007).
[147] J.Y.Y. Heng, D.R. Williams, Microscopy, in: R.A. Storey, I. Ymen (Eds.), Solid
State Characterization of Pharmaceuticals, WILEY, Chichester, 2011.
[148] M. Bunker, J. Zhang, R. Blanchard, C.J. Roberts, Characterising the surface
adhesive behavior of tablet tooling components by atomic force microscopy, Drug
Development and Industrial Pharmacy. 37 (2011) 875–885.

206
[149] C. Al-Karawi, C.S. Leopold, A comparative study on the sticking tendency of
ibuprofen and ibuprofen sodium dihydrate to differently coated tablet punches,
European Journal of Pharmaceutics and Biopharmaceutics. 128 (2018) 107–118.
[150] D. Weber, Y. Pu, C.L. Cooney, Quantification of lubricant activity of magnesium
stearate by atomic force microscopy, Drug Development and Industrial Pharmacy.
34 (2008) 1097–1099.
[151] R. Ho, J.Y.Y. Heng, A review of inverse gas chromatography and its development
as a tool to characterize anisotropic surface properties of pharmaceutical solids,
KONA Powder and Particle Journal. 30 (2012) 164–180.
[152] G. Steele, T. Austin, Pharmaceutical Preformulation and Formulation edited by,
in: M. Gibson (Ed.), Informa, New York, 2009.
[153] S. Mohammadi-Jam, K.E. Waters, Inverse gas chromatography applications: A
review, Advances in Colloid and Interface Science. 212 (2014) 21–44.
[154] A. Newman, Physical Characterization of Pharmaceutical Solids, in: H.G. Brittain
(Ed.), Marcel Dekker, New Jersey, 1995.
[155] P.A. Webb, Surface area, porosity, and related physical characteristics, in: L.L.
Augsburger, S.W. Hoag (Eds.), PHARMACEUTICAL DOSAGE FORMS:
TABLETS, Third, Informa, Boca Raton, 2008.
[156] P.N. Jacob, J.C. Berg, A comparison of the work of adhesion obtained from wetting
and vapor adsorption measurements, The Journal of Adhesion. 54 (1995) 115–131.
[157] D. Hansford, D.J.W. Grant, N. J, M, The Influence of Processing phobic Powder,
Powder Technology. 26 (1980) 119–126.
[158] Y. Yuan, T.R. Lee, Contact Angle and Wetting Properties, in: G. Bracco, B. Holst
(Eds.), Surface Science Techniques, Springer, New York, 2013.
[159] J.L. Hutter, J. Bechhoefer, Calibration of atomic-force microscope tips, Review of
Scientific Instruments. 64 (1993) 1868–1873.
[160] E. Hadjittofis, G.G.Z. Zhang, J.Y.Y. Heng, Influence of sample preparation on
IGC measurements: the cases of silanised glass wool and packing structure, RSC
207
Advances. 7 (2017) 12194–12200.
[161] S.S.M. Ali, J.Y.Y. Heng, A.A. Nikolaev, K.E. Waters, Introducing inverse gas
chromatography as a method of determining the surface heterogeneity of minerals
for flotation, Powder Technology. 249 (2013) 373–377.
[162] G.L. Klein, G. Pierre, M.N. Bellon-Fontaine, M. Graber, Inverse gas
chromatography with film cell unit: An attractive alternative method to
characterize surface properties of thin films, Journal of Chromatographic Science.
53 (2015) 1–6.
[163] S.C. Das, Q. Zhou, D.A. V Morton, I. Larson, P.J. Stewart, Use of surface energy
distributions by inverse gas chromatography to understand mechanofusion
processing and functionality of lactose coated with magnesium stearate, European
Journal of Pharmaceutical Sciences. 43 (2011) 325–333.
[164] F. Thielmann, D.J. Burnett, J.Y.Y. Heng, Determination of the surface energy
distributions of different processed lactose, Drug Development and Industrial
Pharmacy. 33 (2007) 1240–1253.
[165] D.F. Steele, R.C. Moreton, J.N. Staniforth, P.M. Young, M.J. Tobyn, S. Edge,
Surface Energy of Microcrystalline Cellulose Determined by Capillary Intrusion
and Inverse Gas Chromatography, American Association of Pharmaceutical
Scientists. 10 (2008) 494–503.
[166] O. Planinšek, J. Zadnik, Š. Rozman, M. Kunaver, R. Dreu, S. Srčič, Influence of
inverse gas chromatography measurement conditions on surface energy parameters
of lactose monohydrate, International Journal of Pharmaceutics. 256 (2003) 17–
23.
[167] I.M. Grimsey, M. Sunkersett, J.C. Osborn, P. York, R.C. Rowe, Interpretation of
the differences in the surface energetics of two optical forms of mannitol by inverse
gas chromatography and molecular modelling, International Journal of
Pharmaceutics. 191 (1999) 43–50.
[168] T. Tay, S. Das, P. Stewart, Magnesium stearate increases salbutamol sulphate
dispersion: What is the mechanism?, International Journal of Pharmaceutics. 383
(2010) 62–69.
208
[169] D. Steven Keller, P. Luner, Surface energetics of calcium carbonates using inverse
gas chromatography, Colloids and Surfaces A: Physicochemical and Engineering
Aspects. 161 (2000) 401–415.
[170] S. Ebnesajjad, C.F. Ebnesajjad, Surface Tension and Its Measurement, in: Surface
Treatment of Materials for Adhesive Bonding, 2nd ed., Elsevier, Oxford, 2014.
[171] C.C. Sun, Decoding powder tabletability: Roles of particle adhesion and plasticity,
Journal of Adhesion Science and Technology. 25 (2011) 483–499.
[172] I. Gabbott, Designer granules : Beating the trade-off between granule Strength and
Dissolution Time. PhD thesis, University of Sheffield, 2007.
[173] F. Aqra, A. Ayyad, Surface energies of metals in both liquid and solid states,
Applied Surface Science. 257 (2011) 6372–6379.
[174] P. Kleinebudde, Roll compaction/dry granulation: Pharmaceutical applications,
European Journal of Pharmaceutics and Biopharmaceutics. 58 (2004) 317–326.
[175] A.R. Muliadi, J.D. Litster, C.R. Wassgren, Validation of 3-D finite element
analysis for predicting the density distribution of roll compacted pharmaceutical
powder, Powder Technology. 237 (2013) 386–399.
[176] A. Mesbah, J.A. Paulson, R. Lakerveld, R.D. Braatz, Model Predictive Control of
an Integrated Continuous Pharmaceutical Manufacturing Pilot Plant, Organic
Process Research and Development. 21 (2017) 844–854.
[177] G.M.W. Saeed Shirazian, Manuel Kuhs, Shaza Darwish, Denise Croker, Artificial
neural network modelling of continuous wet granulation using a twin-screw
extruder, Science and Technology of Advanced Materials. 16 (2017) 102–109.
[178] S. Shanmuganathan, Artificial Neural Netwok Modelling, in: S. Samarasinghe
(Ed.), Studies in Computational Intelligence, Springer, Warsaw, 2016.
[179] Z. Abdullah, Z. Ahmad, N. Aziz, Multiple input-single output (MISO)
Feedforward Artificial Neural network (FANN) models for pilot plant binary
distillation column, Proceedings - 2011 6th International Conference on Bio-
Inspired Computing: Theories and Applications, BIC-TA 2011. (2011) 157–160.

209
[180] M.F. Møller, A scaled conjugate gradient algorithm for fast supervised learning,
Neural Networks. 6 (1993) 525–533.
[181] C.S. Omar, R.B. Al-Asady, A.D. Salman, Roller compaction: Improving the
homogeneity of ribbon properties along the roller width, Powder Technology. 342
(2019) 464–474.
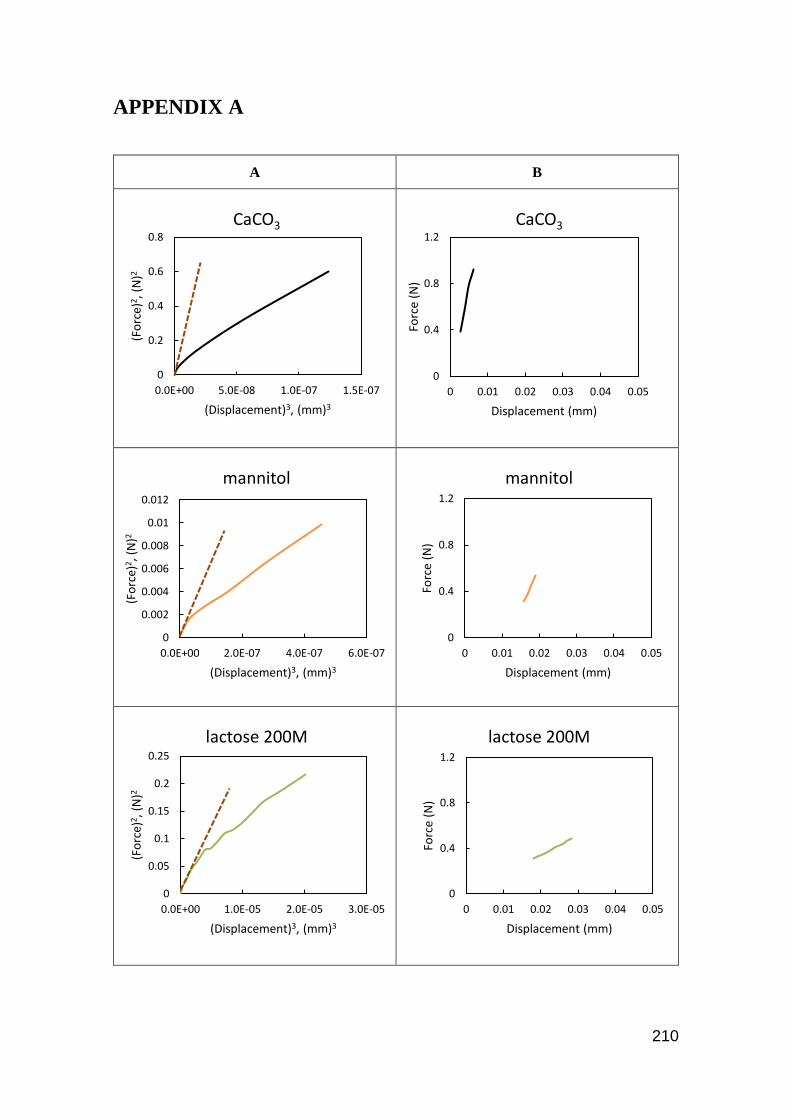
210
APPENDIX A
A B
0
0.2
0.4
0.6
0.8
0.0E+00 5.0E-08 1.0E-07 1.5E-07
(Fo
rce)
2, (
N)2
(Displacement)3, (mm)3
CaCO3
0
0.4
0.8
1.2
0 0.01 0.02 0.03 0.04 0.05
Forc
e (N
)Displacement (mm)
CaCO3
0
0.002
0.004
0.006
0.008
0.01
0.012
0.0E+00 2.0E-07 4.0E-07 6.0E-07
(Fo
rce)
2, (
N)2
(Displacement)3, (mm)3
mannitol
0
0.4
0.8
1.2
0 0.01 0.02 0.03 0.04 0.05
Forc
e (N
)
Displacement (mm)
mannitol
0
0.05
0.1
0.15
0.2
0.25
0.0E+00 1.0E-05 2.0E-05 3.0E-05
(Fo
rce)
2 , (
N)2
(Displacement)3, (mm)3
lactose 200M
0
0.4
0.8
1.2
0 0.01 0.02 0.03 0.04 0.05
Forc
e (N
)
Displacement (mm)
lactose 200M
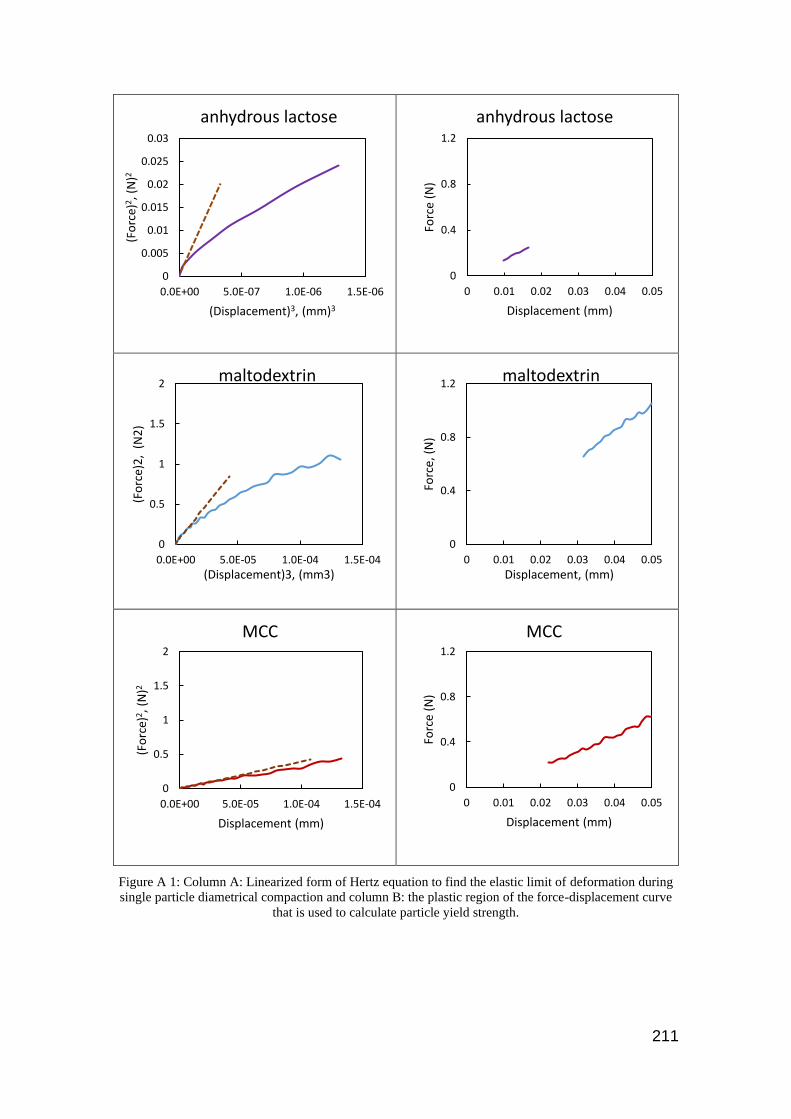
211
Figure A 1: Column A: Linearized form of Hertz equation to find the elastic limit of deformation during
single particle diametrical compaction and column B: the plastic region of the force-displacement curve
that is used to calculate particle yield strength.
0
0.005
0.01
0.015
0.02
0.025
0.03
0.0E+00 5.0E-07 1.0E-06 1.5E-06
(Fo
rce)
2 , (
N)2
(Displacement)3, (mm)3
anhydrous lactose
0
0.4
0.8
1.2
0 0.01 0.02 0.03 0.04 0.05
Forc
e (N
)
Displacement (mm)
anhydrous lactose
0
0.5
1
1.5
2
0.0E+00 5.0E-05 1.0E-04 1.5E-04
(Fo
rce)
2,
(N2
)
(Displacement)3, (mm3)
maltodextrin
0
0.4
0.8
1.2
0 0.01 0.02 0.03 0.04 0.05
Forc
e, (
N)
Displacement, (mm)
maltodextrin
0
0.5
1
1.5
2
0.0E+00 5.0E-05 1.0E-04 1.5E-04
(Fo
rce)
2 , (
N)2
Displacement (mm)
MCC
0
0.4
0.8
1.2
0 0.01 0.02 0.03 0.04 0.05
Forc
e (N
)
Displacement (mm)
MCC

212
CaCO3 mannitol
200M starch
maltodextrin MCC
Figure A 2: Typical stress-strain data for the studied feed powder during uniaxial compaction test. The
blue line represents the best fit to equation (Equation 2-14), and the black line shows compaction profile.
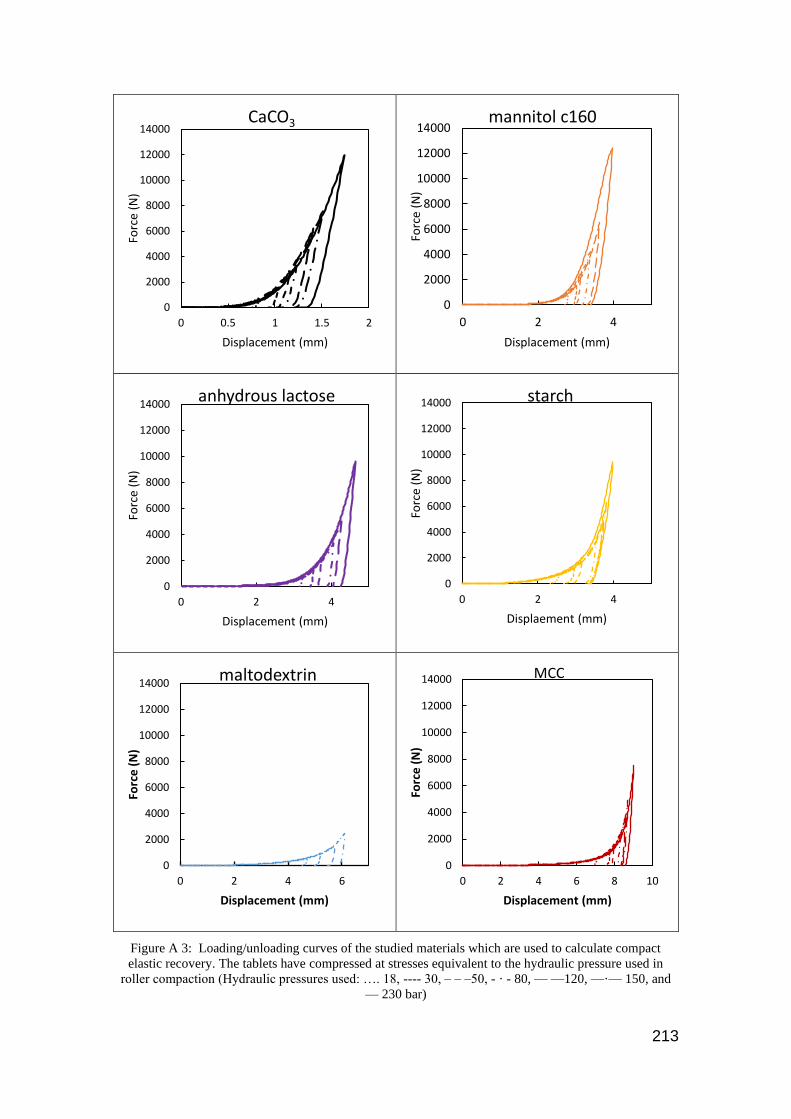
213
Figure A 3: Loading/unloading curves of the studied materials which are used to calculate compact
elastic recovery. The tablets have compressed at stresses equivalent to the hydraulic pressure used in
roller compaction (Hydraulic pressures used: …. 18, ---- 30, ‒ ‒ ‒50, - · - 80, — —120, —·— 150, and
— 230 bar)
0
2000
4000
6000
8000
10000
12000
14000
0 0.5 1 1.5 2
Forc
e (N
)
Displacement (mm)
CaCO3
0
2000
4000
6000
8000
10000
12000
14000
0 2 4
Forc
e (N
)
Displacement (mm)
mannitol c160
0
2000
4000
6000
8000
10000
12000
14000
0 2 4
Forc
e (N
)
Displacement (mm)
anhydrous lactose
0
2000
4000
6000
8000
10000
12000
14000
0 2 4
Forc
e (N
)
Displaement (mm)
starch
0
2000
4000
6000
8000
10000
12000
14000
0 2 4 6
Forc
e (
N)
Displacement (mm)
maltodextrin
0
2000
4000
6000
8000
10000
12000
14000
0 2 4 6 8 10
Forc
e (
N)
Displacement (mm)
MCC
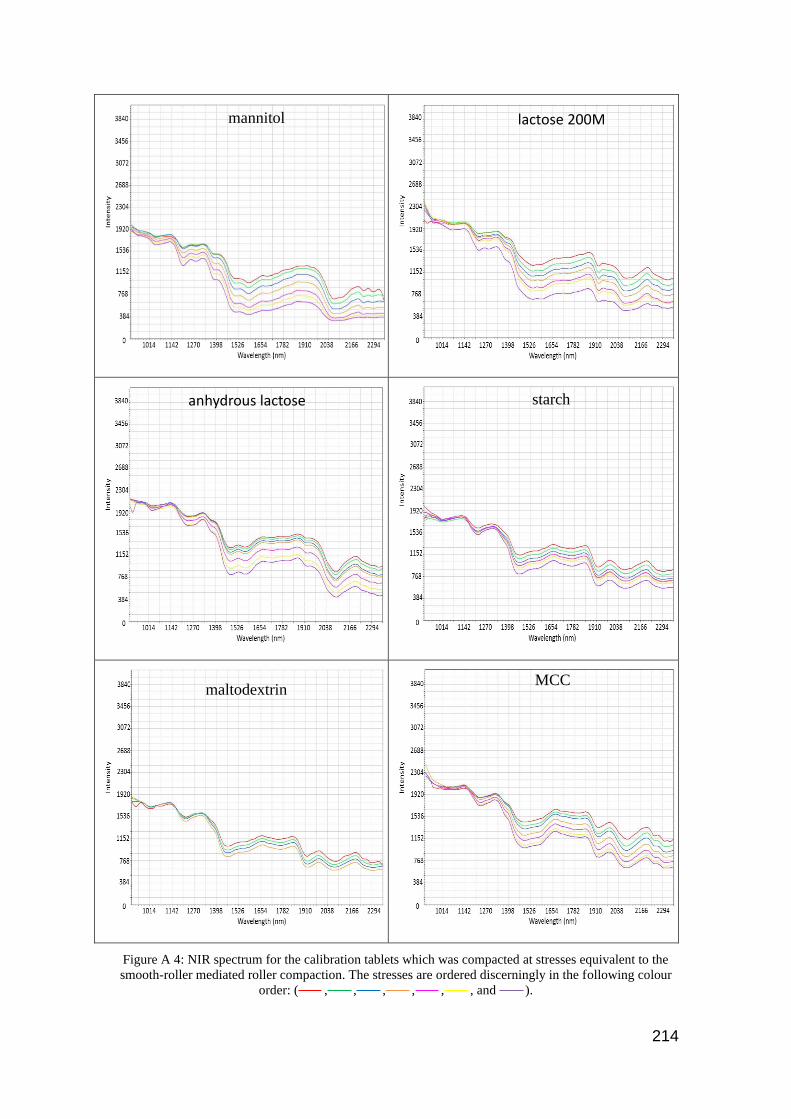
214
Figure A 4: NIR spectrum for the calibration tablets which was compacted at stresses equivalent to the
smooth-roller mediated roller compaction. The stresses are ordered discerningly in the following colour
order: ( , , , , , , and ).
lactose 200M
anhydrous lactose
mannitol
starch
maltodextrin MCC
mannitol

215
mannitol
anhydrous lactose
starch

216
maltodextrin
MCC
Figure A 5: NIR-CI porosity maps of studied materials; calibration tablets (top) and roller compacted
ribbons (bottom).

217
Output 1 Output 2
Output 3 Output 4
Output 6 Output 7
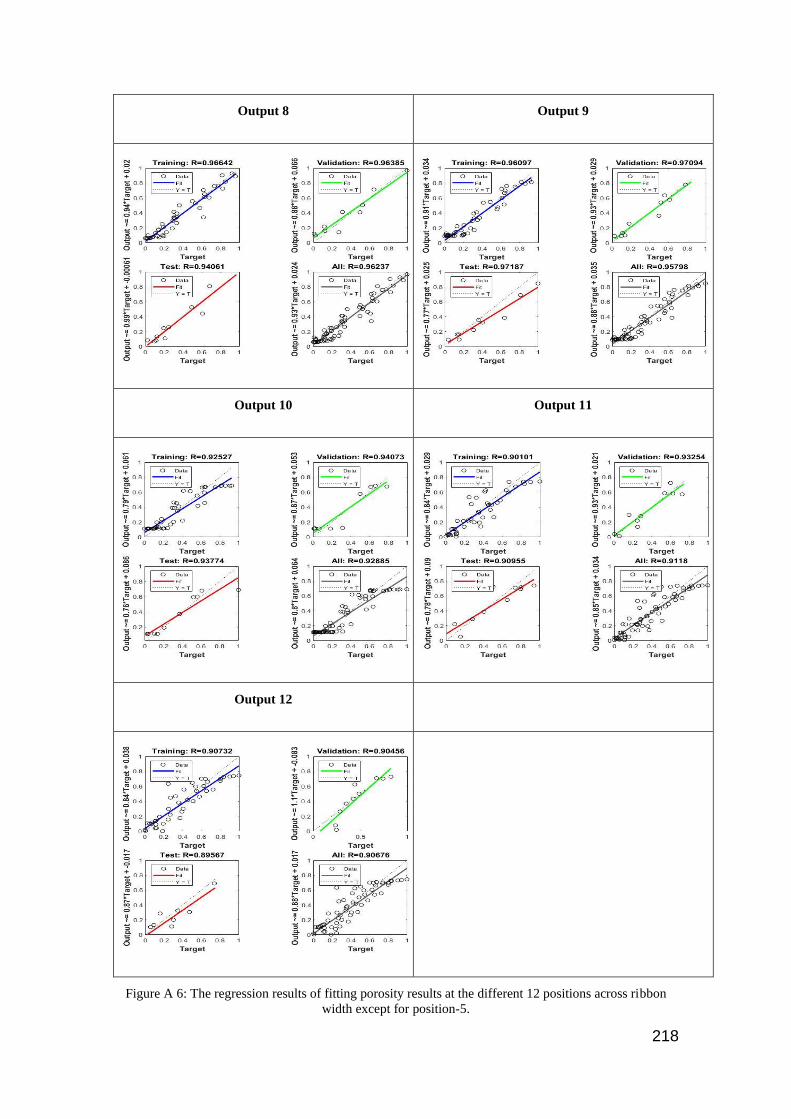
218
Output 8 Output 9
Output 10 Output 11
Output 12
Figure A 6: The regression results of fitting porosity results at the different 12 positions across ribbon
width except for position-5.


220
Table A 1: Experimental data used to build an artificial neural network.
Input conditions
Output- porosity %
I Yield
strength
Roller
force (kN)
Internal
friction
Wall
friction (k)
0 233 7.5 39.3 10.3 10.3 32.8 22 17.1 14.4 12.6 14 16.6 21.5 26.5 31.6 0 0
0 233 12.4 39.3 10.3 10.3 33 22.8 13.4 10.7 9.5 8.7 8.4 9.8 13.2 17.2 31.9 0
0 233 20.7 39.3 10.3 10.3 36.9 3 4 4.5 4.8 5.5 6.9 7.8 10.9 28.8 0 0
0 233 33.2 39.3 10.3 10.3 35.9 1.4 1.3 1.4 1.1 1 1.9 4.2 12.3 18 0 0
0 233 49.8 39.3 10.3 10.3 35.3 9.1 2.9 2.7 0.8 2.4 1.4 4.5 2.2 2.7 5.3 25.6
0 233 62.2 39.3 103 10.3 33 5.1 2.0 0.9 0.5 2.1 0.7 1.6 1.8 3.2 13.8 30.4
0 200 7.5 46.3 16.8 12.7 37.4 25.7 17.6 15.4 14.5 13.5 16 20.2 35.6 0 0 0
0 200 12.4 46.3 16.8 12.7 30 19.2 12.7 11.1 10.1 11.1 14.1 20 36 0 0 0
0 200 20.7 46.3 16.8 12.7 34.5 18.1 8.2 7 5.8 6.4 5.7 5.3 9.7 21 31.3 0
0 200 33.2 46.3 16.8 12.7 28 10 3.6 1.8 0.8 1.3 1.7 3 5 13.8 32.1 0
0 200 49.8 46.3 16.8 12.7 34.4 14.1 6.1 3.4 3.2 2.3 1.9 2.9 4.3 10.3 17.2 33.9
0 200 62.2 46.3 16.8 12.7 26.2 2.7 1.1 1.2 1.5 1.3 0.3 0.1 2.3 4.8 32.3 0
0 182 7.5 40.6 13.6 8.8 47.6 40.3 34.5 30.9 27.9 27 28.9 35.7 43.8 0 0 0
0 182 12.4 40.6 13.6 8.8 43.4 34.8 27.9 25.8 26.9 27.5 29 33.3 39.7 0 0 0
0 182 20.7 40.6 13.6 8.8 37.6 20.6 8.4 6.7 4.5 5.3 6.1 10.4 16.3 33.4 0 0
0 182 33.2 40.6 13.6 8.8 38 23.1 10.1 2.5 1.1 0.4 1.1 4.4 13.3 23.2 33.8 0
0 182 49.8 40.6 13.6 8.8 39.2 12.7 4.6 2.5 2.7 3.3 4 2.8 4.1 9.9 36.1 0
0 182 62.2 40.6 13.6 8.8 42 17.1 5.5 2.8 0.7 0.1 1.1 2.4 2.8 6.8 21.8 44.2

221
0 123 12.4 34.2 9.5 8.4 44.4 30.8 30.7 28.4 30.8 32.6 35.5 39.7 43.4 0 0 0
0 123 20.7 34.2 9.5 8.4 46.3 27.4 21.5 19.5 20.0 22.2 25.5 33.8 38.8 39.9 0 0
0 123 33.2 34.2 9.5 8.4 42.3 32.3 24.7 12.5 12 13 18.4 26 41.1 0 0 0
0 123 49.8 34.2 9.5 8.4 39.9 16.8 5.4 3 1.5 4.7 5.3 7.7 12.5 22.6 39.4 0
0 123 62.2 34.2 9.5 8.4 40.8 19.9 6.7 2.8 2.4 1 3.2 3.1 4 10.3 40.5 0
0 81 7.5 40.0 10.2 6.0 52.2 44.2 39.7 38.4 37.3 37.9 39.0 40 42.4 46.4 52.2 0
0 81 12.4 40.0 10.2 6.0 50.2 43.1 35.4 31.6 29 27.5 27.7 30 35.6 41.6 50.9 0
0 81 20.7 40.0 10.2 6.0 39.3 21.0 12.5 12.8 11.9 16.1 18.9 25.3 32.2 39.8 51.7 0
0 69 7.5 44.5 6.9 5.3 55.5 43.5 38.1 36.6 36.6 36.6 36.8 36.9 37.4 39.9 47.4 0
0 69 12.4 44.5 6.9 5.3 53.2 43.1 38 32.5 30.1 30.2 27.9 26.4 27.7 30.8 39.7 48.9
0 69 20.7 44.5 6.9 5.3 46 32.9 25.9 22.5 22.5 22.2 22.7 23.4 25.5 27 33.1 48.7
0 69 33.2 44.5 6.9 5.3 45.9 26.9 17.3 12.4 9.7 8.6 8.2 9 10.6 13 20.8 40.3
0 69 49.8 44.5 6.9 5.3 45.8 21.6 12 10.4 8.6 8.3 9.3 9.2 8.9 13.1 23.1 43.9
0 69 62.2 44.5 6.9 5.3 43.2 19.6 9.7 7.2 6.1 6.5 7.1 11.1 7.9 8.4 12.3 49.7
1 233 7.5 39.3 31.6 10.3 36.7 31.0 26.3 25.1 22.3 23.3 23.7 26.2 28.3 30.2 35.5 0
1 233 12.4 39.3 31.6 10.3 33.2 21.3 13.6 12.8 15.7 15 15.6 20.1 26.1 28.7 34.2 0
1 233 20.7 39.3 31.6 10.3 30.8 25.2 23.0 14.7 8.5 8.0 9.5 8.0 12.2 20.2 24.2 32.2
1 233 33.2 39.3 31.6 10.3 31.6 21.6 18.3 8.2 5.7 5.5 4.9 6.2 9.5 14.9 21.6 33.2
1 233 49.8 39.3 31.6 10.3 35.0 12.3 4.4 3.4 4 3.6 2.5 4.2 6 8.7 32.6 0.0
1 233 62.2 39.3 31.6 10.3 30.2 13.5 3.3 1.9 1.9 0.7 2.2 0.5 1 1.9 5.0 32.4
1 200 7.5 46.3 34.5 12.7 35.4 32.3 23.6 20.1 21.8 23.7 25.4 26 29.9 39.5 0 0
1 200 12.4 46.3 34.5 12.7 33.2 25.6 22 16.3 12.7 13.8 14.4 17.1 18.2 24.5 35.5 0
1 200 20.7 46.3 34.5 12.7 36.5 27.1 19.8 15.4 15.6 14.9 12.7 13.2 16.8 29.7 37.7 0
1 200 33.2 46.3 34.5 12.7 35.7 26.5 15 10.5 10.5 10 9.6 10.2 14 23.6 34.7 0
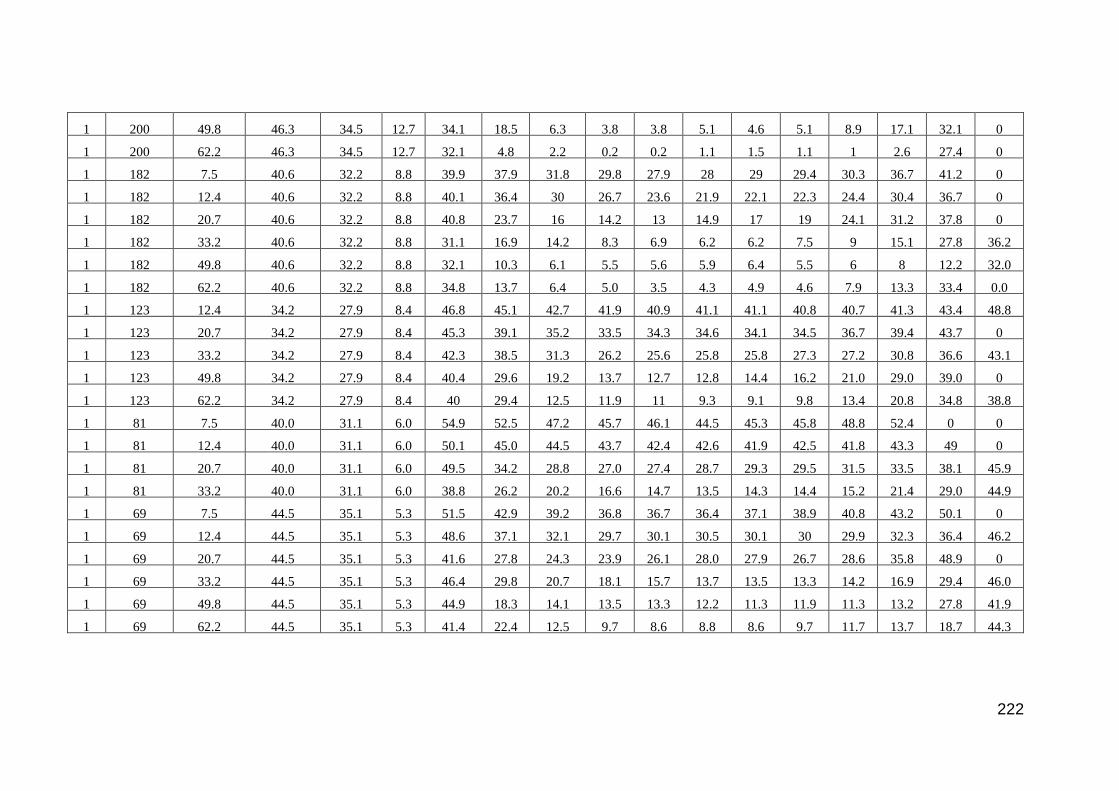
222
1 200 49.8 46.3 34.5 12.7 34.1 18.5 6.3 3.8 3.8 5.1 4.6 5.1 8.9 17.1 32.1 0
1 200 62.2 46.3 34.5 12.7 32.1 4.8 2.2 0.2 0.2 1.1 1.5 1.1 1 2.6 27.4 0
1 182 7.5 40.6 32.2 8.8 39.9 37.9 31.8 29.8 27.9 28 29 29.4 30.3 36.7 41.2 0
1 182 12.4 40.6 32.2 8.8 40.1 36.4 30 26.7 23.6 21.9 22.1 22.3 24.4 30.4 36.7 0
1 182 20.7 40.6 32.2 8.8 40.8 23.7 16 14.2 13 14.9 17 19 24.1 31.2 37.8 0
1 182 33.2 40.6 32.2 8.8 31.1 16.9 14.2 8.3 6.9 6.2 6.2 7.5 9 15.1 27.8 36.2
1 182 49.8 40.6 32.2 8.8 32.1 10.3 6.1 5.5 5.6 5.9 6.4 5.5 6 8 12.2 32.0
1 182 62.2 40.6 32.2 8.8 34.8 13.7 6.4 5.0 3.5 4.3 4.9 4.6 7.9 13.3 33.4 0.0
1 123 12.4 34.2 27.9 8.4 46.8 45.1 42.7 41.9 40.9 41.1 41.1 40.8 40.7 41.3 43.4 48.8
1 123 20.7 34.2 27.9 8.4 45.3 39.1 35.2 33.5 34.3 34.6 34.1 34.5 36.7 39.4 43.7 0
1 123 33.2 34.2 27.9 8.4 42.3 38.5 31.3 26.2 25.6 25.8 25.8 27.3 27.2 30.8 36.6 43.1
1 123 49.8 34.2 27.9 8.4 40.4 29.6 19.2 13.7 12.7 12.8 14.4 16.2 21.0 29.0 39.0 0
1 123 62.2 34.2 27.9 8.4 40 29.4 12.5 11.9 11 9.3 9.1 9.8 13.4 20.8 34.8 38.8
1 81 7.5 40.0 31.1 6.0 54.9 52.5 47.2 45.7 46.1 44.5 45.3 45.8 48.8 52.4 0 0
1 81 12.4 40.0 31.1 6.0 50.1 45.0 44.5 43.7 42.4 42.6 41.9 42.5 41.8 43.3 49 0
1 81 20.7 40.0 31.1 6.0 49.5 34.2 28.8 27.0 27.4 28.7 29.3 29.5 31.5 33.5 38.1 45.9
1 81 33.2 40.0 31.1 6.0 38.8 26.2 20.2 16.6 14.7 13.5 14.3 14.4 15.2 21.4 29.0 44.9
1 69 7.5 44.5 35.1 5.3 51.5 42.9 39.2 36.8 36.7 36.4 37.1 38.9 40.8 43.2 50.1 0
1 69 12.4 44.5 35.1 5.3 48.6 37.1 32.1 29.7 30.1 30.5 30.1 30 29.9 32.3 36.4 46.2
1 69 20.7 44.5 35.1 5.3 41.6 27.8 24.3 23.9 26.1 28.0 27.9 26.7 28.6 35.8 48.9 0
1 69 33.2 44.5 35.1 5.3 46.4 29.8 20.7 18.1 15.7 13.7 13.5 13.3 14.2 16.9 29.4 46.0
1 69 49.8 44.5 35.1 5.3 44.9 18.3 14.1 13.5 13.3 12.2 11.3 11.9 11.3 13.2 27.8 41.9
1 69 62.2 44.5 35.1 5.3 41.4 22.4 12.5 9.7 8.6 8.8 8.6 9.7 11.7 13.7 18.7 44.3

223
Table A 2: ANN predicted porosity distribution across ribbon width; rows were organised in the same order to that of table A-1.
output-ribbon porosity distribution
35.2 ± 1.2 22.1 ± 2.5 18.25 ± 1.8 18.4 ± 2.3 14.2 ± 3.2 15.1 ± 0.9 18.8 ± 1.9 27.8 ± 2.0 27.1 ± 4.4 29.3 ± 2.6 0 0
34.7 ± 1.2 18.6 ± 2.5 13.5 ± 0.9 12.9 ± 1.9 9.8 ± 1.7 10.6 ± 0.6 13.0 ± 1.2 21.9 ± 2.3 21.5 ± 3.5 27.19 ± 2.5 30.0 ± 6.1 0
34.4 ± 1.0 14.4 ± 2.6 8.4 ± 1.6 6.7 ± 0.9 5.9 ± 1.1 6.6 ± 0.4 7.7 ± 0.7 12.9 ± 1.7 14.3 ± 4.0 23.5 ± 2.8 0 0
34.5 ± 1 11.5 ± 2.7 5.4 ± 1.9 3.7 ± 0.9 4.1 ± 1.2 4.6 ± 0.6 5.2 ± 0.4 6.9 ± 0.8 7.9 ± 3.2 17.3 ± 2 0 0
34.8 ± 1.3 10.3 ± 2.2 4.4 ± 1.93 3 ± 1 3.6 ± 1.3 3.9 ± 0.9 4.5 ± 0.9 5.3 ± 0.9 3.3 ± 2.4 10.6 ± 1.7 19.5 ± 7.7 26 ± 5.6
33.5 ± 1.8 10 ± 2.4 3.1 ± 2.2 3.6 ± 1 4.1 ± 1.3 4 ± 0.9 4.4 ± 1 5.3 ± 1 3.6 ± 2.7 8.5 ± 3.3 13.9 ± 3.5 27.6 ± 7.4
34.4 ± 1.3 24.8 ± 1.5 16.9 ± 3.3 15.6 ± 1.3 13.3 ± 4.5 13.7 ± 2.3 15.5 ± 1.7 27.6 ± 3.1 35.7 ± 3.3 0 0 0
33.8 ± 1.4 21.6 ± 1.6 13.5 ± 2.2 11.3 ± 1.3 9.8 ± 3.3 9.9 ± 1.7 10.9 ± 1.5 21.7 ± 3.3 29.2 ± 2.2 0 0 0
32.9 ± 1.7 16.9 ± 1.6 9.3 ± 1.5 6.8 ± 1.5 6.3 ± 2 6.5 ± 0.6 7 ± 0.8 12.8 ± 2.4 17.7 ± 1.9 19.4 ± 5.2 33.6 ± 4.7 0
32.1 ± 1.9 12.5 ± 1.6 6.0 ± 1.4 4.1 ± 0.9 4.3 ± 1.3 4.6 ± 0.6 5.1 ± 0.4 7 ± 0.8 7.8 ± 2.9 12.5 ± 2.9 29.7 ± 3.5 0
31.5 ± 2.6 10.5 ± 1.8 4.7 ± 1.5 3.2 ± 0.8 3.5 ± 1.4 3.9 ± 0.9 4.4 ± 0.9 5.3 ± 0.8 4.2 ± 2 8.2 ± 2 26.3 ± 3.5 20.4 ± 9
31.1 ± 3.4 10.1 ± 1.8 4.3 ± 1.5 3 ± 0.8 3.3 ± 1.5 3.8 ± 1 4.2 ± 1 5 ± 0.9 3.5 ± 1.7 7.2 ± 1.7 25.9 ± 4.2 16.6 ± 7.8
42.4 ± 2.7 35.1 ± 2.8 26.5 ± 4.2 25.6 ± 1.7 24.1 ± 4.3 22.1 ± 2 25.4 ± 2.2 31.6 ± 1.5 39.4 ± 4.5 0 0 0
41.7 ± 2.5 31.4 ± 2.7 21.1 ± 3 19.8 ± 1.3 17.6 ± 3.3 16.1 ± 1.6 19.1 ± 1.7 26.7 ± 1.5 33.6 ± 4.8 0 0 0
40.4 ± 2.3 24.9 ± 2.5 13.5 ± 1.7 11.1 ± 1.6 9.1 ± 1.8 9.2 ± 1.1 10.5 ± 1.2 16.7 ± 1.4 22.8 ± 5.7 28.5 ± 4 0 0
39 ± 2.1 17.4 ± 2.2 8.0 ± 1.3 5.2 ± 0.9 4.8 ± 1 5.3 ± 0.3 5.9 ± 0.4 8 ± 0.7 11.8 ± 3.8 19.1 ± 3.1 33.2 ± 3.9 0
38.4 ± 1.8 12.6 ± 1.9 5.7 ± 1.4 3.4 ± 0.8 3.8 ± 1.2 4 ± 0.8 4.6 ± 0.7 5.5 ± 0.8 5.1 ± 1.6 10.7 ± 1.2 27.5 ± 3 0
38 ± 1.8 11.2 ± 1.7 5 ± 1.5 3.1 ± 0.9 3.8 ± 1.4 3.9 ± 1 4.3 ± 1 5.1 ± 0.9 3.5 ± 1.6 8.7 ± 1.4 23.4 ± 2.5 39.3 ± 3.5
45.9 ± 0.9 33.5 ± 5.3 33.5 ± 2.2 30.7 ± 2.6 29.1 ± 2.2 33.5 ± 1.6 35.5 ± 1.2 38.5 ± 2.1 45.7 ± 3.1 0 0 0
44.4 ± 1.3 30.8 ± 4.1 27.6 ± 2.7 21.2 ± 2.9 20.5 ± 1.5 27 ±.2.7 29.1 ± 1.4 36.7 ± 2 42.3 ± 3 42.4 ± 3.5 0 0
43.1 ± 1 26.7 ± 2.3 18.6 ± 2.2 10.3 ± 2.1 9.4 ± 1.9 13.5 ± 3.3 14.1 ± 2.9 28.9 ± 3.7 33.7 ± 5.5 0 0 0
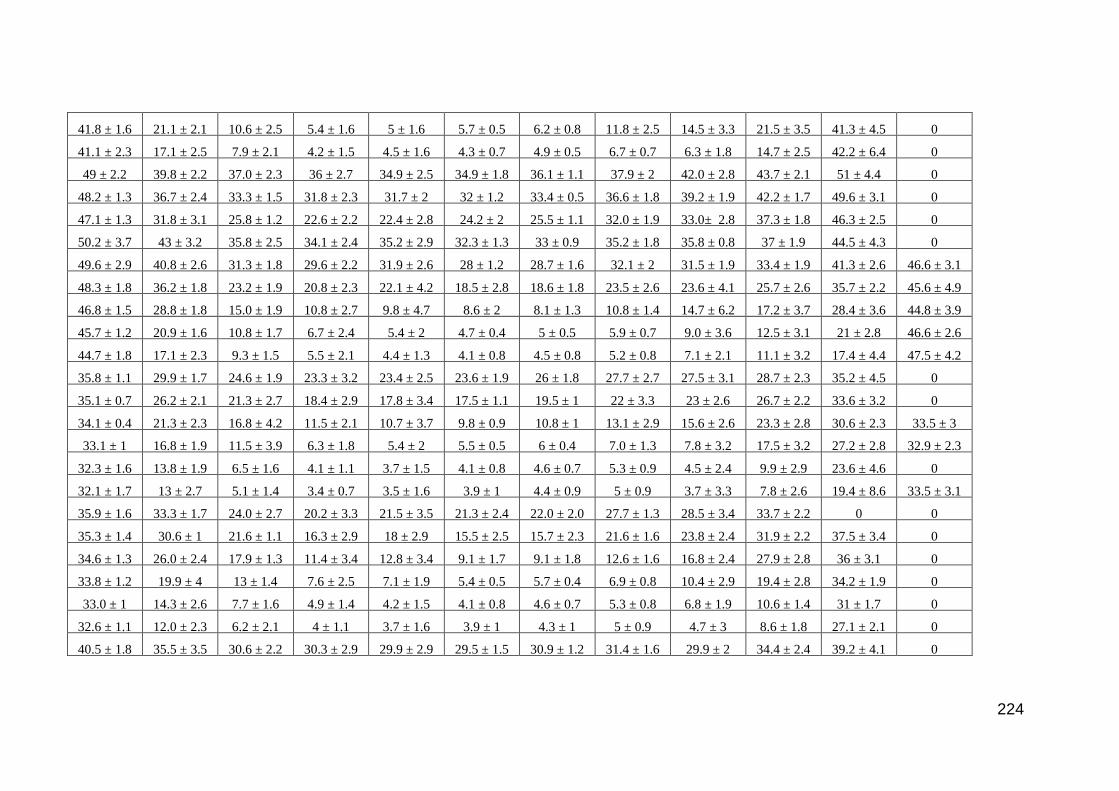
224
41.8 ± 1.6 21.1 ± 2.1 10.6 ± 2.5 5.4 ± 1.6 5 ± 1.6 5.7 ± 0.5 6.2 ± 0.8 11.8 ± 2.5 14.5 ± 3.3 21.5 ± 3.5 41.3 ± 4.5 0
41.1 ± 2.3 17.1 ± 2.5 7.9 ± 2.1 4.2 ± 1.5 4.5 ± 1.6 4.3 ± 0.7 4.9 ± 0.5 6.7 ± 0.7 6.3 ± 1.8 14.7 ± 2.5 42.2 ± 6.4 0
49 ± 2.2 39.8 ± 2.2 37.0 ± 2.3 36 ± 2.7 34.9 ± 2.5 34.9 ± 1.8 36.1 ± 1.1 37.9 ± 2 42.0 ± 2.8 43.7 ± 2.1 51 ± 4.4 0
48.2 ± 1.3 36.7 ± 2.4 33.3 ± 1.5 31.8 ± 2.3 31.7 ± 2 32 ± 1.2 33.4 ± 0.5 36.6 ± 1.8 39.2 ± 1.9 42.2 ± 1.7 49.6 ± 3.1 0
47.1 ± 1.3 31.8 ± 3.1 25.8 ± 1.2 22.6 ± 2.2 22.4 ± 2.8 24.2 ± 2 25.5 ± 1.1 32.0 ± 1.9 33.0± 2.8 37.3 ± 1.8 46.3 ± 2.5 0
50.2 ± 3.7 43 ± 3.2 35.8 ± 2.5 34.1 ± 2.4 35.2 ± 2.9 32.3 ± 1.3 33 ± 0.9 35.2 ± 1.8 35.8 ± 0.8 37 ± 1.9 44.5 ± 4.3 0
49.6 ± 2.9 40.8 ± 2.6 31.3 ± 1.8 29.6 ± 2.2 31.9 ± 2.6 28 ± 1.2 28.7 ± 1.6 32.1 ± 2 31.5 ± 1.9 33.4 ± 1.9 41.3 ± 2.6 46.6 ± 3.1
48.3 ± 1.8 36.2 ± 1.8 23.2 ± 1.9 20.8 ± 2.3 22.1 ± 4.2 18.5 ± 2.8 18.6 ± 1.8 23.5 ± 2.6 23.6 ± 4.1 25.7 ± 2.6 35.7 ± 2.2 45.6 ± 4.9
46.8 ± 1.5 28.8 ± 1.8 15.0 ± 1.9 10.8 ± 2.7 9.8 ± 4.7 8.6 ± 2 8.1 ± 1.3 10.8 ± 1.4 14.7 ± 6.2 17.2 ± 3.7 28.4 ± 3.6 44.8 ± 3.9
45.7 ± 1.2 20.9 ± 1.6 10.8 ± 1.7 6.7 ± 2.4 5.4 ± 2 4.7 ± 0.4 5 ± 0.5 5.9 ± 0.7 9.0 ± 3.6 12.5 ± 3.1 21 ± 2.8 46.6 ± 2.6
44.7 ± 1.8 17.1 ± 2.3 9.3 ± 1.5 5.5 ± 2.1 4.4 ± 1.3 4.1 ± 0.8 4.5 ± 0.8 5.2 ± 0.8 7.1 ± 2.1 11.1 ± 3.2 17.4 ± 4.4 47.5 ± 4.2
35.8 ± 1.1 29.9 ± 1.7 24.6 ± 1.9 23.3 ± 3.2 23.4 ± 2.5 23.6 ± 1.9 26 ± 1.8 27.7 ± 2.7 27.5 ± 3.1 28.7 ± 2.3 35.2 ± 4.5 0
35.1 ± 0.7 26.2 ± 2.1 21.3 ± 2.7 18.4 ± 2.9 17.8 ± 3.4 17.5 ± 1.1 19.5 ± 1 22 ± 3.3 23 ± 2.6 26.7 ± 2.2 33.6 ± 3.2 0
34.1 ± 0.4 21.3 ± 2.3 16.8 ± 4.2 11.5 ± 2.1 10.7 ± 3.7 9.8 ± 0.9 10.8 ± 1 13.1 ± 2.9 15.6 ± 2.6 23.3 ± 2.8 30.6 ± 2.3 33.5 ± 3
33.1 ± 1 16.8 ± 1.9 11.5 ± 3.9 6.3 ± 1.8 5.4 ± 2 5.5 ± 0.5 6 ± 0.4 7.0 ± 1.3 7.8 ± 3.2 17.5 ± 3.2 27.2 ± 2.8 32.9 ± 2.3
32.3 ± 1.6 13.8 ± 1.9 6.5 ± 1.6 4.1 ± 1.1 3.7 ± 1.5 4.1 ± 0.8 4.6 ± 0.7 5.3 ± 0.9 4.5 ± 2.4 9.9 ± 2.9 23.6 ± 4.6 0
32.1 ± 1.7 13 ± 2.7 5.1 ± 1.4 3.4 ± 0.7 3.5 ± 1.6 3.9 ± 1 4.4 ± 0.9 5 ± 0.9 3.7 ± 3.3 7.8 ± 2.6 19.4 ± 8.6 33.5 ± 3.1
35.9 ± 1.6 33.3 ± 1.7 24.0 ± 2.7 20.2 ± 3.3 21.5 ± 3.5 21.3 ± 2.4 22.0 ± 2.0 27.7 ± 1.3 28.5 ± 3.4 33.7 ± 2.2 0 0
35.3 ± 1.4 30.6 ± 1 21.6 ± 1.1 16.3 ± 2.9 18 ± 2.9 15.5 ± 2.5 15.7 ± 2.3 21.6 ± 1.6 23.8 ± 2.4 31.9 ± 2.2 37.5 ± 3.4 0
34.6 ± 1.3 26.0 ± 2.4 17.9 ± 1.3 11.4 ± 3.4 12.8 ± 3.4 9.1 ± 1.7 9.1 ± 1.8 12.6 ± 1.6 16.8 ± 2.4 27.9 ± 2.8 36 ± 3.1 0
33.8 ± 1.2 19.9 ± 4 13 ± 1.4 7.6 ± 2.5 7.1 ± 1.9 5.4 ± 0.5 5.7 ± 0.4 6.9 ± 0.8 10.4 ± 2.9 19.4 ± 2.8 34.2 ± 1.9 0
33.0 ± 1 14.3 ± 2.6 7.7 ± 1.6 4.9 ± 1.4 4.2 ± 1.5 4.1 ± 0.8 4.6 ± 0.7 5.3 ± 0.8 6.8 ± 1.9 10.6 ± 1.4 31 ± 1.7 0
32.6 ± 1.1 12.0 ± 2.3 6.2 ± 2.1 4 ± 1.1 3.7 ± 1.6 3.9 ± 1 4.3 ± 1 5 ± 0.9 4.7 ± 3 8.6 ± 1.8 27.1 ± 2.1 0
40.5 ± 1.8 35.5 ± 3.5 30.6 ± 2.2 30.3 ± 2.9 29.9 ± 2.9 29.5 ± 1.5 30.9 ± 1.2 31.4 ± 1.6 29.9 ± 2 34.4 ± 2.4 39.2 ± 4.1 0

225
39.1 ± 1.5 31.8 ± 2.7 27 ± 1.8 25.5 ± 2.2 24.1 ± 3.5 24.4 ± 1.4 25.8 ± 1.3 26.5 ± 2.2 25.7 ± 1.3 32.1 ± 2.1 37.9 ± 3.3 0
37.1 ± 0.9 25.4 ± 2 21.3 ± 2.2 17.5 ± 3 14.8 ± 4.3 14.6 ± 1.5 15.2 ± 0.9 16.7 ± 2.7 18.5 ± 2.3 27.6 ± 1.9 34.9 ± 3.7 0
35 ± 0.6 18.5 ± 2.3 14.5 ± 2.6 9.7 ± 3.5 7.4 ± 2.6 6.9 ± 0.7 7.1 ± 0.9 8.0 ± 1.5 10.7 ± 1.8 19 ± 2.1 29.6 ± 5.9 36.6 ± 1.7
33.6 ± 0.9 14.3 ± 2.2 8.6 ± 2.3 5.9 ± 1.9 4.5 ± 1.3 4.4 ± 0.7 4.9 ± 0.5 5.5 ± 0.9 6.9 ± 1.6 10.4 ± 1.6 24.4 ± 6.7 34.2± 3.8
33.1 ± 1.5 13.2 ± 2.6 6.7 ± 1.9 4.3 ± 0.9 4.1 ± 1.5 4 ± 0.9 4.4 ± 0.9 5.1 ± 0.9 5.6 ± 2.8 8.6 ± 1.5 23.4 ± 7.5 0
47.5 ± 1.8 43.3 ± 2.5 40.9 ± 3.9 40.2 ± 2.2 37.5 ± 2.8 36.8 ± 2.7 37.7 ± 2.1 38.5 ± 2 41.5 ± 3.5 42.6 ± 2.5 44.6 ± 5.5 48.1 ± 5.6
45.3 ± 1.3 40.9 ± 1.5 36.0 ± 3.2 34.8 ± 3.5 33.7 ± 3.2 32.9 ± 1.5 33.8 ± 1.4 36.7 ± 1.6 38 ± 3.4 40.4 ± 1.4 43.2 ± 5.1 0
42 ± 1.5 37.1 ± 1.5 26.5 ± 2.7 22 ± 4.2 22.5 ± 4.9 20.8 ± 2.7 20.2 ± 3.2 28.8 ± 3.1 28.9 ± 4.2 33.6 ± 3.5 41.0 ± 5.1 45.8± 4.8
39.1 ± 1.2 31.4 ± 2.3 15.8 ± 1.8 10.7 ± 3.4 10.0 ± 3.9 7.5 ± 1.3 7.6 ± 1.9 11.8 ± 2.8 17.5 ± 3.7 22.1 ± 4.1 37.7 ± 4.2 0
37.9 ± 1.9 27 ± 2.8 11.5 ± 2.4 7 ± 2.2 6.6 ± 2.1 4.9 ± 0.4 5.4 ± 0.4 6.7 ± 1.1 13 ± 2.2 15.5 ± 2.6 34.2 ± 3.9 40.1 ± 3.3
50.6 ± 2 44.2 ± 2.7 42 ± 3.6 41.3 ± 2.3 38.9 ± 3.3 37.6 ± 3.1 38.2 ± 2.1 37.9 ± 1.8 41.9 ± 4.1 45.3 ± 3.1 0 0
49.3 ± 1.5 42 ± 1..8 39.3 ± 2.6 38.8 ± 1.6 37.5 ± 2.8 36.0 ± 2.2 36.5 ± 1.4 36.4 ±1.5 38.8 ± 2.7 43.3 ± 2.3 43.9 ± 3.2 0
47.1 ± 1.2 37.3 ± 1.8 33.2 ± 2.1 32.6 ± 2.5 32.7 ± 1.9 31.2 ± 0.7 31.5 ± 0.4 32.1 ± 1.3 31.8 ± 1.3 37 ± 2.2 39.4 ± 2.9 47.9 ± 8
44.1 ± 1.9 29.9 ± 4 23.6 ± 2.8 20.5 ± 4.3 18.4 ± 3.2 17.9 ± 3 16.6 ± 2.1 18.6 ± 2.7 20.4 ± 2 26.5 ± 2.6 32.4 ± 4.3 47.1 ± 8
49.9 ± 2.5 41.9 ± 2 38.6 ± 2.2 38.5 ± 3.1 36.4 ± 2.3 36.2 ± 2.4 36.6 ± 1.3 35.4 ± 1.4 38.2 ± 3.8 41.2 ± 2.2 44.9 ± 3.3 0
48.8 ± 2.2 39.4 ± 2 35.2 ± 1.8 35.2 ± 2.8 34.2 ± 2.1 33.9 ± 1.5 34.2 ± 0.7 32.4 ± 1.1 33.4 ± 3 37.3 ± 1.7 43.1 ± 2.7 43.0 ± 3.3
47.1 ± 1.6 34.6 ± 2.8 28.9 ± 3 28.2 ± 3.5 28.7 ± 2.7 27.2 ± 1.9 27 ± 1.2 23.9 ± 1.6 25.1 ± 2.5 29.3 ± 2.5 39.3 ± 2.9 0
45 ± 1.5 27.1 ± 4.5 21 ± 3.6 17.6 ± 4.1 17.5 ± 2.6 13.7 ± 3.9 12.2 ± 1.9 10.9 ± 1.5 15.6 ± 1.3 19.4 ± 2.4 33.0 ± 3.2 44.5 ± 2.6
43.3 ± 1.4 20.0 ± 4.6 14.2 ± 2.6 10.5 ± 3 8.1 ± 3 5.9 ± 0.7 5.8 ± 0.5 5.9 ± 0.8 10.4 ± 1.6 13.6 ± 2.2 26.1 ± 3.3 43.9 ± 2.2
42.3 ± 1.3 16.8 ± 3.9 11.7 ± 3.8 8.0 ± 2.7 6 ± 2.7 4.4 ± 0.5 4.7 ± 0.6 5.2 ± 0.9 8.2 ± 3.6 12.4 ± 2.8 21.8 ± 3.9 41.7 ± 5.2

226