integration of renewable resources · one of the iso corporate goals is a project to support the...
TRANSCRIPT

PSERC PresentationOctober 2, 2007
Integration of Renewable Resources
David Hawkins and Clyde Loutan

2
Renewable Portfolio Standards Goals
Source: Kevin Porter; Exeter Associates, Inc

3
Summer 2006Solar 0.4%
Small Hydro 1.4%
Wind 2.4%BioMass 1.5%
Other Generation Resources
91.0%
Renewables Provided 9% of the Energy to Serve Customer Loadfor the period May through September
Geothermal 3.3%
Current Level of Renewable Generation in California

4
20% Renewables
Existing California Renewable Generationand Possible Additions to meet the 20% RPS by 2010-2012*
2,400
330
1,700
440
5,400
1,570
845
2690
-
1,000
2,000
3,000
4,000
5,000
6,000
7,000
8,000
Geothermal Biomass Wind Solar
MW
Additional
Existing4,100 MW
1,200 MW
7,500 MW
1,900 MW
* Source of data on additional renewable resource is from Table 2-2 in the CEC IAP report, published July, 2007
9,110 MW Additonal 5,590 MW Existing14,700 MW Total Renewables

5
Altamont Pass
Solano County
Tehachapi/ Mojave Desert
San Gorgonio Pass
California’s abundant wind resources have a key role to play.
Pacheco Pass
Lassen
Shasta
Salton Sea Imperial Valley

6
CAISO Renewables Integration ProgramPrimary Goal(s) / Objectives:
One of the ISO Corporate Goals is a project to support the integration of renewable resources on the California power grid to support the State’s policy regarding renewables.
This is a coordinated project that encompasses the integration of renewable resources into CAISO’s
• Transmission planning • Markets, and • Grid Operations
The objective is to support the State’s RPS goal of 20% of customer load being served by renewable resources by the end of 2010.

7
CAISO Renewables Project – Major TasksTransmission upgrade plan
Transmission for the Tehachapi Area – 4500 MWs of new wind generation
Additional Transmission upgrades to move renewable energy to customer load centers and to storage facilities (Helms, etc.)
Operations Issues Identified and Solutions ProposedRamping issues & accurate hourly forecasts
Regulation/Load Following & supplemental energy dispatch
Visibility of wind & solar energy forecasts for operators
Mitigation of potential transmission problems
Mitigation of over generation conditions
Feasible generation schedules for real time operations
Quick generating start units and hydro redispatch to mitigate major changes in wind/solar generation energy production

8
Tehachapi Transmission Project- New infrastructure to deliver renewable energy
MIDWAY
LOWWIND
ANTELOPE
VINCENT
MIRA LOMA
RIO HONDO
MESA
PARDEE
WINDHUBSub 1
Sub 5
Existing 500kV Line:
Existing 230kV Line:
New 500kV Line:
New 230kV Line:
500kV Line Upgrade:
All lines are built to 500kV specifications
Tehachapi Wind Generation Area

9
Tehachapi Transmission Study
Transient Stability, Voltage Control, Post Transient StudyReview transmission plans for Tehachapi Area with 4,146 MW of total wind
generation
2012 Light Load Spring Conditions – Heavy Path 15 flow S-N
2010 Heavy Summer Peak Load conditions – Path 15 flow N-SFor each seasonal condition, three wind generation scenarios were analyzed:
• Full Wind: All Tehachapi area Wind Turbine Generators on line operating at rated MW,
• Low Wind: All Tehachapi area Wind Turbine Generators on line operating at 25% of rated MW,
• No Wind: All Tehachapi area Wind Turbine Generators off line,

10
WECC Wind Turbine Models
genera tor
full power
PlantFeeders
actodc
dctoac
generator
partia l power
PlantFeeders
actodc
dctoac
generator
Slip poweras heat loss
PlantFeeders
PF controlcapacitor s
actodc
generator
PlantFeeders
PF controlcapacitor s
Type 1 Type 2
Type 3 Type 4
Detailed Discussion of WG Models available on UWIG web site in presentation by Abraham Ellis; PS New Mexico
Type 1 – conventional induction generator
Type 2 – wound rotor induction generator with variable rotor resistance
Type 3 – doubly-fed induction generator
Type 4 – full converter interface
CEC sponsored research project in progress to improve the accuracy of the WG models

11
LVRT Standard
PSLF LVRT Set points vs. Current WECC LVRT Standard
0
20
40
60
80
100
120
-1.0 0.0 1.0 2.0 3.0 4.0 5.0 6.0
Time (seconds)
Volta
ge a
t Poi
nt o
f Int
erco
nnec
tion
(Per
cent
)
150 ms
WECC
PSLF
12
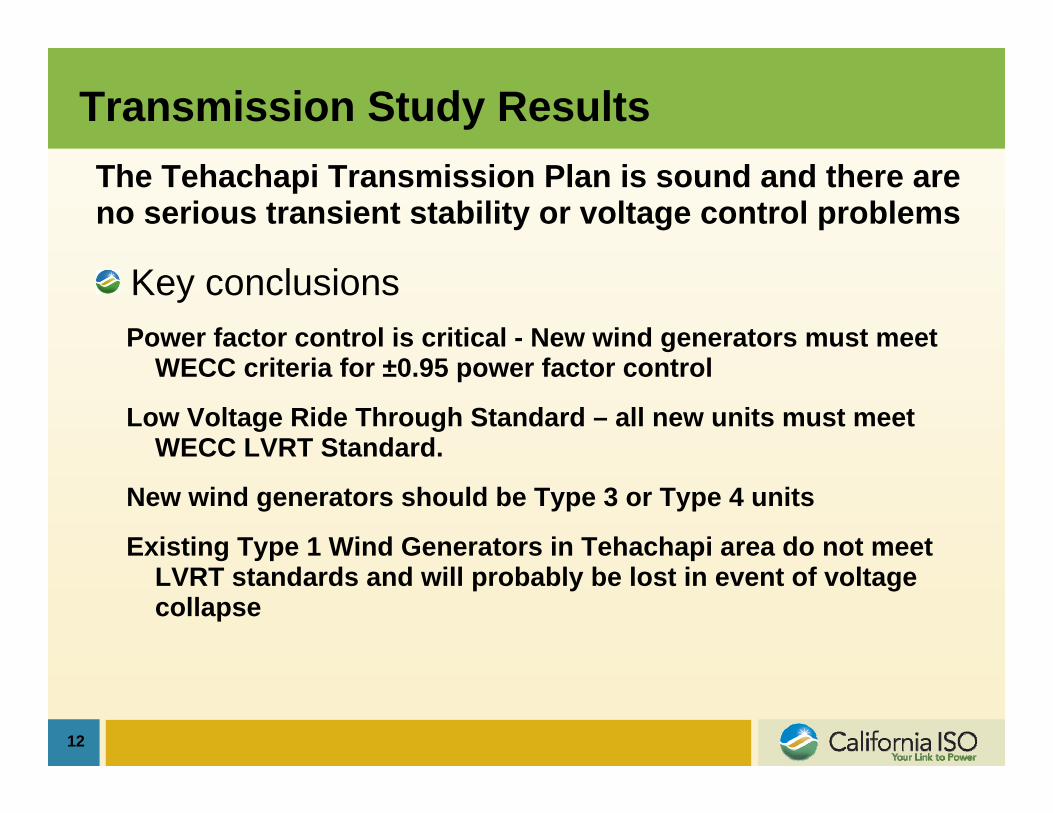
Transmission Study ResultsThe Tehachapi Transmission Plan is sound and there are no serious transient stability or voltage control problems
Key conclusionsPower factor control is critical - New wind generators must meet
WECC criteria for ±0.95 power factor control
Low Voltage Ride Through Standard – all new units must meet WECC LVRT Standard.
New wind generators should be Type 3 or Type 4 units
Existing Type 1 Wind Generators in Tehachapi area do not meet LVRT standards and will probably be lost in event of voltage collapse

13
Operational Studies Objectives of Operational Studies
To Determine:
Magnitude of multi-hour ramps
Load Following Capacity and Ramping Requirements
Regulation Capacity and Ramping Requirements
Over generation Issues and Potential Solutions

14
Tehachapi Wind Generation in April – 2005
Could you predict the energy production for this wind park either day-ahead or 5 hours in advance?
-100
0
100
200
300
400
500
600
700
1 2 3 4 5 6 7 8 9 10 11 12 13 14 15 16 17 18 19 20 21 22 23 24
Hour
Meg
awat
ts
−Average
Each Day is a different color.
−Day 29
−Day 5−Day 26
−Day 9

15
Study Methodology
Study conducted jointly with Battelle – Pacific Northwest National Labs
Day Ahead and Hour Ahead Scheduling ProcessReal-Time DispatchRegulation Process
Determined load forecasting and wind forecasting errorsObtained projected hourly wind generation data from AWS Truewind Company Build Mathematical Model to Mimic Actual Operations
Model details available in Appendix B of the CAISO Integration of Renewables Report on our web site

1616
Load growth assumed at about 1.5% per year Results based on 2006 actual operating data.
Assumption is that load and wind generation operating characteristics in 2012 will have similar patterns
New wind generators participate in CAISO PIRP program, with centralized Day-Ahead and Hour-Ahead forecasting serviceNew MRTU market design is implemented
Hour-ahead load and wind generation energy forecasts provided no less than 105-minutes before beginning of next operating hourReal Time five-minute load forecasts provided 7.5 minutes before beginning of five-minute dispatch interval
Real Time telemetry from wind resources sent to CAISO on a four-second basis, similar to non-intermittent resources
Operations/market study assumptions reflect likely operational and market conditions

17
What is Regulation?
Regulation is required for the CAISO to maintain scheduled frequency and maintain interchange schedules on the ties
Regulation is not dispatched based on its Energy Bid Curve Price
Regulating resources are dispatched through Automatic Generation Control every four-seconds to meet moment-to-moment fluctuations in the system

18
What is Load Following?
Load following necessary to maintain stable operations
The CAISO’s Real Time Market balances Load and Generation on a forward looking basis
Some generators are dispatched upwards to meet their next hour schedules other generators may have to be moved downwards to maintain a generation load balance
Real Time Economic Dispatch software runs every 5-minutes and dispatches generation based on economics and ramping capability

19
One-hour block energy schedule includes 20-minute ramps between the hours
Load,MW
tOperating Hour
Hour Ahead Load Schedule
20 Minute Ramps Actual Load
Average ActualLoad
Forecast Error

20
MRTU timelines benefit renewable integration
Run starts here for
Interval 2
ADS instructions
sent for Interval 2
Run starts here for
Interval 3
ADS Instruction
Sent Interval 3
Run starts here for
Interval 4
ADS Instructions
Sent for Interval 4
Units begin to Move to
DOT in Interval 4
10 mins
7.5 mins
Minutest-2.5 t t+2.5 t+5 t+7.5 t+10 t+12.5 t+15
Interval 1 Interval 2 Interval 3
Units begin to Move to
DOT in Interval 2
Units begin to Move to
DOT in Interval 3
The Real Time Economic Dispatch software runs every five-minutes starting at approximately 7.5 minutes prior to the start of the next Dispatch Interval and produces Dispatch Instruction for Energy for the next Dispatch Interval and advisory Dispatch Instructions for as many as 13 future Dispatch Intervals.

21
Actual Wind Generation 2006 vs. Expected Wind Generation 2010
1 2 3 4 5 6 7 8 9 10 11 12 13 14 15 16 17 18 19 20 21 22 23 24Hours
Total Wind Hourly Average GenerationMay 2006 & 2010
0
1,000
2,000
3,000
4,000
5,000
6,000
MW
2010 2006
2006 - HE19: 50 to 1800 MW2010 - HE19: 1,400 to 6,000 MW

22
Conclusion – Regulation Requirement
Season Max Regulation
Up, MW Max Regulation
Down, MW Max Hourly Increase
(Up), MW Max Hourly Increase
(Down), MW Spring +510 -550 +240 (HE18) -300 (HE18)
Summer +480 -750 +230 (HE09) -500 (HE18) Fall +400 -525 +170 (HE06, HE18) -275 (HE18)
Winter +475 -370 +250 (HE18) -100 (HE10)
Seasons Max Increase Regulation Ramp
Up, MW/min
Max Increase Regulation Ramp Down, MW/min
Spring +20 -25 Summer +10 -18
Fall +25 -20 Winter +15 -15
• Today, the CAISO can effectively operate the system by procuring ± 350 MW of regulation on an hourly basis (700 MW total)
• By 2012, regulation capacity requirements will increase by 170-250 MW for “up regulation” and 100-500 MW for “down regulation” depending on the season and time of day

23
Conclusion – Load Following Requirement
Season Max Load Following Inc,
MW
Max Load Following Dec,
MW
Max Hourly Increase (Inc), MW
Max Hourly Increase (Dec), MW
Spring +2,850 -2,950 +800 -500 Summer +3,500 -3,450 +800 -600
Fall +3,100 -3,250 +750 -900 Winter +2,900 -3,000 +700 -750
Season Max Load Following Ramp Up, MW/min
Max Load Following Ramp Down, MW/min
Spring +35 -30 Summer +40 -40
Fall +40 -30 Winter +30 -40
Load following ramping requirements will increase and require more generation to be available for both upward (700-800 MW) and downward (500-900 MW) dispatch

24
Ramping issues
Forecasted Hourly Ramps due to Additional Wind Generation
• In California, the wind generation energy production tends to be inversely correlated with the daily load curve. The wind energyproduction peaks during the night and falls off during the morning load pick up. The net result will be morning ramps of 2000 to 4000 MW per hour for 3 hours – a total of 6000 to 12,000 MW over 3 hours.

25
Recommendations
Implement a state-of-the-art (DA, HA, RT) wind forecasting service for all wind generator energy production within the CAISO operational jurisdiction
Incorporate the Day and Hour Ahead wind generation forecasts (block energy schedules) into the CAISO’s and SC’s scheduling processes
Integrate the Real Time wind generation forecast (average wind generation for 5-minute dispatch intervals) with the Real Time unit commitment and MRTU dispatching applications
Develop a new ramp forecasting tool to help system operators anticipate large energy ramps, both up and down, on the system
Change the ISO generator interconnection standards to require compliance of all intermittent resources with the interconnection rules established for the PIPR

26
Recommendations (cont.)Implement a procedure where the CAISO Dispatcher can send dispatch notices to wind generation operators and require them to implement pro-rata cuts in their energy production. Analyze the impact of solar power intermittency with load and wind generation intermittencyEvaluate the benefits of participating in a wider-area arrangement like ACE sharing or Wide Area Energy Management systemStudy the impact that additional cycling (additional start ups) and associated wearing-and-tearing issues and associated additional costs and environmentalimpacts on conventional generation Recommend changes in Resource Adequacy standard to require more generation with faster and more durable ramping capabilities that will be required to meet future ramp requirements Recommend changes in Resource Adequacy standard to require additional quick start units that will be required to accommodate Hour Ahead forecasting errors and intra-hour wind variations. Encourage the development of new energy storage technology that facilitates the storage of off peak wind generation energy for delivery during on-peak periods
27
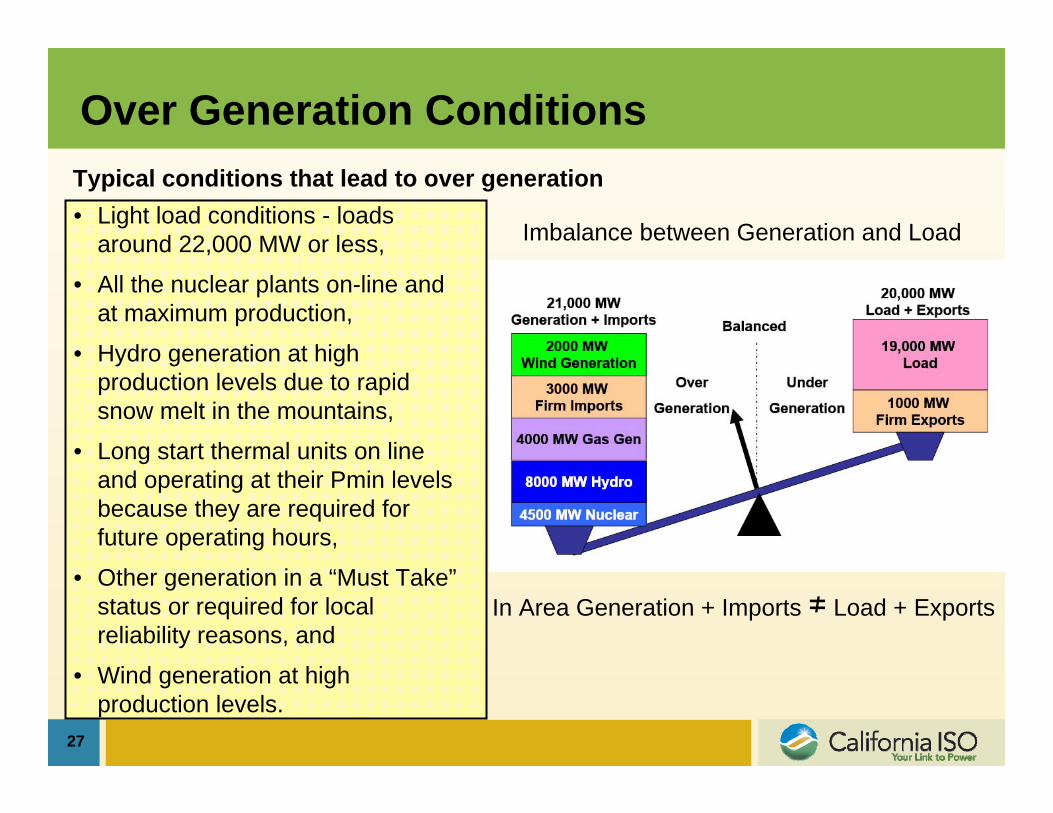
Over Generation Conditions
Imbalance between Generation and Load
In Area Generation + Imports ≠ Load + Exports
• Light load conditions - loads around 22,000 MW or less,
• All the nuclear plants on-line and at maximum production,
• Hydro generation at high production levels due to rapid snow melt in the mountains,
• Long start thermal units on line and operating at their Pmin levels because they are required for future operating hours,
• Other generation in a “Must Take”status or required for local reliability reasons, and
• Wind generation at high production levels.
Typical conditions that lead to over generation
28
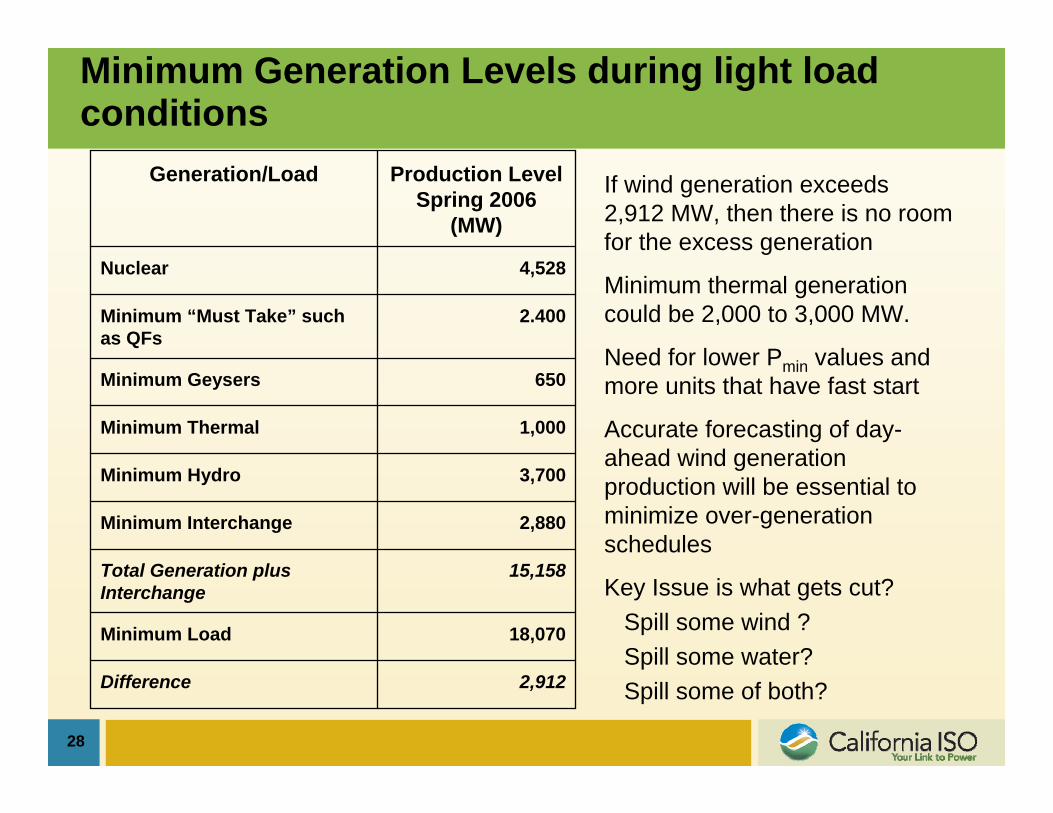
Minimum Generation Levels during light load conditions
2,912Difference
18,070Minimum Load
15,158Total Generation plus Interchange
2,880Minimum Interchange
3,700Minimum Hydro
1,000Minimum Thermal
650Minimum Geysers
2.400Minimum “Must Take” such as QFs
4,528Nuclear
Production LevelSpring 2006
(MW)
Generation/Load If wind generation exceeds 2,912 MW, then there is no room for the excess generation
Minimum thermal generation could be 2,000 to 3,000 MW.
Need for lower Pmin values and more units that have fast start
Accurate forecasting of day-ahead wind generation production will be essential to minimize over-generation schedules
Key Issue is what gets cut?Spill some wind ?Spill some water?Spill some of both?

29
Conclusions & Recommendations about Over GenerationOver generation occurs with the existing amount of wind generation but it is relatively rare occurrence. The lack of good Day Ahead wind generation forecast contributes to the problem. The addition of large amounts of wind generation facilities willexacerbate the problem. MRTU Integrated Forward Market should help to mitigate the problem
Generation schedules match the load forecast. Accurate Day Ahead wind generation forecasts will be a key
component for the Day Ahead RUC process.Wind generation operators should be prepared to curtail some wind generation production to mitigate serious over generation conditions in the future. The amount of renewable energy lost will be small.The CAISO must work with the wind generator operators to ensure procedures, protocols, and communication facilities are in place so dispatch commands can be communicated to the plant operators.Additional storage capability on the system would help to mitigate both over generation and large ramp conditions.

30
How to make the 20% RPS Target work
Increase the amount of regulation resourcesAdd 170 MW to 500 MW of regulation resources to accommodate
rapid changes in wind and other variables.
• Amount required varies with the season (winter, spring, summer, fall)
Ramping requirement increasesFast ramping increases by ±15 MW/min to ±25MW/min
Regulation by hydro units will be most important
Supplemental energy dispatches will increaseMorning ramp up will increase by 1000 to 2000 MW per hour
Evening ramp down will increase by 1000 to 1800 MW per hour
Potential Over Generation problems will increase for light loadperiods

31
Three RA requirements for Integration of Renewables
GenerationPortfolio Storage Demand
Response
Resources Required for Renewables Integration
Quick Start Units
Fast Ramping
Wider Operating Range
Regulation capability
Shift Energy from off-peak to on-peak
Mitigate Over Generation
Voltage Support
Regulation capability
Price sensitive load
Responsive to ISO dispatches
Frequency Responsive
Responsive to Wind Generation Production

32
Storage Technology
Pump StorageHelms and potentially Leaps
Hydrogen Storage
Compressed Air Storage
Flow Based Battery Storage
Batteries
Super capacitors
High Speed Flywheel Storage
Plug-in Hybrid Electric Vehicles

33
Storage Technology – Pump Storage
Helms Pump Storage Plant rarely operates all three 300 MW pumps. Helms Pump Storage
2005 Operation
-1,200
-900
-600
-300
0
300
600
900
1,200
1 366 731 1096 1461 1826 2191 2556 2921 3286 3651 4016 4381 4746 5111 5476 5841 6206 6571 6936 7301 7666 8031 8396
Meg
awat
ts
3 pump operation <250 hours
2 pump operation <1000 hours
1 pump operation <1200 hours Hours

34
Storage Technology – High Speed Flywheels
A “Megawatt in a Box”
– Beacon Power technology
– (10) 25-kWh flywheels
– 1 MW for 15 minutes
– Quick deployment
– Price about 1 million $$
• Flywheel Energy storage project for AGC Regulation Service and frequency control. Test system installed in Sept. 2005 at the Research Center in San Ramon. Research project successfully completed 2007
• Need a performance based contract with a market participant
• Can we justify a 20 MVA or 40 MVA facility for AGC?

35
Storage Blockers#1 A good economic model for making storage payoff. Is the differential between off-peak
prices and on-peak prices large enough or sustained to make a compelling business case?
#2 What value added services can storage provide to improve the economic model? Fast ramp rates? High Speed Regulation? FRR-Frequency Responsive Reserves?
The storage industry has been working work with governments, regulators, utilities, and operators to address and attempt to overcome the challenges to the proliferation of electricity storage. Some of these include:
A lack of government subsidies and incentives to encourage investment
Regulatory constraints and limitations
The uncertainty of selling electricity storage systems at a price that will allow both developers and customers to profit
Political will (it will take time to influence decision-makers. Will the window of opportunity stay open long enough for that to happen?

36
Demand Response Programs 4 Types required
Price Sensitive load that is willing to reduce demand for the right price. Demand that is bid into Day-Ahead markets to reduce peak load
Interruptible Load – Loads that are willing to be interrupted or curtailed under emergency conditions – Stage 2 Emergencies – and will immediately take action in response to a dispatch notice.
Frequency sensitive load – Load that is willing to turn off or reduce consumption due to a drop is system frequency. Example is Plug-In Hybrid Vehicles that will automatically stop charging their batteries when the frequency is low.
Load that is willing to change based on availability of excess wind generation production
37
Next StepsMajor tasks
Sharing of ACE deviations between BA’s
Strategy for Imports of Renewables
Improve Renewables forecasting –Day-Ahead and Hour-Ahead
Link forecasts into Market SystemsAS Procurement
RUC decisions
Graphics displays for operations
Transmission Line Loading and overload mitigation
Ramp forecasting tools and planning tools for operations
Improve Wind Generation models for transient stability studies

38
Sources of information
CAISO Integration of Renewables Reporthttp://www.caiso.com/1c60/1c609a081e8a0.pdf
CEC Intermittency Analysis Project (IAP Report)http://www.energy.ca.gov/pier/final_project_reports/CE
C-500-2007-081.html