strategies for integration of variable renewable ...€¦ · strategies for integration of variable...
TRANSCRIPT

WIR SCHAFFEN WISSEN – HEUTE FÜR MORGEN
Strategies for integration of variable renewable generation in the Swiss electricity system
Evangelos Panos, Kannan Ramachandran :: Paul Scherrer Institut
IAEE 2017 European Conference, Vienna, 3d – 7th September 2017
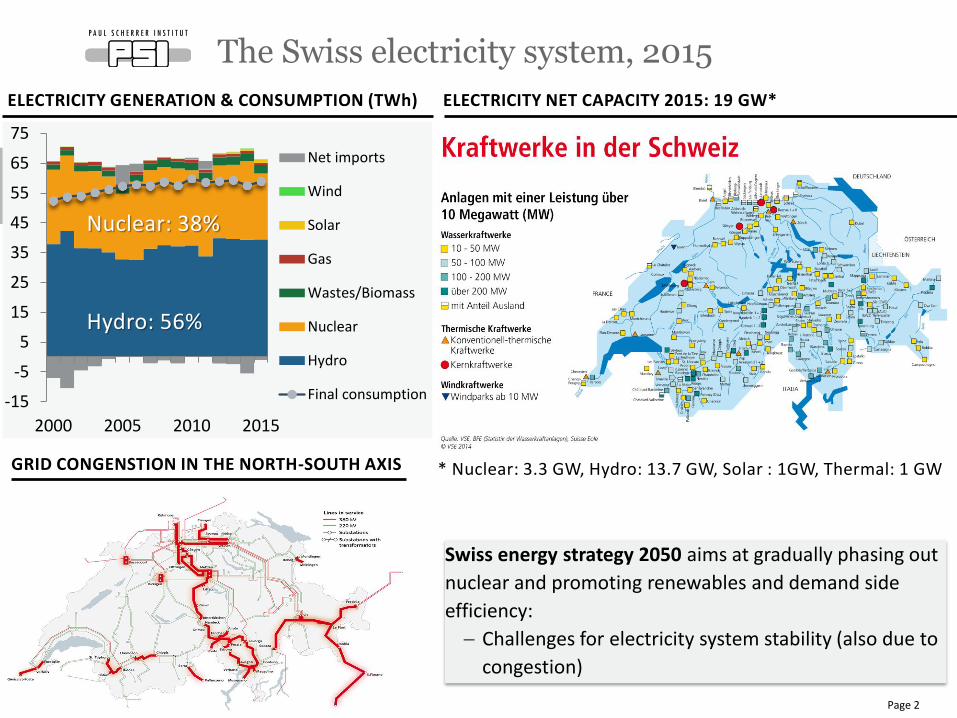
Swiss energy strategy 2050 aims at gradually phasing out
nuclear and promoting renewables and demand side
efficiency:
Challenges for electricity system stability (also due to
congestion)
The Swiss electricity system, 2015
Page 2
-15
-5
5
15
25
35
45
55
65
75
2000 2005 2010 2015
Net imports
Wind
Solar
Gas
Wastes/Biomass
Nuclear
Hydro
Final consumption
Hydro: 56%
Nuclear: 38%
ELECTRICITY GENERATION & CONSUMPTION (TWh) ELECTRICITY NET CAPACITY 2015: 19 GW*
* Nuclear: 3.3 GW, Hydro: 13.7 GW, Solar : 1GW, Thermal: 1 GW GRID CONGENSTION IN THE NORTH-SOUTH AXIS

• We study integration measures for variable (and stochastic) renewable generation
from wind and solar PV (VRES) in Switzerland for the horizon 2015 – 2050:
Reinforcing and expanding the grid network
Deploying local storage, complementary to pump hydro, like batteries and ACAES
Deploying dispatchable loads such as P2G, water heaters and heat pumps
• The study was performed in the context of the ISCHESS project, which is a
collaboration between the Paul Scherrer Institute and the Swiss Federal Institute of
Technology (ETH Zurich), funded by the Swiss Competence Center Energy and
Mobility (CCEM) http://www.ccem.ch/ischess
Objectives of the research
Page 3

• Bottom-up, cost-minimisation model, used for assessing long term Swiss energy policies
• High intra-annual resolution with 288 typical hours (3 typical days, 4 seasons, 24h/day)
• For the current research, the model was modified to include:
Higher detail in the electricity sector at the expense of detail at the demand sectors
(oil-based transport is excluded and industrial sectors have aggregate representation)
Variability in the RES generation, ancillary services and power plant dispatching constraints
Methodology – The Swiss TIMES Energy Systems Model (STEM)
Page 4
Swiss TIMES Energy system Model (STEM)
Fuel supply
module
Fuel
distribution
module
Demand modulesElectricity supply
module
Resource module
Electricity import
Uranium
Natural gas
Hydrogen
Electricity export
Electricity
Gasoline
Diesel
Renewable· Solar
· Wind
· Biomass
· Waste
Electricity
storage
Hydro resource· Run-of rivers
· Reservoirs
CO2
Demand
technologies
Residential- Boiler
- Heat pump
- Air conditioner
- Appliances
Services
Industires
Hydro plants
Nuclear plants
Natural gas
GTCC
Solar PV
Wind
Geothermal
Other
Taxes &
Subsidies
Fuel cell
Energy
service
demands
Person
transportat
ion
Lighting
Motors
Space
heating
Hot water
Oil
Transport
Car fleetICE
Hybrid vehicles
PHEV
BEV
Fuel cell
Bus
Rail
Mac
roec
onom
ic d
river
s (e
.g.,
popu
latio
n, G
DP
, flo
or a
rea,
vkm
)
Inte
rnat
iona
l ene
rgy
pric
es (o
il, n
atur
al g
as, e
lect
ricity
, ...)
Tec
hnol
ogy
char
acte
rizat
ion
(Effi
cien
cy, l
ifetim
e, c
osts
,…)
Res
ourc
e po
tent
ial (
win
d, s
olar
, bio
mas
s, …
.)
Biofuels
Biogas
vkm-Vehicle kilometre
tkm-tonne kilometre
LGV-Light goods vehicles
HGV-Heavy good vehicles
SMR-steam methane reformer
GTCC-gas turbine combined cycle plant
Oil refinery
Process
heat
FreightsTrucks
HGV
Rail
Natural gas
Heating oil
Other
electric

• Different grid levels, with different set of power plants and storage options in each level
• Each grid level is characterised by transmission costs and losses
• Power plants are characterised by costs, efficiency, technical constraints and resource availability
• A linearised approximation of the Unit Commitment problem is also formulated
Representation of the electricity sector in STEM
Page 5
Very High Voltage Grid Level 1
NuclearHydro DamsImports Exports
Distributed Power Generation
Run-of-river hydroGas Turbines CCGas Turbines OCGeothermal
High Voltage Grid Level 3
Large Scale Power Generation
Medium Voltage Grid Level 5
Wind FarmsSolar ParksOil ICEWaste Incineration
Large scale CHP district heating
Wastes, BiomassOilGasBiogasH2
Low Voltage Grid Level 7
Large Industries & Commercial
CHP oilCHP biomassCHP gasCHP wastesCHP H2Solar PVWind turbines
Commercial/Residential Generation
CHP gasCHP biomassCHP H2Solar PVWind turbines
Lead-acid batteriesNaS batteriesVRF batteries
PEM electrolysis
Pump hydro
CAES
Lead-acid batteriesNaS batteriesVRF batteries
Li-Ion batteriesNiMH batteries
PEM electrolysis
Lead-acid batteriesLi-Ion batteriesNiMH batteries

+ 4 nodes for nuclear
power plants
• Based on a reduction algorithm from FEN/ETHZ that maps the detailed transmission grid to
an aggregated grid with 𝑁 = 15 nodes and 𝐸 = 319 lines, based on a fixed disaggregation
of the reduced network injections to the detailed network injections
Representation of electricity transmission grid
Page 6
MAPPING
−𝐛 ≤ 𝐇 × 𝐃 × 𝐠 − 𝐥 ≤ 𝐛
Where 𝐇 is the PTDF matrix of the detailed network, 𝐃 is the fixed dissagregation matrix,
𝐠 is Nx1 vector with injections, 𝐥 is Nx1 vector of withdrawals, and 𝐛 is Ex1 vector of line capacities
The matrix 𝑫 is not unique, since there are infinite ways in which an aggregate injection can be distributed between multiple nodes;
here, it allocates power injections according to the original distribution of generation capacity in the detailed model

• The STEM model has the concept of the typical day. Hence the mean wind/solar production is
applied, and the variance of the mean is needed to capture stochasticity through the variability of
the mean
• Bootstrap was applied to derive the variation of the mean for wind/solar generation and electricity
consumption across the typical days of a 20-year sample data and then we moved ± 3 sd in the
distribution of the mean for each our and typical day to obtain the variability.
• The storage capacity must accommodate downward variation of the Residual Load Duration Curve
(RLDC) and upward variation of non-dispatchable generation
• The dispatchable peak generation capacity (incl. storage) must accommodate upward variation of
the RLDC and downward variation of non-dispatchable generation
Representation of stochastic RES variability
Page 7
Bootstrapped Distribution of Mean Photovoltaic
Capacity Factors: Summer (left), Winter (right)

• Power plants commit capacity to the reserve market based on their operational constraints and
the trade-off between:
marginal cost of electricity (covers generation costs)
dual of the electricity supply-demand balance constraint
marginal cost of reserve provision (covers capacity costs)
dual of the reserve provision – demand balance constraint
• In each of the 288 typical hours the demand for reserve is calculated from the joint probability
distribution function (p.d.f.) of the individual p.d.f. of forecast errors of supply and demand. We
assume that the forecast errors are following the normal distribution
The sizing is based on both probabilistic and deterministic assessment
We move ± 3 s.d. on the joint p.d.f of the reserve demand to estimate the reserve requirements
Ancillary services markets – provision of reserve
Page 8
𝑅 = 3 ∗ 𝜎2𝑠𝑜𝑙𝑎𝑟 ∙ 𝐺𝑡𝑠𝑜𝑙𝑎𝑟 − 𝑆𝑡𝑠𝑜𝑙𝑎𝑟
2+ 𝜎2
𝑤𝑖𝑛𝑑 ∙ 𝐺𝑤𝑖𝑛𝑑 − 𝑆𝑡 𝑤𝑖𝑛𝑑
2+𝜎2
𝑙𝑜𝑎𝑑 ∙ 𝐿𝑡2 + 𝑃𝑚𝑎𝑥
sd. of
forecast error
distribution
Generation Storage
Loss
of a grid
element
(N-1 criterion)

P W P-CO2 W-CO2 P-IMP W-IMP P-CO2-IMP W-CO2-IMP
POM based energy service demands
WWB based energy service demands
Nuclear phase out by 2034
Zero net annual electricity imports
-70% CO2 emission reduction in 2050 from 2010
Net electrcity imports are allowed
Base case Climate change Imports Combined case
A range of “what-if” scenarios was assessed along three main dimensions:
1. Future energy policy and energy service demands
2. Location of new gas power plants and installed capacity as % of the total national capacity
3. Grid expansion: allowing grid reinforcement beyond the plans announced for 2025 or not
in total about 100 scenarios were assessed with the STEM model based on the Cartesian Product of
the above combinations
Long term scenarios analysed
Page 9
Corneux (NE) Chavalon (VS) Utzenstorf (BE) Perlen (LU) Schweizerhalle (BL)
Case 3 20.0 20.0 20.0 20.0 20.0
Case 6 No grid constraints, so the location of gas turbines does not play a role
Case 11 0.0 33.3 33.3 33.3 0.0
Case 26 33.3 33.3 0.0 0.0 33.3

• Electricity consumption increases 4 – 30% from 2015 ( 0.1 – 0.8% p.a)
• New gas power plants replace existing nuclear capacity
• Under climate policy VRES provides 28% of the supply (close to the current share of nuclear)
• The requirements for secondary reserve almost double in 2050 from today’s level and peak
demand shifts from winter to summer; hydro is still the main contributor to reserve
Electricity consumption continues to increase and gas, VRES & imports replace nuclear by 2050
Page 10
-10
0
10
20
30
40
50
60
70
80
2015
2050 (max)
2050 (min)
2050 (median)
ELECTRICITY GENERATION & CONSUMPTION IN 2050 (TWh) REQUIREMENTS IN SECONDARY RESERVE IN 2050 (MW)
0
100
200
300
400
500
600
700
800
2015
2050 (max)
2050 (min)
2050 (median)
Maximum contribution per technology The results correspond to ranges among the 100 scenarios assessed

• High shares of VRES require electricity storage peak capacity of ca. 30 – 50% of the installed
capacity of wind and solar PV (together)
• Above 14 TWh of VRES generation, significant storage deployment is needed
• About 13% of the excess summer VRES production is seasonally stored in P2G (~ 1 TWhe)
Storage needs increase with VRES deployment
Page 11
0.0
0.5
1.0
1.5
2.0
2.5
3.0
3.5
4.0
4.5
5.0
5.5
8 10 12 14 16 18 20 22 24
Inst
alle
d s
tora
ge c
apac
ity
(GW
)
TWh of wind and solar PV electricity production
Pump hydro(pumpingcapacity)
Batteries(4h maxdischarge)
P2G
• Small scale batteries are driven by
distributed solar PV installations
• Medium scale batteries are driven by
wind and large scale PV and CHP
• Large scale batteries complement pump
hydro storage when it is unavailable
Max. Total battery capacity 5.5 GW
Large scale batteries 0.5 GW
Small scale
batteries 3 GW
Medium scale
batteries 2 GW
ELECTRICITY FROM WIND AND SOLAR PV VS INSTALLED PEAK
STORAGE CAPACITY IN DIFFERENT SCENARIOS AND YEARS
Each data point in the graph corresponds to a different long term scenario and year

Contribution of each sector to electricity stored in water heaters and heat pumps
Residential 85-97%
Industry <2%
Services 3-23%
• Electricity storage in water heaters and heat pumps accounts for 8 – 24% of the total electricity
consumption for heating
• Above 13 TWh of electricity for heating there is an accelerated deployment of dispatchable
loads to mitigate peak
• Large potential for load shifting is in water heating (resistance heating) followed by space
heating in buildings
Dispatchable loads help in easing electricity load peaks in the stationary end-use sectors
Page 12
1.0
1.5
2.0
2.5
3.0
3.5
4.0
4.5
5.0
5.5
8 13 18
Ele
ctri
city
sto
red
in w
ate
r h
eat
ers
an
d h
eat
pu
mp
s (T
Wh
)
Electricity consumption for heating (TWh)
ELECTRICITY STORED IN WATER HEATERS AND HEAT PUMPS
VS ELECTRICITY CONSUMPTION IN HEATING IN 2050 (TWh)
Each data point in the graph corresponds to a different long term scenario
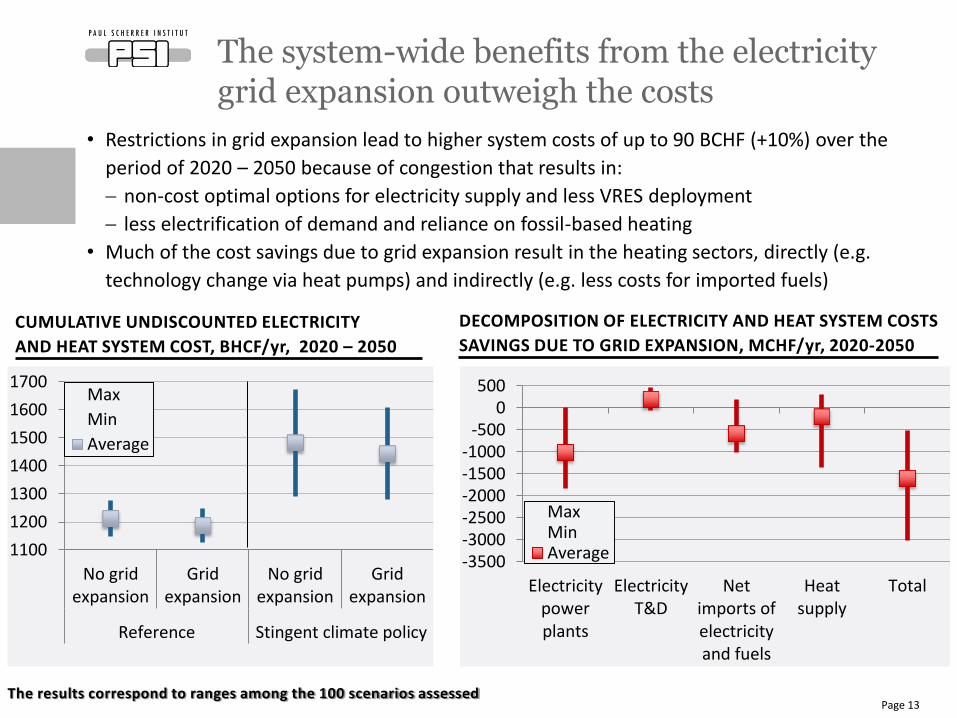
• Restrictions in grid expansion lead to higher system costs of up to 90 BCHF (+10%) over the
period of 2020 – 2050 because of congestion that results in:
non-cost optimal options for electricity supply and less VRES deployment
less electrification of demand and reliance on fossil-based heating
• Much of the cost savings due to grid expansion result in the heating sectors, directly (e.g.
technology change via heat pumps) and indirectly (e.g. less costs for imported fuels)
The system-wide benefits from the electricity grid expansion outweigh the costs
Page 13
1100
1200
1300
1400
1500
1600
1700
No gridexpansion
Gridexpansion
No gridexpansion
Gridexpansion
Reference Stingent climate policy
Max
Min
Average
CUMULATIVE UNDISCOUNTED ELECTRICITY
AND HEAT SYSTEM COST, BHCF/yr, 2020 – 2050
-3500-3000-2500-2000-1500-1000
-5000
500
Electricitypowerplants
ElectricityT&D
Netimports ofelectricityand fuels
Heatsupply
Total
MaxMinAverage
DECOMPOSITION OF ELECTRICITY AND HEAT SYSTEM COSTS
SAVINGS DUE TO GRID EXPANSION, MCHF/yr, 2020-2050
The results correspond to ranges among the 100 scenarios assessed

• Without batteries and grid, there is 30 – 50% less deployment of wind and solar electricity
compared to the case when both options are available
Batteries are important for the integration of VRES to cope with their variability
Grid expansion is important to integrate large amounts of VRES production ( >16 TWh)
• Total system costs can be 10 – 14% higher if both batteries and grid expansion are unavailable
In particular climate policy costs could increase by more than 50% (from 103 to 160 BCHF)
Storage and grid expansion are required to realise the VRES potential and lower climate policy costs
Page 14
0
5
10
15
20
25
Reference Climate policy
TWh
of
win
d a
nd
so
lar
PV
NoBatteries,No gridexpansion
WithBatteries,Gridexpansion
IMPACT OF BATTERIES AND GRID EXPANSION IN
THE DEPLOYMENT OF WIND AND SOLAR PV POWER
1100
1150
1200
1250
1300
1350
1400
1450
Reference Climate policy
Un
dis
cou
nte
d c
um
ula
tive
co
st B
CH
F
NoBatteries,No gridexpansion
WithBatteries,Gridexpansion
IMPACT OF BATTERIES AND GRID EXPANSION IN
THE TOTAL SYSTEM COSTS
Results on the left graph corresponds to ranges; results on the right graph is for a scenario with high demand and electricit y imports

• Electricity consumption continues to increase by 0.1 – 0.8% p.a. and could reach over 70 TWh/yr by 2050
• VRES can contribute up to 24 TWhe (or 28% of the domestic supply) but this requires:
Storage peak capacity investments about 30 – 50% of the installed wind and solar PV capacity; beyond
14 TWhe accelerated deployment of storage is inevitable
Grid reinforcement beyond the expansion plans anounced for 2025
• About 13% of the excess electricity production from VRES in summer is seasonally stored in P2G pathways
• Water heaters and heat pumps could contribute in easing electricity peaks and could shift 8 – 24% of the
electricity consumption for heat
• Grid reinforcement results in net economic benefits for the whole electricity and heat supply system of
Switzerland on the order of 0.5 – 3.0 BCHF/yr.
• When both electricity storage and grid expansion are unavailable, VRES generation could be up to 50% less
and climate costs could increase by more than 50% compared to the opposite case
• Further work is needed to overcome some important limitations:
Regional representation also for the heat supply and not only for electricity
Consideration of N-2 grid security constraints
More detail in technical representation of storage technologies (e.g. depth of discharge)
Conclusions and further work
Page 15

Page 16
Wir schaffen Wissen – heute für morgen
Thank you for your attention. Evangelos Panos
Energy Economics Group
Laboratory for Energy Systems Analysis
Paul Scherrer Institute