insurer demand for catastrophe reinsurance · partial financial support for this paper was...
TRANSCRIPT
This PDF is a selection from an out-of-print volume from the National Bureauof Economic Research
Volume Title: The Financing of Catastrophe Risk
Volume Author/Editor: Kenneth A. Froot, editor
Volume Publisher: University of Chicago Press
Volume ISBN: 0-226-26623-0
Volume URL: http://www.nber.org/books/froo99-1
Publication Date: January 1999
Chapter Title: Insurer Demand for Catastrophe Reinsurance
Chapter Author: Anne Gron
Chapter URL: http://www.nber.org/chapters/c7947
Chapter pages in book: (p. 23 - 50)
1 Insurer Demand for Catastrophe Reinsurance Anne Gron
The increasing role of risk management in corporate strategy can be seen in the development and use of new risk-management techniques. Two examples are the use of financial derivatives to manage interest rate exposure, foreign exchange risk, and commodity prices and the move away from insurance for managing commercial liability risks. One recent survey estimated that 65 per- cent of large, nonfinancial firms use derivatives to reduce risk exposure (Whar- ton School and Chase Manhattan Bank 1995).’ Meanwhile, the substitution of such “nontraditional” risk-management practices as self-insurance, risk- retention groups, and captives for traditional insurance products has increased to an estimated 30-40 percent of the overall property-casualty insurance mar- ket and approximately 60-80 percent of the large casualty risks, where the trend is concentrated?
An increasing academic literature has followed the increasing importance of corporate risk management, but the motivations for corporate risk manage- ment are not, as yet, well understood. The empirical studies of corporate risk management in particular are relatively few and the results inconclusive. The theoretical incentives for corporate risk management fall into three broad cate- gories: reducing the cost of financial distress, reducing agency costs, and tax
Anne Gron is assistant professor of management and strategy at the J. L. Kellogg Graduate School of Management, Northwestern University.
The author thanks Anne Beatty, David Govrin, Nicholas Polson, and Raghu Rajan for helpful comments, suggestions, and advice as well as conference participants. Ken Froot, David Govrin, Paul O’Connell, Guy Carpenter & Co., and the Wharton Financial Institutions Center generously provided access to data and additional information. Data assistance from the Insurance Library Association of Boston is also greatly appreciated. Victoria Zuckerman provided able research as- sistance. Partial financial support for this paper was generously provided by the NBER Project on the Financing of Property-Casualty Risks.
1 . Large firms are considered to be those with market value greater than $250 million. 2. For further details on this trend, see Murphy (1995) and Johnson and Higgens (1992).
23
24 AnneGron
motivations. While existing empirical studies have found some evidence con- sistent with each of these motivations, there is little consistency of results across studies.3 This lack of consistency as well as data shortcomings indicate a need for further research on the topic.
This study adds to the literature by examining the determinants of insurer demand for catastrophe reinsurance. Reinsurance refers to insurance pur- chased by an insurer; catastrophe reinsurance is insurance for losses associ- ated with natural hazards, such as hurricanes, earthquakes, and windstorms. Catastrophe reinsurance is well suited for this study because it is relatively homogeneous and well defined. This ensures that one insurer’s catastrophe re- insurance is fairly similar to another insurer’s and allows us to calculate good measures of firm exposure to risk, a feature lacking in studies of reinsurance more generally: Also, unlike some financial engineering strategies, catastro- phe reinsurance cannot be used both to speculate and to hedge risk. Thus, this study focuses directly on the determinants of corporate demand for a specific form of risk reduction.
Another advantage of this investigation is that the data include price as well as quantity measures. Previous studies either examine the quantity of risk- reduction activity or, in some cases, investigate whether firms engage in partic- ular risk-management techniques. In both cases, the analysis is made without reference to cost because of data limitations. Ideally, one would like to examine the quantity of risk reduction given its cost. My data on catastrophe- reinsurance contracts, from the largest broker of catastrophe reinsurance, Guy Carpenter and Company, include both price and quantity measures for a large fraction of the U.S. catastrophe-reinsurance market for the period 1987-93. This allows me to examine insurers’ willingness to trade off different quantity dimensions in response to changes in price. Since insurers are observed only if they purchase catastrophe reinsurance through Guy Carpenter, my estimation strategy corrects for sample selection.
I find that insurers do trade off quantity and price when purchasing catastro- phe reinsurance: as prices increase, insurers increase retention levels, decrease total limits, and increase coinsurance rates. These findings support the notion
3. The empirical literature on corporate risk management includes studies that estimate insurer use of reinsurance (Mayers and Smith 1990; G w e n 1994) and studies that examine corporate use of financial hedges (Nance, Smith, and Smithson 1993; Gezcy, Minton, and Schrand 1997; Tufano 1996).
4. As noted, reinsurance refers to an insurer buying insurance. This covers a wide range of financing and risk transfer. For example, diversification through swapping books of business be- tween insurers and contracts requiring reimbursement if losses exceed a specified amount are both classified as reinsurance. Previous studies of reinsurance cannot distinguish among such contractual differences and do not distinguish between reinsurance transactions in property lines of business (e.g., automobile physical damage) and those in liability lines (e.g., medical malprac- tice). In addition, the value of reinsurance purchased by the insurer is netted against the reinsurance sold, even though the two may be very different types of transactions. The breadth of activity covered under the term reinsurance makes it more difficult to construct a representative measure of firm risk exposure.
25 Insurer Demand for Catastrophe Reinsurance
that firms with greater probability of financial distress have greater demand for risk management and hence catastrophe reinsurance. The data also indicate that insurers with greater catastrophe exposure have significantly greater de- mand for catastrophe reinsurance. The data do not, however, indicate that smaller firms have greater demand for catastrophe reinsurance. In fact, I find that larger firms appear to have greater demand for catastrophe reinsurance. This finding suggests that the liquidity effect of catastrophe reinsurance domi- nates the solvency effect. Catastrophe reinsurance does two things: it decreases the probability of insolvency, and it increases liquidity after a large loss. Larger firms are likely to value the liquidity component more than smaller firms. My results suggest that the liquidity component dominates the solvency compo- nent in the data.
The purchase of catastrophe reinsurance is also important in its own right. The issue of funding catastrophic losses has come to the forefront in recent years with record catastrophe losses. In 1992, Hurricane Andrew caused $15 billion of insured losses, and, from July 1989 to July 1996, the insurance indus- try paid out over $35 billion from events with over $1.5 billion in insured losses (see Litzenberger, Beaglehole, and Reynolds 1996; and the sources therein). In the wake of Hurricane Andrew, prices for catastrophe reinsurance increased substantially, and availability declined. Studies suggest that exposure to catas- trophe has greatly increased owing to migration and building patterns that have increased population and property exposure in the most catastrophe-prone re- gions. One consequence of these changes has been an increased interest in securitizing catastrophe exposure via futures, options, or bonds.5 Reduced transactions costs and greater risk spreading are typically cited as the benefits derived from securitizing catastrophe risk. The results of this research suggest additional benefits. To the extent that insurers have lower leverage and hold more liquid assets as substitutes for catastrophe reinsurance, greater access to low-cost catastrophe reinsurance will free up insurer capital and reduce the need for liquidity.
The paper is organized as follows. Section 1.1 examines the relevant theo- ries of corporate risk management and applies them to catastrophe reinsurance in particular. Section 1.2 presents the data, and section 1.3 reports the esti- mation results. A discussion of the results and their implications for corporate risk management and the catastrophe-reinsurance market is contained in sec- tion 1.4.
5 . For example, trading in catastrophe-insurance options on the Chicago Board of Trade has increased steadily since the revised product was introduced in September 1995. October 1996 trading showed open interest and notional value at their highest points. Another instrument for trading catastrophe risk, the Catastrophe Risk Exchange (CATEX), allows subscribers to swap risks or exchange risks for cash or risk plus cash. It had five subscribers as of November 1996. Several bond issues linked to catastrophe exposure have also been considered. USAA plans to issue $500 million in catastrophe bonds, and the California Earthquake Authority may issue earth- quake bonds in March 1997 (see Chookaszian, chap. 11 in this volume).
26 AnneGron
1.1 Corporate Risk Management and the Demand for Catastrophe Reinsurance
Catastrophe reinsurance is a contract whereby the reinsurer agrees to pay the insurer (purchaser) a specified amount in the event of a catastrophic event occurring within a defined time period causing large total property claims. The decisions to purchase insurance are motivated by the same basic forces that motivate other corporations to manage risk. The incentives for corporate risk management most relevant here fall into three categories: reducing the cost of financial distress, reducing agency costs, and tax motivations. Each of these is briefly described below.
1.1.1
Purchasing catastrophe reinsurance can reduce the probability of financial distress and its associated costs by reducing the probability that the firm be- comes insolvent as the result of a catastrophe. Research demonstrates that the costs of financial distress include increased cost of capital and reduced rela- tionship-specific investment by suppliers and purchasers (see, e.g., the discus- sions in Mayers and Smith 1982; Smith and Stulz 1985; and Mayers and Smith 1990). These issues are particularly important for insurance companies where the product quality is inversely related to the probability of bankruptcy.6 In the presence of capital market imperfections that make internal funds less costly than external funds, firms in financial distress will tend to underinvest because of lack of internal funds (see Froot, Scharfstein, and Stein 1993). This is likely to be particularly important in the insurance industry, where investment oppor- tunities follow large industry losses. As demonstrated in Gron (1994a, 1994b) and Winter (1988, 1994), these types of capital market imperfections are asso- ciated with increases in industry profitability following large industry losses. Firms with greater leverage and lower liquidity are likely to have greater costs of financial distress.
Risk-averse individuals with large, undiversified stakes in a corporation will benefit from corporate risk management (Mayers and Smith 1982; Smith and Stulz 1985; Mayers and Smith 1990). This includes managers as well as own- ers when ownership is concentrated. The majority of insurance companies have one of two predominant ownership structures, stock or mutual. A substantial literature investigates the relative merits of stock and mutual ownership and their continued coexistence in the insurance and banking industries.’ That liter-
Motivations for Corporate Risk Management
6. While smaller buyers of insurance such as individuals and households may not be directly concerned with an insurer’s solvency because of state guaranty funds, insurer solvency is important to larger purchasers such as corporations whose claims are typically only partially covered by the guaranty system because the size of losses is likely to be above guaranty-fund limits. Increased probability of financial distress is likely to reduce an insurer’s financial rating, which may result in decreased demand from buyers, who use the ratings as a quality measure.
7. Lamm-Tenant and Starks (1993) provide a good summary of this literature.
27 Insurer Demand for Catastrophe Reinsurance
ature suggests that the presence of both organizational forms is related to two agency conflicts: that between owners and policyholders and that between owners and managers. The mutual form removes the first conflict but exacer- bates the second because there is no effective market for corporate control. Most of the theoretical literature implies that mutual insurers will tend to oper- ate in types of insurance with lower risk and managerial discretion, and Lamm- Tenant and Starks (1993) provide empirical evidence of this. The tendency of mutual insurers to take on less risk than stock insurers is likely to persist with respect to catastrophe exposures. Mutual insurers will be more likely to pur- chase catastrophe reinsurance than will stock insurers because the firm owners are less diversified and risk-averse managers will benefit from the risk reduc- tion.
Mayers and Smith (1982, 1990) and Smith and Stulz (1985) point out that the progressivity of the tax code provides incentives for hedging since it creates a convex tax function for low levels of income. Therefore, a firm with expected income in the convex range of the tax code can reduce expected tax payments by reducing the variance of income. After the Tax Reform Act of 1986 and the imposition of the alternative minimum tax, however, it has become quite dif- ficult to determine how the tax code influences firm behavior. Still, tax- preference items such as tax-loss carryforwards will provide incentives to man- age risk since their expected present value is decreasing in the variance of income.
The value of catastrophe reinsurance is also increasing in an insurer’s expo- sure to catastrophic risk. The greater the exposure, the greater the benefit from reinsurance. Greater exposure can come from concentration in geographic areas where catastrophes are more common, such as coastal regions, or from concentration in property lines.
1.1.2 Insurer Demand for Catastrophe Reinsurance
Insurers have several methods for hedging catastrophic risk. An insurer can enter into a proportional agreement with another insurer, it can buy “pro rata” coverage, which reimburses a fixed percentage of losses, or it can buy “excess- of-loss” coverage, which reimburses losses above a specified level. A propor- tional reinsurance treaty is a contract between insurers where each agrees to finance a stated percentage of claims from a particular book of business. Such an arrangement is not aimed solely at reducing catastrophe risk, but it does so if the two insurers operate in separate geographic areas. If the insurer de- cides to purchase catastrophe coverage from a reinsurer, it can purchase either pro rata or excess-of-loss coverage. Pro rata coverage is typically purchased through a reinsurer that sells directly to insurers (a direct reinsurer), while excess-of-loss coverage is usually purchased from reinsurers that sell through brokers. The difference in the two approaches is in amount of coverage and access to reinsurers. Excess-of-loss programs purchased through a broker gen- erally have greater amounts of coverage. The broker works with the insurer to
28 AnneGron
construct a reinsurance program and then uses its contacts with many rein- surers to place layers of this program with several different reinsurers.
This paper investigates insurers’ demand for catastrophe reinsurance pur- chased through reinsurance brokers. The insurance is excess-of-loss coverage; a typical catastrophe-reinsurance program may call for $90 million coverage with a $10 million retention. The broker then “places” the program in the mar- ket, selling different “layers” of the $90 million to reinsurers. For example, the contract might consist of five layers, each with its own retention and limit. The first layer covers the first $10 million after the insurer’s initial retention of $10 million, the second the next $15 million, the third the next $20 million, the fourth the next $20 million, and the fifth the final $25 million. Together, they add up to $90 million in coverage. In addition to retention and limit, catastrophe-reinsurance programs have coinsurance rates that specify the per- centage of the loss that the insurer will bear. If the coinsurance rate is 10 per- cent, then the insurer will pay 10 percent of any insured loss. In the example, a $50 million catastrophe will result in the reinsurers paying $36 million:
0.9 * $40 million (= $50 million less $10 million retention).
The amount of catastrophe reinsurance is increasing in the limit and decreasing in the retention and coinsurance rate.
The price of a catastrophe-reinsurance program is quoted as the premium paid divided by the amount of coverage, called the rate on line. If the premium in the example given above is $13.175 million, the “price” will be 0.146 (= 13.175/90). An insurer’s willingness to pay for catastrophe reinsurance de- pends, not on the absolute retention level and limit, but rather on the retention level and limit relative to the insurer’s exposure. The expected value of a partic- ular retention level or limit depends on the frequency with which the insurer expects losses in that range to occur. This will be a function of the insurer’s underlying property exposure. Therefore, the insurer demand for catastrophe reinsurance will be based on the retention level relative to the insurer’s expo- sure and the limit relative to exposure, or relative retention and relative limit, respectively.
The demand for catastrophe reinsurance can be written as equation (l) , where price ( P ) is a function of relative retention (RRET), the relative limit (RLIM), the coinsurance rate (COINS), and firm characteristics affecting the valuation of catastrophe reinsurance ( Z ) :
(1) P, = Po + P,RRET, + P,RLIM,, + P,COINS,, + yZ, + E ~ , .
Since this is a demand curve, we expect the estimated coefficients on relative retention and coinsurance to be positive, while the estimated effect of relative limit should be negative. That is, insurers are expected to respond to higher price with higher retentions, greater coinsurance rates, and lower total limits. Characteristics that affect an insurer’s valuation of catastrophe reinsurance in-
29 Insurer Demand for Catastrophe Reinsurance
clude factors that affect the costs of financial distress, agency costs, and tax motivations as well as firm exposure to catastrophe loss. These variables are discussed in the next section, which describes the data.
1.2 Data
The price and quantity data come from Guy Carpenter, a reinsurance broker, and cover those insurers who purchased catastrophe reinsurance through the brokerage. These data were supplemented with data on insurance-company operations and financial status from the A. M. Best Company. Guy Carpenter’s data cover approximately 60 percent of the market for catastrophe reinsurance. Although the data include regional (smaller) companies and national (larger) companies, they are likely to be skewed toward larger companies for two rea- sons. First, many smaller companies purchase catastrophe reinsurance from a direct reinsurer or buy proportional reinsurance (or both). Second, Guy Car- penter has not traditionally served the majority of the smaller insurers who go to the broker market.
The Guy Carpenter data analyzed here include all the regional and national companies that purchased catastrophe reinsurance through Guy Carpenter from 1987 to 1993. The typical data entry for a company includes the number of layers, the retention for each layer, the limit, the premium, and coinsurance. Since the insurer decides to purchase the whole catastrophe-reinsurance pro- gram at the same time, the data are aggregated to the program, the relevant unit of observation. For each company year I calculate the program price (rate on line), program retention, coverage limit, and coinsurance rate. Price, or rate on line, is the total premium paid divided by total limit. Coinsurance was calcu- lated as the average coinsurance rate for the contract.8 The data consist of 327 observations covering fifty different insurers over the period 1987-93 .9
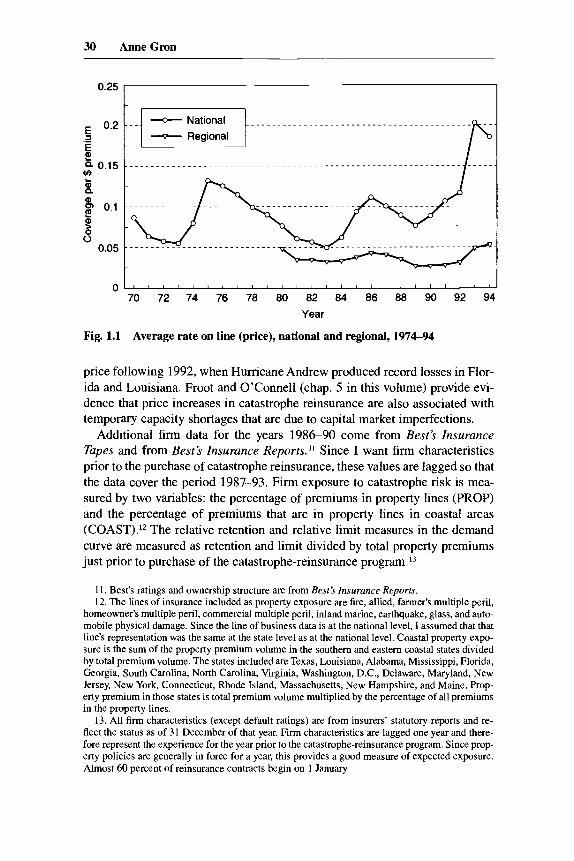
To provide an overview of catastrophe-insurance prices, figure 1.1 graphs average price for national and regional insurers for the period 1974-94.IO Both series display the same relative minima and maxima. Prices are at relative max- ima in the middle of the 1970s and the 1980s, a feature common to many insurance-price or -profitability series. These periods coincide with the two most recent “insurance crises,” when industry prices and profitability increased rapidly, accompanied by sharp declines in availability. Other research suggests that these episodes are related to temporary capacity shortages that are in part due to capital market imperfections (see, e.g., Gron 1994a, 1994b; Winter 1988, 1994; and the references therein). There is also a marked increase in
8. The coinsurance rate reported in the data is not likely to be the actual coinsurance rate; it is, instead, the minimum coinsurance rate that the selling reinsurers required. The actual coinsurance rate is not available but could be greater, depending on market conditions.
9. The actual estimation includes 298 observations, representing forty-five insurers. Observa- tions were lost because of missing characteristic data.
10. The Guy Carpenter data do not include regional insurers until 1980.
30 AnneGron
70 72 74 76 7a 80 a2 a4 a6 aa 90 92 94
Year
Fig. 1.1 Average rate on line (price), national and regional, 197694
price following 1992, when Hurricane Andrew produced record losses in Flor- ida and Louisiana. Froot and O'Connell (chap. 5 in this volume) provide evi- dence that price increases in catastrophe reinsurance are also associated with temporary capacity shortages that are due to capital market imperfections.
Additional firm data for the years 1986-90 come from Best's Insurance Tapes and from Best's Insurance Reports." Since I want firm characteristics prior to the purchase of catastrophe reinsurance, these values are lagged so that the data cover the period 1987-93. Firm exposure to catastrophe risk is mea- sured by two variables: the percentage of premiums in property lines (PROP) and the percentage of premiums that are in property lines in coastal areas (COAST).'* The relative retention and relative limit measures in the demand curve are measured as retention and limit divided by total property premiums just prior to purchase of the catastrophe-reinsurance program.I3
11. Best's ratings and ownership structure are from Best's Insurance Reports. 12. The lines of insurance included as property exposure are fire, allied, farmer's multiple peril,
homeowner's multiple peril, commercial multiple peril, inland marine, earthquake, glass, and auto- mobile physical damage. Since the line of business data is at the national level, I assumed that that line's representation was the same at the state level as at the national level. Coastal property expo- sure is the sum of the property premium volume in the southern and eastern coastal states divided by total premium volume. The states included are Texas, Louisiana, Alabama, Mississippi, Florida, Georgia, South Carolina, North Carolina, Virginia, Washington, D.C., Delaware, Maryland, New Jersey, New York, Connecticut, Rhode Island, Massachusetts, New Hampshire, and Maine. Prop- erty premium in those states is total premium volume multiplied by the percentage of all premiums in the property lines.
13. All firm characteristics (except default ratings) are from insurers' statutory reports and re- flect the status as of 31 December of that year. Firm characteristics are lagged one year and there- fore represent the experience for the year prior to the catastrophe-reinsurance program. Since prop- erty policies are generally in force for a year, this provides a good measure of expected exposure. Almost 60 percent of reinsurance contracts begin on 1 January.
31 Insurer Demand for Catastrophe Reinsurance
Other firm characteristics affect insurer demand through the probability of financial distress, agency costs, and tax motivations. Firm leverage (LEV), de- fault risk (BRate), size (SIZE), the percentage of assets held in liquid assets (LIQ), diversification across lines of insurance (HHI), and geographic diversi- fication (NUM) affect the probability of financial distress. Leverage is the ratio of insurer liabilities (loss reserve plus loss adjustment expenses) divided by assets. Default risk is measured as Best’s rating, which varies from 13 (A+ +) to 1 (D). A rating of A+ + or A+ is rated as “superior,” while a rating of C or C- is “marginal” and a rating of D “below minimum standards” (BestS Key Rating Guide, 1993). I expect insurers with greater leverage and lower finan- cial ratings to have a higher probability of financial distress. Insurer size, mea- sured as net assets, is likely to be associated with a lower probability of finan- cial distress, all else being equal, because the insurer has a greater ability to sustain a large loss. The liquidity measure is the percentage of assets held in liquid funds (the sum of short-term investments and cash on hand divided by net assets). Firms with greater liquidity are also less likely to suffer the costs of financial distress because they are more likely to have the required funds. Diversification across lines of insurance was measured as the sum of squared shares (a Hirschman-Herfindahl index). Geographic diversification was mea- sured as the number of states in which the insurer sells insurance. I expect more diversified firms to have a lower probability of financial distress.
Tax-preference items (TAX) and insurer ownership (MUT) measure the ef- fects of tax motivations and agency costs. I use federal taxes paid normalized by net assets to control for tax motivations.14 Ownership is measured as an indicator variable that is one if the company is a mutual.
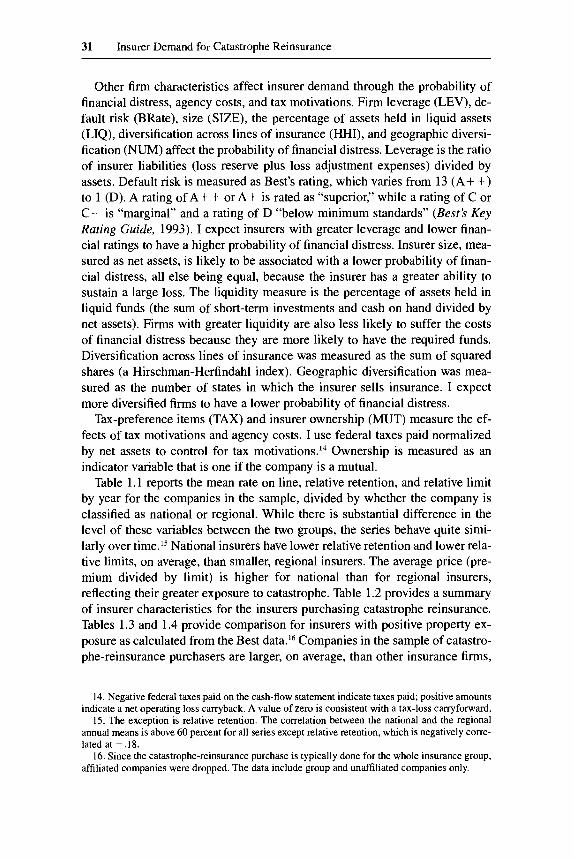
Table 1 .1 reports the mean rate on line, relative retention, and relative limit by year for the companies in the sample, divided by whether the company is classified as national or regional. While there is substantial difference in the level of these variables between the two groups, the series behave quite simi- larly over time.I5 National insurers have lower relative retention and lower rela- tive limits, on average, than smaller, regional insurers. The average price (pre- mium divided by limit) is higher for national than for regional insurers, reflecting their greater exposure to catastrophe. Table 1.2 provides a summary of insurer characteristics for the insurers purchasing catastrophe reinsurance. Tables 1.3 and 1.4 provide comparison for insurers with positive property ex- posure as calculated from the Best data.16 Companies in the sample of catastro- phe-reinsurance purchasers are larger, on average, than other insurance firms,
14. Negative federal taxes paid on the cash-flow statement indicate taxes paid; positive amounts indicate a net operating loss carryback. A value of zero is consistent with a tax-loss carryforward.
15. The exception is relative retention. The correlation between the national and the regional annual means is above 60 percent for all series except relative retention, which is negatively corre- latedat -.18.
16. Since the catastrophe-reinsurance purchase is typically done for the whole insurance group, affiliated companies were dropped. The data include group a d unaffiliated companies only.
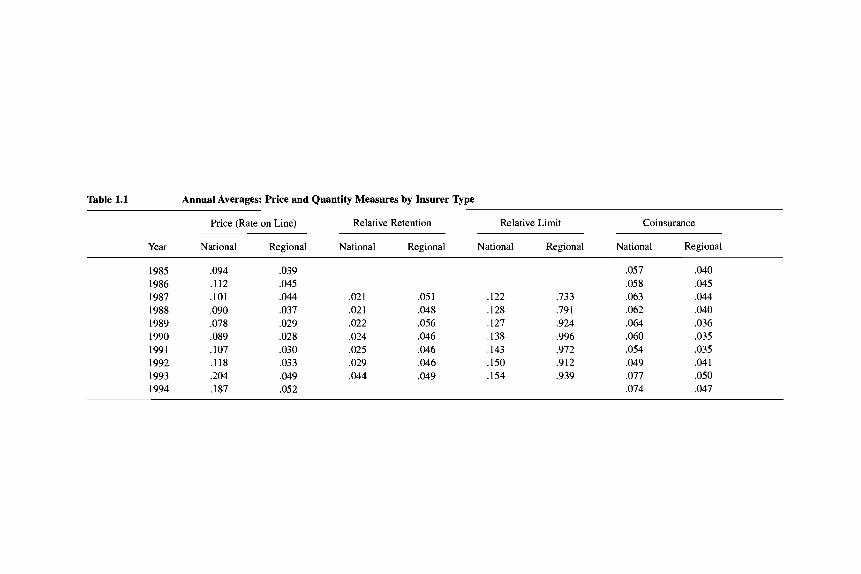
Table 1.1 Annual Averages: Price and Quantity Measures by Insurer Type
Price (Rate on Line) Relative Retention Relative Limit Coinsurance
Year National Regional National Regional National Regional National Regional
1985 1986 1987 1988 1989 1990 1991 1992 1993 1994
,094 .I12 ,101 .090 .078 .089 ,107 ,118 ,204 .I87
,039 .045 ,044 ,037 ,029 .028 ,030 ,033 ,049 .052
.057 ,058
,021 .os 1 .122 ,733 ,063 ,021 .048 .128 ,791 ,062 .022 ,056 ,127 ,924 .064 .024 ,046 ,138 ,996 .060 .025 .046 .143 ,972 ,054 .029 ,046 .150 ,912 ,049 .044 ,049 ,154 .939 .077
.074
,040 ,045 .044 ,040 .036 .035 .035 ,041 ,050 .047
33 Insurer Demand for Catastrophe Reinsurance
Table 1.2 Summary Statistics of Insurer Data: Guy Carpenter Data
Variable Obs. Mean SD Min. Max.
SIZE 302 4,280,000,000 470,000,000 1,857,248 24,700,000,000 PROP 302 ,653 .267 ,143 .999 TAX 302 - .007 ,015 - .062 ,037 HHI 302 ,285 ,143 ,110 ,818 COAST 302 ,378 ,341 0 ,997 LEV 302 ,374 .195 .O 1 85 ,707 LIQ 302 .093 ,086 - ,0060 ,599 RRET 302 .0395 .026 .0034 ,174 RLIM 302 ,586 .525 ,025 1.921 COINS 302 ,047 ,024 0 .15 REGL 302 ,593 .492 0 1 BRate 298 10.960 1.465 3 13 NUM 302 23.815 23.205 1 51 YEAR 302 89.944 1.993 87 93
Table 1.3 Summary Statistics of Insurer Data: Full Sample ~ ~~ ________
Variable Obs. Mean SD Min. Max.
GC sample 4,293 ,070 ,256 0 1 Gc plus 4,293 .084 .277 0 1 SIZE 4,293 671,000,000 2,730,000,000 143,157 51,000,000,000 PROP 4,293 .587 ,302 1.23E-05 1.178 TAX 4,293 -.0107 ,024 -.417 ,339 HHI 4,293 ,415 ,223 ,102 1.807 COAST 4,293 .245 ,313 0 1.137 LEV 4,293 ,312 ,187 4.5E-05 1.062 LIQ 4,293 ,195 ,208 - ,036 1.315 NUM 4,293 15.242 18.794 0 51 YEAR 4,293 89.721 1.722 87 93
Note: GC = Guy Carpenter.
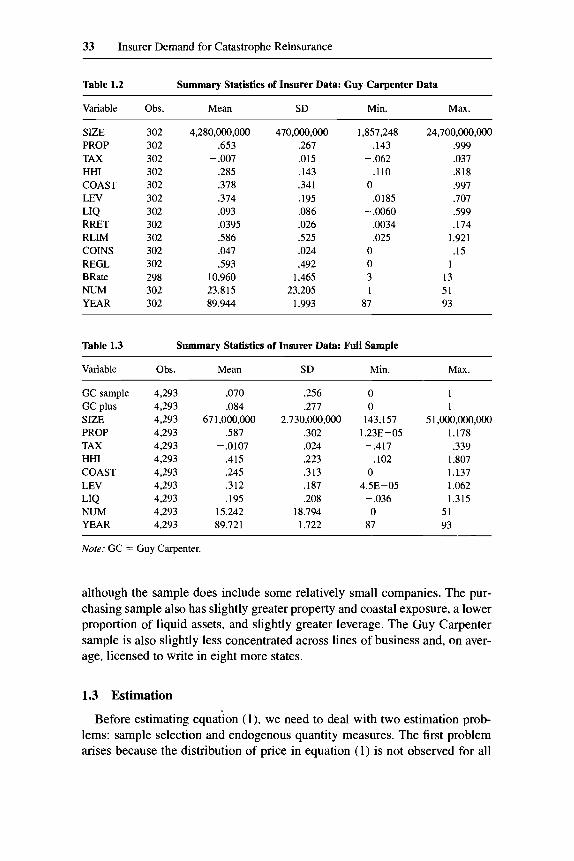
although the sample does include some relatively small companies. The pur- chasing sample also has slightly greater property and coastal exposure, a lower proportion of liquid assets, and slightly greater leverage. The Guy Carpenter sample is also slightly less concentrated across lines of business and, on aver- age, licensed to write in eight more states.
1.3 Estimation
Before estimating equation (I) , we need to deal with two estimation prob- lems: sample selection and endogenous quantity measures. The first problem arises because the distribution of price in equation (1) is not observed for all
34 AnneGron
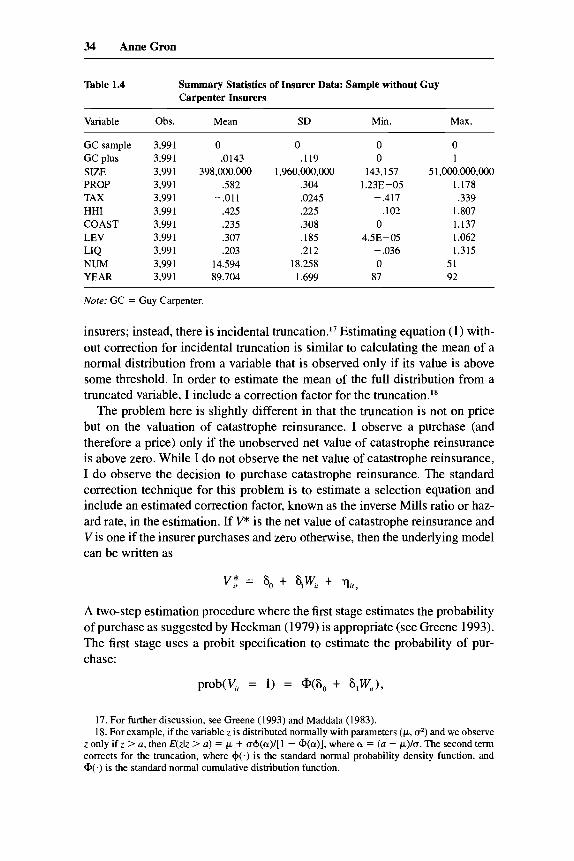
Table 1.4 Summary Statistics of Insurer Data: Sample without Guy Carpenter Insurers
Variable
GC sample GC plus SIZE PROP TAX HHI COAST LEV
NUM YEAR
LIQ
Obs.
3,991 3,991 3,991 3,991 3,991 3,991 3,991 3,991 3,991 3,991 3,991
Mean SD Min. Max
0 ,0143
398,000,000 ,582
-.011 ,425 ,235 ,307 .203
14.594 89.704
0 .I19
,304 ,0245 ,225 ,308 ,185 ,212
18.258 1.699
1,960,000,000
0 0
143,157 1.238-05
-.417 .I02
0 4.5E-05 - .036 0
87
0 1
5 1 ,o0o,o0o,ooo 1.178 ,339
1.807 1.137 1.062 1.315
51 92
Nore; GC = Guy Carpenter.
insurers; instead, there is incidental truncation.l’ Estimating equation (1) with- out correction for incidental truncation is similar to calculating the mean of a normal distribution from a variable that is observed only if its value is above some threshold. In order to estimate the mean of the full distribution from a truncated variable, I include a correction factor for the truncation.l8
The problem here is slightly different in that the truncation is not on price but on the valuation of catastrophe reinsurance. I observe a purchase (and therefore a price) only if the unobserved net value of catastrophe reinsurance is above zero. While I do not observe the net value of catastrophe reinsurance, I do observe the decision to purchase catastrophe reinsurance. The standard correction technique for this problem is to estimate a selection equation and include an estimated correction factor, known as the inverse Mills ratio or haz- ard rate, in the estimation. If V* is the net value of catastrophe reinsurance and V is one if the insurer purchases and zero otherwise, then the underlying model can be written as
V $ = so + SIW, + A two-step estimation procedure where the first stage estimates the probability of purchase as suggested by Heckman (1979) is appropriate (see Greene 1993). The first stage uses a probit specification to estimate the probability of pur- chase:
prob(v, = 1) = @(So + s,W,,),
17. For further discussion, see Greene (1993) and Maddala (1983). 18. For example, if the variable z is distributed normally with parameters (p, a’) and we observe
z only if z > a, then E(zlz > a ) = I*. + IJ+(cY)/[~ - @(a)], where CY = (a - k)/u. The second term corrects for the truncation, where +(.) is the standard normal probability density function, and @(.) is the standard normal cumulative distribution function.
35 Insurer Demand for Catastrophe Reinsurance
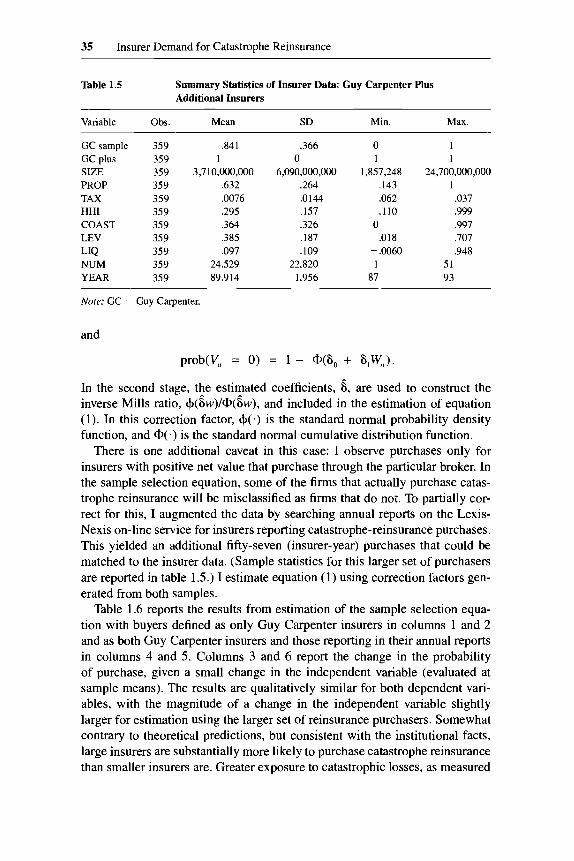
Table 1.5 Summary Statistics of Insurer Data: Guy Carpenter Plus Additional Insurers
~~~ ~ ~ ~
Variable Obs. Mean SD Min. Max.
GC sample GC plus SIZE PROP TAX HHI COAST LEV LIQ NUM YEAR
359 .84 I 359 1 359 3,710,000,000 359 .632 359 - ,0076 359 .295 359 ,364 359 ,385 359 .097 359 24.529 359 89.914
,366
6,090,000,000 .264 .0144 ,157 ,326 ,187 ,109
22.820 1.956
0 0 1
1,857,248 ,143
- ,062 .I10
0 ,018
- ,0060 1
87
1 1
1 24,700,000,000
,037 .999 ,997 ,707 .948
51 93
Nore: GC = Guy Carpenter.
and
In the second stage, the estimated coefficients, 6, are used to construct the inverse Mills ratio, +(6w)/@(6w), and included in the estimation of equation (1). In this correction factor, +(.) is the standard normal probability density function, and @ ( a ) is the standard normal cumulative distribution function.
There is one additional caveat in this case: I observe purchases only for insurers with positive net value that purchase through the particular broker. In the sample selection equation, some of the firms that actually purchase catas- trophe reinsurance will be misclassified as firms that do not. To partially cor- rect for this, I augmented the data by searching annual reports on the Lexis- Nexis on-line service for insurers reporting catastrophe-reinsurance purchases. This yielded an additional fifty-seven (insurer-year) purchases that could be matched to the insurer data. (Sample statistics for this larger set of purchasers are reported in table 1.5.) I estimate equation (1) using correction factors gen- erated from both samples.
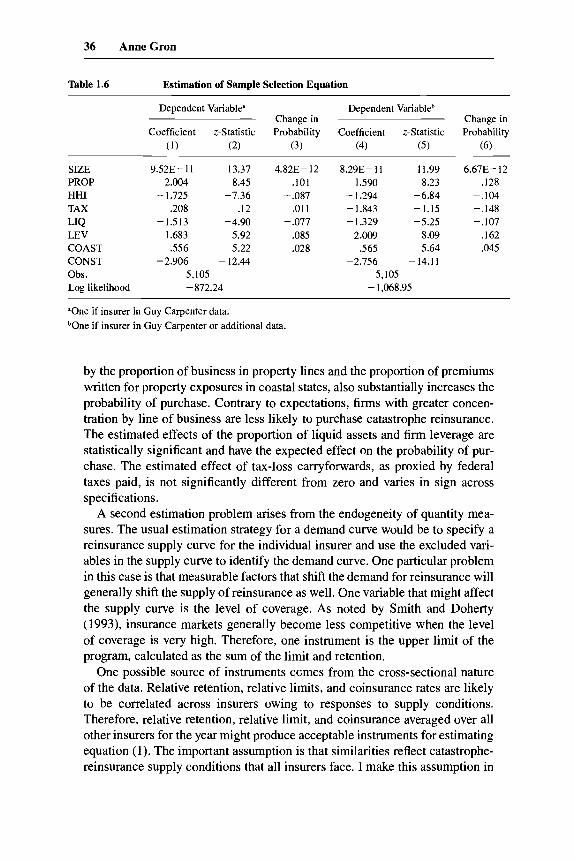
Table 1.6 reports the results from estimation of the sample selection equa- tion with buyers defined as only Guy Carpenter insurers in columns l and 2 and as both Guy Carpenter insurers and those reporting in their annual reports in columns 4 and 5. Columns 3 and 6 report the change in the probability of purchase, given a small change in the independent variable (evaluated at sample means). The results are qualitatively similar for both dependent vari- ables, with the magnitude of a change in the independent variable slightly larger for estimation using the larger set of reinsurance purchasers. Somewhat contrary to theoretical predictions, but consistent with the institutional facts, large insurers are substantially more likely to purchase catastrophe reinsurance than smaller insurers are. Greater exposure to catastrophic losses, as measured
36 AnneGron
Table 1.6 Estimation of Sample Selection Equation
Dependent Variable" Dependent Variableb Change in Change in
Coefficient z-Statistic Probability Coefficient z-Statistic Probability (1) (2) (3) (4) (5) (6)
SIZE PROP HHI TAX
LEV COAST CONST Obs. Log likelihood
LIQ
9.528- 11 13.37 4.82E-12 2.004 8.45 .I01
- 1.725 -7.36 - ,087 .208 .I2 ,011
-1.513 -4.90 -.077 1.683 5.92 ,085 .556 5.22 ,028
-2.906 -12.44 5,105 -872.24
8.29E- 11 11.99 6.67E- 12 1.590 8.23 ,128
- 1.294 -6.84 -.lo4 - 1.843 -1.15 -.148 - 1.329 -5.25 -.lo7
2.009 8.09 ,162 ,565 5.64 ,045
-2.756 - 14. I I 5,105
- 1,068.95
*One if insurer in Guy Carpenter data. if insurer in Guy Carpenter or additional data.
by the proportion of business in property lines and the proportion of premiums written for property exposures in coastal states, also substantially increases the probability of purchase. Contrary to expectations, firms with greater concen- tration by line of business are less likely to purchase catastrophe reinsurance. The estimated effects of the proportion of liquid assets and firm leverage are statistically significant and have the expected effect on the probability of pur- chase. The estimated effect of tax-loss carryforwards, as proxied by federal taxes paid, is not significantly different from zero and varies in sign across specifications.
A second estimation problem arises from the endogeneity of quantity mea- sures. The usual estimation strategy for a demand curve would be to specify a reinsurance supply curve for the individual insurer and use the excluded vari- ables in the supply curve to identify the demand curve. One particular problem in this case is that measurable factors that shift the demand for reinsurance will generally shift the supply of reinsurance as well. One variable that might affect the supply curve is the level of coverage. As noted by Smith and Doherty (1993), insurance markets generally become less competitive when the level of coverage is very high. Therefore, one instrument is the upper limit of the program, calculated as the sum of the limit and retention.
One possible source of instruments ccmes from the cross-sectional nature of the data. Relative retention, relative limits, and coinsurance rates are likely to be correlated across insurers owing to responses to supply conditions. Therefore, relative retention, relative limit, and coinsurance averaged over all other insurers for the year might produce acceptable instruments for estimating equation (1). The important assumption is that similarities reflect catastrophe- reinsurance supply conditions that all insurers face. I make this assumption in
37 Insurer Demand for Catastrophe Reinsurance
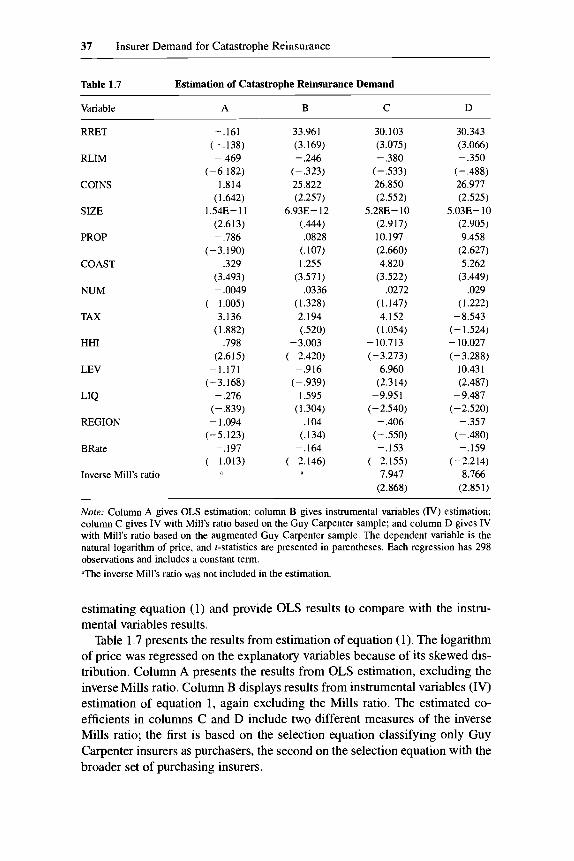
Table 1.7 Estimation of Catastrophe Reinsurance Demand
Variable A B C D
RRET
RLIM
COINS
SIZE
PROP
COAST
NUM
TAX
HHI
LEV
LIQ
REGION
BRate
Inverse Mill's ratio
-.I61 (- ,138) - ,469
(-6.182) 1.814
( 1.642) 1.54E- 11
(2.613) - ,786
( - 3.190) ,329
(3.493) - ,0049
(- 1.005) 3.136
(1 3.82) ,798
(2.6 15) -1.171
(-3.168) - ,276
(-339) - 1.094
(-5.123) -.197
(- 1.013)
33.961 (3.169) - ,246
(-,323) 25.822 (2.257)
6.93E- 12 (.M) ,0828
(.107) 1.255
(3.571) ,0336
(1.328) 2.194 (.520)
-3.003 (-2.420)
-.916 (- ,939)
1.595 (1.304)
,104 (.134)
-.164 (-2.146)
30.103 (3.075) -.380
(-,533) 26.850 (2.552)
5.288- 10 (2.917) 10.197 (2.660) 4.820
(3.522) .0272
(1.147) 4.152
(1.054) -10.713 (-3.273)
6.960 (2.314)
-9.951 (-2.540) - ,406
(- ,550) -.153
(-2.155) 7.947
(2.868)
30.343 (3.066) -.350
(- ,488) 26.977 (2.525)
5.03E- 10 (2.905) 9.458
(2.627) 5.262
(3.449) .029
(1.222) -8.543
(- 1 524) - 10.027 (-3.288)
10.431 (2.487)
-9.487 (-2.520) - ,357
(- .480) -.159
(-2.214) 8.766
(2.851)
Nore: Column A gives OLS estimation; column B gives instrumental variables (N) estimation; column C gives IV with Mill's ratio based on the Guy Carpenter sample; and column D gives N with Mill's ratio based on the augmented Guy Carpenter sample. The dependent variable is the natural logarithm of price, and t-statistics are presented in parentheses. Each regression has 298 observations and includes a constant term. "The inverse Mill's ratio was not included in the estimation.
estimating equation (1) and provide OLS results to compare with the instru- mental variables results.
Table 1.7 presents the results from estimation of equation (1). The logarithm of price was regressed on the explanatory variables because of its skewed dis- tribution. Column A presents the results from OLS estimation, excluding the inverse Mills ratio. Column B displays results from instrumental variables (IV) estimation of equation 1, again excluding the Mills ratio. The estimated co- efficients in columns C and D include two different measures of the inverse Mills ratio; the first is based on the selection equation classifying only Guy Carpenter insurers as purchasers, the second on the selection equation with the broader set of purchasing insurers.
38 AnneGron
The simple, OLS regression of price on quantity measures and firm charac- teristics does not perform particularly well. While the estimated effect of the relative limit is negative and the estimated effect of coinsurance is positive, as expected, the latter is not statistically significant at the 10 percent level. The estimated effect of relative retention is not different from zero. In addition, property exposure and leverage are statistically significant with the wrong signs. From the results in columns B-D, one sees that the coefficients on rela- tive retention and coinsurance increase substantially (in magnitude and statisti- cal significance) using instrumental variables, as one might expect if supply and demand effects were confounded in column A. The estimated effect of relative limit, however, decreases slightly in magnitude and remains negative but is not statistically different from zero. Estimation using instrumental vari- ables causes the estimated coefficients on property exposure and leverage to be statistically insignificant. In addition, the estimated effects of diversification across lines is now negative and statistically different from zero.
Inclusion of the inverse Mills ratio in columns C and D improves the perfor- mance of the firm characteristics without substantially changing the estimated effects of the endogenous variables. In column C, the inverse Mills ratio is based on the Guy Carpenter data only, whereas, in column D, additional obser- vations of catastrophe-reinsurance purchases are included. The results in both columns are quite similar, both quantitatively and qualitatively. The exception is the tax variable, which was also significantly different across specifications in table 1.6. The coefficient on the inverse Mill's ratio, correcting for sample selection, is positive and statistically significant, confirming the expected posi- tive selection bias. Insurers with greater valuation of catastrophe reinsurance are more likely to be in our sample.
Increasing catastrophe exposure increases the demand for catastrophe rein- surance, as seen from the estimated effect of property and coastal exposure. Insurers with a higher probability of financial distress-those with higher le- verage and lower Best's ratings-have a greater demand for catastrophe rein- surance as well. Insurers with a greater proportion of liquid assets have a lower demand for catastrophe reinsurance, also consistent with expectations. The es- timated effect of insurer size is positive and statistically significant as well. Insurers writing in more states have a greater willingness to pay for catastrophe reinsurance, although the estimated effect is not statistically different from zero. The estimated coefficient of being a regional insurer is negative. This is contrary to the expected effect if these variables are measuring geographic diversification. The indicator variable for ownership structure (mutual or stock) was not included in the estimation because the variable was highly collinear with the regional indicator ~ariab1e.l~
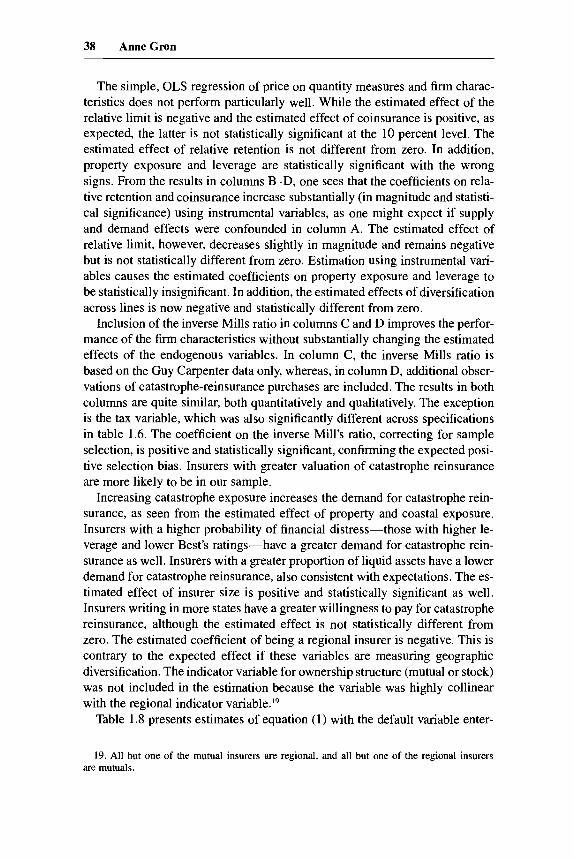
Table 1.8 presents estimates of equation (1) with the default variable enter-
19. All but one of the mutual insurers are regional, and all but one of the regional insurers are mutuals.
39 Insurer Demand for Catastrophe Reinsurance
Table 1.8 Estimation of Catastrophe Reinsurance Demand with Categorical Default Variable
Variable A B
RRET
RLIM
COINS
SIZE
PROP
COAST
NUM
TAX
HHI
LEV
LIQ
REGION
BRate < 7 (B or below)
BRate 8 or 9 (B+, B++)
BRate 10or 11 (A-, A)
Inverse Mill's ratio
32.864 (3.077) ~ ,282
(-.345) 28.183 (2.512)
5.7OE-10 (2.893) 10.977 (2.650) 5.202
(3.493) ,0352
(1.258) 3.706 (394)
- 12.042 (-3.269)
7.303 (2.262)
- 10.659 (-2.493)
-.285 (- ,343)
1.695 (2.473)
,589 ( 1.675)
,0678 (.461) 8.640
(2.864)
33.228 (3.059) - ,248
( - ,300) 28.37 (2.480)
5.36E- 10 (2.850) 10.047 (2.585) 5.629
(3.396) ,0374
( 1.320) -9.927
( - 1.634) -11.204 (-3.271)
10.928 (2.421)
-9.994 ( - 2.44 1)
~ ,227 (- ,268)
1.73 1 (2.486)
6 1 1 ( 1.716)
,0740 (500) 9.410
(2.818)
Note: Column A gives instrumental variables (IV) with Mill's ratio based on the Guy Carpenter sample, and column B gives IV with Mill's ratio based on the augmented Guy Carpenter sample. The dependent variable is the natural logarithm of price, and ?-statistics are presented in parenthe- ses. Each regression has 298 observations and includes a constant term.
ing as discrete categories rather than as a continuous variable. Four categories are included: rating of B or below, rating of B+ or B++ , rating of A- or A, and rating of A+ or A+ + (the excluded category). Insurers with lower ratings have significantly greater demand for catastrophe reinsurance, and the insurers with the lowest ratings have the highest demand, but there is no statistical dif- ference between insurers in the two highest categories. The estimated effects of the other variables are qualitatively similar to those in columns C and D of table 1.7.
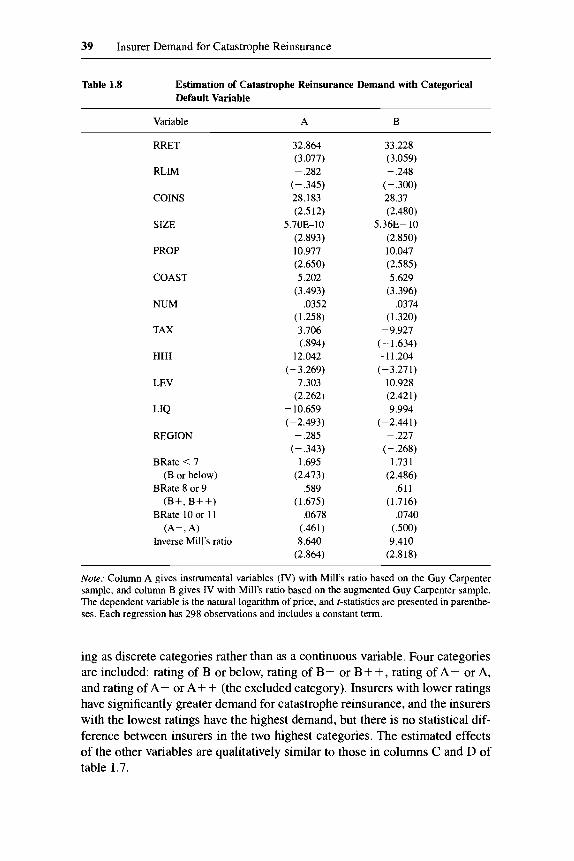
40 AnneGron
Table 1.9 Estimation of Catastrophe Reinsurance Demand with Year and Firm Effects
Variables A B C D
RRET
RLIM
COINS
SIZE
PROP
COAST
NUM
TAX
HHI
LEV
LIQ
REGION
BRate < 7 (B or below)
BRate 8 or 9 (B+, B + + )
BRate 10 or 11 (A-, A)
Inverse Mill's ratio
- ,839 (- ,858) - ,537
(-7.969) .0526
(.053) 2.02E- 10
(3.942) 2.735
(2.691) 1.700
(4.637) - ,00246
( - ,602) .67 1
(.446) -2.533
(-2.998) ,809
(.956) -3.760
(- 3.229) - 1.330
(-7.358) .219
(1.560) -.00196
(- ,023) ,0153
(.338) 2.863
(3.668)
- 352 (-.877) - ,540
(-8.072) .0769
(.079) 2.19E- 10
(4.452) 2.956
(3.109) 2.0691
(5.034) - .0020
(- ,514) -4.467
(-2.446) -2.651
(-3.398) 2.651
(2.260) -4.158
(-3.695) - 1.340
( -7.464) ,227
(1.626) ,00362
(.043) ,0167
(.372) 3.613
(4.169)
12.479 (2.036)
-1.371 (-3.639)
1 5.909 (3.297)
5.69E- 10 (3.341) 11.754 (3.304) 1.756 (360) ,101
(1.111) 4.187
(2.038) -8.683
(-3.389) 9.107
(3.233) -11.190 (-2.998) -23.979
(- ,005) - .265
(- ,906) -.131
(-,568) ,0362
(.304) 7.548
(2.950)
11.621 (1.888) - 1.298
(- 3.434) 16.676 (3.369)
6.13E- 10 (3.567) 12.43 1 (3.567) 2.525
(1.181) ,0956
( 1.063) -9.500
(-2.3 13) -8.737
(-3.625) 13.911 (3.425)
- 12.293 (-3.259)
5.077 (1.139) p.238
(- .8 19) -.111
(- ,487) .0376
(.318) 9.578
(3.210)
Nore: Column A gives instrumental variables (IV) with Mill's ratio based on the Guy Carpenter sample with year fixed effects; column B gives IV with Mill's ratio based on the augmented Guy Carpenter sample with year fixed effects; column C gives IV with Mill's ratio based on the Guy Carpenter sample with firm fixed effects; and column D gives IV with Mill's ratio based on the augmented Guy Carpenter sample with firm fixed effects. The dependent variable is the natural logarithm of price, and r-statistics are presented in parentheses. Each regression has 298 observa- tions and includes a constant term.
Table 1.9 investigates the robustness of the results when I control for year and firm effects. The results in columns A and B include year effects, those in columns C and D firm fixed effects. In contrast to the earlier results, the esti- mated effect of relative retention and coinsurance is not statistically different from zero when year fixed effects are added. The estimated effect of relative limit, however, is now statistically different from zero, although the estimated
41 Insurer Demand for Catastrophe Reinsurance
coefficient does not change as much as those of the other two quantity mea- sures. This suggests that the time-series variation in the data is important for estimating the effects of relative retentions and coinsurance. The estimated coefficients for the other variables are generally much smaller in magnitude, but the qualitative results are largely similar to those in tables 1.8 and 1.9.
Columns C and D in table 1.9 report results including firm fixed effects. In this specification, all three quantity variables have the expected sign and are statistically different from zero. The magnitudes of the estimated effects of relative retention and coinsurance lie between those reported in columns A and B of tables 1.7 and 1.8, while the estimated effect of relative limit is much greater than in other specifications. The qualitative effects of the insurer char- acteristics are generally similar to those found in tables 1.7 and 1.8. One excep- tion is the default variable, which is now statistically insignificant. Including both year and firm fixed effects (not reported) yields results similar to those of columns A and B in table 1.9.
1.4 Discussion
Although the estimated magnitudes of the coefficients vary across specifi- cations, several interesting and robust findings emerge. Insurers with a greater probability of financial distress, as measured by higher leverage, lower liquid- ity, and lower ratings, have a greater willingness to pay for catastrophe reinsur- ance. Insurers with greater catastrophe exposure also have a higher demand for catastrophe reinsurance. Other results are more surprising. Larger insurers have a greater demand for catastrophe reinsurance. Demand by regional insur- ers was not statistically different from that of national insurers.
These results are less surprising if one considers the components of a catas- trophe reinsurance contract in banking terms.*O Each contract can be thought of as having two components: it creates a contingent liability that increases the probability that the firm remains solvent, and it acts like a loan commitment to provide liquidity. As argued earlier, larger insurers are less likely to become in- solvent and so will value the contingent liability less than smaller insurers will.
However, the loan commitment has value only for solvent firms that lack liquidity. Larger insurers are less likely to be insolvent and therefore are more likely to be solvent but illiquid following a large loss. Larger firms value the liquidity component more than smaller firms. Therefore, the expected effect of insurer size is indeterminant. The results are consistent with liquidity effects dominating solvency effects in these data.
The specification of equation (1) is particularly important for the estimated quantity effects and tax effects. In specifications without time effects, relative retention and coinsurance had the expected, positive effects. In specifications with time effects, relative limit had the expected, negative effect, but the other
20. I am grateful to Raghu Rajan for this insight.
42 AnneGron
two quantity measures were statistically insignificant. The estimated effect of the tax variable appears to be very sensitive to the specification of the sample selection correction. The inconsistent performance of this variable may well come from its high correlation with firm profits, which are likely to be endoge- nous to other firm decisions.
This study complements other recent investigations of corporate risk man- agement. Two of these, Mayers and Smith (1990) and Garven (1994), focus on insurers’ use of reinsurance. Mayers and Smith (1990) find that the quantity of reinsurance used is increasing in the concentration across lines of ownership, increasing in default risk, decreasing in insurer size, and decreasing in concen- tration across lines of insurance and geographically. Garven ( 1994) extends the work of Mayers and Smith and relates the quantity of reinsurance to measures of investment and claims risk. The riskiness of investment returns is negatively related to the amount of reinsurance used, while geographic concentration and line-of-business concentration have similar estimated effects as in Mayers and Smith.
Three other studies-Nance, Smith, and Smithson (1993), Gezcy, Minton, and Schrand (1997), and Tufano (1996)-examine the use of hedging instru- ments in industries other than insurance. Nance, Smith, and Smithson (1993) and Gezcy, Minton, and Schrand (1997) examine the determinants of deriva- tive use. These investigations are quite similar to the sample selection esti- mation presented in table 1.3 above. Both studies conclude that hedging with financial derivatives is more likely for firms with greater costs of financial dis- tress (measured by low liquidity) and larger firms. Nance, Smith, and Smithson find evidence for tax motivations, while Gezcy, Minton, and Schrand find that firms with greater risk exposure and those that use other financial risk- management tools are more likely to use particular financial derivatives. Tu- fano (1996) finds that the managerial incentive measures are the major factor explaining the differences in risk management among the gold-mining firms in his study.
This study differs from previous studies in several important dimensions. The data include the cost of risk management as well the quantity. Unlike other studies of reinsurance more generally, this study allows us to generate better measures of exposure to risk since it examines catastrophe reinsurance spe- cifically. Also, catastrophe reinsurance can be used only to hedge risk, unlike financial derivatives, which can be used to speculate. Like previous studies, this study shows that insurers with a higher probability of financial distress have greater demand for risk-management activities; however, I find that lever- age as well as liquidity is important. I also find that larger insurers are more likely to purchase catastrophe reinsurance and have greater demand. This con- trasts somewhat with previous research that finds that larger firms are more likely to employ financial derivatives or that smaller insurers purchase more reinsurance. Even after controlling for the fact that larger firms are more likely to purchase, larger firms still have greater demand for catastrophe reinsurance.
43 Insurer Demand for Catastrophe Reinsurance
The findings indicate several directions for future research. Taken together with the results of previous studies, they show that the costs of financial dis- tress are important determinants of corporate risk management but that the firm characteristics that best measure the costs of financial distress may vary across industries. For example, in this study, leverage and liquidity were asso- ciated with costs of financial distress, while, in Gezcy, Minton, and Schrand (1 997), liquidity and research-and-development expenditures were particularly important. Further research investigating corporate risk management should be careful to allow for industry-specific effects of firm characteristics.
Further investigation into the liquidity and solvency components of insur- ance is also warranted. Are similar effects observed in other types of reinsur- ance, and do corporate purchasers of insurance exhibit similar behavior? It may be that the liquidity component dominates the solvency component for some, but not all, types of insurance and reinsurance. For types of insurance where the liquidity component is particularly important for large firms, finan- cial products providing lines of credit may be reasonable substitutes for insur- ance. With respect to the alternative financing structures proposed for catastro- phe risks, these findings suggest that risk financing may be as important, if not more important, than risk transfer for larger insurers. Indeed, large insurers are pursuing alternative financing instruments that provide financing at the time of a large catastrophe without risk transfer. For example, Nationwide Mutual and Morgan Guaranty have established an agreement whereby Nationwide can is- sue up to $400 million in debt instruments (called surplus notes) to a guaran- teed buyer (see Chookaszian, chap. 11 in this volume).
References
A. M. Best Co. 1993. Best’s key rating guide. Oldwick, N.J. . Various years. Best’s insurance reports. Oldwick, N.J. . Various years. Best’s insurance tapes. Oldwick, N.J.
Froot, Kenneth A., David S. Scharfstein, and Jeremy Stein. 1993. Risk management: Coordinating corporate investment and financing policies. Journal of Finance 48: 1 629-5 8.
G w e n , James R. 1994. The demand for reinsurance: Theory and empirical evidence. Working paper. Department of Finance, Graduate School of Business Administra- tion, University of Texas at Austin.
Gezcy, Christopher, Bernadette Minton, and Catherine Schrand. 1997. Why firms use currency derivatives. Journal of Finance 52: 1323-54.
Greene, William H. 1993. Econometric analysis. New York: Macmillan. Gron, Anne. 1994a. Capacity constraints and cycles in property-casualty insurance
. 1994b. Evidence of capacity constraints in insurance markets. Journal of Law
Heckman, J. 1979. Sample selection bias as a specification error. Econometrica 47:
markets. Rand Journal of Economics 25:llO-27.
and Economics 3739-77.
153-61.
44 AnneGron
Johnson and Higgens. 1992. Self-insurance: Trends and perspectives, 1992. Chicago. Lamm-Tenant, Joan, and Laura T. Starks. 1993. Stock versus mutual ownership struc-
tures: The risk implications. Journal of Business 66:29-46. Litzenberger, Robert H., David R. Beaglehole, and Craig E. Reynolds. 1996. Assessing
catastrophe-reinsurance-linked securities as a new asset class. Fixed Income Re- search Series. New York: Goldman Sachs.
Maddala, G. S . 1983. Limited dependent and qualitative variables in econometrics. New York: Cambridge University Press.
Mayers, David, and Clifford W. Smith Jr. 1982. On the corporate demand for insurance. Journal of Business 55:281-96.
. 1990. On the corporate demand for insurance: Evidence from the reinsurance market. Journal of Business 63: 19-40.
Murphy, Michael. 1995. Alternatives devour a primary marketplace. Best’s Review P/C, March, 44-47,
Nance, Deanna R., Clifford W. Smith Jr., and Charles W. Smithson. 1993. On the deter- minants of corporate hedging. Journal of Finance 48:267-84.
Smith, Clifford W., Jr., and Neil A. Doherty. 1993. Journal of Applied Corporate Fi- nance 6, no. 3:4-15.
Smith, Clifford W., Jr., and Rene Stulz. 1985. The determinants of firms’ hedging poli- cies. Journal of Financial and Quantitative Analysis 20:39 1-405.
Tufano, Peter. 1996. Who manages risk? An empirical examination of risk management practices in the gold mining industry. Journal of Finance 51, no. 4 (September):
Wharton School and Chase Manhattan Bank. 1995. Survey of derivative useage among US non-jnancial firms. Executive summary. Philadelphia: Weiss Center for Intema- tional Financial Research, Wharton School.
Winter, Ralph A. 1988. The liability crisis and the dynamics of competitive insurance markets. Yale Journal on Regulation 5:455-500.
. 1994. The dynamics of competitive insurance markets. Journal of Financial Intermediation 3:379-415.
1097-1137.
Comment Steven F. Goldberg
When I was asked to comment on Anne Gron’s paper, my first inclination was to pull a Nancy Reagan and just say no. My presence at the conference was intended to be a one-way street: I would absorb all the academic raw intelli- gence on this subject and maybe in the process seek double or even triple credit for my actuarial continuing education.
I became chief actuary at USAA in 1989. That year turned out to be a major turning point for me and the industry. Prior to Humcane Hugo in that year, the insurance industry had never suffered a loss of over $1 billion from any single disaster. Since that time, we have had ten disasters that exceeded that amount. As you might imagine, my watch has been dominated by this problem.
Catastrophes, of course, present a significant challenge to the U.S. economy
Steven F. Goldberg is senior vice president, chief property and casualty actuary, for USAA P&C Co. in San Antonio. He is a fellow of the Casualty Actuarial Society, a member of the American Academy of Actuaries, and a chartered property and casualty underwriter.
45 Insurer Demand for Catastrophe Reinsurance
and to the U.S. property-casualty-insurance industry, posing financial solvency, capital accumulation, and insurance-availability issues. One of the principal tools used by insurers has been catastrophe reinsurance, but recent events have brought about many changes in demand for this product.
I am glad to see that the academic community is beginning to focus on these issues. I welcome Anne’s paper and the others to be presented here in the next few days. I have to admit that the subject of Anne’s paper was appealing to me. Having been part of the real demand for catastrophe reinsurance, I was wondering how this process could possibly be treated in an academic setting.
My personal view was that this market functioned in such a way that willing buyers would meet up with willing sellers in an environment that would have made Adam Smith proud. But, in 1992, following Hurricane Andrew, willing buyers became desperate buyers, while willing sellers vanished. Today, some of the old willing sellers have reappeared, a bit sobered. But, now, new willing sellers from an odd island known for a famous triangle have entered the picture as the invisible hand of competition once again seeks an equilibrium.
Those of us who are willing buyers are not fully satisfied with today’s willing sellers. They just are not able to sell enough of the product at the full range of the buyers’ needs. Thus, many of the buyers long for an additional source of sellers who can add more product at levels where the current sellers choose not to. Once again, it all follows the natural law that we call economics.
Anne’s paper was quite interesting because she was able to assert conclu- sions empirically that those of us who are so-called practitioners observe anec- dotally. I have chosen to accept the statistical methodology in Anne’s paper at face value and leave to others the task of critiquing this aspect. I will note that there are a few practical areas that may bear some further analysis.
First, the data were derived from the period 1987-93. That is a little like examining the stock market from 1925 to 1930; it’s a pretty mixed bag. The earlier part of the period was dominated by a paradigm of denial in the market- place that went something like this: Since large catastrophes did not occur recently, they will never occur at all. I am not sure when we will be able to analyze this kind of data to find a typical pattern because this presupposes some sort of steady state.
Second, at the beginning of her paper, Anne asserts that not all insurers find it desirable to purchase catastrophe reinsurance that results in more accurate estimation. I think that, when we examine more closely why all insurers do not find it desirable to purchase catastrophe reinsurance, we find a circularity problem. That is, the very largest insurers need so much catastrophe reinsur- ance that their entry into the market itself substantially affects the demand. I have no idea how to adjust for that.
Finally, I fully agree with Anne when she says that insurers do trade off quantity and price when purchasing catastrophe reinsurance, that, as prices increase, insurers increase retention levels, decrease total limits, and increase coinsurance rates.
My empirical observation about the insurer demand for catastrophe reinsur-
46 AnneGron
ance tends to be a bit simplistic, but it does agree with Anne’s findings. A personal analogy would be my decision on purchasing my own car insurance. My personal equivalent of the market effect of Hurricane Andrew was last year when my son first got his driver’s license. I always liked car insurance as a product (primarily because it was one product that I thought I understood). It protected my investment in my automobile and the obligation owed to society for my negligence in operating this automobile. I decided how much coverage to buy on the basis of an internal budget of about what I thought it would cost. Then came the shock of the sixteen-year-old male. All of a sudden, the demand for my insurance increased, but the price increased even more. I reevaluated what I wanted to pay for and thus increased my deductibles to the base level of pain. In other words, I had greater probability of financial distress and thus greater demand for insurance. I surely had greater personal catastrophe ex- posure.
While it may seem very crude, I approach the reinsurance buying decision in much the same way I approach my own personal insurance buying decision. What I need is a function of what I can afford, which is a function of what it costs. How high my retention is depends on how much pain I am willing to endure and what I am willing to pay. I may even be willing to change the original risk by increasing the risk that original policyholders take on them- selves in highly risk-prone areas.
I do not want to suggest that these multimillion-dollar decisions are made frivolously. There is a lot more going on than I have suggested. In the case of USAA, we carefully examine our risk as modeled by the very best scientists, whom we employ as consultants through risk-modeling firms. We look at the wholesale cost of our reinsurance as if we were selling it to ourselves. Then we look at what the market is selling it for and make the best business decision under these circumstances. Sometimes, the price we choose to target governs the amount of capacity that we will achieve in the global marketplace. Our overall financial position and tax status go into making these final determina- tions. These decisions are important enough that our board of directors is fre- quently briefed about them.
I want to emphasize here some of the practical issues that may apply only to USAA’s unique market. What we cannot do at USAA is walk away from our members. Our corporate mission obligates us to find a way to serve our mem- bers wherever they are. The level of service will have to be a function of a trade-off between the needs of individual members and the needs of the mem- bership.
A critical new element is how to calculate the allocation of the cost of rein- surance to pass through to the ultimate consumer. This is a new dimension in the actuarial pricing equation because of the scale of the costs in the market. We want to charge only those members who are offered protection the ultimate cost of catastrophe reinsurance. Members with no such risk should not pay for it.
47 Insurer Demand for Catastrophe Reinsurance
As a result of the sacred bond that we have with our members, we are going to work especially hard to find ways to provide this coverage fairly. Walking away from long-term commitments is the easy way out. The hard road is to hang in there, build up capital, seek additional sources of capacity, and thereby avoid the government inefficiently seizing another consumer need. I think that our industry would be in better condition in the long run if others were able to manage in a similar manner.
Insurers should be encouraged to engage in prudent risk-management be- havior. We believe that one additional method of encouraging prudent risk be- havior is to permit insurers to establish tax-deductible reserves for future catas- trophes. Current tax laws and accounting principles discourage U.S. insurers from accumulating assets specifically to pay for future catastrophe losses. In- stead, payments for catastrophe losses are made from unrestricted policyholder surplus after the losses are incurred. Because of their domestic tax laws and accounting principles, some non-U.S. insurers are able to deduct reserves for future catastrophes free of tax. That ability gives those non-U.S. insurers a competitive advantage over U.S. insurers, enabling them to attract insurance and reinsurance business that would otherwise be written by U.S. insurers. Such a change in the U.S. tax approach would complement, not diminish, ex- isting risk-management methods like catastrophe reinsurance.
There is another important factor to consider in reinsurance demand. Look- ing back, the insurance industry is partially to blame for today’s demand for original insurance in risk-prone areas. We unrealistically led consumers to be- lieve that the cost of being in harm’s way was very cheap. Now, their demand is high, but, while the supply of capacity is increasing, it cannot meet the full demand.
What will inevitably happen is that an equilibrium will be approached that will allow for adequate rates for the true risk. Rigid rate regulation can slow this process, but the underlying economics forces an eventual equilibrium. This will surely involve a change in the original risk in highly catastrophe- prone areas to include greater risk retention and improved damageability.
As an industry, we cannot look at this problem as one that is solely in the province of actuaries, accountants, and finance professors. A good part of the problem of demand for insurance and therefore reinsurance is a function of the physical quality of risks to withstand the natural hazards to which they are exposed. A group known today as the Insurance Institute for Property Loss Reduction has been formed and is now reinvigorated to address the physical aspects of the risk problem.
As I wrap up, I admit that I drifted away from a direct response to Anne’s paper quite often. In my own defense, I wanted to make sure that the academic community gathered here understands that we practitioners need your creativ- ity to address the many facets of this complex societal problem. I want to thank Anne for an interesting approach to measuring demand for catastrophe re- insurance.
48 Anne Gron
Comment Raghuram Rajan
This is a very nice, careful, paper that uncovers some interesting regularities about who buys catastrophe reinsurance. Since Anne has addressed most of my comments on an earlier draft, I will confine myself to interpreting the results.
I want to focus on two important theoretical reasons for buying reinsurance. The first is to assure potential policyholders that the insurer will be solvent in case of disaster and will be able to make good on claims. Here, reinsurance provides contingent capital to the insurer. With contingent capital, the same pool of capital sitting in a remote island can reinsure very diverse and, hence, uncorrelated risks around the world. By contrast, when capital is committed to an insurer via an equity infusion, the diversification possibilities are limited to the insurer’s area of business. So contingent capital is cheaper. Another way of saying this is that the purpose of insurance is to produce confidence. With its access to the distribution systems of multiple insurers, the reinsurer can pro- duce more confidence per dollar of capital than can a local insurer.
Of course, capital committed to an insurer can become contingent if the insurer enters into loss-sharing agreements with other distant insurers or if the insurer writes reinsurance contracts for others. In other words, a poorly capital- ized, poorly diversified firm should have a high demand for buying reinsur- ance, while a well-capitalized, poorly diversified firm should sell a lot of re- insurance.
The paper provides some evidence consistent with at least part of this argu- ment. It shows that low-rated and highly indebted insurers have a higher de- mand for reinsurance. However, it also shows that regional firms do not pay a higher price for reinsurance than national firms even though the benefits of contingent capital are probably the highest for the regional firms. Furthermore, larger firms pay more for reinsurance. It may be that we are seeing supply effects rather than demand effects here. Alternatively, small and regional firms may be better capitalized and make some of their capital contingent by effec- tively selling reinsurance.’
Before turning to the second role of reinsurance on which I think this paper sheds light, it is useful to ask the following question: If global diversification is so important, why do we not see more insurance companies across the world merging and displacing the need for reinsurers? While we see some trends in this direction, the political and tax barriers to such global companies may be high. But I also think that, for a reinsurer, being at arm’s length from the insurer provides a degree of certification and credibility that a global insurer cannot
Raghuram Rajan is the Joseph L. Gidwitz Professor of Finance at the University of Chicago’s Graduate School of Business and a research associate of the National Bureau of Economic Re- search.
1. It is also possible that the very small, undiversified insurers may be playing high-risk strate- gies where they make money for their stockholders at the expense of their core, unsophisticated policyholders by taking on more risk. This would show up as a lower demand for reinsurance.
49 Insurer Demand for Catastrophe Reinsurance
provide. Every time an insurer buys reinsurance, the rating agencies, and con- sequently the customers, get the comfort that an independent third party has evaluated the insurer. When such transactions are brought in house, as with a global insurer, third-party certification is lost.
The second role that reinsurance plays is to provide the insurer with liquid funds when disaster strikes. The insurer may, in fact, be quite solvent, so the point of reinsurance here is not to provide assurance through contingent capi- tal. Instead, reinsurance reduces the need for the insurer to raise capital at an unfavorable time, at potentially very unfavorable rates. Immediately after a ca- tastrophe, financial markets may be very uncertain about how much loss an insurer has sustained. At that very moment, the insurer will need funds to pay policyholders. The issuance of equity to raise finance at that point would be viewed very negatively by the market. By securing contingent financing through reinsurance, the insurer alleviates potential liquidity problems.
The paper provides some evidence consistent with this role for reinsurance. Insurers with greater holdings of liquid assets buy less reinsurance. Insurers who have more debt (and, thus, who are likely to be forced to issue costly equity if disaster strikes) buy more reinsurance. The need for liquidity may also, as the paper suggests, explain the seemingly anomalous effect of size on the demand for reinsurance: perhaps large insurers have a greater concern for liquidity, and hence purchase more reinsurance, because they have to tap fi- nancial markets rather than potentially more sympathetic financial institutions for funds (small insurers may be able to obtain the needed liquidity from their banks, who are likely to be more informed about the extent of losses than financial markets). This is worth investigating in greater detail.
To summarize, the paper provides some valuable new evidence on the de- mand for reinsurance in particular and on the rationale for risk management in general. I am sure that it will stimulate further empirical and theoretical work on the subject.

This Page Intentionally Left Blank