september 2013 investment client webinar.ppt - aon discussion topics introduction & alts...
TRANSCRIPT
Investment Strategy Webinar
September 18, 2013

2
Presenters
Suzanne Bernard, CFA, CAIA, Partner Investment ConsultingPhone: 312.715.3307Email: [email protected]
John Geissinger, CFA, Partner Investment ConsultingPhone: Email: [email protected]
Tapan Datta, PrincipalInvestment Solutions Phone: 011 +44 207 086 9076Email: [email protected]
Phil Kivarkis, FSA, EA, CFA, PartnerInvestment Policy Services Pension Asset-Liability ManagementPhone: 847.442.3825Email: [email protected]
3
Discussion Topics
Introduction & Alts Conference Discussion Market Outlook: Focus on Equities Catastrophe Reinsurance Investing: The Ultimate Diversifier? Managing "End State" Pension Investments Closing RemarksQ&A Session
Introduction & Alts Conference Discussion
Suzanne Bernard , CFA, CAIA
5
HEK Alternatives Conference: October 3, 2013
Alternative Investing: Beyond the Asset Class SilosThursday, October 3, 20138:00 a.m. to 2:45 p.m.Mid-America Club, Chicago
This conference is for institutional plan sponsors working to further enhance their alternatives programs. All sessions are intended to:– Discuss concepts not typically covered at other Alternatives conferences– Give plan sponsors actionable ideas to bring back to their programs
Topics Include:– Holistic Approach to Incorporating Alternatives in your Asset Allocation– Small is Beautiful -- Adding Value with Emerging Alternatives Managers– How Much Illiquid Assets Can Your Portfolio Handle?– Real Assets - One Size Does NOT Fit All– "Alternative" Alternatives: Assessing the Edgy and Weird
Keynote Speaker: Daniel S. Och, Founder, Och-Ziff Capital Management Group– Alternative Investing: Navigating Risks and Opportunities in Today's Markets
Registration details for this conference will be included in tomorrow’s webcast follow-up email. For questions please email [email protected].
Focus : Equity MarketsWhich way now?
Tapan Datta
7
Economic Conditions: ‘Glass half-full’ for EquitiesRecent Improvement
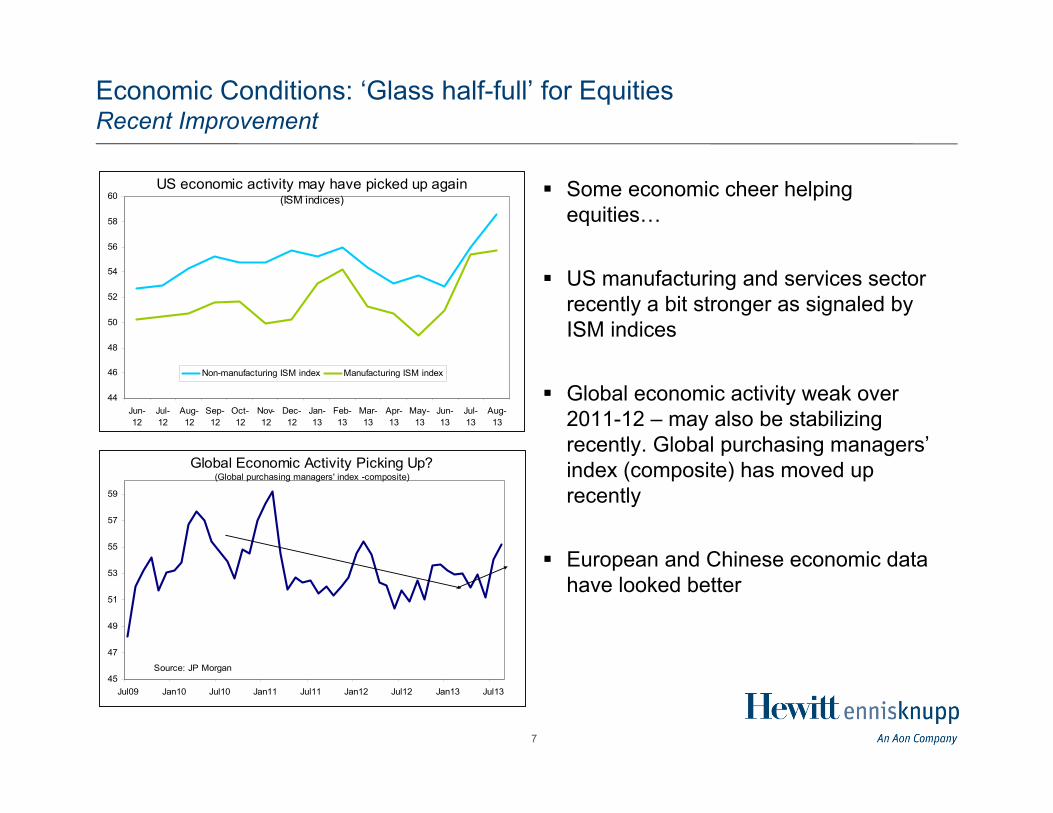
Some economic cheer helping equities…
US manufacturing and services sector recently a bit stronger as signaled by ISM indices
Global economic activity weak over 2011-12 – may also be stabilizing recently. Global purchasing managers’ index (composite) has moved up recently
European and Chinese economic data have looked better
Global Economic Activity Picking Up?(Global purchasing managers' index -composite)
45
47
49
51
53
55
57
59
Jul09 Jan10 Jul10 Jan11 Jul11 Jan12 Jul12 Jan13 Jul13
Source: JP Morgan
US economic activity may have picked up again(ISM indices)
44
46
48
50
52
54
56
58
60
Jun-12
Jul-12
Aug-12
Sep-12
Oct-12
Nov-12
Dec-12
Jan-13
Feb-13
Mar-13
Apr-13
May-13
Jun-13
Jul-13
Aug-13
Non-manufacturing ISM index Manufacturing ISM index
8
Economic Conditions: Glass “half-empty” for EquitiesLow Nominal GDP and Income Growth
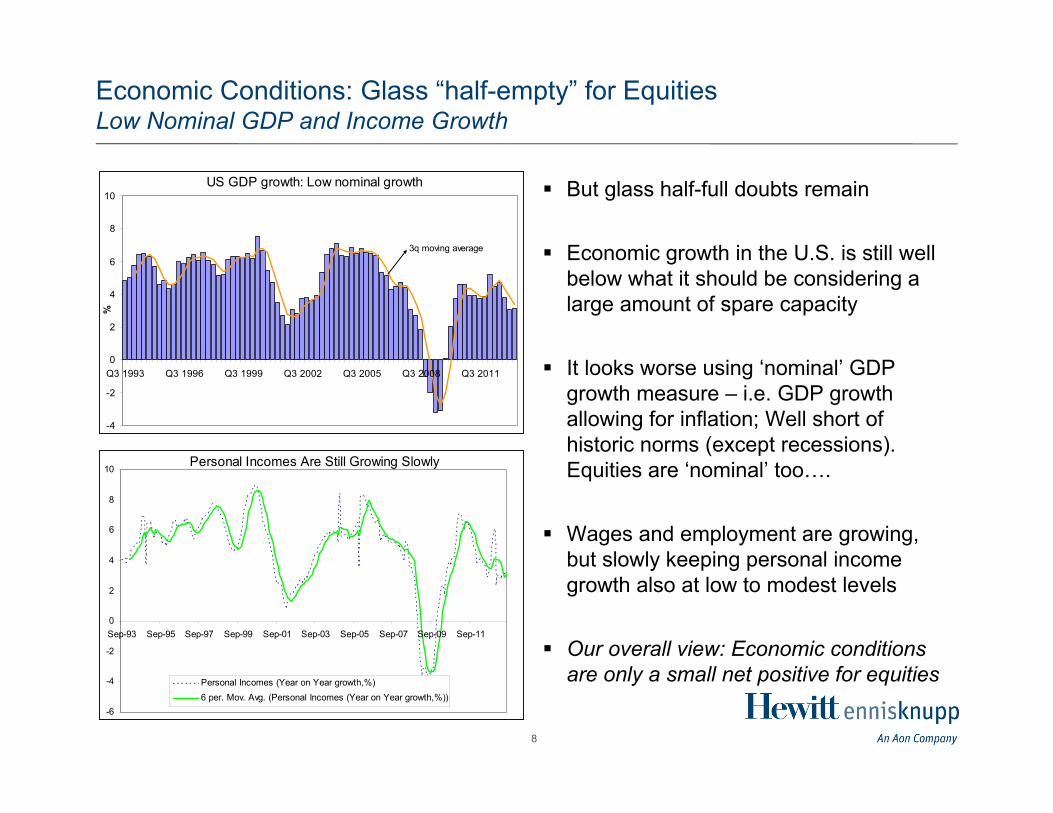
But glass half-full doubts remain
Economic growth in the U.S. is still well below what it should be considering a large amount of spare capacity
It looks worse using ‘nominal’ GDP growth measure – i.e. GDP growth allowing for inflation; Well short of historic norms (except recessions). Equities are ‘nominal’ too….
Wages and employment are growing, but slowly keeping personal income growth also at low to modest levels
Our overall view: Economic conditions are only a small net positive for equities
US GDP growth: Low nominal growth
-4
-2
0
2
4
6
8
10
Q3 1993 Q3 1996 Q3 1999 Q3 2002 Q3 2005 Q3 2008 Q3 2011
%
3q moving average
Personal Incomes Are Still Growing Slowly
-6
-4
-2
0
2
4
6
8
10
Sep-93 Sep-95 Sep-97 Sep-99 Sep-01 Sep-03 Sep-05 Sep-07 Sep-09 Sep-11
Personal Incomes (Year on Year growth,%)6 per. Mov. Avg. (Personal Incomes (Year on Year growth,%))
9
The Challenge from Fixed IncomeVolatility and Higher Yields?
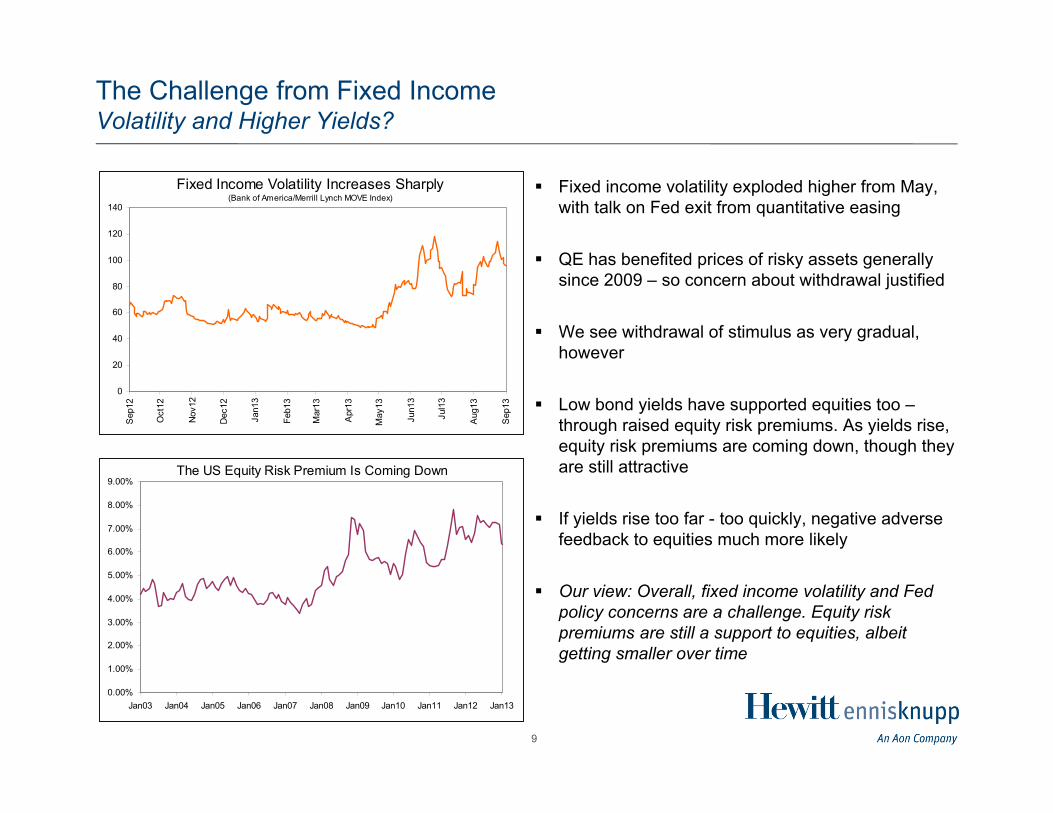
Fixed income volatility exploded higher from May, with talk on Fed exit from quantitative easing
QE has benefited prices of risky assets generally since 2009 – so concern about withdrawal justified
We see withdrawal of stimulus as very gradual, however
Low bond yields have supported equities too –through raised equity risk premiums. As yields rise, equity risk premiums are coming down, though they are still attractive
If yields rise too far - too quickly, negative adverse feedback to equities much more likely
Our view: Overall, fixed income volatility and Fed policy concerns are a challenge. Equity risk premiums are still a support to equities, albeit getting smaller over time
Fixed Income Volatility Increases Sharply(Bank of America/Merrill Lynch MOVE Index)
0
20
40
60
80
100
120
140
Sep
12
Oct
12
Nov
12
Dec
12
Jan1
3
Feb1
3
Mar
13
Apr
13
May
13
Jun1
3
Jul1
3
Aug
13
Sep
13
The US Equity Risk Premium Is Coming Down
0.00%
1.00%
2.00%
3.00%
4.00%
5.00%
6.00%
7.00%
8.00%
9.00%
Jan03 Jan04 Jan05 Jan06 Jan07 Jan08 Jan09 Jan10 Jan11 Jan12 Jan13
10
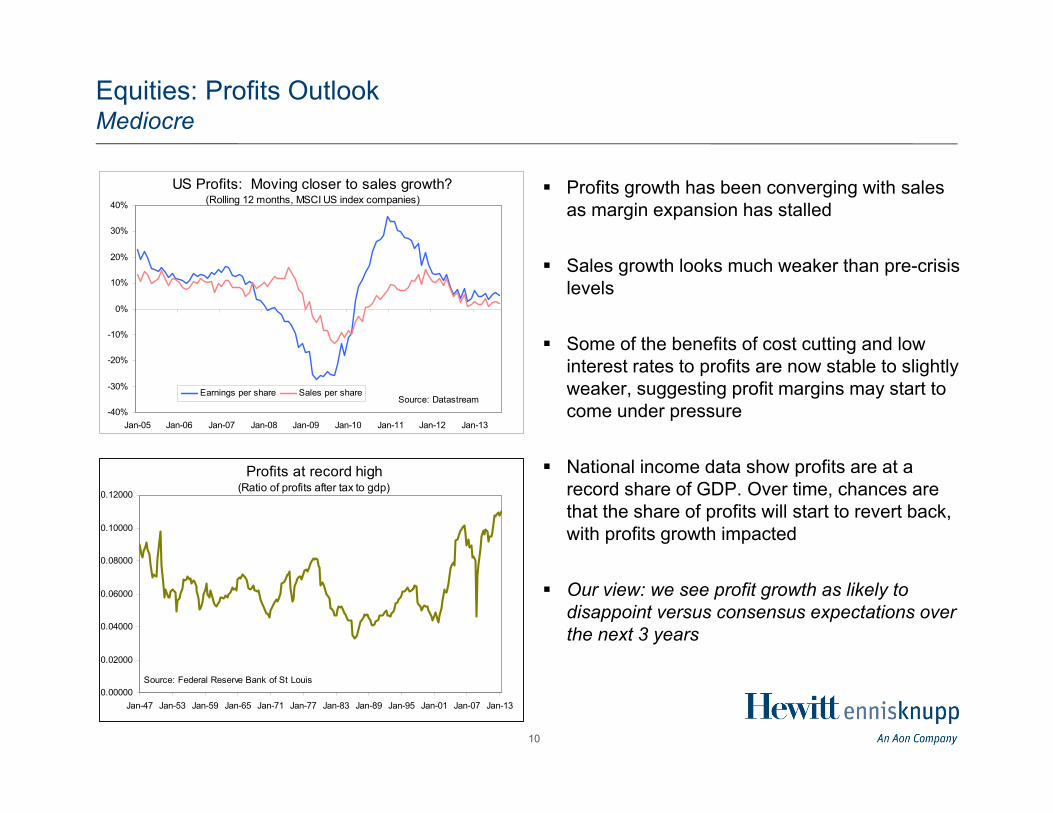
Equities: Profits OutlookMediocre
Profits growth has been converging with sales as margin expansion has stalled
Sales growth looks much weaker than pre-crisis levels
Some of the benefits of cost cutting and low interest rates to profits are now stable to slightly weaker, suggesting profit margins may start to come under pressure
National income data show profits are at a record share of GDP. Over time, chances are that the share of profits will start to revert back, with profits growth impacted
Our view: we see profit growth as likely to disappoint versus consensus expectations over the next 3 years
Profits at record high (Ratio of profits after tax to gdp)
0.00000
0.02000
0.04000
0.06000
0.08000
0.10000
0.12000
Jan-47 Jan-53 Jan-59 Jan-65 Jan-71 Jan-77 Jan-83 Jan-89 Jan-95 Jan-01 Jan-07 Jan-13
Source: Federal Reserve Bank of St Louis
US Profits: Moving closer to sales growth?(Rolling 12 months, MSCI US index companies)
-40%
-30%
-20%
-10%
0%
10%
20%
30%
40%
Jan-05 Jan-06 Jan-07 Jan-08 Jan-09 Jan-10 Jan-11 Jan-12 Jan-13
Earnings per share Sales per shareSource: Datastream
11
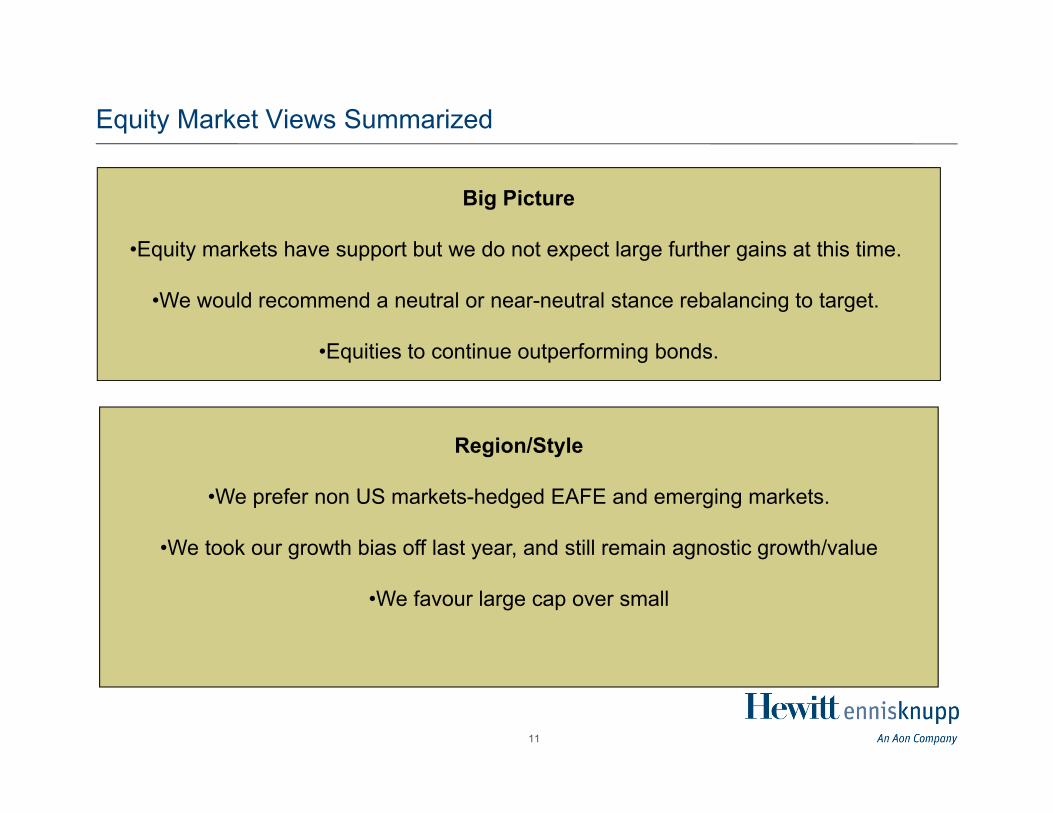
Equity Market Views Summarized
Big Picture
•Equity markets have support but we do not expect large further gains at this time.
•We would recommend a neutral or near-neutral stance rebalancing to target.
•Equities to continue outperforming bonds.
Region/Style
•We prefer non US markets-hedged EAFE and emerging markets.
•We took our growth bias off last year, and still remain agnostic growth/value
•We favour large cap over small
12
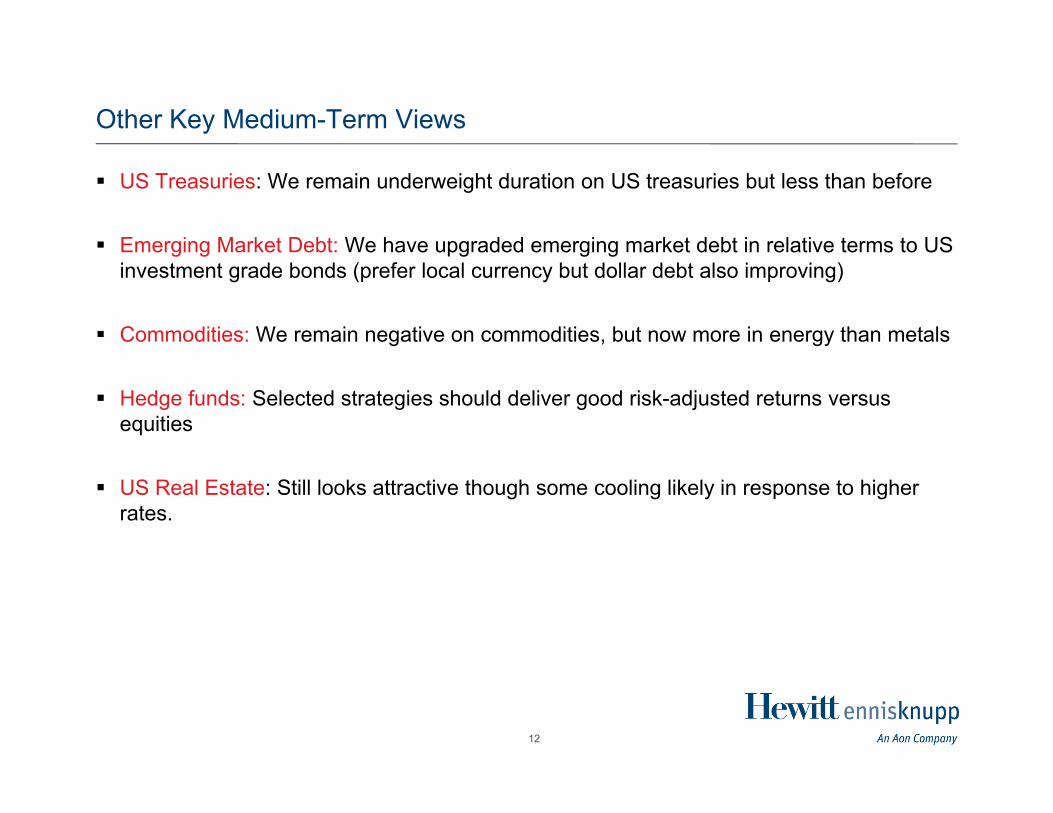
Other Key Medium-Term Views
US Treasuries: We remain underweight duration on US treasuries but less than before
Emerging Market Debt: We have upgraded emerging market debt in relative terms to US investment grade bonds (prefer local currency but dollar debt also improving)
Commodities: We remain negative on commodities, but now more in energy than metals
Hedge funds: Selected strategies should deliver good risk-adjusted returns versus equities
US Real Estate: Still looks attractive though some cooling likely in response to higher rates.
Catastrophe Reinsurance Investing: The Ultimate Diversifier?
John Geissinger , CFA
14
Purpose of Reinsurance
Reinsurance spreads risk so widely and effectively that even the largest risk can be accommodated without unduly burdening any individual or corporation
15
Overview of Reinsurance Market
Insurance companies like portfolios of diversified idiosyncratic risk but spurn risks that can damage large portions of their portfolio at once
This creates demand for insurance companies to purchase insurance (i.e. reinsurance) against certain catastrophic risks
Common examples of such perils include wind storms, earthquakes and floods
16
History of Reinsurance
1370: Treaty covering the most dangerous part of a sea journey from Italy to Belgium. Risk was transferred from the original insurer to a reinsurer without the involvement of the original insured
Great Hamburg Fire of 1842: Cologne Re, Swiss Re and Munich Re were formed to reinsure the peak peril within cities-fire
Hurricane Andrew (1992): Existing Reinsurance companies were only able to meet a portion of demand. Alternative means of attracting capital were created starting with Catastrophe Bonds. Subsequently, a diverse universe of alternative capital structures has been created.
17
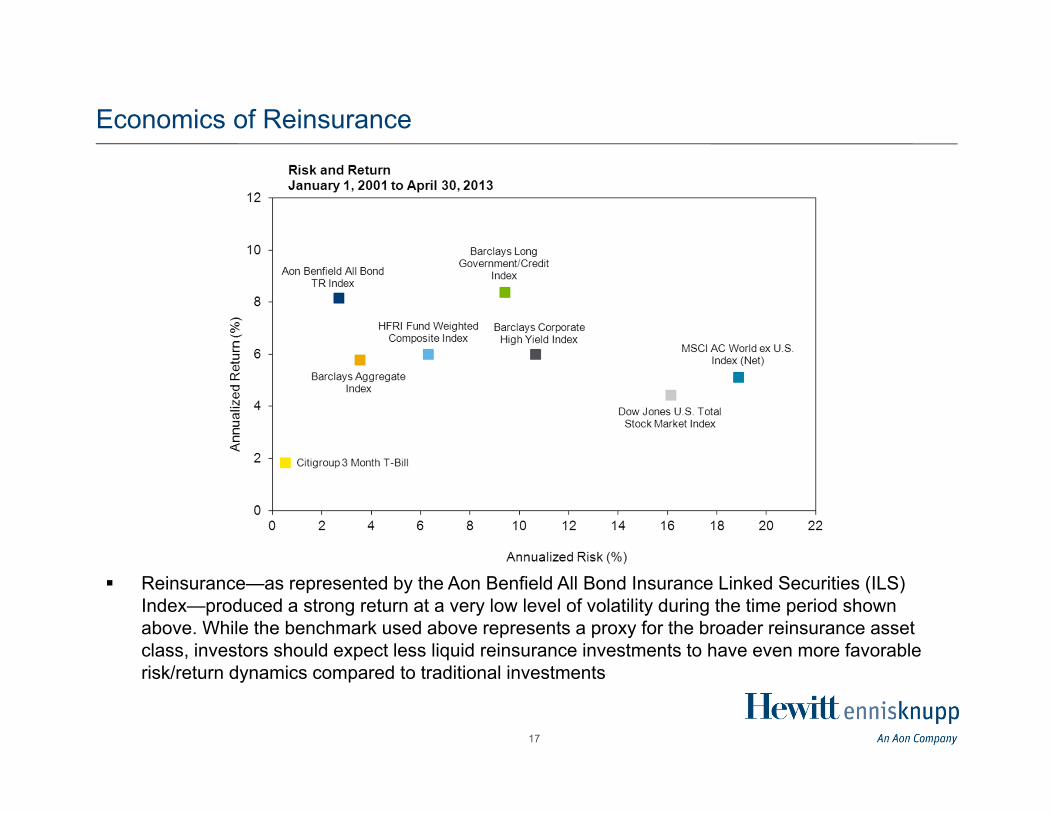
Economics of Reinsurance
Reinsurance—as represented by the Aon Benfield All Bond Insurance Linked Securities (ILS) Index—produced a strong return at a very low level of volatility during the time period shown above. While the benchmark used above represents a proxy for the broader reinsurance asset class, investors should expect less liquid reinsurance investments to have even more favorable risk/return dynamics compared to traditional investments
18
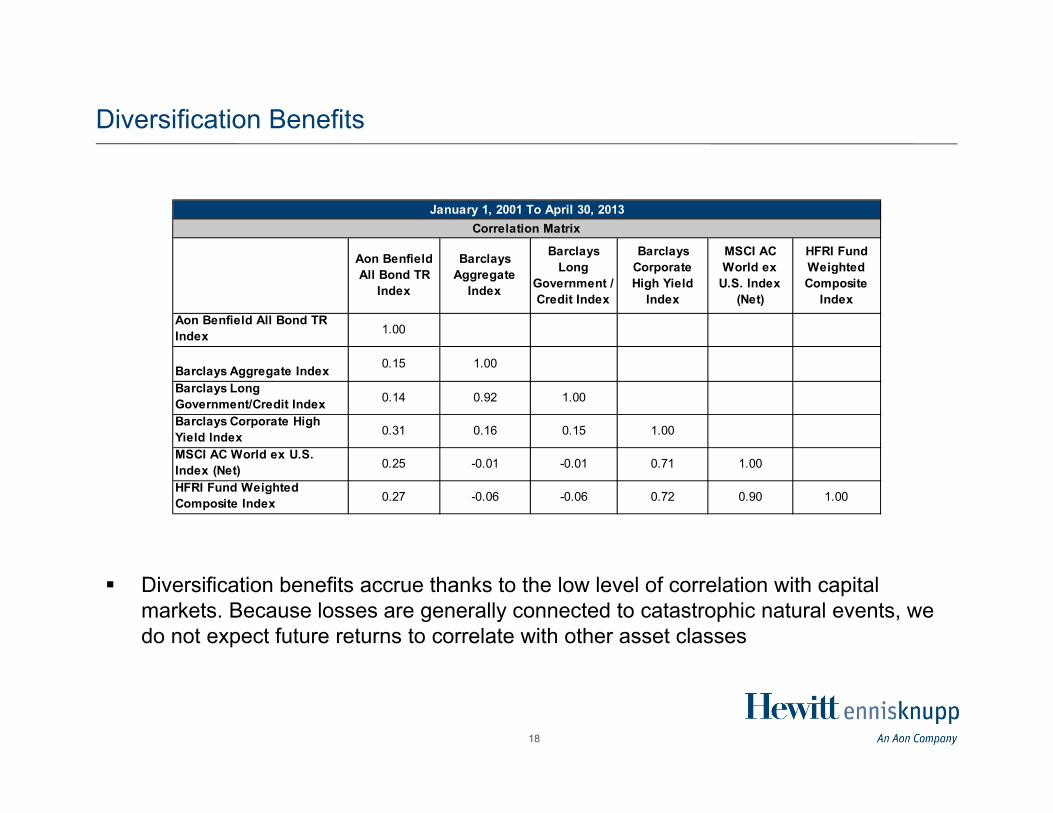
Diversification Benefits
Aon Benfield All Bond TR
Index
Barclays Aggregate
Index
Barclays Long
Government / Credit Index
Barclays Corporate High Yield
Index
MSCI AC World ex
U.S. Index (Net)
HFRI Fund Weighted Composite
IndexAon Benfield All Bond TR Index 1.00
Barclays Aggregate Index 0.15 1.00
Barclays Long Government/Credit Index 0.14 0.92 1.00
Barclays Corporate High Yield Index 0.31 0.16 0.15 1.00
MSCI AC World ex U.S. Index (Net) 0.25 -0.01 -0.01 0.71 1.00
HFRI Fund Weighted Composite Index 0.27 -0.06 -0.06 0.72 0.90 1.00
January 1, 2001 To April 30, 2013Correlation Matrix
Diversification benefits accrue thanks to the low level of correlation with capital markets. Because losses are generally connected to catastrophic natural events, we do not expect future returns to correlate with other asset classes
19
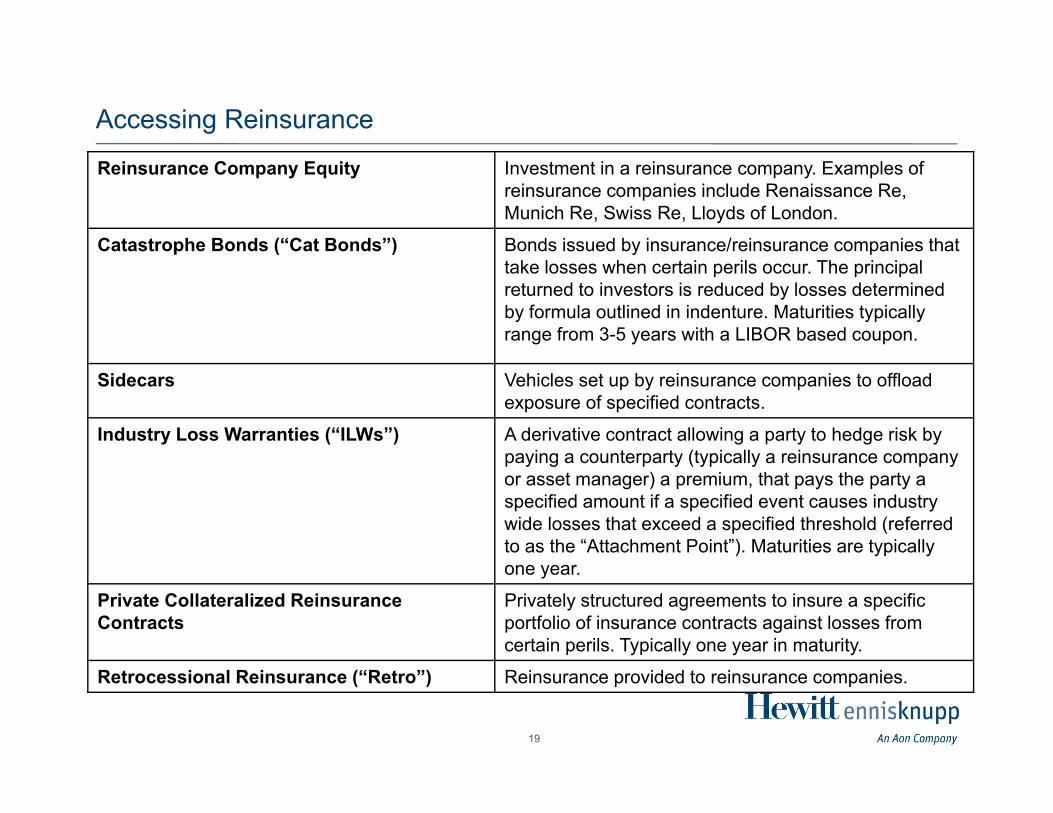
Accessing Reinsurance
Reinsurance Company Equity Investment in a reinsurance company. Examples of reinsurance companies include Renaissance Re, Munich Re, Swiss Re, Lloyds of London.
Catastrophe Bonds (“Cat Bonds”) Bonds issued by insurance/reinsurance companies that take losses when certain perils occur. The principal returned to investors is reduced by losses determined by formula outlined in indenture. Maturities typically range from 3-5 years with a LIBOR based coupon.
Sidecars Vehicles set up by reinsurance companies to offload exposure of specified contracts.
Industry Loss Warranties (“ILWs”) A derivative contract allowing a party to hedge risk by paying a counterparty (typically a reinsurance company or asset manager) a premium, that pays the party a specified amount if a specified event causes industry wide losses that exceed a specified threshold (referred to as the “Attachment Point”). Maturities are typically one year.
Private Collateralized Reinsurance Contracts
Privately structured agreements to insure a specific portfolio of insurance contracts against losses from certain perils. Typically one year in maturity.
Retrocessional Reinsurance (“Retro”) Reinsurance provided to reinsurance companies.
20
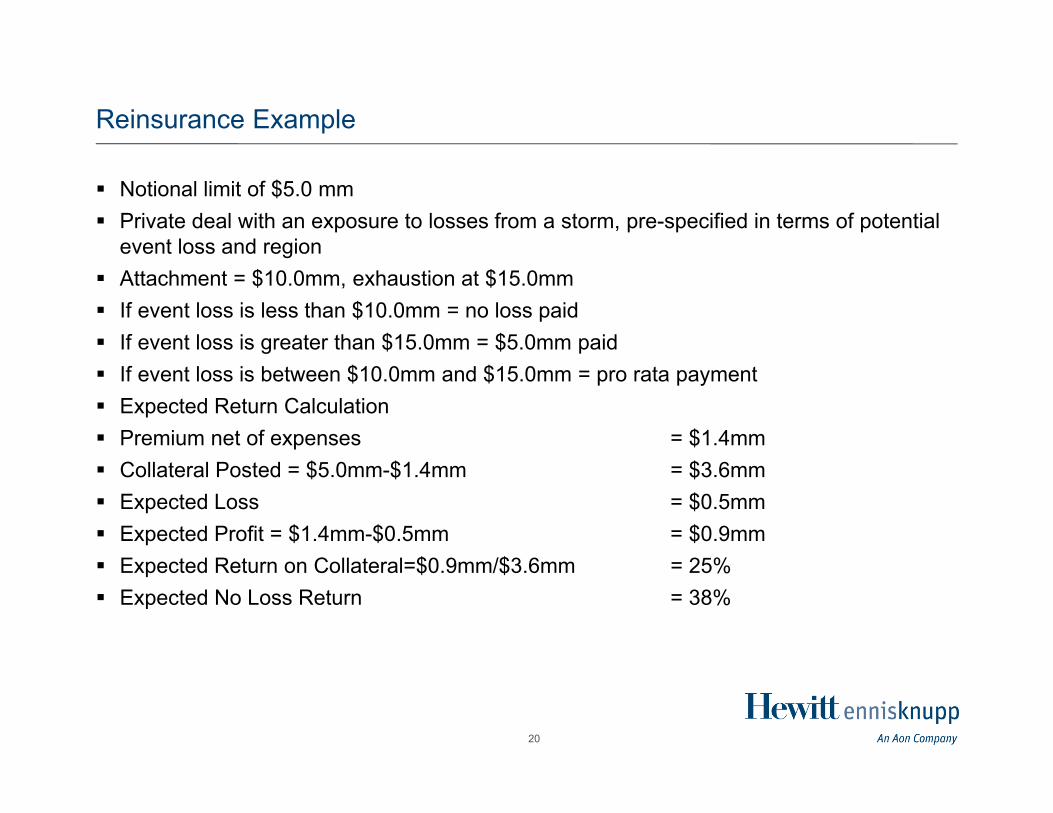
Reinsurance Example
Notional limit of $5.0 mm Private deal with an exposure to losses from a storm, pre-specified in terms of potential
event loss and region Attachment = $10.0mm, exhaustion at $15.0mm If event loss is less than $10.0mm = no loss paid If event loss is greater than $15.0mm = $5.0mm paid If event loss is between $10.0mm and $15.0mm = pro rata payment Expected Return Calculation Premium net of expenses = $1.4mm Collateral Posted = $5.0mm-$1.4mm = $3.6mm Expected Loss = $0.5mm Expected Profit = $1.4mm-$0.5mm = $0.9mm Expected Return on Collateral=$0.9mm/$3.6mm = 25% Expected No Loss Return = 38%
21
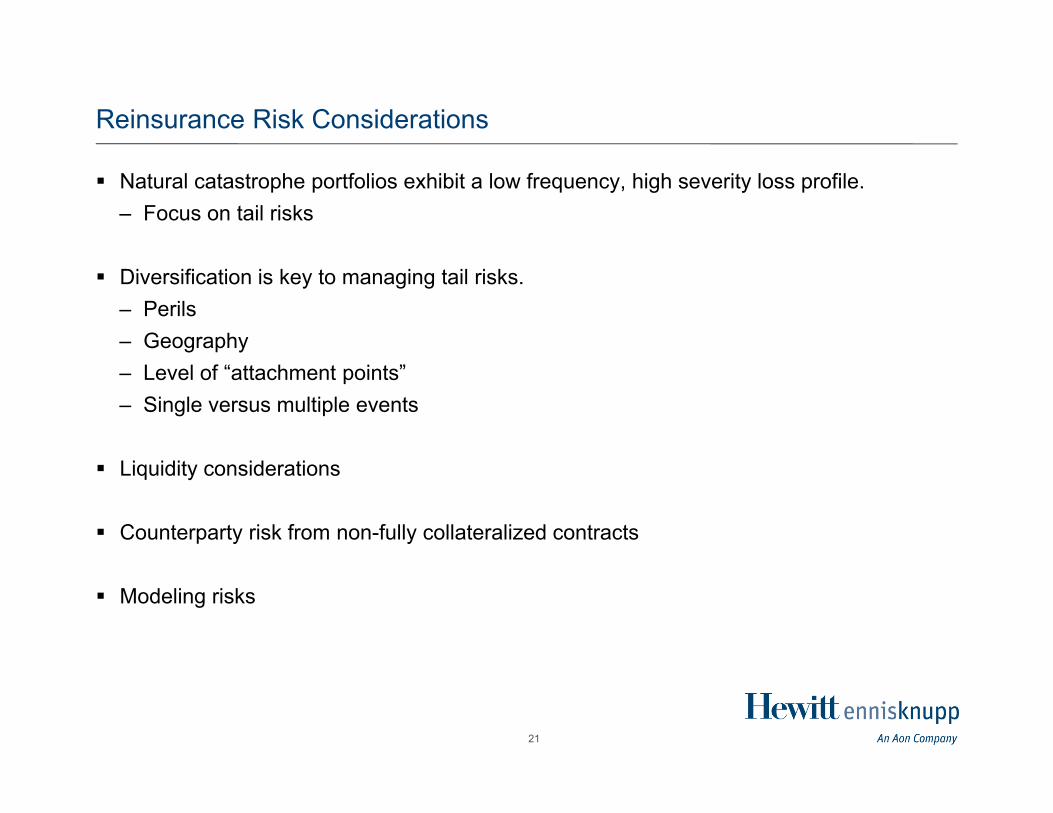
Reinsurance Risk Considerations
Natural catastrophe portfolios exhibit a low frequency, high severity loss profile.– Focus on tail risks
Diversification is key to managing tail risks.– Perils– Geography– Level of “attachment points”– Single versus multiple events
Liquidity considerations
Counterparty risk from non-fully collateralized contracts
Modeling risks
22
Investing in Reinsurance
Reinsurance is a very unique asset class and exposure can be accessed in various forms
Investors seeking liquid and securities exposure can seek a portfolio of catastrophe bonds
Investors able to take on illiquidity and complexity can seek out several hedge funds that specialize in this space
Private equity vehicles also exist that provide exposure to reinsurance and insurance
Lastly, sophisticated clients may wish to engage directly to provide collateralized reinsurance to insurance companies
23
Managing "End State" Pension Investments
Phil Kivarkis, FSA, EA, CFA
24
Managing “End State” Pension Investments
Introduction
Many private pension have adopted de-risking glide paths in recent years – De-risking glide paths involve shifting from return seeking assets to bonds
Several factors could push plans closer to the glide path “end states”
End state portfolios are different than typical balanced portfolios
Now is a good time to think about “end state” investment strategy
25
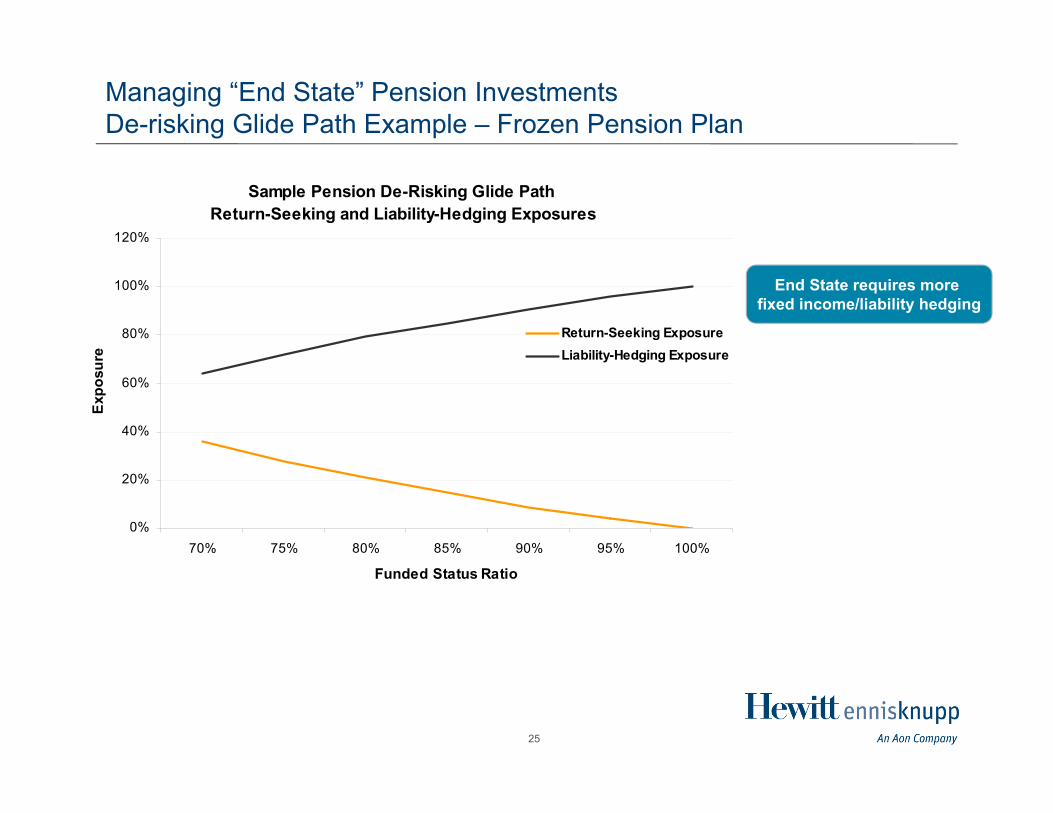
Managing “End State” Pension InvestmentsDe-risking Glide Path Example – Frozen Pension Plan
Sample Pension De-Risking Glide Path
Return-Seeking and Liability-Hedging Exposures
0%
20%
40%
60%
80%
100%
120%
70% 75% 80% 85% 90% 95% 100%
Funded Status Ratio
Exp
osur
e
Return-Seeking ExposureLiability-Hedging Exposure
End State requires more fixed income/liability hedging
26
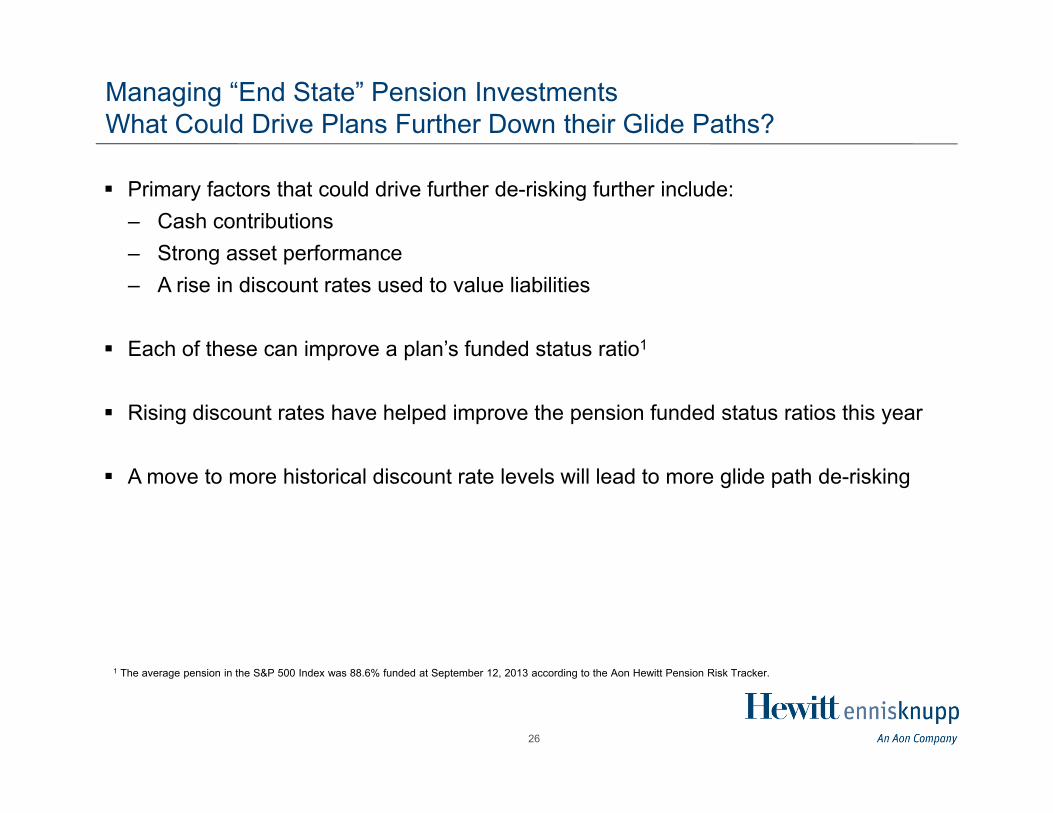
Managing “End State” Pension InvestmentsWhat Could Drive Plans Further Down their Glide Paths?
Primary factors that could drive further de-risking further include:– Cash contributions– Strong asset performance– A rise in discount rates used to value liabilities
Each of these can improve a plan’s funded status ratio1
Rising discount rates have helped improve the pension funded status ratios this year
A move to more historical discount rate levels will lead to more glide path de-risking
1 The average pension in the S&P 500 Index was 88.6% funded at September 12, 2013 according to the Aon Hewitt Pension Risk Tracker.
27
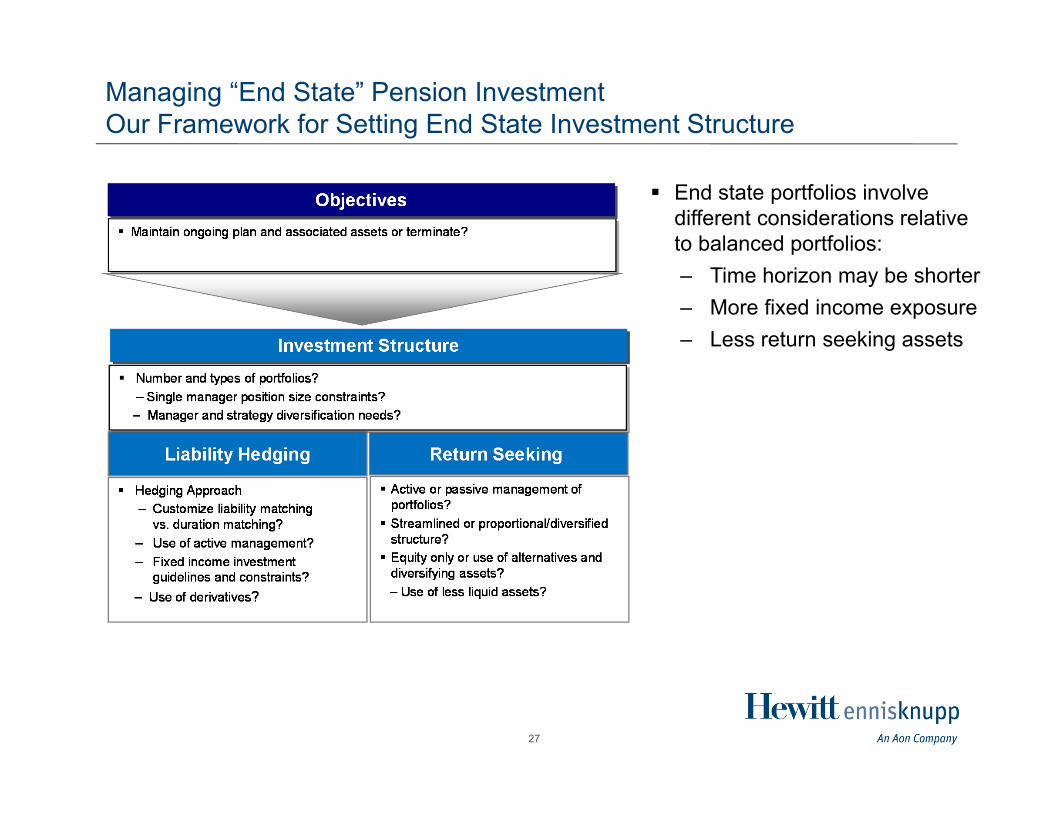
Managing “End State” Pension Investment Our Framework for Setting End State Investment Structure
End state portfolios involve different considerations relative to balanced portfolios:– Time horizon may be shorter– More fixed income exposure – Less return seeking assets
28
Managing “End State” Pension Investment Importance of Objectives When Setting Investment Strategy
Plans Preparing for Termination Short investment horizon, so focus should be on high quality investment portfolios Risk budgets (active manager risk and liability tracking risk) should be conservative as
plans nears termination Favorable annuity pricing may be achieved by structuring the portfolio to appeal to
insurance companies (e.g., portfolios of high quality bonds)
Ongoing Plans Longer time horizon affords more latitude in developing plan structures Risk budgets can range depending on plan sponsor tolerance Active management and alternatives may be more appropriate for an ongoing plan
29
Managing “End State” Pension Investment Structure Considerations
Investment Structure Considerations How many managers to use for liability hedging and return seeking portfolio?
– Plan sponsor philosophy regarding manager concentration– Need for organizational and strategy diversification
The amount of liability hedging precision required?
Will investment guidelines allow non benchmark positions or not
Type of return seeking investments:– Simple low-cost (passive approach) vs. more diversified and actively managed– Use of alternatives
A more detailed discussion of this will be in our upcoming white paper on this topic, Managing “End State” Pension Investments – How to Stay One Step Ahead of Your “Glide Path.” The paper will be posted at www.HEKblog.com later this month.
Closing Remarks
Suzanne Bernard , CFA, CAIA

31
Question & Answer
Questions may be submitted by typing the question in the "Ask a Question" text field and clicking "Submit." Questions will be answered live as time permits.
Q&A
32
Our next Investment Strategy update call is scheduled for Wednesday, October 16th, at 10 a.m. CDT.