instrumentation and methods for frequency-domain …
TRANSCRIPT

TKK Dissertations 201Espoo 2009
INSTRUMENTATION AND METHODS FOR FREQUENCY-DOMAIN AND MULTIMODAL NEAR-INFRARED SPECTROSCOPYDoctoral Dissertation
Helsinki University of TechnologyFaculty of Information and Natural SciencesDepartment of Biomedical Engineering and Computational Science
Tommi Noponen

TKK Dissertations 201Espoo 2009
INSTRUMENTATION AND METHODS FOR FREQUENCY-DOMAIN AND MULTIMODAL NEAR-INFRARED SPECTROSCOPYDoctoral Dissertation
Tommi Noponen
Dissertation for the degree of Doctor of Science in Technology to be presented with due permission of the Faculty of Information and Natural Sciences for public examination and debate in Auditorium F239a at Helsinki University of Technology (Espoo, Finland) on the 11th of December, 2009, at 12 noon.
Helsinki University of TechnologyFaculty of Information and Natural SciencesDepartment of Biomedical Engineering and Computational Science
Teknillinen korkeakouluInformaatio- ja luonnontieteiden tiedekuntaLääketieteellisen tekniikan ja laskennallisen tieteen laitos

Distribution:Helsinki University of TechnologyFaculty of Information and Natural SciencesDepartment of Biomedical Engineering and Computational ScienceP.O. Box 2200 (Rakentajanaukio 2)FI - 02015 TKKFINLANDURL: http://www.becs.tkk.fi/Tel. +358-9-470 23172Fax +358-9-470 23182E-mail: [email protected]
© 2009 Tommi Noponen
ISBN 978-952-248-210-5ISBN 978-952-248-211-2 (PDF)ISSN 1795-2239ISSN 1795-4584 (PDF)URL: http://lib.tkk.fi/Diss/2009/isbn9789522482112/
TKK-DISS-2684
Painosalama OyTurku 2009

AB
ABSTRACT OF DOCTORAL DISSERTATION HELSINKI UNIVERSITY OF TECHNOLOGYP. O. BOX 1000, FI-02015 TKK
http://www.tkk.fi
Author Tommi Noponen
Name of the dissertation
Manuscript submitted August 24, 2009 Manuscript revised November 6, 2009
Date of the defence December 11, 2009
Article dissertation (summary + original articles)Monograph
Faculty
Department
Field of research
Opponent(s)
Supervisor
Instructor
Abstract
Keywords near-infrared spectroscopy, frequency-domain technique, light leakage, multimodal brain measurement
ISBN (printed) 978-952-248-210-5
ISBN (pdf) 978-952-248-211-2
Language English
ISSN (printed) 1795-2239
ISSN (pdf) 1795-4584
Number of pages 82 p. + app. 134 p.
Publisher Helsinki University of Technology, Department of Biomedical Engineering and Computational Science
Print distribution Helsinki University of Technology, Dep. of Biomedical Engineering and Computational Science
The dissertation can be read at http://lib.tkk.fi/Diss/2009/isbn9789522482112/
Instrumentation and methods for frequency-domain and multimodal near-infrared spectroscopy
X
Faculty of Information and Natural Sciences
Department of Biomedical Engineering and Computational Science
Biomedical Engineering
Professor Sergio Fantini, Tufts University
Professor Pekka Meriläinen
Timo Kajava, D.Sc. (Tech.)
X
In this thesis, instrumentation for a frequency-domain (FD) near-infrared spectroscopy (NIRS) device and formultimodal brain measurements was implemented. Different techniques were applied to human and newborn lambbrain studies. A method to detect light leakage in NIRS measurements was developed.
The FD instrument, developed at the Helsinki University of Technology was extended, by implementing 16pseudo-differential preamplifiers for the analog-to-digital converters with a low noise and excellent interchannelisolation. An instrumentation for a digital signal-processor based lock-in amplifier was also developed. Methods forincreasing the number of wavelengths and source positions in the imaging instrument were studied. Asecond-generation source system with a fast fiber-optic switch and four high-power laser diodes with a low noisetemperature-stabilizing electronics was implemented. The imaging device was placed into a cabinet to enable itsportability. New detection and source fiber terminals were developed for multimodal brain studies.
The different versions of the imaging instrument were applied to four human brain measurements. In a breath-holdingand hyperventilation study, the effects of source-detector distance (SDD) and measurement wavelength on the contrastof NIRS responses and the frequency content of signals were studied. Hemodynamic changes in the human brainrelated to the changes in sleep stages were detected. The multimodal NIRS and electroencephalography measurementsetup was implemented and used to study the effects of baseline blood flow changes on the visually evokedhemodynamic and neuronal responses. The feasibility of NIRS as a part of multimodal monitoring setup to detectcerebral hemodynamic changes induced by iloprost and nitric oxide in the preterm lamb brain was also demonstrated.
The linearity of the FD measurement parameters as a function of SDD on the human forehead was studied. Theregression of phase measurement was observed to be sensitive to light leakage from source to detectors, much morethan the regression of modulation amplitude or average intensity measurement. Utilizing this observation, a method todetect light leakage based on the pathlength measurement was developed. The contrast and depth sensitivity of NIRSsignals were shown to decrease in measurements where light leakage occurs.


AB
VÄITÖSKIRJAN TIIVISTELMÄ TEKNILLINEN KORKEAKOULUPL 1000, 02015 TKK
http://www.tkk.fi
Tekijä Tommi Noponen
Väitöskirjan nimi
Käsikirjoituksen päivämäärä 24.8.2009 Korjatun käsikirjoituksen päivämäärä 06.11.2009
Väitöstilaisuuden ajankohta 11.12.2009
Yhdistelmäväitöskirja (yhteenveto + erillisartikkelit)Monografia
Tiedekunta
Laitos
Tutkimusala
Vastaväittäjä(t)
Työn valvoja
Työn ohjaaja
Tiivistelmä
Asiasanat Lähi-infrapunaspektroskopia, taajuusalueen tekniikka, valovuoto, monimenetelmäiset aivotutkimukset
ISBN (painettu) 978-952-248-210-5
ISBN (pdf) 978-952-248-211-2
Kieli Englanti
ISSN (painettu) 1795-2239
ISSN (pdf) 1795-4584
Sivumäärä 82 s. + liit. 134 s.
Julkaisija Teknillinen korkeakoulu, Lääketieteellisen tekniikan ja laskennallisen tieteen laitos
Painetun väitöskirjan jakelu Teknillinen korkeakoulu, Lääketieteellisen tekniikan ja laskennallisen tieteen laitos
Luettavissa verkossa osoitteessa http://lib.tkk.fi/Diss/2009/isbn9789522482112/
Laitetekniikkaa ja menetelmiä taajuusalueen lähi-infrapunaspektroskopiaan ja monimenetelmätutkimuksiin
X
Informaatio- ja luonnontieteiden tiedekunta
Lääketieteellisen tekniikan ja laskennallisen tieteen laitos
Lääketieteellinen tekniikka
Professori Sergio Fantini, Tufts University
Professori Pekka Meriläinen
Timo Kajava, TkT
X
Työssä kehitettiin laitetekniikkaa ja menetelmiä taajuusalueen lähi-infrapunaspektroskopiaan (NIRS) jamonimenetelmätutkimuksiin. Menetelmiä sovellettiin aivomittauksiin ihmisillä ja vastasyntyneillä lampailla. Työssäkehitettiin myös menetelmä valovuodon havaitsemiseen otsamittauksissa.
Teknillisessä korkeakoulussa kehitettyä taajuusalueen laitetta laajennettiin toteuttamalla laitteeseen 16 vähäkohinaistaanalogi-digitaalimuuntimen etuvahvistinta, joiden kanavien välinen ylikuuluminen on erittäin vähäistä. Työn aikanakehitettiin signaaliprosessoritekniikkaan perustuva nelikanavainen vaihelukittu vahvistin. Taajuusalueen laitteenaallonpituuksien ja lähdekanavien määrän lisäämiseen liittyviä tekniikoita tutkittiin. Työssä kehitettiin myös nopeaankuitukytkimeen ja neljään suuritehoiseen lämpötilasäädeltyyn laserdiodiin perustuva lähdejärjestelmä. Kuvantamislaiteasennettiin laitetelineeseen sen siirrettävyyden helpottamiseksi. Lisäksi lähde- sekä vastaanotinkuituihin kehitettiinuudet päätteet monimenetelmäisiä aivomittauksia varten.
Kuvantamislaitteen eri kehitysversioita käytettiin ihmisillä neljässä aivotutkimussarjassa. Lähde-ilmaisinetäisyyden jamittausaallonpituuden vaikutusta signaaleihin ja signaalien taajuussisältöä tutkittiin ylihengitys- jahengityksenpidätysmittauksissa. Otsamittauksissa havaittiin unitasoihin liittyviä hemodynaamisia muutoksia. Työssäkehitetyllä järjestelmällä tutkittiin aivojen verenvirtauksen perustasonmuutosten ja näköärsykkeillä synnytettyjenhemodynaamisten tai sähköisten vasteiden välisiä yhteyksiä. Osana monimenetelmäistä monitorointijärjestelmääNIRS:llä mitattiin myös hengitetyn iloprostin ja typpioksidin synnyttämiä hemodynaamisia muutoksia vastasyntyneenlampaan aivoissa.
Työssä tutkittiin myös taajuusalueen mittausparametrien lineaarisuutta otsamittauksissa. Vaihemittauksen havaittiinolevan selvästi herkempi ilmaisemaan mahdollisia valovuotoja kuin intensiteetti- tai amplitudimittaus. Tähänhavaintoon perustuen työssä kehitettiin menetelmä valovuotojen havaitsemiseen. Signaalien kontrastin jasyvyysherkkyyden osoitettiin laskevan selvästi mittauksissa, joissa havaittiin valovuotoa.


To Pirkko, Kaarlo, Tuomo and Alpo

vi
Preface
Much of this work was carried out at the Laboratory of Biomedical Engineeringat the Helsinki University of Technology (HUT) and at the BioMag Laboratoryat the Helsinki University Central Hospital during the years 2001 - 2006. At thattime both laboratories belonged to the Helsinki Brain Research Center (HBRC).I would like to thank my supervisor Professor Pekka Merilainen for encouragingme to finish this thesis and to study other physiological monitoring techniques inaddition to NIRS, and for deepening my knowledge of the biomedical engineeringindustry. I wish to express my gratitude to my former supervisor Emeritus ProfessorToivo Katila for providing me with excellent research facilities and creating such ahighly fascinating institute for biomedical engineering education. Topi’s lab wasa good place to professionally mature. To Professor Vineta Fellman I express mysincere gratitude for providing me with a highly vital impulse to complete this thesisand for all the guidance in the world of statistics and pediatrics. My instructorDr.Tech. Timo Kajava is greatly acknowledged for very diligently advising me togain better skills on scientific writing and for carefully revising this thesis. Withoutyour help Timo, this thesis would have been much more difficult to understand. Ialso wish to thank the pre-examiners of this thesis Professors Brian Pogue and PekkaHanninen for their improving comments and corrections, and Ph.D. Tony Shepherdfor checking the language of my manuscript.
Many parts of this thesis were carried out together with other researchers in the Med-ical Optical Imaging (MOI) group at HUT. I express my gratitude to Dr.Tech. IlkkaNissila for his creative ideas and enthusiasm, which enabled us to develop such anexcellent tomographic instrument. Ilkka also deserves a great acknowledgement forbeing the corresponding author of the two first publications of this thesis. I wish tothank M.Sc. Kalle Kotilahti and M.Sc. Lauri Lipiainen for contributing essentiallyto our instrumentation and methodological development and for being such greatfriends during all these years. I thank Dr.Tech. Jenni Heino and Dr.Tech. JuhaHeiskala for deepening my knowledge on the modeling of optical tomography andJenni for contributing essentially to Publication I of this thesis. The current groupmembers M.Sc. Tiina Nasi, M.Sc. Jaakko Virtanen, and M.Sc. Petri Hiltunen aregreatly acknowledged for their inspiring attitude toward the research and for theirfriendship during the last years of this project. I see in you the promising future ofmedical optical imaging research in Finland. Also, I wish to thank all current andformer members of MOI group such as Maunu, Nasia, Riikka, Mauro, Lidet, andAtte for their contributions to the advancement of our research.
I express my gratitude to Professor Simon Arridge and Ph.D. Tanja Tarvainen fortheir long lasting collaboration with our group and contributions to this thesis.Docent Tapani Salmi and Dr. Jussi Toppila are acknowledged for their advice andcontributions in our sleep studies and Dr.Tech. Dubravko Kicic for helping me in themultichannel EEG studies and for those memorable moments when we advertised

vii
the novel biomedical techniques within the HBRC. I also wish to thank the otherco-authors M.D. Anders Nordh, Ph.D. Martin Schweiger, Docent Seppo Kahkonen,Ass. Professor Ansgar Berg, Ph.D. David Ley, Docent Stefan Hansson, and ProfessorErkki Pesonen for their contributions to this thesis. Especially, I express my sinceregratitude to Anders for showing such unselfishness during the final stage of ourpublication.
I would like to thank Doc. Minna Huotilainen for her important collaboration withour group and Professor Risto Naatanen for being interested in NIRS research andfinancially supporting us through the HBRC. I thank also Professor Risto Ilmoniemifor exhorting me to finally finish this thesis. Professor Ari Koskelainen and ProfessorMatti Kaivola are acknowledged for showing interest in my work, especially in itsearly phase and Matti for advising me on my journeys in the world of optics. Iexpress my gratitude to Assistant chief physicist Mika Teras and Professor JuhaniKnuuti for providing me with the time during the last couple of months to completethis dissertation. Without that understanding my thesis may not be ready yet.Chief physicist Jarmo Kulmala is acknowledged for showing interest in my workand encouraging me to finish it. I would also like to thank Hospital physicist TuulaTolvanen, M.Sc. Pauliina Luoto, M.Sc. Tommi Kokki, and Ph.D. Riku Klen, all theradiographers, medical laboratory technologies, researchers, professors, and otherstaff in the Turku PET Centre for creating such a friendly working environmentand for showing their understanding during my last steps in this project. I alsogratefully acknowledge the following funding agencies; the Finnish Foundation forTechnology Promotion, the Jenny and Antti Wihuri Foundation, the Emil AaltonenFoundation, the Instrumentarium Foundation, the Finnish Cultural Foundation,the Finnish Funding Agency for Technology and Innovation, and the Academy ofFinland for their financial support during this work.
I wish to thank with all my heart my dear parents Kati and Arto for all your supportand encouragement during my long trip to achieve the doctor’s degree. Without yourrecent help in babysitting, house remodeling and several other practical matters, thiswork would definitely have been delayed even more. I thank my brother Jimi forteaching me the order of importance in life. I wish to thank also my parents-in-law Kalle and late Seija for always highly respecting my work. Seija’s heartfeltand helpful character will always last in our memories. Finally, more than anyoneelse I wish to thank my beautiful, loving wife Pirkko and our adorable sons, younggentleman Kaarlo, Tuomo living in the moment, and fantasy-traveller Alpo. I amgreatly indebted to you for all the time I have spent in finishing this dissertation. Iwill try with all my best to pay those lost moments back to you. You are the mostvaluable treasures in my life.
Kaarina, November 2009
Tommi Noponen

viii
Contents
Preface vi
Contents viii
List of Publications ix
Author’s contribution x
List of Abbreviations xi
List of Symbols xiii
1 Introduction 1
2 Methodological and theoretical issues of NIRS 3
2.1 Tissue optics and physiology . . . . . . . . . . . . . . . . . . . . . . 3
2.2 Measurement techniques and instruments . . . . . . . . . . . . . . . 4
2.3 Modeling of NIRS signals . . . . . . . . . . . . . . . . . . . . . . . . 6
2.4 Couplings between multimodal measurement parameters . . . . . . 7
3 Instrumentation 9
3.1 Operation of the frequency-domain imaging instrument . . . . . . . 9
3.2 Design and implementation of preamplifiers . . . . . . . . . . . . . 11
3.2.1 Noise and crosstalk measurements . . . . . . . . . . . . . . . 12
3.3 Digital lock-in amplifier . . . . . . . . . . . . . . . . . . . . . . . . 13
3.4 A four-wavelength source system . . . . . . . . . . . . . . . . . . . 13
3.4.1 Wavelength and source switches . . . . . . . . . . . . . . . . 14
3.4.2 Laser diodes, their current sources and temperature stabilizers 15
3.4.3 Encasing the system . . . . . . . . . . . . . . . . . . . . . . 17
3.5 Arranging the instrument into a cabinet . . . . . . . . . . . . . . . 18
3.6 Detector and source fibers for multimodal brain studies . . . . . . . 19
3.7 Other instrumentation . . . . . . . . . . . . . . . . . . . . . . . . . 20
4 Frequency-domain and multimodal brain studies 23
4.1 Hyperventilation and breath-holding study . . . . . . . . . . . . . . 23
4.1.1 Results . . . . . . . . . . . . . . . . . . . . . . . . . . . . . . 23

ix
4.2 Natural sleep study . . . . . . . . . . . . . . . . . . . . . . . . . . . 24
4.2.1 Results . . . . . . . . . . . . . . . . . . . . . . . . . . . . . . 25
4.3 Simultaneous NIRS and EEG measurements of the effects of baseline
blood flow changes on visually evoked responses . . . . . . . . . . . 26
4.3.1 Materials and methods . . . . . . . . . . . . . . . . . . . . . 27
4.3.2 Results . . . . . . . . . . . . . . . . . . . . . . . . . . . . . . 28
4.4 Effects of inhaled iloprost and additional nitric oxide on the cerebral
and other circulatory parameters of preterm lamb . . . . . . . . . . 30
4.4.1 Materials and methods . . . . . . . . . . . . . . . . . . . . . 31
4.4.2 Results . . . . . . . . . . . . . . . . . . . . . . . . . . . . . . 32
5 Pathlength measurement in detection of source coupling error in
near-infrared spectroscopy on human forehead 34
5.1 Instrumentation and data calibration . . . . . . . . . . . . . . . . . 34
5.2 Study design . . . . . . . . . . . . . . . . . . . . . . . . . . . . . . . 35
5.3 Data preprocessing and linear regression of calibrated variables . . . 35
5.4 A criterion to detect a low-quality measurement value . . . . . . . . 36
5.5 The effects on the quality of physiological responses . . . . . . . . . 37
5.6 The effects on the depth sensitivity . . . . . . . . . . . . . . . . . . 40
6 Discussion 42
6.1 Instrumentation . . . . . . . . . . . . . . . . . . . . . . . . . . . . . 42
6.2 Brain measurements . . . . . . . . . . . . . . . . . . . . . . . . . . 43
6.3 Detection of source coupling errors . . . . . . . . . . . . . . . . . . 46
6.4 Closing remarks . . . . . . . . . . . . . . . . . . . . . . . . . . . . . 48
References 49
Errata 67
x
List of Publications
This thesis consists of an overview and the following six publications.
I I. Nissila, T. Noponen, J. Heino, T. Kajava, and T. Katila. Diffuse optical
imaging. In J. C. Lin (ed.), Advances in Electromagnetic Fields in Liv-
ing Systems, vol. 4, Springer Science+Business Media, New York, 2005,
pp. 77−129.
II I. Nissila, T. Noponen, K. Kotilahti, T. Tarvainen, M. Schweiger, L. Li-
piainen, S. Arridge, and T. Katila. Instrumentation and calibration meth-
ods for the multichannel measurement of phase and amplitude in optical
tomography. Review of Scientific Instruments, 76(4), article 044302 (10
pages), 2005.
III T. Noponen, K. Kotilahti, J. Toppila, I. Nissila, T. Salmi, T. Kajava, and
T. Katila. Near-infrared measurements of hemodynamic and oxygenation
changes on the frontal cortex during breath holding, hyperventilation, and
natural sleep. In B. Chance, R. R. Alfano, B. J. Tromberg, M. Tamura,
E. M. Sevick-Muraca (eds.), Proc. SPIE 4955, 2003, pp. 124-133.
IV T. Noponen, D. Kicic, K. Kotilahti, T. Kajava, S. Kahkonen, I. Nissila, P.
Merilainen, and T. Katila. Simultaneous diffuse near-infrared imaging of
hemodynamic and oxygenation changes and electroencephalographic mea-
surements of neuronal activity in the human brain. In B. Chance, R. R. Al-
fano, B. J. Tromberg, M. Tamura, E. M. Sevick-Muraca (eds.), Proc. SPIE
5693, 2005, pp. 179-190.
V T. Noponen, A. Nordh, A. Berg, D. Ley, S.R. Hansson, E. Pesonen, and
V. Fellman. Circulatory effects of inhaled iloprost in the newborn preterm
lamb. Pediatric Research 66(4):416-422, 2009.
VI T. Noponen, K. Kotilahti, I. Nissila, T. Kajava, and P. Merilainen. Ef-
fects of improper source coupling in frequency-domain near-infrared spec-
troscopy. Helsinki University of Technology Publications in Engineering
Physics, Report TKK-F-A859, 20 pages, 2009.
Throughout the overview these publications are referred by their Roman numerals.

xi
Author’s contribution
The six original articles included in this thesis are the result of collaborative work.
In all these studies the author has had a significant role as described in detail below.
Publication I is an extensive book chapter reviewing diffuse optical imaging and
especially tomographic techniques. The author wrote Sects. 2 (Tissue optics and
physiology), 5.1 (Muscle studies), and 5.2 (Optical mammography) and a part of
the discussion section and contributed in the writing of the abstract and the in-
troduction. He also gave comments, references, and made corrections to the other
sections.
Publication II introduces instrumentation and calibration methods of the multi-
channel frequency-domain instrument. The author designed and implemented the
IF preamplifiers, a substantial part of the source and wavelength switching tech-
niques, proposed improvements to the temperature stabilizer electronics, helped in
the implementation of the RF electronics, contributed to the development of the
software lock-in amplifier (LIA) and the control software, participated in testing of
the instrument, and implemented some alternative parts such as a four-channel dig-
ital LIA. He also participated in the writing of the manuscript by giving comments,
suggestions, and making corrections.
For Publications III, IV and VI, the author designed the study series, applied the
permissions, made most of the measurements except the EEG measurements of
Publication IV and the calibration measurement of Publication VI. He implemented
all the signal processing algorithms except the calibration algorithm of Publication
VI and processed the data except the sleep classification of Publication III and the
preprocessing and averaging of EEG signals of Publication IV. The author analysed
all the results and wrote the manuscripts. He also invented the coupling error
detection method of Publication VI.
For Publication V, the author contributed to the design of the near-infrared spec-
troscopy (NIRS) study part and the acquisition of NIRS data. He was responsible
for analysing the NIRS data and also analysed the other preprocessed data. The
manuscript was written in collaboration with all the authors.

xii
List of Abbreviations
AC alternating current
A/D analog-to-digital
A.U. arbitrary unit
AUC area-under-the-curve
BOLD blood oxygen level-dependent
bpm beats per minute
CBF cerebral blood flow
CBV cerebral blood volume
CC correlation coefficient
CF carotid flow
CMRO2 cerebral metabolic rate of oxygen
CNR contrast-to-noise ratio
CO2 carbon dioxide
CSF cerebrospinal fluid
CW continuous wave
Cyto-Ox cytochrome oxidase
dB decibel
dBm decibel milliwatts
DC direct current
DE diffusion equation
DLIA digital lock-in amplifier
DPF differential pathlength factor
DSP digital signal processor
ECG electrocardiography
EEG electroencephalography
EMG electromyography
EOG electro-oculography
ETCO2 end-tidal carbon dioxide
f−3dB −3 dB cutoff frequency
FD frequency domain
fMRI functional magnetic resonance imaging
FVU fraction of variance unexplained
[HbO2] concentration of oxyhaemoglobin
[HbR] concentration of deoxyhaemoglobin
HR heart rate
HV high voltage of photo-multiplier tube
IF intermediate frequency

xiii
INA instrumentation amplifier
iNO inhaled nitric oxide
LO local radio-frequency signal
LIA lock-in amplifier
MEG magnetoencephalography
MEMS micro-electro-mechanical system
MT movement time
NA numerical aperture
NIR near infrared
NIRS near-infrared spectroscopy
NO nitric oxide
NTC negative temperature coefficient
N.U. normalized unit
OP AMP operational amplifier
PC personal computer
PCB printed circuit board
PD photodiode
PH pulmonary hypertension
PLL phase lock loop
PMT photomultiplier tube
Ravg average reflectance
RC resistor-capacitor
REM rapid eye movement
RF radio frequency
rms root-mean-square
RVP right ventricular pressure
S1−S4 sleep stages 1−4
SaO2 arterial oxygen saturation
SDD source-detector distance
sMSE standardized mean squared error
SNR signal-to-noise ratio
STD standard deviation
TD time domain
TMS transcranial magnetic stimulation
TOI tissue oxygenation index
totHb total haemoglobin
TPSF temporal point spread function
VCXO voltage-controlled crystal oscillator
VEP visually evoked potential
VLF very-low frequency
VLFO very-low-frequency oscillation

xiv
List of Symbols
α extinction coefficient
∆A logarithmic change in light modulation amplitude
φ phase shift
IAC modulation amplitude
IDC average intensity
λi wavelength
µa absorption coefficient
µ′s effective scattering coefficient
p p-value of statistical test
p1 p-value of paired statistical test
p2 p-value of unpaired statistical test
R2 coefficient of determination

1
1 Introduction
Medical near-infrared spectroscopy (NIRS) utilizes near-infrared (NIR) light (650 -
950 nm) to study the oxygenation and hemodynamics of tissue non-invasively [1]. In
a typical setup, NIR light is delivered to tissue using optical fibers and detected a few
centimeters from the point of illumination. Traditionally, NIRS has been applied to
monitor local changes in the concentrations of oxy- ([HbO2]) and deoxyhaemoglobin
([HbR]), which are the two strongest NIR light absorbers in most tissues [2]. These
parameters are related to physiologically interesting phenomena such as changes in
blood oxygenation and volume [1–5].
In addition to absorption, scattering affects on the propagation of NIR light in tis-
sue. In fact, scattering is more than ten times more probable than absorption in
typical tissues so that accurate quantification of [HbO2] and [HbR] becomes a chal-
lenging problem. By measuring the attenuation of light in tissue, relative changes in
[HbO2] and [HbR] or the tissue oxygen saturation([HbO2]/
([HbO2] + [HbR]
))can
be derived. Single and few-channel NIRS devices have already been used in clinical
practice to monitor, e.g., brain oxygenation [6–9]. However, further improvements
in quantification accuracy and measurement reliability are needed before NIRS is
adopted in wide-scale as a routine cerebral monitoring method [10–12].
Scattering increases the mean pathlength of photons traversed through tissue. If
both the mean pathlength and the attenuation of light are measured, the absorption
and scattering properties of medium can be separated, which improves the quantifi-
cation accuracy of NIRS [13]. Using the frequency-domain (FD) or the time-domain
(TD) technique, a mean photon pathlength can be measured [13]. During the last
10 years the development of multichannel instruments has opened up possibilities
for imaging applications as well [6, 14–17].
Multimodal monitoring and imaging is a rapidly growing area of research and clinical
practice [18–22]. Different techniques provide somewhat different anatomical and
physiological information with their benefits and limitations so that an integration
of techniques usually provides more comprehensive data. Electroencephalography
(EEG), for instance, measures mainly the electrical activity of neurons in the brain,
but is not very sensitive to hemodynamic changes [23]. NIRS is, in contrast, cur-
rently the only technique providing a possibility for a bedside monitoring of brain
oxygenation and hemodynamics with a sub-second temporal resolution. In many
ways NIRS is an optimal method for multimodal measurements because light does
not interact with the electromagnetic signals used in the other brain measurement
methods.

2
Objectives of the thesis and an outline of the overview
In Sect. 2, the background of NIRS methods and techniques are briefly described.
Publication I provides a detailed review especially emphasizing imaging approaches.
This thesis had three objectives. The first objective was to expand the existing
FD instrument by increasing the number of detector and source channels and mea-
surement wavelengths. In Sect. 3 of this overview, the author’s contributions for
implementing the FD instrument and multimodal techniques for NIRS studies are
described. Other main objectives were to apply the FD instrument and NIRS meth-
ods to multimodal brain studies and to develop a novel method to detect a source
coupling error in a forehead NIRS measurement.
Four different studies using our FD instrument and NIRS methods for human and
newborn lamb brain measurements were carried out (see Sect. 4). The effects of
instrumental parameters on the sensitivity to detect hemodynamic changes induced
by breath holding and hyperventilation were tested. Changes in [HbO2] and [HbR]
during a natural sleep were also measured with our FD instrument. Relationships
between the baseline blood flow and visually-evoked hemodynamic and neuronal
responses in a multimodal NIRS-EEG setup were studied. Sect. 4 concludes with a
multimodal monitoring study of newborn lamb, in which a commercial CW NIRS
monitor was used.
The linearity of FD measurement parameters as a function of source-detector dis-
tance (SDD) detected on the human forehead is studied (see Sect. 5). Based on the
loss of regression of phase data, a method was developed to detect an error in the
coupling between a source fiber and tissue. The method is applied to investigate
the effects of such coupling errors on the contrast, noise and depth sensitivity in a
multichannel FD NIRS measurement. The discussion of the most important results
and the closing remarks of this thesis are presented in Sect. 6.
3
2 Methodological and theoretical issues of NIRS
2.1 Tissue optics and physiology
Light absorption of water is rather low below 950 nm. However, approximately 70−80% of tissues is water, so it has still some contribution to the NIR light absorption.
On the other hand, light absorption of haemoglobin, especially [HbR], decreases
at wavelengths above 650 nm. Therefore, using light at this wavelength range it
is possible to detect signals through several centimeter thick tissues. Furthermore,
HbO2 and HbR have clearly different absorption spectra at NIR wavelengths making
it possible to optically examine the oxygenation of blood and tissue [2,24,25]. Other
oxygenation-dependent absorbers such as cytochrome oxidase (Cyto-Ox) have also
been studied with NIRS but its contribution to NIRS signals is relatively small and
more difficult to detect [26, 27].
When a photon is absorbed in tissue, its energy is converted into thermal energy.
This heating effect is rather low, even lower than the increase of tissue temperature
due to sunlight during a sunny day [28]. In addition, NIR light does not have any
ionizing effects so the technique is generally safe. This makes long-term and repeated
measurements possible. Absorption in tissue is characterized using an absorption
coefficient µa, which is a product of the concentration and the specific extinction
coefficient α of the absorber. Because tissue consists of several absorbers, the total
µa is a sum over µa of all individual absorbers.
The Beer-Lambert law states that in a non-scattering medium the attenuation of
light A is directly proportional to the product of µa and the pathlength L of detected
photons as
A = −ln
(I
I0
)= µa · L, (2.1)
where I0 is an incident light and I detected light intensity. From this relationship,
using measurements at several wavelengths the concentration changes of HbO2 and
HbR in tissue can be derived (see Subsect. 2.3).
Even though the most interesting physiological information in NIRS signals is related
to the light absorption in haemoglobin, elastic scattering is a dominant process that
affects the propagation of NIR light. Due to this diffuse nature, NIRS imaging
is known as diffuse optical imaging [Publication I]. The scattering is characterised
with an effective (or reduced or transport) scattering coefficient µ′s. If the scattering
is isotropic, the inverse of scattering coefficient represents the mean free path of
a photon between two sequential scattering events. Also, scattering changes take
4
place in tissues [29,30]. However, they are assumed to be relatively small compared
to absorption changes. Furthermore, the physiological interpretation of scattering
changes is difficult. Differences in µ′s can be observed, e.g., in imaging applications
between different anatomical structures [31, 32]. Fortunately the µ′s and µa of skull
are low enough to enable the investigation of cerebral tissue through the intact scalp.
Hemodynamic signals and their interpretation
Haemoglobin carries oxygen from lungs to peripheral tissues. When tissue is acti-
vated, the nutrient and oxygen consumption in cells is increased. The blood flow is
therefore increased in the activated areas by several controlling pathways [33–36].
The coupling between cellular and hemodynamic mechanisms forms the base of
functional studies with NIRS [3, 34, 37]. During a typical hemodynamic response,
[HbO2] increases and [HbR] decreases within a couple of seconds after the increase
of cellular activity. When a stimulus or task is completed the [HbO2] and [HbR]
return close to their initial levels typically within 5-10 s [38]. With functional mag-
netic resonance imaging (fMRI) the blood oxygen level-dependent (BOLD) signal is
measured, which reflects changes only in [HbR] [39–42]. Different areas of the brain
are specialized to different kinds of cognitive processes and to control different body
functions. Measurements at several locations make it possible to localize the brain
areas which are mostly activated.
NIR light probes tissue volume that contains blood in arteries, veins and capillaries.
Roughly two third of blood is in veins and most of the oxygen is extracted to tissue
in capillaries. NIRS signal is assumed to be a weighted average of the [HbO2]
and [HbR] in all these three compartments [43, 44]. Furthermore, different vascular
phenomena can create similar and often temporally overlapping changes in NIRS
signals. An increase in blood volume increases both [HbO2] and [HbR], whereas an
increase in blood flow and a decrease in oxygen consumption increases [HbO2] and
decreases [HbR]. An increase in oxygen consumption creates opposite changes [45].
In addition, changes of blood flow and volume are coupled non-linearly [46, 47].
Therefore, the interpretation of NIRS signals is often challenging and may require
additional knowledge or approximations on investigated physiological systems [48,
Publication III, Publication V].
2.2 Measurement techniques and instruments
In the continuous wave (CW) measurement, the attenuation of light in tissue is
measured. The first NIRS instruments as well as most of the current commercial
5
instruments are still based on the CW technology [1, 6, 49]. CW instruments are
typically less expensive and less complex than FD or TD instruments. Using mul-
tichannel configurations, also quantitative values such as tissue oxygen saturation
can be derived [7, 9, 50].
The TD method is the most advanced NIRS technique [15, 16]. In this method,
pico-second long light pulses are emitted into tissue and the time-of-flight distribu-
tion of detected photons is measured, from which a temporal point spread function
(TPSF) can be determined. The mean value of TPSF is directly proportional to the
mean pathlength of photons and the area to the intensity of detected light [51–53].
The TD technique makes it also possible to select photons which have propagated
through different depths in tissue by accepting photons only in a restricted time
window [54, 55]. This procedure, however, decreases the overall signal-to-noise ra-
tio (SNR) of TD measurement, because some of the detected photons are rejected.
This can be compensated by increasing the measurement time. In general with the
TD technique, the lowest light detection limit among all NIRS techniques can be
achieved.
In the FD technique, light intensity-modulated at radio-frequency (> 50 MHz) is
delivered into tissue. The average intensity (IDC), the modulation amplitude (IAC),
and the phase shift (φ) with respect to the incident phase are measured [56,57]. The
φ measurement is directly proportional to the mean pathlength of photons in tissue
at frequencies < 200 MHz [58]. If IAC and φ are measured at all the frequencies,
the same information can be obtained with the FD and TD techniques [59, 60].
This approach, however, increases the complexity and measurement time of a FD
instrument and may decrease its dynamic range and repeatability. In addition,
only a single frequency measurement of IAC and φ is needed to resolve the µa and
µ′s independently in an object [61]. This was one of the main reasons to select a
single-frequency FD technique in our project.
The measurement instrument attenuates and produces temporal delays in the emit-
ted and detected signals. When only relative changes in signals are measured, these
instrumental responses are cancelled out provided that they are temporally con-
stant [62]. However, if the absolute values are to be studied, the instrument has to
be calibrated to remove the instrumental effects on the measurement variables [63].
Often, the calibration has been realized using a reference phantom with known op-
tical properties and a geometry similar to that of the object under study [64–66].
In those cases the relative changes upon the known reference values are measured.
In an other approach all instrumental responses are determined in independent cal-
ibration measurements and corrected so that the instrument can provide directly
absolute quantities [67, Publication II]. In this thesis, we utilize our independent

6
calibration procedure to obtain absolute φ values from the human forehead.
A review by Chance et al reports the state-of-the-art of FD techniques of late 1990’s
and gives valuable advice and lists some challenges in the implementation of FD
system [57]. A review by Wolf et al lists recently developed scientific and commercial
NIRS instruments [6]. Some recent FD systems are designed for special applications
such as for optical mammography [59, 68, 69] or for the imaging of finger joints
[70]. In addition, several FD systems designed mainly for the monitoring of brain
function have only a single channel [71–74] or few channels integrated in a special
measurement probe [4]. Recently, a multi-frequency tomographic system based on
a network analyzer has also been reported [60].
A recent comparison between our FD instrument [Publication II] and a state-of-the-
art TD system [16] revealed some advantages of the FD measurement technique [75].
It provides IAC and IDC data with considerably better SNR and reproducibility
with less expensive instrumentation than the TD technique. The IAC and IDC
signals generally provide better contrast to hemodynamic changes than the φ signal
[Publication III]. The FD technique then gives the same physiological information
as the TD technique in shorter measurement time, which is a clear benefit in several
activation and monitoring studies [76–79].
In Publication I the measurement principles, the basic structures of instruments,
the detector and source techniques and calibration procedures of all three NIRS
methods are summarized in more detail.
2.3 Modeling of NIRS signals
Typical NIRS models, such as the modified Beer-Lambert law, neglect temporal
variations in scattering in which case light attenuation changes are only due to
changes in absorption [25,51,80,81]. This model also assumes a homogeneous tissue
and that the absorption changes occur uniformly in a probed volume, which may
not be true in most of physiological measurements [82].
Typically, at least two measurement wavelengths are used in NIRS. In addition, all
the absorption changes are often assumed to be caused by the changes in [HbO2] and
[HbR]. Using the above mentioned simplifications, the relative changes in signals
can be solved with the modified Beer-Lambert law as [25],
[∆[HbO2]
∆[HbR]
]= (αT α)−1αT
⎛⎜⎜⎝
∆Aλ1
SDD·DPFλ1∆Aλ2
SDD·DPFλ2...
⎞⎟⎟⎠ , (2.2)

7
where ∆Aλiis the logarithmic change in IDC or IAC at wavelength λi with respect
to some arbitrary baseline, DPF is the differential pathlength factor, and α a 2×M
matrix containing the specific extinction coefficients of absorbers at different wave-
lengths [2]. In all studies of this work, the extinction coefficients were taken from [2].
The mean pathlength of photons in tissue can be written as SDD · DPF . The ob-
jectives of the thesis were mostly on instrument and methodological development,
so that this simple but widely used model was utilized in the brain studies.
Beyond the modified Beer-Lambert law, more advanced approaches have been de-
veloped to model the light propagation in tissue and to derive quantitative values
for physiological parameters. The most common light propagation model in diffuse
optical imaging is the diffusion equation (DE). In some simple geometries DE can
be solved even analytically [58,83,84]. Based on such analytical solutions, spatially-
resolved techniques utilizing measurements at several SDDs have been employed
to solve the ratio of µa and µ′s [50]. With the frequency- or time-resolved tech-
niques utilizing also the pathlength measurement, the absolute values of µa and µ′s
can be derived [83, 85, 86]. With some further approximations, absolute values of
[HbO2] and [HbR] can be determined from µa [4, 87, 88]. In optical topographic
imaging, two-dimensional maps, typically without depth information, are straight-
forwardly interpolated [89]. These techniques, however, suffer from, e.g., partial
volume effects [82]. If an object contains layers with distinguishable optical proper-
ties, multilayer models can be applied [90–92]. To resolve continuous distributions
quantitatively, optical tomographic imaging techniques are required [93]. Light prop-
agation models and image reconstruction approaches in diffuse optical tomography
are reviewed in more detail in Publication I. Our FD instrument has been shown to
provide appropriate data also for three-dimensional absolute tomographic imaging
[Publication II].
2.4 Couplings between multimodal measurement parameters
Changes in heart rate (HR) typically increase the cardiac output, which may lead
to an increase in cerebral blood flow and volume [48, Pulication III]. These flow
changes can be detected, e.g., using Doppler ultrasound measurement on the carotid
artery [94, Publication V]. If the arterial oxygen saturation (SaO2) decreases, it
can also decrease the total cerebral tissue oxygen saturation [95]. This thesis will
show that changes in these systemic circulatory parameters can induce changes
in NIRS signals [Publication III]. On the other hand, NIRS makes it possible to
directly monitor hemodynamic and oxygenation changes from the cerebral tissue
which are not necessarily coupled to systemic circulation parameters [Publication
V]. If EEG is used to monitor the sleep stages with a simultaneous cerebral NIRS

8
measurement, the hemodynamic changes related to the level of consciousness can
be studied [96–98, Publication III]. Also, if baseline blood flow is changed during
simultaneous NIRS-EEG measurements of stimulus-evoked responses, links between
these neuronal and hemodynamic processes can be investigated.
In addition to cerebral studies, NIRS has been applied extensively to study the
function of skeletal muscles and to optical mammography [Publication I].

9
3 Instrumentation
When this work started, a single source- and detection-channel and a single wave-
length FD instrument had been developed [74]. The goal of our group was to imple-
ment a multichannel instrument capable of measuring the mean photon pathlength
with good accuracy and simultaneously providing as good SNR as possible to detect
physiological signals in tissue with a sub-second temporal resolution.
The FD instrument was extended first from 1 to 16 time-multiplexed source channels
and to 4 [99] and afterwards to 16 parallel detection channels [Publication II]. The
second measurement wavelength was included to enable spectroscopic studies [Pub-
lication II] and afterwards four laser diodes were integrated in the system [100]. The
original articles of this thesis do not include the detailed descriptions of any imple-
mented parts of FD system or other instrumentation reported in Subsects. 3.2−3.7.
3.1 Operation of the frequency-domain imaging instrument
The structure of the current version of our FD instrument is shown in Fig. 3.1. The
instrument has been designed and implemented in the Laboratory of Biomedical En-
gineering (at present the Department of Biomedical Engineering and Computational
Science) at the Helsinki University of Technology mainly by four group members.
During 2002 it was moved to the BioMag Laboratory located at the Helsinki Univer-
sity Central Hospital to enable its performance testing in neonatal and adult brain
measurements.
The instrument includes four temperature-stabilized laser diodes modulated at 100-
MHz frequency. The diodes are biased with current sources and modulated with
a general-purpose signal generator. The RF shielded package including the diode,
a reactive matching circuit, and a negative-temperature-coefficient (NTC) resistor
is surrounded with peltier-elements and heat-sinks. The peltier-elements and NTC
resistors are part of the temperature-stabilizing system of the laser diode (Sub-
sect. 3.4.2).
A 4×1 fiber-optic micro-electro-mechanical-system (MEMS) switch (Subsect. 3.4.1)
is used to select a single source wavelength and a 1×16 MEMS switch a single source
position active at a time. Light is delivered to the surface of an object through a 100-
µm optical fiber and collected using fiber bundles with a 2.5-mm active diameter.
The light signal is detected using 16 parallel photo-multiplier tubes (PMT) encased
in the modules (H6780-20, Hamamatsu Photonics, Japan).

10
16 sourcefibers
MEMSswitch1x16
PC
Signal 1(5 kHz)
Signal 2(5 kHz)
RF
RF
LO
LO
RF
LOF2 (VCXO)
F1 (signalgenerator)
PLLReference (5 kHz)
Two parallel 8-channel AD cards
Lock-in is calculatedin software
fastH6780-20 PMTDC and RF filters+ amplifiers
fiberbundle
Detectorfiberbundle
16 channels withsimultaneous detection
16-channel DA cardto control the high voltage(gain) of each detector
16-channel AD cardto record DC anodecurrent for each detector
MEMS 1x4switch
Laser diodes,current sources andtemp. stabilizers
100.004 MHz
100.009 MHz
760 nm
850 nm
830 nm
785 nm
IF-preamp
IF-preamp
Detector
H6780-20 PMTDC and RF filters
amplifiers+
Figure 3.1: Block diagram of the current structure of the FD instrument.
The measured signal (RF) is amplified in two stages and mixed with a local radio-
frequency signal (LO) to produce a 5-kHz signal. The LO signal is generated by a
voltage-controlled crystal oscillator (VCXO) and divided by two power splitters. The
mixer output is low-pass filtered (f−3dB ∼ 1 MHz) and guided into an intermediate
frequency (IF) amplifier (see Subsect. 3.2), which is the preamplifier for an analog-
to-digital (A/D) converter. The signals are sampled with two parallel 8-channel
data acquisition cards using a 20-kHz sampling frequency.
The heterodyne measurement technique with a phase-lock loop (PLL) and a digital
lock-in amplifier (DLIA) with a 5-kHz reference signal ensure a high measurement
accuracy [74, 99]. The PLL feedback loop consists of the VCXO, a phase detector
and a low-pass filter. The PLL circuit is controlled by a reference signal from the
DLIA and a signal from another mixer. From these two signals, the PLL circuit
with a low-pass filter in its output generates a control voltage for the VCXO. The
PLL adjusts the frequency difference between the VCXO and the signal generator
(F1) to be the same as the reference frequency. Then the phases of the measurement
and the DLIA reference signals become synchronized. After a measurement, the IAC
and φ difference of the sampled IF signals with respect to the reference signal are
calculated in PC using a DLIA algorithm. In the heterodyne technique, the IAC
and φ of detected RF signal are directly proportional to those of the measured IF
signal.

11
The anode current is also low-pass filtered and amplified. This signal measured
using a data acquisition card is directly proportional to the IDC of detected light.
The PMT high voltages (HV) are adjusted using an analog output board (National
Instruments, PCI-6704). If too high an anode current is used, an intra-channel
phase-amplitude crosstalk is generated inside the PMT. The anode current can be
controlled by changing the HV (or gain) of PMT. A crosstalk can be eliminated,
if the anode current is kept below 70 nA [Publication II]. Therefore a prescan is
carried out before each measurement to adjust optimal HV values for each source-
wavelength-PMT combination. This way the gain is maximized in PMTs without
causing crosstalk. This implementation makes it possible to measure phase and
amplitude independently with a high dynamic range (approximately 1:106) and low
noise floor.
3.2 Design and implementation of preamplifiers
16 parallel IF preamplifiers were designed and implemented [100]. The preamplifiers
should amplify the 5-kHz IF signals ∼ 65 - 105 dB and filter the out-of-band noise
before A/D conversion. To improve the SNR, the noise level of each sequential
amplification stage has to be lower than that of a preceding stage. The amplifiers
should not have a detectable inter-channel crosstalk either.
The preamplifiers are placed in two identical aluminium cases each containing eight
preamplifiers. The preceding mixers are shielded in a separate case. The cases
provide relatively stable but somewhat different ground potentials for those circuits.
A proper decoupling was required to minimize possible ground loops between the
sequential electronics. The input of A/D converter board included a multiplexer
with a 100 pF capacitance between adjacent channels. No capacitive components
were included in the output of the amplifier circuit because additional capacitance
would increase the discharge time of multiplexer producing unnecessary crosstalk
between the adjacent A/D converter channels.
The final implementation includes three sequential operational amplifiers (OP AMP)
in a non-inverting configuration. The filtering is realized with 2nd-order resistor-
capacitor (RC) band-pass filters between sequential amplification stages (see Fig. 3.2).
A precision OP AMP (Analog Devices, OP27) with a low noise (3nV/√
Hz) and in-
put offset voltage (∼ 30 µV), high common-mode rejection ratio of ∼ 120 dB and
relatively large gain-bandwidth production (8 MHz) was selected.
Resistances in a kΩ range were used to reduce the leakage currents from the sig-
nal paths to the ground. The first two amplifier stages have a fixed amplification
(+34.3 dB) and the third is manually adjustable between 0 and +40.6 dB. A pseudo-

12
+5V +5V +5V
-5V-5V -5V100 k 100 pF
OP27 OP27 OP27
10
0-500k
k k k
240 k240 k
24 k24 k
100 k 100 pF
1 nF1 nFvin vout
Figure 3.2: The block diagram of the final layout of preamplifier.
differential input stage was used to disconnect ground loops between the cases. This
was implemented by grounding the first amplifier through an additional 10 Ω resis-
tor. The ground voltage of the mixer case was isolated from the preamplifier case
and connected directly to the other end of the 10 Ω resistor. The first OP AMP
then amplifies the voltage difference between the signal and the ground of the mixer
case.
A two-layer printed circuit board (PCB) was designed using the PowerPCB program
(Mentor Graphics). The electronics were assembled using the Philips ACM Micro
assembly machine in the Laboratory of Electronics Production Technology at the
Helsinki University of Technology.
3.2.1 Noise and crosstalk measurements
The output noise and interchannel crosstalk were measured to evaluate the perfor-
mance of preamplifiers. The noise measurements were carried out in two cases: the
RF amplifiers following the PMTs were turned off and on. The amplifications were
set between +80 − 87 dB, which corresponds to normal operation of preamplifiers.
When the RF amplifier is off the positive input of preamplifier is grounded through
the 50 Ω resistors inside the preceding mixers to the ground of mixer case. The noise
of preamplifiers would have been ∼ 5 – 10% lower if the positive inputs of pream-
plifiers were directly short-circuited to their own ground potential. When the RF
amplifiers were switched on their output noise was added to the measured signals.
When the PMTs were switched on with zero HVs no increase in noise of the RF
amplifiers outputs were observed so the PMTs were switched off in all measurements.
The noise levels were measured using a digital oscilloscope (LeCroy, Waverunner).
The standard deviation (STD) of signals was measured five times. When the RF
amplifiers were turned off, the range of mean noise levels was 24.4 − 50.6 mV and
when turned on it was 236.7 − 108.7 mV. This means that the preamplifier noise
level is ∼ 4 to 5 times lower than the output noise of the RF amplifiers.

13
To reveal possible interchannel crosstalk, the 5-kHz signal with an effective am-
plitude of 40 mV from a generator (HP-33120A, Hewlett-Packard) was fed into a
preamplifier while the other preamplifiers were connected to the preceding mixers.
The measurement signal was attenuated with three sequential -20 dB attenuators
(SAT-20, Mini-Circuits). A SR810 DLIA (Stanford Research Systems) with a 1-s
time constant and a maximum sensitivity setting could not detect any interchannel
crosstalk. In a typical measurement, the effective amplitude of the active channel
is 3.2 V and the noise level of these measurements overwhelming the crosstalk was
∼ 0.04 mV. Therefore the crosstalk has to be at least 98.1 dB lower than the active
channel signal.
3.3 Digital lock-in amplifier
During the development of the FD instrument, a four-channel DLIA based on the
digital signal processor (DSP) technology was developed [99]. A four-channel A/D
converter board was designed to extend a commercial DSP evaluation board (ADSP-
21065L EZ-LAB, Analog Devices). The A/D converter board includes approxi-
mately 150 components and 800 connection pads. The noise level of the final im-
plementation is -86 dB whereas the maximum reachable noise floor of the designed
system would have been ∼ -88 dB. A LIA program was written using an assembly
language of DSP (ADSP-21065L SHARC, Analog Devices). The necessary electron-
ics were designed to integrate the DLIA with the FD instrument and it was used as
a part of the instrument during a four-channel configuration.
3.4 A four-wavelength source system
NIRS applications generally utilize at least two wavelengths. Our first source system
contained two 5-mW laser diodes with temperature stabilizers, current sources, and
a 1×2 prism and 1×16 moving-fiber switch (DiCon Fiberoptics, Inc.) to select the
active wavelength and source position [Publication II]. During this work the control-
ling software and connection electronics were implemented to enable the wavelength
and source multiplexing [99].
The two-wavelength system required improvements. The ∼ 20-Hz maximum switch-
ing frequency for wavelength data needed to be increased to make it possible to
measure blood pulsation signals with a better temporal accuracy [48, 101, Publica-
tion III]. The 1×16 source switch was also slow (switching time > 300 ms) making
it impractical for most physiological applications. The 1×2 prism switch produced
a disturbing switching sound. PCBs of the temperature stabilizers were unnec-
essarily large including some grounding and stability problems and required two

14
external voltage sources. A higher laser power than ∼ 5 mW was desired for most
applications improving SNR. Some applications also benefit from more than two
wavelengths [Publication I] leading to the design of a new four-wavelength source
system [100].
3.4.1 Wavelength and source switches
A source switch was desired consisting of at least 16 channels with a maximum
switching time of ∼ 10 ms. The inter-channel crosstalk was required to be ≤ -80
dB, the switch should have low losses and should not add noise to the measured
signals. In addition, the switch should be silent because the instrument was aimed
to be used in auditory activation studies. Possible solutions compared included an
own implementation, e.g., based on an optical coupler and camera shutters or a fast
servo motor and a rotating small mirror [17], mechanical moving fibers or prisms,
liquid crystal, acousto-optics, electro-optics, magneto-optics, and piezo switches. A
switch based on the MEMS technology provided the best combination of the required
features although its inter-channel isolation was only moderate [100]. Because the
isolation was not a critical parameter in wavelength switching, a 1×4 MEMS switch
(Opneti Communications Co) was purchased for that purpose and for testing. To
control the switch a code using the two data bits from a PC parallel port was written.
The influence of 1×4 MEMS switch to the short-term repeatability of the FD instru-
ment was tested. The amplitude and phase data were recorded from a homogeneous
polyester resin phantom having optical properties similar to those of living tissue.
In all measurements, the wavelengths of 760 and 830 nm with the highest optical
powers available (6.4 and 8.4 mW) and a single channel with a ∼ 2-cm SDD were
used. An HV of 275 V was set to the PMT, resulting in an anode current close to 70
nA. The first ∼ 60 s of reference data were measured at both wavelengths without
switching. Then the signals were measured while switching the two wavelengths at
10-ms and 100-ms intervals. Finally, all four channels were switched at 100-ms in-
tervals. The results indicated that the MEMS switch did not induce any detectable
noise into the signals.
The inter-channel isolation of the switch was also studied. In those measurements,
light from the 785-nm laser was coupled to one of the output fibers of the switch
and passive channels were measured using the FD instrument. The light attenuation
in the measurement setup was determined separately using an optical power meter
(Thorlabs, Model S20MM). The isolation was derived as the ratio of the optical
power in the passive channel to that in the active channel, where the attenuation
of the measurement setup was taken into account. The optical power in the passive
channel was determined from the average value of anode current, the HV, and the

15
sensitivity factor of the PMT. The highest crosstalk of -65.0 – -65.2 dB was detected
from channel 4 to channel 1 in two separate measurements. Otherwise the level of
crosstalk varied between -76.0 – -110.0 dB having mean ± STD = -83.0 ± 13.9 dB.
Afterwards, a 1×17 MEMS switch (Opneti Communications Co) including 16 active
and 1 off channel was integrated into the new source system [102].
3.4.2 Laser diodes, their current sources and temperature stabilizers
Two 100-mA current supplies were implemented to bias the laser diodes so that
their modulation with a RF signal becomes possible. The operation of the supplies
is based on the feedback loop of an ultra-low noise OP AMP (LT1028, Linear Tech-
nology) which is connected to an n-channel MOS transistor (VN0300L, Siliconix
Incorporated) [103]. The advantages of such supplies include low noise and good
temperature stability.
To ensure intensity and wavelength stability the laser diodes must be temperature
stabilized. The design of the stabilizing electronics is based on its previous im-
plementation (Fig. 3.3) [74]. The goal was to accomplish a more compact PCB
with improved performances than previously. The implemented stabilizer cir-
LM675T
5
5
10 kfuse, 800 mA
1 F
NTC k
k k
REF01
1 F
+12V
INA118
+12V-12V
1 F1 F
5.62 k
+8V-8V
1 F1 F
peltiers
10 F 10 F
(a) (b)
Figure 3.3: Block diagrams of a) adjustment and b) measurement section of thetemperature stabilizers implemented in this work.
cuit consisted of separate sections for adjusting and measuring temperatures. The
power OP AMP (LM675T, National Semiconductor) of the adjustment loop forms
a simple current supply. It provided a control current for four peltier elements
(MI1010T, Marlow Industries) connected in series in the RF shielded housing of the
laser diodes. The temperature changes inside the housing were detected with a NTC
resistor (GM472W, Thermometrics) in a bridge connection of equal value resistors.
The voltage differences across the bridge were amplified with instrumentation am-
plifier (INA118P, Texas Instruments) and sampled with a data acquisition board.
The control current level was adjusted with a digital feedback algorithm through
the data acquisition boards [104].

16
The adjustment loop of the previous implementation was not stable across the whole
control voltage range. The circuit was redesigned to operate stably providing as
much output current to the load as possible. The return paths of the power OP
AMP were designed, the resistances were reselected, and smoothing capacitors were
added in the peltier adjustment loop. In the new design a single ±15 V power
terminal with a ground connection was delivered to the PCB. The different supply
voltages for the measurement and adjustment sections were regulated inside the
board. A special effort was made to isolate the supply voltages between the sections
and to stabilize them inside the sections. In addition, a particular emphasis in the
design of the PCB was given to the grounding and the placement of components.
The possibility that a ground noise from the adjustment loop could couple to the
measurement section was to be minimized. The size of the new PCB is about one
fourth of that of the previous one while it contains twice as many components.
The noise level of the stabilizer circuits was determined by measuring the root-
mean square (rms) of the INA output voltage with respect to the ground with
an oscilloscope (9361C, LeCroy). For these measurements the NTC resistors were
replaced with 4.7-kΩ low-noise metal-film resistors. The noise levels of all four
stabilizer boards were between 0.36 - 0.39 mVrms, which is close to the theoretical
input noise level of the A/D converter boards (∼ 0.22 mVrms).
Possible crosstalk between adjustment and measurement sections were determined
as well. Instead of the NTCs, the same 4.7-kΩ resistors were used here as well.
The adjustment circuits were sequentially run using a 1-kHz control voltage from
a signal generator (HP-33120A, Hewlett-Packard). Signals above 1 kHz are effi-
ciently attenuated in the input filter of the adjustment loop so that they were not
analysed. A control signal close to a saturation level was used. The power spectra
from the outputs of the INAs at 1 kHz as well as the background noise levels were
measured with the oscilloscope. When the replacement resistor was attached di-
rectly to the terminal block of the temperature-measurement circuit, the magnitude
of crosstalk was between -75.5 and -80.6 dBm and the background noise level was
between -85.0 and -87.4 dBm. When the resistors were fixed to the terminal blocks
of the laser housings, the crosstalk signal increased to between -51.8 and -55.5 dBm.
This additional crosstalk due to the signal cables from the NTC resistors to the
measurement circuits was further investigated. The measurements were repeated at
the lowest possible control frequency of 100 Hz from the signal generator indicating
an insignificant crosstalk being between -76.2 and -81.6 dBm when the cables were
properly shielded. The normal maximum control frequencies used are < 10 Hz in
which case the crosstalk would be undetectable.
Four laser diodes at wavelengths 760, 785, 830, and 850 nm and with the output

17
powers of 20, 55, 40, and 60 mW respectively were selected for the new source
system [100]. Two wavelengths are HbO2-sensitive and two HbR-sensitive. Longer
wavelengths were not considered because the sensitivity of the cathode material of
our PMTs strongly decreases with increasing wavelength. On the other hand, high-
power (≥ 20 mW) laser diodes at wavelengths below 760 nm were not found at a
reasonable price. The outputs of the laser diodes were coupled with an efficiency
of 80 – 85% to the MEMS switch using commercial translators and collimation and
focusing optics (Thorlabs, Inc.). As a final tuning, the output powers (12.6 − 17.5
mW), the DC currents, and the RF powers were balanced between the laser diodes,
the final modulation depths being between 72 - 87 %. The output powers of the
diodes were maximized and balanced so that none of them exceeded 20 mW, which
is still considered safe for lasers in research use [28].
3.4.3 Encasing the system
The new source system was encased in a standard 3U rack case (see Fig. 3.4). The
Fiber coupling systems
Temperature stabilizers 1x4 MEMS switchSpace forsource switch
Figure 3.4: Photograph of the four-wavelength source system. Space in the frontsection of the case was reserved for a source switch.
four stabilizer circuits were fixed on the sides of the case enabling a proper grounding
and relatively easy access to all terminal blocks of the boards. Four fiber-coupling
systems with the laser diode housings were located in a row in the middle of the
case so that the lasers can be collimated in their final places. The supply voltages

18
were delivered through a single three terminal ±15-V connector and regulated when
needed for the different components inside the case. The wavelength switch was
located in the front section of the case.
3.5 Arranging the instrument into a cabinet
For measurements outside the laboratory it was necessary that the system be portable
(see Fig. 3.5). This was important also for the start of multimodal studies.
(a)
(b)
(c)
Figure 3.5: The FD instrument a) and b) before and c) after the modification.
The different parts were arranged in a standard 19 inch Eurorack cabinet at the
beginning of year 2005. A centralized power supply system was realized by replac-
ing laboratory power supplies with high quality DC supplies with a Eurocard rack
mounting (Delta Elektronika BV 75 SX 15-15). Attempts were made to retain the
relatively easy serviceability of different parts of the instrument. After the modi-
fication the short-term repeatability of the instrument [Publication II, Fig. 5] was
verified to remain unchanged.

19
3.6 Detector and source fibers for multimodal brain studies
A technique enabling the integration of the FD instrument with transcranial mag-
netic stimulation (TMS), magnetoencephalography (MEG) or MRI was to be de-
veloped. MEG and fMRI measurements are generally carried out in a magnetically
shielded room. Improperly shielded magnetic components inside a magnetically
shielded room may break a MEG instrument or cause safety risks in MRI [105]. In
contrast, TMS stimulation coil produces a relatively high magnetic field (∼ 2 T) so
that magnetic materials cannot be attached to the surface of the subject’s head [106].
NIRS measurements simultaneously with MEG, fMRI or TMS are possible provided
that completely nonmagnetic NIRS terminals are used inside a magnetically shielded
room or with TMS. In addition, NIRS terminals on the subject’s head have to be
fitted inside a MEG helmet, MRI head coil or under TMS coil. Thus the terminals
have to be small in size and preferentially attached tangentially to the head surface.
For such multimodal studies, 16 ten-meter long detector fiber bundles and 3 source
fibers were purchased (Z-Light, Latvia). The active diameter of bundles is 2.5 mm.
They contain approximately 300 multimode fibers with a 100-µm core and 110-µm
cladding diameter (e.g., Optran UV 100/110P fibers). The numerical aperture of
fibers is 0.22 and the bundle packing density is ∼ 75 %. The protective jacket was
made from a flexible shrinkable black plastic. One end of the bundle is centralized
in a 35-mm long cylindrical terminal with a 5-mm diameter (Fig. 3.6). The source
fibers include the same fiber material as the detector bundles.
5 mm
(a) (b)
Figure 3.6: a) Photograph of prism (circled) and cylindrical terminals of fibers. b)Close-up picture of the prism terminal with one of the faces pointing upwards.
The other end of the source fiber and the detector bundle contains a terminal with
a right angle micro prism (Lambda Research Optics, Inc.). The prism with 5-mm
faces makes it possible to attach the detector and source terminals tangentially to
an object surface. Both faces of the prism are covered with a multi-layer broadband

20
anti-reflection coating with an average reflectance (Ravg) < 0.5% between 650 and
950 nm at 0 . The reflecting face is covered with silver (Ravg > 80% between 650
and 950 nm at 0 ) to maximize the reflection and with the black sealing paint.
The height of the prism terminals is 5 mm, width 8 mm and length 18 mm. Both
terminals were made of a black Ertacetal C which is hard, stiff and nonmagnetic
engineering plastic enabling precise machining.
The compatibility of new prism terminals was tested with TMS. No movement of
terminals was detected by eye when the terminal was located in the middle of a
figure-of-eight stimulation coil (Magstim 200, Magstim Co) while applying pulses
with a maximum intensity. TMS stimulation was, however, observed to magnetize
the terminal. Therefore, the terminal induced relatively large artifacts when it was
slowly swung close to the MEG detectors. The induced artifacts were reduced after a
careful demagnetization of the terminals. The magnetization was most likely caused
by the Epoxy used to glue the prism on the terminal [107]. In the next generation
terminals, non-magnetic glue should be used.
3.7 Other instrumentation
Techniques for hyper- and hypocapnia studies
A breathing system was constructed to induce cerebral blood flow (CBF) changes
by varying the carbon-dioxide (CO2) content of inhaled and exhaled air. This was
possible because CO2 is a major regulator of CBF in the human brain [108]. The
system consists of a gas bottle with a mixture of oxygen (21 %), CO2 (8 %), and
nitrogen (71 %), a manually adjustable rotameter to control the gas flow, a breathing
mask with tubing to deliver the gas, and connectors to the gas module [100]. In the
hypercapnia measurements of Publication IV, the hypercapnia was induced using
gas-flow level of 6.0±1.0 l/min. In Publication VI, two different flow levels (1.8±0.3
and 7.2±0.4 l/min) were used.
An AS/3 patient monitoring system (Instrumentarium, Finland) was used. It con-
tains a gas module to measure gas exchange parameters such as a capnogram with an
end-tidal CO2 (ETCO2) and a spirometer to measure additional respiratory param-
eters. A hemodynamic module measures the HR using three electrocardiography
(ECG) electrodes in the shoulders and in the left hip. It also includes a finger-
attached pulse oximeter to measure SaO2. For data transfer, a S/5 Collect software
(Instrumentarium, Finland) having the capability to transfer about 150 trend pa-
rameters or digitized signal waveforms to PC was used. For these measurements,
the most important reference parameters were ETCO2, HR, and SaO2 [100].

21
In Publication III a standard capnogram monitor (Normocap 200, Datex, Finland)
was used to continuously monitor the CO2 content of expiratory air.
Sleep-monitoring system
A standard sleep measurement facility was set up for natural sleep studies ([Publica-
tion III] and Subsect. 4.2). Polysomnography was used to record electrical activity
and the sleep stages of the subject. The data were recorded using an ambulatory
device (Embla, Flaga hf. Medical Devices, Iceland) containing a four-channel EEG
(C4-A1, O2-A1, C3-A2, and O1-A2), a single-channel electromyography (EMG)
for measuring muscle activity on the jaw, and a single-channel electro-oculography
(EOG) for detecting eye movements. A single-channel ECG (electrodes on right and
left arm) measures the HR and a pulse oximeter, attached to the subject’s index
finger, measures the SaO2. A codec (DivX 5.1, DivX, Inc.) was used to capture
video images from a standard monitoring camera into the PC to register subject’s
head movements.
Movement sensor
Motion artifacts are often harmful and set limitations for all medical imaging modal-
ities [109–111]. Even though NIRS is not the most vulnerable method for the mo-
tion artifacts, they can still seriously complicate the acquisition of NIRS data as
well [112, 113]. To avoid such problems, a two-axis inclinometer chip (SCA100T,
VTI Technologies Oy, Finland) was included in our NIRS measurement setup to
detect the subject’s head movements [Publication IV]. First a laboratory-made solu-
tion was applied. A similar prototype detector was also developed by GE Healthcare
Finland partly in parallel with us. Afterwards, this GE’s sensor has also been used
in our measurement setup.
NIRO-300 oxygenation monitor
A NIRO 300 (Hamamatsu Photonics K.K., Japan) NIRS monitor was applied to
study newborn lambs ([Publication V] and Subsect. 4.4). These measurements were
carried out in Lund University in Sweden. The NIRO 300 is an easily portable
bedside monitor consisting of display (∼ 390 × 250 × 340 mm) and measurement
(∼ 140 × 255 × 85 mm) units with some cabling. It uses four sequentially pulsed
laser diodes (775, 813, 853, and 910 nm) as light sources. Our version of the in-
strument has a single channel. Light is delivered to tissue using an optical fiber

22
and detected using 3 parallelly integrated photodiodes (PD) which can be attached
directly to the tissue surface using a probe holder and double-sided adhesive tape.
The measurement probe provides either a 4- or a 5-cm measurement distance.
The monitor measures the changes in [HbO2], [HbR], total hemoglobin([totHb] =
[HbO2] + [HbR]), and the redox-state changes of Cyto-Ox simultaneously with the
tissue oxygenation index (TOI). The TOI is a ratio of [HbO2] and [totHb] given as
a percentage in analogy with SaO2. However, TOI indicates mostly venous blood
oxygen saturation instead of that due to arterial blood [7, 43]
The concentration changes are calculated in NIRO 300 using the modified Beer-
Lambert law (Eq. 2.2). To determine quantitative changes, a constant value for
the differential pathlength factor (DPF) was taken from the literature. The TOI
value is calculated in the monitor using spatially resolved spectroscopy [50]. The
attenuation of intensity signals at the three PDs as a function of distance from
the source is utilized. The derivation of TOI starts from a solution of diffuse re-
flectance in a homogeneous scattering medium in a half-space geometry [114]. With
a few approximations and using an experimentally derived model for the wavelength
dependency of tissue scattering coefficient, the ratio of [HbO2] and [HbR] can be
derived [50, 115,116].

23
4 Frequency-domain and multimodal brain studies
This section concentrates on the methods and findings of Publications III − V.
4.1 Hyperventilation and breath-holding study
This study summarizes the first human brain monitoring measurements with our FD
instrument. Breath-holding and hyperventilation tasks were considered relatively
easy and safe ways to induce hemodynamic and oxygenation changes in the brain.
The principal purpose of the series was to test the sensitivity of the instrument
to detect hemodynamic changes in the human head. Furthermore, the effects of
SDD and measurement wavelength on the IAC and φ signal contrast as well as the
frequency content of the IAC signals were investigated [Publication III].
Eight measurements were carried out on two subjects. The FD instrument at that
time contained only a single laser source and four detection channels. Three mea-
surements at 760 and 808 nm and two at 830 nm were carried out at the laser
power of approximately 4 mW. The laser source was manually changed between the
measurements. The IAC and φ data were recorded during a sequence containing
periods of rest (2 min), hyperventilation (2 min), rest (2 min), breath holding (2
min), and rest (2 min). The sequence was repeated once and the last rest period
was 4 min resulting in a total measurement time of 22 min. The source fiber and
the four detection bundles were attached to the left side of subject’s forehead close
to the hairline corresponding to SDDs of 2, 3, 4, and 5 cm. The fiber holder made
of thermoplastic was individually shaped for each subject before measurements.
4.1.1 Results
In these measurements, better contrast-to-noise ratio (CNR) was found from IAC
than from φ data. The physiological interpretation of IAC signals is also more
straightforward so that they were selected for further analyses. It was further no-
ticed that both contrast and noise content increased with the SDD [Publication III,
Figs. 4 and 5]. The different measurement wavelengths were found to reflect differ-
ent physiological phenomena. The decrease in CBF during hyperventilation tends
to decrease the [HbO2], which was detectable at the HbO2-sensitive wavelength of
830 nm. Breath holding increases cerebral blood volume (CBV) and induces hy-
poxia which increases [HbR]. This effect was clearly detected at the HbR-sensitive
wavelength of 760 nm [Publication III, Fig. 6]. The 2-min breath holding induced a
nearly 50% decrease in these 760-nm signals at the SDD of 5 cm.
24
The frequency content of the amplitude signals was investigated with the power
spectra. The time variations of the frequency components were analysed with spec-
trograms. Two dominant frequency components were found in each measurement.
One component at 1 Hz was induced by the blood pulsation, especially in arterial
compartments. Another strong component was found at very-low frequencies (VLF,
0.01 – 0.03 Hz). The physiological background of these oscillations is still somewhat
controversial even though their existence has been verified by other measurement
techniques as well [117,118]. One possible explanation is circulatory autoregulation
where small arteries fluctuate rhythmically causing slow vasomotions [119]. Our
results support this theory because the VLF oscillations (VLFO) were clearer at
HbO2- than at HbR-sensitive wavelengths.
4.2 Natural sleep study
In modern countries, sleep disorders have become a common problem which affects
the quality of life of an increasing number of people. Typical clinical techniques to
quantify sleep and its disorders are personal interviews, questionnaires based on the
patient’s own observations, video or actigraphy recordings and bioelectrical mea-
surements such as EEG [120–124]. Actigraphy measures the patient’s movements
and EEG the changes in electrical activity in the human brain. Polysomnography
is a widely used multimodal sleep research technique, which consists of EEG, EOG,
and EMG [120, 121]. Often also ECG and a pulse-oximeter are included to record
global circulatory parameters such as changes in HR and SaO2. However, a method
to directly monitor local hemodynamic changes in the brain is missing from the
clinically used sleep research techniques.
During natural sleep, various physiologically and neurologically interesting processes
change the electrical activity of the brain [125]. It has been shown that natural sleep
affects CBF and the cerebral metabolic rate of oxygen (CMRO2) [126]. In disorders
like sleep apnea, decrease in cerebral oxygenation and CBF may even lead to life-
threatening consequences [120].
The interest of our research group towards multimodal monitoring, especially dur-
ing anaesthesia and intensive care, was a main motivation for these natural sleep
studies. Combined NIRS and EEG sleep studies could be carried out in a normal
laboratory environment and they can provide a useful information for further mon-
itoring studies. In fact it turned out that the detection of hemodynamic changes
during sleep became an interesting research topic by itself [Publication III].

25
Materials and methods
A preliminary study was carried out to test the ability of the four-channel FD
instrument to detect hemodynamic changes in the human brain during natural sleep.
The series consisted of six recordings on two volunteers. One measurement was done
at a single wavelength (808 nm) and the others at two wavelengths (760 and 808
nm) controlled by a DiCon prism switch (see Subsect. 3.4).
As in hyperventilation and breath-holding studies, a similar laser power and posi-
tioning of fiber holder with the same SDDs were used. In the first two measurements,
the fibers touched the subject’s skin and in the others, they were fixed approximately
1.2 mm above the skin. During ∼ 1.5 – 2.5-hour measurement, the subject lay in
bed. The night before the measurement the subjects were asked to sleep some 2 to
3 hours less than normally to help them fall asleep for the measurement. The sub-
jects were woken up at the end of recording. The ethics committee of the hospital
approved the study plan.
As the reference method, polysomnography was used to classify the sleep stages of
the subject (see Subsect. 3.7). The polysomnographic data were analysed by a pro-
fessional neurophysiologist with the help of a semi-automatic classifier (Somnolog-
ica, Flaga hf. Medical Devices, Iceland) and following the Rechtschaffen and Kales
rules [127]. The sleep stages were classified into six different categories: awake, sleep
stages 1−4 (S1−S4), and the rapid eye movement (REM) sleep and into movement
time (MT).
The low-frequency changes in single-wavelength IAC data were enhanced by low-pass
filtering and down-sampling the signals. For the dual-wavelength measurements,
the wavelengths were switched at the frequency of ∼ 1 Hz. The IAC data at both
wavelengths were separately averaged over the pulses and temporally aligned. The
[HbO2] and [HbR] were calculated from the IAC signals using the modified Beer
Lambert law (Eq. 2.2). The DPF values were taken from the literature [73, 128]
because the FD instrument was not calibrated for these measurements.
4.2.1 Results
The single-wavelength IAC signals correlated well with the changes in the sleep stages
[Publication III, Fig. 9]. The measurement was primarily sensitive to changes in the
CBV at 808 nm. During the falling-asleep period, the amplitude signal increases
indicating a decrease in the CBV. Correspondingly, during the waking-up period,
the CBV increased decreasing the optical signal. Both the heart rate and the SaO2
decreased during the sleep periods as well.

26
Figure 4.1 shows the data from a dual-wavelength sleep measurement. The [HbO2]
S4
S2
wake
MT
35
40
45
50
bp
m
95
100
%
0
2
4
6
Hb
O2
(uM
)
16:45:00 17:00:00 17:15:00
-1
0
1
Hb
(uM
)
Time (hh:mm:ss)
d) [HbO ]2
M
ola
r
a) Sleep stages
b) Pulse
c) SaO2
e) [HbR]
M
ola
r
Figure 4.1: Data from dual-wavelength natural sleep measurement. The opticalsignals were measured using the SDD of 3 cm. The ∆[HbO2] and ∆[HbR] signalswere low-pass filtered using a time constant of 15 s to emphasize the slow changesin the signals. (Modified from Publication III)
increases and the [HbR] decreases during the two awakening periods around 16:58:00
and 17:08:00. The increase in the [HbO2] is larger than the decrease in the [HbR]
indicating an increase in CBF during awakening if CMRO2 is assumed to stay con-
stant. Changes in the HR are also detected during the awakening transitions.
4.3 Simultaneous NIRS and EEG measurements of the effects
of baseline blood flow changes on visually evoked responses
EEG is a traditional technique to study the post-synaptic activity of neurons in
the human brain [23]. In spite of its versatile applicability in human brain studies
such as in the detection of epilepsy, EEG does not directly measure the cerebral
hemodynamic and oxygenation changes. The neuronal and vascular processes in
the brain are linked together by the so-called neurovascular coupling [33, 34].
Here, a method is introduced to study the system level neurovascular coupling by
simultaneous NIRS and EEG measurements [Publication IV]. An integrated EEG-

27
NIRS helmet was implemented for these measurements. The main objective of this
study was to investigate plausible relationships between the changes in baseline
blood flow and the visually evoked hemodynamic and neuronal responses.
In addition to NIRS, only fMRI provides a comparable temporal resolution to study
the time courses of hemodynamic responses non-invasively [40–42]. It is, however,
technically more challenging to combine EEG with fMRI than with NIRS [129–131].
Some simultaneous NIRS and EEG measurements have already been reported [132–
140, Publication IV]. This was the first study where the whole-head EEG and
multi-channel NIRS were combined.
4.3.1 Materials and methods
For this study three volunteers were measured, and one of them (Subject 1) was
measured twice. In the first session of Subject 1, a radial half-field pattern-reversed
checkerboard stimulus was used. In all other measurements, 16-ms rectangular full-
field checkerboard (24x32 cm) flashes were presented on a normal computer monitor.
The stimulus blocks were ∼ 5-s long with an inter-stimulus interval of ∼ 0.5 s so
that each block contained ten flashes or pattern reverses. The stimulus blocks were
separated by ∼ 25-s rest blocks. Each subject participated in four visual activation
measurements, two during normo- and hypocapnia and two during normo- and hy-
percapnia. The measurement sets were counterbalanced so that two measurements
started with 4-min normocapnia and the other two with 4-min hypo- or hypercap-
nia periods in a random order. Hyperventilation was used to induce hypocapnia.
Hypercapnia was produced by breathing CO2-enriched air (see Subsect. 3.7). The
study plan was approved by the ethics committee of the hospital.
The current configuration of our FD instrument including the new source system
(see Sect. 3.4) was used in this study. Two wavelengths (760 and 830 nm) with ∼12 and 16 mW of output powers were applied. EEG signals were recorded using a
60 channel system compatible with TMS [141]. Multiple EEG channels enable us
to localize the strongest visually evoked activity.
The optode holders were integrated into the EEG cap to make simultaneous mea-
surements of optical and EEG responses possible (Fig. 4.2). One source fiber and
eight detection bundles were placed on both left and right hemispheres above the
visual cortex at three different SDDs (∼ 35, 42, and 55 mm).
After preprocessing, the sampling frequency was ∼ 6.2 Hz for the optical signals.
The signals from the closest source only were further analysed resulting in eight
active detectors from both hemispheres. The data at different wavelengths were

28
1. 2.
3. 4. 5. 6.
1. 2.
15. 16.
12. 13.11. 14.
8. 9.7. 10.
a) b)
Figure 4.2: a) The positions of the 60 EEG electrodes, the 2 source optodes (yellowcrosses), and the 16 detection optodes (numbered yellow circles). The locationsof some electrodes from the International 10-20 electrode placement system arealso shown. b) Photograph of the measurement setup. A movement sensor (seeSubsect. 3.7) was also taped on the top of subject’s head. (From Publication IV)
temporally aligned and the [HbO2] and [HbR] signals were calculated using again the
modified Beer-Lambert law (Eq. 2.2). Values from literature were used for the DPFs
[73,128]. Baseline changes in [HbO2] and [HbR] due to hypo- and hypercapnia were
investigated by low-pass filtering the signals (f−3dB = 0.0166 Hz). Before further
averaging, the baseline changes were subtracted from the signals and the signals
were again low-pass filtered (f−3dB = 0.5 Hz) to suppress the pulse component and
other high-frequency interferences. The [HbO2] and [HbR] responses were averaged
using a window with a ∼ 5-s pre-stimulus interval and a total length of ∼ 35 s. The
signals during normocapnia and hypo- or hypercapnia were processed separately
resulting in eight responses altogether for each average from each data set.
The EEG epochs with clear artifacts were rejected. The averaging window started
70 ms before each stimulus and had a total length of 470 ms. The averages were low-
pass filtered (f−3 dB = 40 Hz). The stimulus blocks were divided into normocapnia
and hypo- or hypercapnia intervals so that 80 epochs at maximum were averaged
during each condition.
4.3.2 Results
The analyses of baseline changes during hyperventilation reveal similar decreases
in [HbO2] in all channels indicating a global decrease in CBF due to hypocapnia.
During the recovery period, [HbO2] increases close to its initial level. The changes
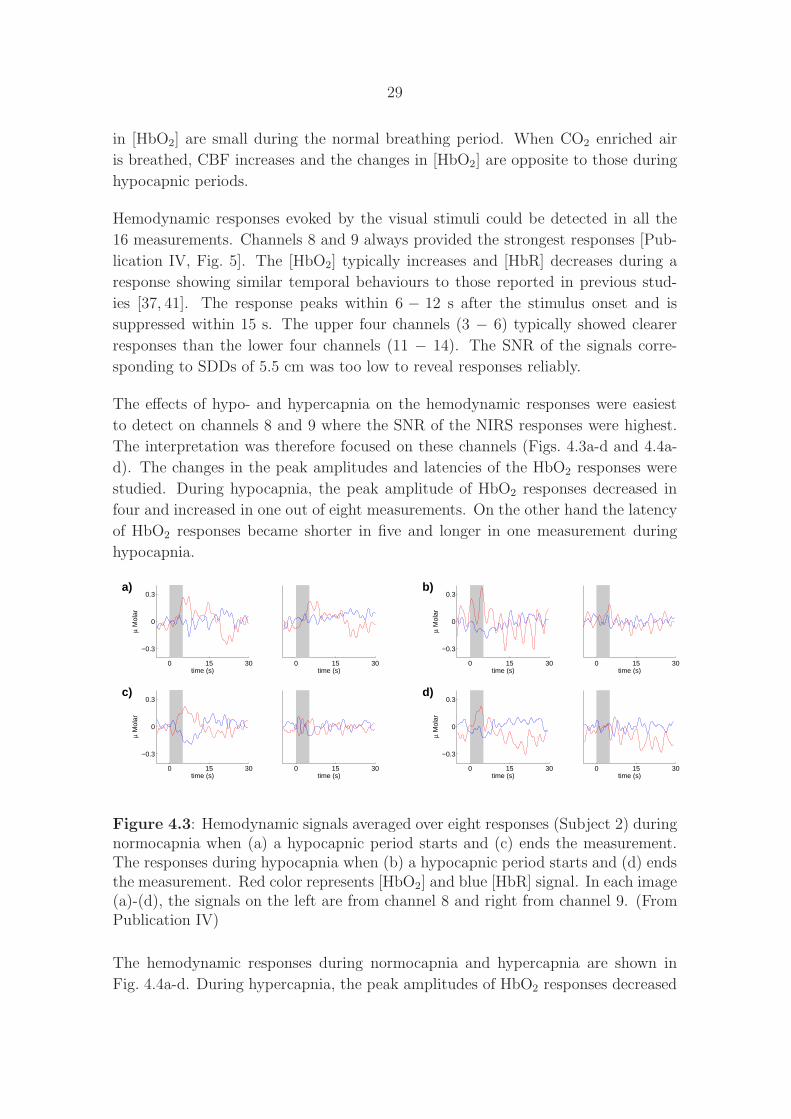
29
in [HbO2] are small during the normal breathing period. When CO2 enriched air
is breathed, CBF increases and the changes in [HbO2] are opposite to those during
hypocapnic periods.
Hemodynamic responses evoked by the visual stimuli could be detected in all the
16 measurements. Channels 8 and 9 always provided the strongest responses [Pub-
lication IV, Fig. 5]. The [HbO2] typically increases and [HbR] decreases during a
response showing similar temporal behaviours to those reported in previous stud-
ies [37, 41]. The response peaks within 6 − 12 s after the stimulus onset and is
suppressed within 15 s. The upper four channels (3 − 6) typically showed clearer
responses than the lower four channels (11 − 14). The SNR of the signals corre-
sponding to SDDs of 5.5 cm was too low to reveal responses reliably.
The effects of hypo- and hypercapnia on the hemodynamic responses were easiest
to detect on channels 8 and 9 where the SNR of the NIRS responses were highest.
The interpretation was therefore focused on these channels (Figs. 4.3a-d and 4.4a-
d). The changes in the peak amplitudes and latencies of the HbO2 responses were
studied. During hypocapnia, the peak amplitude of HbO2 responses decreased in
four and increased in one out of eight measurements. On the other hand the latency
of HbO2 responses became shorter in five and longer in one measurement during
hypocapnia.
0 15 30
−0.3
0
0.3
µ M
olar
time (s)0 15 30
time (s)
a)
0 15 30
−0.3
0
0.3
µ M
olar
time (s)0 15 30
time (s)
b)
0 15 30
−0.3
0
0.3
µ M
olar
time (s)0 15 30
time (s)
c)
0 15 30
−0.3
0
0.3
µ M
olar
time (s)0 15 30
time (s)
d)
Figure 4.3: Hemodynamic signals averaged over eight responses (Subject 2) duringnormocapnia when (a) a hypocapnic period starts and (c) ends the measurement.The responses during hypocapnia when (b) a hypocapnic period starts and (d) endsthe measurement. Red color represents [HbO2] and blue [HbR] signal. In each image(a)-(d), the signals on the left are from channel 8 and right from channel 9. (FromPublication IV)
The hemodynamic responses during normocapnia and hypercapnia are shown in
Fig. 4.4a-d. During hypercapnia, the peak amplitudes of HbO2 responses decreased

30
0 15 30
−0.6
0
0.6
µ M
olar
time (s)0 15 30
time (s)
a)
0 15 30
−0.6
0
0.6
µ M
olar
time (s)0 15 30
time (s)
b)
0 15 30
−0.6
0
0.6
µ M
olar
time (s)0 15 30
time (s)
c)
0 15 30
−0.6
0
0.6
µ M
olar
time (s)0 15 30
time (s)
d)
Figure 4.4: Hemodynamic signals averaged over eight responses (Subject 3) duringnormocapnia when (a) a hypercapnic period starts and (c) ends the measurement.The responses during hypercapnia when (b) a hypercapnic period starts and (d)ends the measurement. Red color represents [HbO2] and blue [HbR] signals. Ineach image (a)-(d), the signals on the left are from channel 8 and right from channel9. (From Publication IV)
in all except one measurement. The latency of HbO2 responses became longer in all
measurements during hypercapnia.
The visually evoked potentials (VEPs) were detected in all 16 measurements. The
strongest responses originated in the channels 48−50 and 54−60 located above the
visual cortex. The P100 component that arose ∼ 100 ms from the onset of stimulus
was observed in all these VEPs [142]. The effects of hypo- and hypercapnia on
the peak amplitude and latency of VEP-P100 component were also studied. These
changes were typically easiest to detect in channels 58 and 60, which were selected
for further analyses.
The peak amplitudes increased in four and decreased in two measurements during
hypocapnia. The latency was shorter in six and longer in one hypocapnic measure-
ment. During hypercapnia, the peak amplitudes decreased in four and increased in
two measurements. The latency was shorter in five and longer in two hypercapnic
measurements.
4.4 Effects of inhaled iloprost and additional nitric oxide on the
cerebral and other circulatory parameters of preterm lamb
The pulmonary vascular resistance decreases rapidly during a normal postnatal tran-
sition from fetal to neonatal circulation. Disturbances in this transition may lead

31
to an elevated pulmonary arterial resistance resulting in a pulmonary hypertension
(PH), low oxygen delivery to tissue and peripheral hypoxia. Nitric oxide (NO) and
prostacyclin are one of the main endogenous pulmonary vasodilators [143]. Inhaled
NO (iNO) is a widely accepted therapy for PH in newborns [144]. Because iNO
is expensive and potentially toxic [145], it is important to study alternative pul-
monary vasodilators, one of which is the prostacyclin analogue iloprost. Only some
promising case reports exist on the circulation effects of inhaled iloprost in newborn
infants [146–148].
For newborn lambs, hypoxia constricts the pulmonary vessels, inducing a condition
similar to the persistent PH in newborns [149]. The main objective of this study
was to test using a preterm lamb model [150] the effects of inhaled iloprost on the
pulmonary and peripheral circulation including the cerebral hemodynamics moni-
tored using NIRS. Also an iNO treatment was used to assess its additional effects
on parameters studied. The benefits of NIRS to detect cerebral tissue oxygenation
and hemodynamic changes were tested in this multimodal monitoring setup.
4.4.1 Materials and methods
19 preterm lambs delivered by caesarean section were studied. The lambs were ran-
domized to iloprost or control groups. After the fetal head and neck were extracted,
the head was covered by a rubber glove to transiently preclude breathing. Catheters
were placed in the axillary artery and in the jugular vein for blood sampling. An
ultrasonic flow probe was placed on the carotid artery. An endotracheal tube was
inserted by tracheotomy and surfactant was given. After delivery, the lamb was
weighed, moved to an incubator and an endotracheal tube was connected to the
ventilator.
With the help of ultrasound, the venous catheter was inserted into the right ventricle
to continuously monitor right ventricular pressure (RVP). Catheters were placed in
the umbilical vein and artery for postductal blood sampling. From preductal and
postductal blood samples, pH and blood gases were analysed. Three subcutaneous
electrodes were used to continuously record ECG. A temperature probe and the
NIRS probe of NIRO 300 (Subsect. 3.7) were attached to the scalp. A continuous
tail pulse-oximeter was used to register SaO2. Transthoracic echocardiography was
performed to measure blood flow velocities in the aorta and proximal parts of the
coronary arteries using a Doppler ultrasound probe. From these data the cardiac
output was estimated.
After 60 min of stable ventilation, three 15-min iloprost doses in 15-min intervals
were given using a nebuliser connected to the ventilator tubing. For the control
32
group, saline was administered. For the low dose group, the iloprost dose was
doubled for each inhalation, whereas for the high dose group, the last dose was five-
fold compared to that given for the low-dose group. An iNO dose of 40 ppm was
given to lambs of the high dose iloprost group and to five control lambs after 90 min
[Publication V, Fig. 1]. During iloprost treatment, all measurements were performed
in seven time points; just before and 15 min after the onset of each inhalation and
30 min after the last inhalation. The 90-min values were also used as the baseline
for iNO (before iNO) and the response values (during iNO) were recorded during
the next 10 min.
Before attaching the NIRS probe above the temporal lobe the fetal head was shaved
and cleaned. The longer SDD (5 cm) was preferred to maximize the contribution of
cerebral signal. The [HbO2], [HbR], and Cyto-Ox signals, and TOI were acquired
at 0.2 Hz sampling rate.
During iloprost treatment NIRS data were sampled at every 15 min simultaneously
with other parameters. NIRS signal artifacts were corrected using an algorithm.
To quantify the signals a DPF previously used for fetal lambs was utilized [151].
Concentration changes in [totHb] were also analysed. The original TOI signal was
normalized with its baseline value before the first iloprost or saline inhalation, or
iNO to derive relative TOI values. The before iNO values were averaged in the
window between 4 and 2 min before the onset of iNO and the during iNO values in
the window between 8 and 10 min after the onset of iNO.
The preprocessing and statistical analyses were carried out in Matlab programming
environment (The MathWorks, Inc.) and with SPSS software (SPSS, Inc.).
4.4.2 Results
Statistical analyses revealed significant differences between the groups between 0 and
60 min only in haemoglobin (p=0.021) and TOI (p=0.050). However, no significant
differences between the groups in changes over time (0-60 min) were observed in
any parameters. It was also found that the third iloprost inhalation did not affect
significantly on physiological parameters.
The NIRS data obtained from the low and high iloprost groups were similar (Fig. 4.5).
From 45 to 90 min a significant decrease (p<0.025) occurred in [HbO2] and in rel-
ative TOI in control lambs, whereas no such change was observed in the iloprost
treated lambs (Fig. 4.5). The [totHb] correlated significantly (R2 = 0.14, p<0.001)
with haemoglobin values, whereas [HbO2] did not.
An evident increase in oxygenation occurred in both groups during iNO treatment

33
A B C
* *
N.U
.
Figure 4.5: Effect of inhaled iloprost (grey areas) on cerebral tissue oxygenation. saline (n=10), × low iloprost (n=3), and • high iloprost (n=5) group. (A) Adecrease in [HbO2] and (C) in relative TOI (normalized unit, N.U.), and (B) anincrease in [HbR] occurred only in control lambs indicating the degrade of cerebraloxygenation. The changes in [HbO2] and relative TOI from 45 to 90 min (solid thickline) differ significantly (* p<0.025) between control and iloprost groups. (FromPublication V)
which was shown as significant changes in several parameters. However, only RVP
decreased significantly more (p<0.01) in iloprost than in saline pretreated lambs
[Publication V, Fig. 3]. [HbO2] increased and [HbR] decreased during iNO indicating
a significant increase in cerebral oxygenation (Fig. 4.6).
A B C
**
During iNODuring iNODuring iNOBefore iNO Before iNO Before iNO
15
10
5
0
-20
*
Figure 4.6: During iNO (A) the [HbO2] increased in control and iloprost groupsand (B) [HbR] decreased correspondingly (* p<0.05, ** p<0.01). (C) However,TOI did not increase significantly ( saline+iNO, n=4 and • iloprost+iNO, n=5).(From Publication V)

34
5 Pathlength measurement in detection of source
coupling error in near-infrared spectroscopy on
human forehead
Currently there is no widely used method in NIRS to directly measure the quality
of coupling between source optode and tissue and thereby measurement reliabil-
ity. This is probably one of the reasons why NIRS methods have not been widely
accepted in clinical practice [10–12]. Previously, coupling errors have been compen-
sated in imaging experiments by using special reconstruction methods [152,153]. In
this study, the linearity of absolute φ, quasiabsolute IAC , and IDC in human forehead
measurements is analysed as a function of SDD. Previously, the linearity of these
variables has mainly been demonstrated in phantom studies [58,71,84–86,154–161].
The temporal information such as φ data in NIRS has been typically used in three
different ways. The mean pathlength of photons in tissue can be determined from
φ data and used to quantify the concentration changes in tissue with the help of,
e.g., the modified Beer-Lambert law (Eq. 2.2). In frequency-resolved spectroscopy,
the φ data have been used to solve the DE analytically and to derive the estimates
of the absolute values of [HbO2] and [HbR] [4, 85, 86]. In optical tomography the
φ and IAC or IDC measurements are required for the reconstruction of the spatial
distributions of µa and µ′s independently [61, 93].
Based on φ data a novel approach to detect an incomplete source-to-tissue coupling
in a forehead measurement will be introduced. The effects of a bad coupling on the
contrast and depth sensitivity of [HbO2] and [HbR] responses during hypercapnia
and hyperventilation are also investigated.
5.1 Instrumentation and data calibration
In this study, our FD instrument included the laser diodes at 760 and 830 nm, the
1×2 prism switch for wavelength selection and the 1×16 moving fiber switch for
selecting the source position (Subsect. 3.4 and [Publication II]). Two source fibers
and ten detector bundles were attached on two parallel rows between ∼ 1−5 cm on
the right side of the forehead using a same individually shaped fiber holder for each
subject. In this special fiber holder, every other source and detector terminal had a
gap (∼ 1.6 mm) between the optode and tissue. Half of the optodes were thereby
pushed against the fiber holder material while the others made a contact with skin.
This arrangement made it possible to investigate the influence of non-contact optode
35
on the FD measurement parameters.
To produce absolute φ and quasiabsolute IAC data the FD instrument was calibrated
using a three-step procedure [Publication II]. In the first step, the effects of HV
changes in PMTs on the φ and IAC signals were corrected at both wavelengths
using an independent phantom measurement. In the second step, the interchannel
variations of each source and detector channel were balanced against source 1 and
detector 1 [67]. Finally, the φ and IAC values between source 1 and detector 1 were
measured just before or after each measurement. For the IDC data, only HV changes
were compensated with the estimated gains of the PMTs. The data acquisition
cards of the FD instrument corresponding to detection channels 9 and 10 were not
precisely synchronized, which prevented exact φ calibration of these channels.
5.2 Study design
All measurements started with a 2-min rest period, during which the values for
the regression analyses were measured. This was followed by three 2-min periods
when the subject either breathed CO2 enriched air or hyperventilated resulting in
either hyper- or hypocapnia (Subsect. 3.7). After each breathing period, a 4-min
rest period followed so that the total measurement time was 20 min. Hypercapnia
increases the CBF elevating the [HbO2] and reducing the [HbR] provided that the
oxygen consumption stays constant. For hypocapnia the opposite happens.
Measurements were carried out on 10 volunteers, one of which was measured twice.
The subjects had two hypercapnia and two hyperventilation measurements in a ran-
dom order. Finally, 43 measurements were used for this study. When appropriate,
the results were analysed using paired (p1) or unpaired (p2) parametric or non-
parametric statistical tests. The ethics committee of Helsinki University Central
Hospital approved the study protocol and all the subjects signed a written consent
before the measurements.
5.3 Data preprocessing and linear regression of calibrated vari-
ables
The raw ln(IAC), φ and ln(IDC) data were calibrated, after which a phase wrap was
removed. Data at different wavelengths and those corresponding different sources
were averaged separately resulting in ∼ 0.47 Hz sampling rate for final signals. The
influence of the small gap below some of the optodes on the φ signals was corrected.
To study the linearity of FD variables, the regression analyses were carried out using

36
data averaged over the first 2-min rest period. The IAC and IDC values were simply
linearized by taking the natural logarithm of them. In tissue or tissue-like materials
the FD measurement variables show nonlinear SDD dependence at SDDs < 20 mm
so that detection channels 1 and 6 were excluded from the analyses [128, 162, 163].
In addition, calibration could not be carried out for detection channels 9 and 10.
As a result, data from detection channels 2 − 5 and 7 − 8 corresponding to SDDs
between 2 and ∼ 5.1 cm were analyzed using linear regressions with least squares.
The differences in the calibrated φ, ln(IAC) and ln(IDC) values between different
wavelengths and different sources were tested. Because generally the values of all
parameters at different SDDs differ significantly, the regression analyses were carried
out separately for data corresponding to different sources and different wavelengths.
For both sources and both wavelengths the coefficients of determination (R2) for
ln(IAC) were on average ∼ 0.99 and for ln(IDC) ∼ 0.97 - 0.98. For the φ data the
R2 values were clearly smaller especially for the non-contact source 2 they were only
∼ 0.76.
5.4 A criterion to detect a low-quality measurement value
Because the calibrated variables tended to behave linearly, an assumption was made
that the values in all technically successful measurements should show a high lin-
earity as a function of SDD. The R2 parameter was chosen to represent the quality
of linearity. A R2 value of 0.95 corresponding to p = 0.001 of the statistical F-test
in a six sample regression analysis was selected to be the threshold.
An empirical criterion was derived to classify the calibrated data as good- and low-
quality values. First, all the measurements with a regression above the threshold
were selected. The mean values and STDs of slopes (bmean,s,l and bSTD,s,l) and y-
intercepts (imean,s,l and iSTD,s,l) of these measurements were determined separately
for each variable in each source (s) and at each wavelength (l). If an individual
value (ys,l) at a certain measurement distance SDD did not lie between the upper
and lower limits,
ys,l(SDD) ≥ (bmean,s,l − bSTD,s,l) · SDD + (imean,s,l − iSTD,s,l) and
ys,l(SDD) ≤ (bmean,s,l + bSTD,s,l) · SDD + (imean,s,l + iSTD,s,l), (5.1)
and it belonged to a set with regression below the threshold, it was classified as a
low-quality value. Otherwise it was classified as a good-quality value.

37
The regression of classified variables
The classification criterion was applied to ln(IAC), ln(IDC), and φ data. All the
ln(IAC) values were assigned to the good-quality class and only 2.6% of ln(IDC)
values were assigned to the low-quality class almost equally from both sources. The
criterion based on ln(IAC) or ln(IDC) data is therefore not able to detect possible
changes in a source-to-tissue coupling. However, 21.8% of the φ values were classified
as low-quality and 83% of them were from source 2. When the regression analyses
were carried out for the φ values corresponding to the good-quality measurements,
all the data sets had R2 > 0.95 and the mean R2 values of both sources at both
wavelengths were ∼ 0.99.
A light leakage caused by a coupling error
If the IAC and IDC data are divided into low- and good-quality classes according
to the classification of φ data, significantly higher (p2 < 0.05) ln(IAC) and ln(IDC)
levels were obtained in 9 out of 12 SD pairs for source 2. This finding indicates that
the low regression φ values are due to a light leak through the surface tissue. The
high sensitivity of regression of φ values to a leak from source to detectors can also
be simulated. If the same ln(IAC) bias is added to all otherwise linear values at
the different SDDs, the regression of φ becomes worse but that of ln(IAC) remains
practically the same.
5.5 The effects on the quality of physiological responses
The results of regression analyses were used to classify the [HbO2] and [HbR] re-
sponses to good- and low-quality classes. The concentration changes were estimated
from the ln(IAC) data using the modified Beer-Lambert law (Eq. 2.2). The DPFs
were derived assuming that the measured φ is directly proportional to the mean
pathlength of photons in tissue [58].
The detector channels 5 and 10 with the longest SDD have the longest partial
pathlength through the brain tissue [164]. Then the cerebral responses should be
most pronounced on those channels [100, 165, 166]. Because the calibrated φ data
were not available for detection channel 10, only detection channel 5 was chosen for
further analyses. All the [HbO2] and [HbR] signals showing clear movement artifacts
were rejected.
The light leak is assumed to take place only in the tissue surface, which does not

38
contribute to the physiological changes induced by breathing exercises. The non-
leaking part of photons should propagate approximately through the same path as
the photons in measurements without a leak. Then in the estimation of [HbO2]
and [HbR] signals in measurements with bad coupling, the actually measured short
DPFs can be replaced with the mean DPFs of measurements without a leak.
Classification of signals
If one or both wavelengths produced a low-quality φ value, that particular SD pair
was classified as low-quality. Differences were tested between measurements which
included only one low-quality SD pair. This made it possible to compare the low-
and good-quality SD pairs of same subject to each other removing the effect of
intersubject variability on the results.
After classification, in each of the 16 partly corrupted measurements, source 1 always
produced a good-quality and source 2 always a low-quality φ value. Because different
sources sample somewhat different spatial regions, all measurements with a good-
quality φ value from both sources were selected for reference purposes.
Parameters calculated from the physiological responses
If a measurement contains a low-quality calibrated φ value, the quality of phys-
iological responses is likely to be affected as well. To test this assumption, four
parameters, contrast, noise level, CNR and area-under-the-curve (AUC) were calcu-
lated from the [HbO2] and [HbR] responses of channel 5 separately for both sources.
From each measurement three contrast, CNR and AUC values were calculated,
because each measurement included three responses. By reversing the sign of the
contrast, CNR and AUC values the hyperventilation parameters were combined with
the hypercapnia parameters. Only the responses having CNR > 1.5 were included
in the analyses. For AUC values, approximately the same number of responses was
included to the analyses as in the case of CNR and contrast. All four noise segments
from each measurement were utilized.
Comparison of parameters between groups
The mean values and STDs of each parameter were calculated using the measure-
ments of good- and low-quality groups and over the source 1 and source 2 groups
separately (see Table 5.1).

39
Table 5.1: Signal features divided into the different groups (good and low / source1 and 2) using the φ classification. The mean values and STDs over all parametersof each group are given. (From Publication VI)
Contrast AUC Noise CNR
[HbO2]good 2.25 ± 1.89 ||, † 0.77 ± 0.53 ||, ‡ 0.65 ± 0.26 ||, ‡ 3.45 ± 2.62 ∗∗
[HbO2]low 1.57 ± 1.55 0.51 ± 0.45 0.55 ± 0.30 2.82 ± 2.27
[HbR]good 1.11 ± 0.46 ||,$ 0.42 ± 0.18 ∗∗, $ 0.35 ± 0.13 ||, † 3.31 ± 1.60 ||, ‡
[HbR]low 0.55 ± 0.49 0.26 ± 0.13 0.30 ± 0.13 1.78 ± 1.73
[HbO2]s1 3.00 ± 1.41 ∗ 0.88 ± 0.45 ∗∗ 0.94 ± 0.25 3.41 ± 1.84 ∗∗
[HbO2]s2 2.67 ± 1.43 0.77 ± 0.50 0.95 ± 0.23 3.03 ± 1.84
[HbR]s1 1.27 ± 0.48 ||, † 0.45 ± 0.14 ||, $ 0.49 ± 0.14 2.98 ± 1.35 ∗∗
[HbR]s2 0.97 ± 0.60 0.31 ± 0.21 0.48 ± 0.14 2.40 ± 1.53
∗p1 < 0.05, ∗∗p1 < 0.01, ||p1 < 0.001
†p2 < 0.05, ‡p2 < 0.01, $p2 < 0.001
The contrasts and AUCs of both [HbO2] and [HbR] signals were significantly higher
in the good-quality than in the low-quality group. The values for these parameters
were also higher in the source 1 than source 2 group. The differences between the
source 1 and source 2 groups are smaller and not as significant as between the low-
and good-quality groups. This means that part of the contrast and AUC differences
between groups are due to the fact that sources 1 and 2 probed spatially different
volumes. However, if source 2 has a bad coupling, the contrast and AUC differences
increase.
Furthermore, the noise level of [HbO2] and [HbR] signals in the low-quality group is
smaller than in the good-quality group, whereas the noise levels are practically the
same in the source 1 and 2 groups. Because the leaking light has a low physiological
noise level, a light leak decreases the noise level. However, the additive leaking noise
component severely decreases the contrast.
The CNRs are clearly higher in the good-quality than in the low-quality group. On
the other hand, the CNRs are only slightly higher in the source 1 group compared to
the source 2 group. Thus if a source has bad coupling, also the CNR of physiological
responses decreases.

40
5.6 The effects on the depth sensitivity
A low-quality φ value is an indication that the light probes the surface tissue more
than it normally should. Therefore, such responses measured at SDDs ≥ 5 cm
should be similar to those measured at SDDs < 2 cm. This assumption was tested
by calculating the Pearson’s correlation coefficients (CC) and standardized mean
squared errors (sMSE) of the [HbO2] or [HbR] signals from detector channels 5 and
1 separately for measurements containing low- and good-quality φ values. The CCs
were significantly higher and sMSEs lower in the low-quality when compared to
the good-quality measurements for both [HbO2] and [HbR] signals. Therefore, the
signal waveforms obtained at different SDDs resemble each other more in low-quality
measurements.
The good- and low-quality responses of channels 5 and 1 were also qualitatively com-
pared (Fig. 5.1 and Fig. 5.2). Before averaging, the baseline values of responses were
(a) (b)
(c) (d)
2
1
0
-1
-2
A.U.
time (s)
0 100 200 300
2
1
0
-1
-2
A.U.
time (s)
0 100 200 300
Figure 5.1: Standardized [HbO2] signals from a) good- and b) low-quality hyper-capnia measurements. Standardized [HbR] signal from c) good- and d) low-qualityhypercapnia measurements. The signals of detector channel 1 are presented witha grey color and the signals of detector channel 5 with a black color. Thin linesrepresent 95% confidential intervals. The period of breathing exercise is indicatedwith a light grey color (A.U. = arbitrary units). (From Publication VI)
shifted to zero and the responses were divided by their STDs to standardize their
waveform variations. The [HbO2] and [HbR] responses were averaged separately
from all good- and low-quality hypercapnia and hyperventilation measurements.

41
(a) (b)
(c) (d)
2
1
0
-1
-2A.U.
time (s)
0 100 200 300
2
1
0
-1
-2
A.U.
time (s)
0 100 200 300
Figure 5.2: Standardized [HbO2] signals from a) good- and b) low-quality hy-perventilation measurements. Standardized [HbR] signals from c) good- and d)low-quality hyperventilation measurements. The signals of detector channel 1 arepresented with a grey color and the signals of detector channel 5 with a black color.Thin lines represent 95% confidential intervals. The period of breathing exercise isindicated with a light grey color (A.U. = arbitrary units). (From Publication VI)
During hypercapnia, good-quality measurements at SDD ∼ 5 cm showed evident
increase in [HbO2] signals. At SDD ∼ 1 cm the effect is not so clear. In addition, a
clear decrease in the [HbR] signals in good-quality measurements is seen at SDD ∼ 5
cm whereas at SDD ∼ 1 cm no changes are observed. In contrast, in the low-quality
φ measurements the responses at both SDDs are rather difficult to distinguish from
the background noise without the prior information on breathing periods. During
hyperventilation, similar but even more evident differences between the responses
of good- and low-quality φ measurements are obtained.
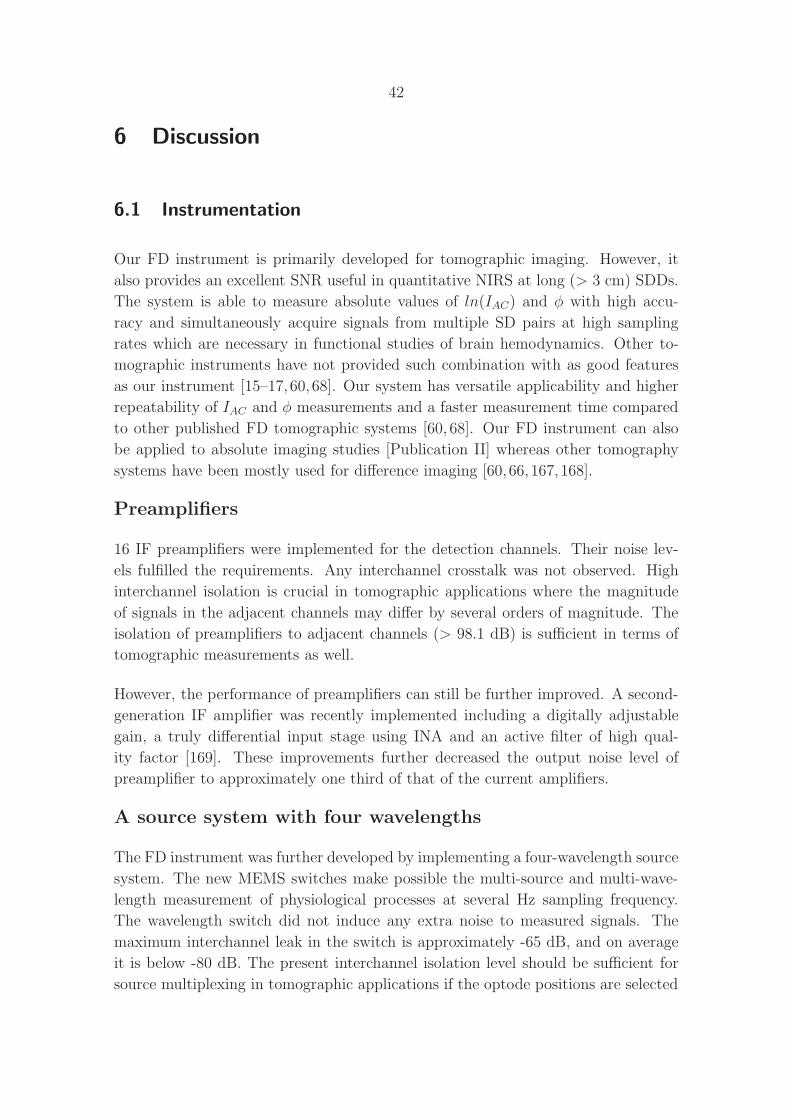
42
6 Discussion
6.1 Instrumentation
Our FD instrument is primarily developed for tomographic imaging. However, it
also provides an excellent SNR useful in quantitative NIRS at long (> 3 cm) SDDs.
The system is able to measure absolute values of ln(IAC) and φ with high accu-
racy and simultaneously acquire signals from multiple SD pairs at high sampling
rates which are necessary in functional studies of brain hemodynamics. Other to-
mographic instruments have not provided such combination with as good features
as our instrument [15–17,60, 68]. Our system has versatile applicability and higher
repeatability of IAC and φ measurements and a faster measurement time compared
to other published FD tomographic systems [60, 68]. Our FD instrument can also
be applied to absolute imaging studies [Publication II] whereas other tomography
systems have been mostly used for difference imaging [60, 66, 167, 168].
Preamplifiers
16 IF preamplifiers were implemented for the detection channels. Their noise lev-
els fulfilled the requirements. Any interchannel crosstalk was not observed. High
interchannel isolation is crucial in tomographic applications where the magnitude
of signals in the adjacent channels may differ by several orders of magnitude. The
isolation of preamplifiers to adjacent channels (> 98.1 dB) is sufficient in terms of
tomographic measurements as well.
However, the performance of preamplifiers can still be further improved. A second-
generation IF amplifier was recently implemented including a digitally adjustable
gain, a truly differential input stage using INA and an active filter of high qual-
ity factor [169]. These improvements further decreased the output noise level of
preamplifier to approximately one third of that of the current amplifiers.
A source system with four wavelengths
The FD instrument was further developed by implementing a four-wavelength source
system. The new MEMS switches make possible the multi-source and multi-wave-
length measurement of physiological processes at several Hz sampling frequency.
The wavelength switch did not induce any extra noise to measured signals. The
maximum interchannel leak in the switch is approximately -65 dB, and on average
it is below -80 dB. The present interchannel isolation level should be sufficient for
source multiplexing in tomographic applications if the optode positions are selected

43
in such a way that the crosstalk would be minimized. Also a custom-made MEMS
switch possessing the required isolation across all channels might be possible to
implement.
The performance of the temperature stabilizers was tested at room temperature.
Temperature variations in the stabilized laser housings were ∼ 0.1-0.3 mK, which
ensures sufficient stability for the FD instrument. In addition, the new circuit has
several electrical and mechanical improvements over previous one.
Optode terminals for multimodal measurements
The detector and source fibers with prism terminals have proven their usefulness
in several applications. They enable the attachment of optodes to the forehead of
the subject in the supine position. They seem to be also less sensitive to motion
artifacts than our cylindrical terminals. The prism terminals were successfully used
in the sleep study [170]. The terminals have also made it possible to implement a
bilateral TMS-EEG − NIRS measurement series [171].
6.2 Brain measurements
Hyperventilation and breath-holding studies
The IAC signals were shown to have larger contrasts and lower noise than the φ
signals. The CNR of the IAC signals also increased with increasing SDD. The noise
in these signals was mainly due to the relatively large measurement bandwidth which
could be straightforwardly reduced by low-pass filtering. Physiological changes and
changes in measurement conditions limit the comparability of results at different
wavelengths. In future measurements at different wavelengths should be carried out
simultaneously.
Because a breath-holding exercise is a practical way to produce a large contrast in
NIRS signals, it has also been used to study, e.g., changes in cerebral hemodynamics
caused by ageing and by migraine [172, 173]. The hemodynamic changes caused by
breath holding and the reproducibility of these responses have also been studied
recently using fMRI [174].
The pulsating oscillations of optical signals have been utilized in a cerebral reflection
pulse-oximeter and for the estimation of the pulsatile component of CBF and CBV
[101, 175]. The SaO2 parameter is also needed for modeling the CMRO2 based on
NIRS data [176]. The frequency range of VLFO reported here is slightly lower
than those reported by other groups [117, 119,177,178]. These VLFOs may help in

44
the separation of NIRS signals originating from arterial and venous compartments
of blood circulation. Suppression of such VLFOs improves the CNR in optical
activation studies [119]. The temporal information of the oscillations might also be
helpful in tomographic modeling [179,180].
Similar hemodynamic oscillations, often known as the Mayer waves, can also be
detected with other techniques such as blood-pressure, heart-rate variability and
ultrasound measurements [118, 181, 182]. Multimodal setups may be helpful in in-
terpreting the oscillations of optical signals and revealing their physiological ori-
gin [183].
Natural sleep studies
NIRS provides a novel method to study sleep and its disorders such as sleep apnea
[96–98, 170, 184, 185]. In this study, changes in [HbO2] and [HbR] were detected
during the falling asleep and awakening periods in both single- and dual-wavelength
measurements. These changes occurred, however, synchronously with changes in
HR and SaO2. These reference parameters have not been utilized before in data
interpretation of other NIRS studies of natural sleep [96–98]. In future it would
be therefore important to study whether NIRS can measure local cerebral changes
which are not coupled with changes in systemic circulation. The multimodal setup
of this study, including an ECG and a pulse oximeter, provides an excellent starting
point for such studies. Recently a similar setup at the BioMag laboratory has been
employed in two over-night natural sleep series [170, 186].
We detected decreases in [HbO2] and increases in [HbR] during transitions from
awake state to sleep and opposite changes during awakenings. Somewhat contradic-
tory NIRS results have been reported by other groups [96–98]. In [98] no significant
[HbO2] or [HbR] changes were detected in the frontal lobe during the transitions
from S1 to S2 or from S2 to S1. In [97] parallel changes in [HbO2] and [HbR] were
recorded during these transitions. Our results resemble most closely the results
reported in [96].
Coupling of visual NIRS and EEG responses with a baselineblood flow
The neurovascular coupling has been an intensive topic of research during the last
decade [21, 34]. A new technique was presented for the simultaneous measurement
of VEPs and hemodynamic responses using whole-head EEG and multi-channel
NIRS during normo-, hypo-, and hypercapnia. In other integrated NIRS and EEG
measurements, just a single or a few EEG electrodes and lower number of optodes
have been used [132–139,187]. Before this study, the visual stimulation was used only

45
in one concomitant study [133] whereas afterwards several studies have employed
a visual stimulus [136–139]. In a couple of studies, NIRS responses have also been
recorded simultaneously with MEG [188, 189]. With a whole head EEG or MEG
and multi-channel NIRS, the localization of responses with the highest contrast is
possible. A similar setup has been recently used to study the linearity between the
hemodynamic responses and VEPs to different stimulus lengths from 3 to 12 s [140].
The implemented NIRS-EEG helmet is also TMS compatible so that combined
TMS-EEG − NIRS measurements are possible [171].
In our study, the effects of hypo- and hypercapnia on the hemodynamic responses
were investigated with NIRS for the first time. Previous hypo- and hypercapnia
NIRS studies have measured only the baseline changes in [HbO2] and [HbR] [100,165,
190, 191]. Hypo- and hypercapnia were shown to generate consistent latency shifts
in visually evoked hemodynamic responses. Similar delays in BOLD responses have
been observed using fMRI [192]. The measurement setup of this study provides an
excellent starting point for further investigations of the unknown physiological origin
of these delays. During hypo- and hypercapnia the observed amplitude changes
of hemodynamic responses were not consistent and they may even be caused by
the combined effect of latency changes and data averaging. The changes in the
peak amplitude and in the contrast of hemodynamic responses caused by hypo- and
hypercapnia have also been previously studied using fMRI [193].
The latency of VEP-P100 consistently decreased during hypocapnia. In previous
studies, a reduction [194, 195] as well as an increase of latency of VEP-P100 [196]
caused by hyperventilation have been reported. Furthermore, in some of our hy-
perventilation measurements, the increase of VEP-P100 amplitude was detected.
This effect cannot be explained by averaging of VEPs with different latencies. Also
during hypercapnia decreases in latencies and increases in VEP-P100 amplitudes
were observed but not consistently. The reason for these inconsistencies may be the
relatively small number of measurements.
Circulatory effects of inhaled iloprost and iNO on pretermlambs
The functional cerebral studies on newborn infants are one of the most attractive
brain measurement applications of NIRS [76, 78, 79, 88, 197]. Their popularity is
based especially on the safety of NIRS techniques.
In this work the beneficial effects of inhaled iloprost and iNO on the pulmonary and
systemic circulation of newborn lamb were studied using a multimodal monitoring
setup including a NIRS instrument. No significant differences were observed be-
tween the medicated study group and the control group in pulmonary or systemic
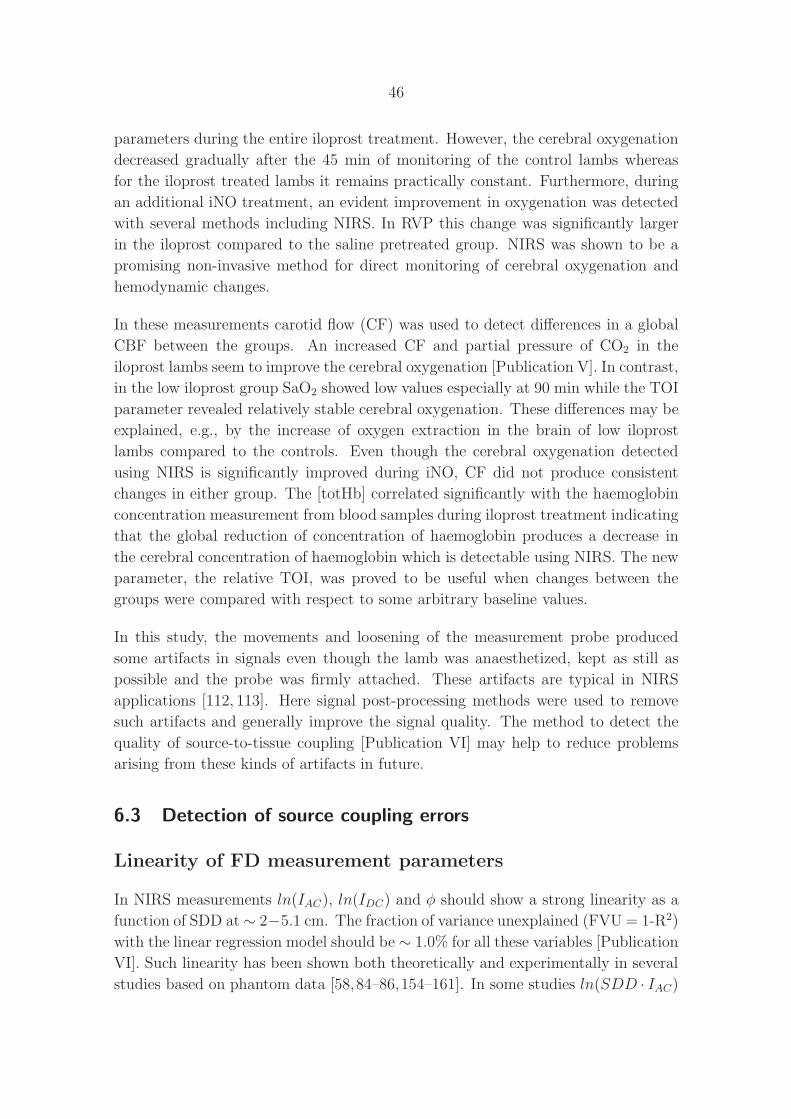
46
parameters during the entire iloprost treatment. However, the cerebral oxygenation
decreased gradually after the 45 min of monitoring of the control lambs whereas
for the iloprost treated lambs it remains practically constant. Furthermore, during
an additional iNO treatment, an evident improvement in oxygenation was detected
with several methods including NIRS. In RVP this change was significantly larger
in the iloprost compared to the saline pretreated group. NIRS was shown to be a
promising non-invasive method for direct monitoring of cerebral oxygenation and
hemodynamic changes.
In these measurements carotid flow (CF) was used to detect differences in a global
CBF between the groups. An increased CF and partial pressure of CO2 in the
iloprost lambs seem to improve the cerebral oxygenation [Publication V]. In contrast,
in the low iloprost group SaO2 showed low values especially at 90 min while the TOI
parameter revealed relatively stable cerebral oxygenation. These differences may be
explained, e.g., by the increase of oxygen extraction in the brain of low iloprost
lambs compared to the controls. Even though the cerebral oxygenation detected
using NIRS is significantly improved during iNO, CF did not produce consistent
changes in either group. The [totHb] correlated significantly with the haemoglobin
concentration measurement from blood samples during iloprost treatment indicating
that the global reduction of concentration of haemoglobin produces a decrease in
the cerebral concentration of haemoglobin which is detectable using NIRS. The new
parameter, the relative TOI, was proved to be useful when changes between the
groups were compared with respect to some arbitrary baseline values.
In this study, the movements and loosening of the measurement probe produced
some artifacts in signals even though the lamb was anaesthetized, kept as still as
possible and the probe was firmly attached. These artifacts are typical in NIRS
applications [112, 113]. Here signal post-processing methods were used to remove
such artifacts and generally improve the signal quality. The method to detect the
quality of source-to-tissue coupling [Publication VI] may help to reduce problems
arising from these kinds of artifacts in future.
6.3 Detection of source coupling errors
Linearity of FD measurement parameters
In NIRS measurements ln(IAC), ln(IDC) and φ should show a strong linearity as a
function of SDD at ∼ 2−5.1 cm. The fraction of variance unexplained (FVU = 1-R2)
with the linear regression model should be ∼ 1.0% for all these variables [Publication
VI]. Such linearity has been shown both theoretically and experimentally in several
studies based on phantom data [58,84–86,154–161]. In some studies ln(SDD · IAC)

47
and ln(SDD · IDC) rather than ln(IAC) and ln(IDC) have been shown to have linear
SDD dependence [84–86, 157, 160, 161]. Our data shows that the linearity degrades
from R2 = 0.992±0.007 to R2 = 0.990±0.008 when a regression is calculated using
ln(SDD · IAC) instead of ln(IAC) data [Publication VI].
In human studies, relatively constant DPF values have been measured on the fore-
head at SDDs > 2.5 cm [128]. The linear behaviour of mean pathlength at SDDs >
2 cm [92], as well as ln(IAC) and φ data [198] on the human forehead has also been
shown qualitatively.
Sensitivity of measurement parameters to coupling errors
If a source terminal has a loose contact to tissue, the regression of φ values can
clearly decrease. However, regressions of the ln(IAC) and ln(IDC) data are not as
sensitive to the source coupling errors as the regression of φ values. Previously the
slope of φ data has been shown to change more than the slope of ln(IAC) data if a
clear layer representing cerebrospinal fluid (CSF) is immersed close to the surface
of otherwise homogeneous phantom [158]. Monte-Carlo simulations show that if the
scattering coefficient of CSF is changed, large differences in pathlength values can
be observed in a multilayer head model [92]. In a recent study, the unrealistically
short DPFs (< 2) measured on the human forehead at SDD = 5.7 cm were reported
referring to errors between optodes and tissue [198].
In this study all the optode terminals were carefully attached on the forehead and
a bad source coupling was discovered only during data postprocessing. However,
53% of φ measurements of source 2 and 14% of source 1 provided a low-regression
at both wavelengths at SDDs ≥ 5 cm. Furthermore, the φ values were relatively
constant throughout a single study session.
A classification criterion
A bad coupling between an optode and tissue can be detected using the criterion
introduced. Nonlinearity of FD variables have also been used to reject data in the
infant head measurements [88]. However, they used the same threshold (R2 < 0.97)
for all the optical raw data and did not report any differences between the linearity
of φ and ln(IAC) or ln(IDC) data.
Because the variations of slope values in the regression analyses of φ data were
rather small, the φ limits could be converted to nearly constant DPF limits. Thus a
simpler criterion could be derived to detect the coupling using the DPF values only.
This could open up the possibility to monitor the source coupling also with simpler
instrumentation than used in our study [199].

48
6.4 Closing remarks
The development of an accurate FD imaging device requires careful design and
implementation. Special emphasis should be placed on the development and testing
of instruments before transitions to large clinical trials. The applied studies in the
future will assess whether our FD instrument will facilitate the development of new
clinically useful NIRS applications.
The brain studies of this work showed the potential of the developed instrumentation
and the applied methods to reveal physiologically interesting information about the
human brain not detectable using other modalities. The hemodynamic oscillations
observed open up new ways to investigate novel physiological processes in tissue and
to develop parameters especially for long-term monitoring. When the hemodynamic
and oxygenation changes can be detected reproducibly, reliably and in a user-friendly
way from the human brain using NIRS techniques, they will provide considerable
clinical benefits especially in infant studies and in the monitoring studies in operation
rooms and critical care units.
In this work, NIRS was used mostly as an independent method within the multi-
modal measurement setups. In the future, the signals from different modalities will
probably be integrated using digital signal processing methods and new parameters
will be developed based on the data of several modalities. This development may
reveal new clinically useful information about complex physiological processes such
as from the neurovascular coupling. The reliability and repeatability of individual
measurement techniques can also be improved by utilizing multimodal approaches.
The developed method to detect problems in source-to-tissue coupling may prove
to be very useful in future studies. It may prevent the acquisition of unreliable
signals and improve the repeatability and usability of forehead NIRS measurements
in general.
49
References
[1] F. F. Jobsis. Noninvasive, infrared monitoring of cerebral and myocardial oxy-
gen sufficiency and circulatory parameters. Science 198:1264-1267, 1977.
[2] M. Cope. The development of a near infrared spectroscopy system and its ap-
plication for non invasive monitoring of cerebral blood and tissue oxygenation
in the newborn infant. PhD thesis, University of London, 1991.
[3] Y. Hoshi and M. Tamura. Detection of dynamic changes in cerebral oxy-
genation coupled to neuronal function during mental work in man. Neu-
rosci. Lett. 155:5-8, 1993.
[4] S. Fantini, M. A. Franceschini, J. S. Maier, S. A. Walker, B. Barbieri, and
E. Gratton. Frequency-domain multichannel optical detector for noninvasive
tissue spectroscopy and oximetry. Opt. Eng. 34:32-42, 1995.
[5] H. Owen-Reece, C. E. Elwell, J. S. Wyatt, and D. T. Delpy. The effect of
scalp ischaemia on measurement of cerebral blood volume by near-infrared
spectroscopy. Physiol. Meas. 17:279-286, 1996.
[6] M. Wolf, M. Ferrari, and V. Quaresima. Progress of near-infrared spec-
troscopy and topography for brain and muscle clinical applications.
J. Biomed. Opt. 12:062104, 2007.
[7] N. Nagdyman, P. Ewert, B. Peters, O. Miera, T. Fleck, and F. Berger. Com-
parison of different near-infrared spectroscopic cerebral oxygenation indices
with central venous and jugular venous oxygenation saturation in children.
Paediatr. Anaesth. 18:160-166, 2008.
[8] P. G. Al-Rawi and P. J. Kirkpatrick. Tissue oxygen index: thresholds for
cerebral ischemia using near-infrared spectroscopy. Stroke 37:2720-2725, 2006.
[9] P. B. Benni, B. Chen, F. D. Dykes, S. F. Wagoner, M. Heard, A. J. Tanner,
T. L. Young, K. Rais-Bahrami, O. Rivera, and B. L. Short. Validation of the
CAS neonatal NIRS system by monitoring vv-ECMO patients: preliminary
results. Adv. Exp. Med. Biol. 566:195-201, 2005.
[10] S. E. Nicklin, I. A.-A. Hassan, Y. A. Wickramasinghe, and S. A. Spencer. The
light still shines, but not that brightly? The current status of perinatal near
infrared spectroscopy. Arch. Dis. Child. Fetal Neonatal. Ed. 88:F263-F268,
2003.

50
[11] G. Greisen. Is near-infrared spectroscopy living up to its promises? Semin. Fe-
tal Neonatal. Med. 11:498-502, 2006.
[12] F. van Bel, P. Lemmers, and G. Naulaers. Monitoring neonatal regional cere-
bral oxygen saturation in clinical practice: value and pitfalls. Neonatology
94:237-244, 2008.
[13] D. T. Delpy and M. Cope. Quantification in tissue near-infrared spectroscopy.
Phil. Trans. R. Soc. Lond. B 352:649-659, 1997.
[14] Y. Hoshi and M. Tamura. Dynamic multichannel near-infrared optical imaging
of human brain activity. J. Appl. Physiol. 75:1842-1846, 1993.
[15] H. Eda, I. Oda, Y. Ito, Y. Wada, Y. Oikawa, Y. Tsunazawa, M. Takada,
Y. Tsuchiya, Y. Yamashita, M. Oda, A. Sassaroli, Y. Yamada, and M. Tamura.
Multichannel time-resolved optical tomographic imaging system. Rev. Sci. In-
strum. 70:3595-3602, 1999.
[16] F. E. W. Schmidt, M. E. Fry, E. M. C. Hillman, J. C. Hebden, and D. T. Delpy.
A 32-channel time-resolved instrument for medical optical tomography. Rev.
Sci. Instrum. 71:256-265, 2000.
[17] C. H. Schmitz, M. Locker, J. M. Lasker, A. H. Hielscher, and R. L. Bar-
bour. Instrumentation for fast functional optical tomography. Rev. Sci. In-
strum. 73:429-439, 2002.
[18] W. L. Wright. Multimodal monitoring in the ICU: when could it be useful?
J. Neurol. Sci. 261:10-15, 2007.
[19] K. E. Wartenberg, J. M. Schmidt, and S. A. Mayer. Multimodality monitoring
in neurocritical care. Crit. Care Clin. 23:507-538, 2007.
[20] M. Moseley and G. Donnan. Multimodality imaging. Stroke 35:2632-2634,
2004.
[21] H. Shibasaki. Human brain mapping: hemodynamic response and electrophys-
iology. Clin. Neurophysiol. 119:731-743, 2008.
[22] D. W. Townsend. Multimodality imaging of structure and function. Phys. Med.
Biol. 53:R1-R39, 2008.
[23] E. Niedermeyer and F. L. da Silva. Electroencephalography: basic principles,
clinical applications, and related fields. 4th ed., Williams & Wilkins, Balti-
more, 1999.

51
[24] J. S. Wyatt, D. T. Delpy, M. Cope, S. Wray, and E. O. R. Reynolds. Quan-
tification of cerebral oxygenation and haemodynamics in sick newborn infants
by near infrared spectrophotometry. Lancet 2:1063-1066, 1986.
[25] C. E. Elwell. A practical users guide to near infrared spectroscopy. UCL Re-
prographics, London, 1995.
[26] C. E. Cooper and R. Springett. Measurement of cytochrome oxidase and mito-
chondrial energetics by near-infrared spectroscopy. Phil. Trans. R. Soc. Lon-
don Ser. B 352:669-677, 1997.
[27] H. R. Heekeren, M. Kohl, H. Obrig, R. Wenzel, W. von Pannwitz,
S. J. Matcher, U. Dirnagl, C. E. Cooper, and A. Villringer. Noninvasive assess-
ment of changes in cytochrome-c oxidase oxidation in human subjects during
visual stimulation. J. Cereb. Blood Flow Metab. 19:592-603, 1999.
[28] M. Kiguchi, N. Ichikawa, H. Atsumori, F. Kawaguchi, H. Sato, A. Maki,
and H. Koizumi. Comparison of light intensity on the brain surface
due to laser exposure during optical topography and solar irradiation.
J. Biomed. Opt. 12:062108, 2007.
[29] A. Villringer and B. Chance. Non-invasive optical spectroscopy and imaging
of human brain function. Trends Neurosci. 20:435-442, 1997.
[30] D. M. Rector, R. F. Rogers, J. S. Schwaber, R. M. Harper, and J. S. George.
Scattered-light imaging in vivo tracks fast and slow processes of neurophysio-
logical activation. NeuroImage 14:977-994, 2001.
[31] E. M. C. Hillman, J. C. Hebden, M. Schweiger, H. Dehghani, F. E. W. Schmidt,
D. T. Delpy, and S. R. Arridge. Time resolved optical tomography of the
human forearm. Phys. Med. Biol. 46:1117-1130, 2001.
[32] T. Austin, A. P. Gibson, G. Branco, R. Yusof, S. R. Arridge, J. H. Meek,
J. S. Wyatt, D. T. Delpy, and J. C. Hebden. Three-dimensional optical imaging
of blood volume and oxygenation in the preterm brain. NeuroImage 31:1426-
1433, 2006.
[33] P. J. Magistretti, L. Pellerin, D. L. Rothman, and R. G. Shulman. Energy on
demand. Science 283:496-497, 1999.
[34] A. Villringer and U. Dirnagl. Coupling of brain activity and cerebral blood
flow: basis of functional neuroimaging. Cerebrovasc. Brain Metab. Rev. 7:240-
276, 1995.

52
[35] A. Maiorana, G. O’Driscoll, R. Taylor, and D. Green. Exercise and the nitric
oxide vasodilator system. Sports Med. 33:1013-1035, 2003.
[36] M. D. Delp and D. S. O’Leary. Integrative control of the skeletal mus-
cle microcirculation in the maintenance of arterial pressure during exercise.
J. Appl. Physiol. 97:1112-1118, 2004.
[37] A. Villringer, J. Planck, C. Hock, L. Schleinkofer, and U. Dirnagl. Near in-
frared spectroscopy (NIRS): a new tool to study hemodynamic changes dur-
ing activation of brain function in human adults. Neurosci. Lett. 154:101-104,
1993.
[38] T. J. Huppert, R. D. Hoge, S. G. Diamond, M. A. Franceschini, and
D. A. Boas. A temporal comparison of BOLD, ASL, and NIRS hemodynamic
responses to motor stimuli in adult humans. NeuroImage 29:368-382, 2006.
[39] S. Ogawa, D. W. Tank, R. Menon, J. M. Ellermann, S. G. Kim,
H. Merkle, and K. Ugurbil. Intrinsic signal changes accompanying sensory
stimulation: functional brain mapping with magnetic resonance imaging.
Proc. Natl. Acad. Sci. USA 89:5951-5955, 1992.
[40] B. R. Rosen, R. L. Buckner, and A. M. Dale. Event-related functional MRI:
past, present, and future. Proc. Natl. Acad. Sci. USA 95:773-780, 1998.
[41] P. Fransson, G. Kruger, K. D. Merboldt, and J. Frahm. MRI of functional
deactivation: temporal and spatial characteristics of oxygenation-sensitive re-
sponses in human visual cortex. NeuroImage 9:611-618, 1999.
[42] F. Kruggel and D. Y. von Cramon. Temporal properties of the hemodynamic
response in functional MRI. Hum. Brain Mapp. 8:259-271, 1999.
[43] H. M. Watzman, C. D. Kurth, L. M. Montenegro, J. Rome, J. M. Steven, and
S. C. Nicolson. Arterial and venous contributions to near-infrared cerebral
oximetry. Anesthesiology 93:947-953, 2000.
[44] E. M. Hillman, A. Devor, M. B. Bouchard, A. K. Dunn, G. W. Krauss,
J. Skoch, B. J. Bacskai, A. M. Dale, and D. A. Boas. Depth-resolved optical
imaging and microscopy of vascular compartment dynamics during somatosen-
sory stimulation. NeuroImage 35:89-104, 2007.
[45] A. Villringer. Functional neuroimaging: optical approach,
Adv. Exp. Med. Biol. 413:1-18, 1997.
[46] R. L. J. Grubb, M. E. Raichle, J. O. Eichling, and M. M. Ter-Pogossian. The
effects of changes in PaCO2 on cerebral blood volume, blood flow, and vascular
mean transit time. Stroke 5:630-639, 1974.

53
[47] M. J. Donahue, J. U. Blicher, L. Ostergaard, D. A. Feinberg, B. J. Macin-
tosh, K. L. Miller, M. Gunther, and P. Jezzard. Cerebral blood flow, blood
volume, and oxygen metabolism dynamics in human visual and motor cor-
tex as measured by whole-brain multi-modal magnetic resonance imaging.
J. Cereb. Blood Flow Metab. 29:1856-1866, 2009.
[48] M. A. Franceschini, D. K. Joseph, T. J. Huppert, S. G. Dia-
mond and D. A. Boas. Diffuse optical imaging of the whole head.
J. Biomed. Opt. 11:054007, 2006.
[49] M. Ferrari, I. Giannini, G. Sideri, and E. Zanette. Continuous non invasive
monitoring of human brain by near infrared spectroscopy. Adv. Exp. Med.
Biol. 191:873-882, 1985.
[50] S. J. Matcher, P. Kirkpatrick, K. Nahid, M. Cope, and D. T. Delpy. Abso-
lute quantification methods in tissue near infrared spectroscopy. Proc. SPIE
2389:486-495, 1995.
[51] D. T. Delpy, M. Cope, P. van der Zee, S. Arridge, S. Wray, and J. Wy-
att. Estimation of optical pathlength through tissue from direct time of flight
measurement. Phys. Med. Biol. 33:1433-1442, 1988.
[52] B. Chance, J. S. Leigh, H. Miyake, D. S. Smith, S. Nioka, R. Greenfeld,
M. Finander, K. Kaufmann, W. Levy, M. Young, P. Cohen, H. Yoshioka, and
R. Boretsky. Comparison of time resolved and unresolved measurements of
deoxyhemoglobin in brain. Proc. Natn. Acad. Sci. USA 85:4971-4975, 1988.
[53] M. Schweiger and S. R. Arridge. Application of temporal filters to time re-
solved data in optical tomography. Phys. Med. Biol. 44:1699-1717, 1999.
[54] D. Grosenick, H. Wabnitz, H. H. Rinneberg, K. T. Moesta, and P. M. Schlag.
Development of a time-domain optical mammograph and first in vivo appli-
cations. Appl. Opt. 38:2927-2943, 1999.
[55] J. Selb, D. K. Joseph, and D. A. Boas. Time-gated optical system for depth-
resolved functional brain imaging. J. Biomed. Opt. 11:044008, 2006.
[56] J. R. Lakowicz and K. W. Berndt. Frequency domain measurement of photon
migration in tissues. Chem. Phys. Lett. 166:246-252, 1990.
[57] B. Chance, M. Cope, E. Gratton, N. Ramanujam, and B. Tromberg. Phase
measurement of light absorption and scatter in human tissue. Rev. Sci. In-
strum. 69:3457-3481, 1998.
54
[58] S. R. Arridge, M. Cope, and D. T. Delpy. The theoretical basis for the de-
termination of optical pathlengths in tissue: temporal and frequency analysis.
Phys. Med. Biol. 37:1531-1560, 1992.
[59] T. H. Pham, O. Coquoz, J. B. Fishkin, E. Anderson, and B. J. Tromberg.
Broad bandwidth frequency domain instrument for quantitative tissue optical
spectroscopy. Rev. Sci. Instrum. 71:2500-2513, 2000.
[60] G. Gulsen, B. Xiong, O. Birgul, and O. Nalcioglu. Design and implemen-
tation of a multifrequency near-infrared diffuse optical tomography system.
J. Biomed. Opt. 11:014020, 2006.
[61] S. R. Arridge and W. R. B. Lionheart. Non-uniqueness in diffusion-based op-
tical tomography. Opt. Lett. 23:882-884, 1998.
[62] V. Ntziachristos, B. Chance, and A. G. Yodh. Differential diffuse optical to-
mography. Opt. Express 5:230-242, 1999.
[63] E. M. C. Hillman, J. C. Hebden, F. E. W. Schmidt, S. R. Arridge,
M. Schweiger, H. Dehghani, and D. T. Delpy. Calibration techniques and
datatype extraction for time-resolved optical tomography. Rev. Sci. In-
strum. 71:3415-3427, 2000.
[64] C. H. Schmitz, H. L. Graber, H. Luo, I. Arif, J. Hira, Y. Pei, A. Bluestone,
S. Zhong, R. Andronica, I. Soller, N. Ramirez, S.-L. S. Barbour, and R. L. Bar-
bour. Instrumentation and calibration protocol for imaging dynamic features
in dense-scattering media by optical tomography. Appl. Opt. 39:6466-6486,
2000.
[65] J. C. Hebden, A. Gibson, R. Yusof, N. Everdell, E. M. C. Hillman, D. T. Delpy,
S. R. Arridge, T. Austin, J. H. Meek, and J. S. Wyatt. Three-dimensional
optical tomography of the premature infant brain. Phys. Med. Biol. 47:4155-
4166, 2002.
[66] T. O. McBride, B. W. Pogue, U. L. Osterberg, and K. D. Paulsen. Strate-
gies for absolute calibration of near infrared tomographic tissue imaging.
Adv. Exp. Med. Biol. 530:85-99, 2003.
[67] T. Tarvainen, V. Kolehmainen, M. Vauhkonen, A. Vanne, J. P. Kaipio,
A. P. Gibson, S. R. Arridge, and M. Schweiger. Computational calibration
method for optical tomography. Appl. Opt. 44:1879-1888, 2005.
[68] T. O. McBride, B. W. Pogue, S. Jiang, U. L. Osterberg, and K. D. Paulsen.
A parallel-detection frequency-domain near-infrared tomography system for

55
hemoglobin imaging of the breast in vivo. Rev. Sci. Instrum. 72:1817-1824,
2001.
[69] K.-S. No, R. Kwong, P. H. Chou, and A. Cerussi. Design and testing
of a miniature broadband frequency domain photon migration instrument.
J. Biomed. Opt. 13:2008.
[70] U. J. Netz, J. Beuthan, and A. H. Hielscher. Multipixel system for gi-
gahertz frequency-domain optical imaging of finger joints. Rev. Sci. In-
strum. 79:034301, 2008.
[71] Y. Yang, H. Liu, X. Li, and B. Chance. Low-cost frequency-domain pho-
ton migration instrument for tissue spectroscopy, oximetry, and imaging.
Opt. Eng. 36:1562-1569, 1997.
[72] N. Ramanujam, C. Du, H. Y. Ma, and B. Chance. Sources of phase noise in
homodyne and heterodyne phase modulation devices used for tissue oximetry
studies. Rev. Sci. Instrum. 69:3042-3054, 1998.
[73] A. Duncan, J. H. Meek, M. Clemence, C. E. Elwell, L. Tyszchuk, M. Cope,
and D. T. Delpy. Optical pathlength measurements on adult head, calf, and
forearm and the head of the newborn infant using phase resolved optical spec-
troscopy. Phys. Med. Biol. 40:295-304, 1995.
[74] I. Nissila, K. Kotilahti, K. Fallstrom, and T. Katila. Instrumentation for
the accurate measurement of phase and amplitude in optical tomography.
Rev. Sci. Instrum. 73:3306-3312, 2002.
[75] I. Nissila, J. C. Hebden, D. Jennions, J. Heino, M. Schweiger, K. Kotilahti,
T. Noponen, A. Gibson, S. Jarvenpaa, L. Lipiainen, and T. Katila. A com-
parison between a time-domain and a frequency-domain system for optical
tomography. J. Biomed. Opt. 11:064015, 2006.
[76] K. Kotilahti, I. Nissila, M. Huotilainen, R. Makela, N. Gavrielides, T. No-
ponen, P. Bjorkman, V. Fellman, and T. Katila. Bilateral hemodynamic re-
sponses to auditory stimulation in newborn infants. Neuroreport 16:1373-1377,
2005.
[77] H. Radhakrishnan, W. Vanduffel, H. P. Deng, L. Ekstrom, D. A. Boas, and
M. A. Franceschini. Fast optical signal not detected in awake behaving mon-
keys. NeuroImage 45:410-419, 2009.
[78] N. Roche-Labarbe, S. A. Carp, A. Surova, M. Patel, D. A. Boas, P. E. Grant,
and M. A. Franceschini. Noninvasive optical measures of CBV, StO(2), CBF

56
index, and rCMRO(2) in human premature neonates’ brains in the first six
weeks of life. Hum. Brain Mapp., 2009. (In press)
[79] K. Kotilahti, I. Nissila, T. Nasi, L. Lipiainen, T. Noponen, P. Merilainen,
M. Huotilainen, and V. Fellman. Hemodynamic responses to speech and music
in newborn infants. Hum. Brain Mapp., 2009. (In press)
[80] S. J. Matcher, C. E. Elwell, C. E. Cooper, M. Cope, and D. T. Delpy. Per-
formance comparison of several published tissue near-infrared spectroscopy
algorithms. Anal. Biochem. 227:54-68, 1995.
[81] A. Sassaroli and S. Fantini. Comment on the modified Beer-Lambert law for
scattering media. Phys. Med. Biol. 49:N255-N257, 2004.
[82] G. Strangman, M. A. Franceschini, and D. A. Boas. Factors affecting the accu-
racy of near-infrared spectroscopy concentration calculations for focal changes
in oxygenation parameters. NeuroImage 18:865-879, 2003.
[83] M. S. Patterson, B. Chance, and B. C. Wilson. Time resolved reflectance and
transmittance for the non-invasive measurement of tissue optical properties.
Appl. Opt. 28:2331-2336, 1989.
[84] J. B. Fishkin and E. Gratton. Propagation of photon-density waves in strongly
scattering media containing an absorbing semi-infinite plane bounded by a
straight edge. J. Opt. Soc. Am. A 10:127-140, 1993.
[85] S. Fantini, M. A. Franceschini, J. B. Fishkin, B. Barbieri, and E. Grat-
ton. Quantitative determination of the absorption spectra of chromophores
in strongly scattering media: a light-emitting-diode based technique.
Appl. Opt. 33:5204-5213, 1994.
[86] S. Fantini, M. A. Franceschini, and E. Gratton. Semi- infinite-geometry bound-
ary problem for light migration in highly scattering media: a frequency-domain
study in the diffusion approximation. J. Opt. Soc. Am. B 11:2128-2138, 1994.
[87] H. Liu, D. A. Boas, Y. Zhang, A. G. Yodh, and B. Chance. Determination of
optical properties and blood oxygenation in tissue using continuous NIR light.
Phys. Med. Biol. 40:1983-1993, 1995.
[88] M. A. Franceschini, S. Thaker, G. Themelis, K. K. Krishnamoorthy, H. Bort-
feld, S. G. Diamond, D. A. Boas, K. Arvin, and P. E. Grant. Assessment of
infant brain development with frequency-domain near-infrared spectroscopy.
Pediatr. Res. 61:546-551, 2007.

57
[89] H. Koizumi, T. Yamamoto, A. Maki, Y. Yamashita, H. Sato, H. Kawaguchi,
and N. Ichikawa. Optical topography: Practical problems and new applica-
tions. Appl. Opt. 42:3054-3062, 2003.
[90] J. Steinbrink, H. Wabnitz, H. Obrig, A. Villringer, and H. Rinneberg. Deter-
mining changes in NIR absorption using a layered model of the human head.
Phys. Med. Biol. 46:879-896, 2001.
[91] F. Martelli, A. Sassaroli, Y. Yamada, and G. Zaccanti. Analytical ap-
proximate solutions of the time-domain diffusion equation in layered slabs.
J. Opt. Soc. Am. A 19:71-80, 2002.
[92] E. Okada and D. T. Delpy. Near-infrared light propagation in an adult head
model. II. Effect of superficial tissue thickness on the sensitivity of the near-
infrared spectroscopy signal. Appl. Opt. 42:2915-2922, 2003.
[93] S. R. Arridge. Optical tomography in medical imaging. Inverse Probl. 15:41-
93, 1999.
[94] F. A. Rasulo, E. De Peri, and A. Lavinio. Transcranial Doppler ultrasonogra-
phy in intensive care. Eur. J. Anaesthesiol. Suppl. 42:167-173, 2008.
[95] S. L. Watkin, S. A. Spencer, P. W. Dimmock, Y. A. B. D. Wickramasinghe,
and P. Rolfe. A comparison of pulse oximetry and near infrared spectroscopy
(NIRS) in the detection of hypoxaemia occurring with pauses in nasal airflow
in neonates. J. Clin. Monit. Comput. 15:441-447, 1999.
[96] Y. Hoshi, S. Mizukami, and M. Tamura. Dynamic features of hemodynamic
and metabolic changes in the human brain during all-night sleep as revealed
by near-infrared spectroscopy. Brain Research 652:257-262, 1994.
[97] A. Spielman, G. Zhang, C. M. Yang, P. D’Ambrosio, S. Serizawa, M. Nagata,
H. von Gizycki, and R. Alfano. Intracerebral hemodynamics probed by near
infrared spectroscopy in the transition between wakefulness and sleep. Brain
Research 866:313-325, 2000.
[98] M. Uchida-Ota, N. Tanaka, H. Sato H, and A. Maki. Intrinsic correlations
of electroencephalography rhythms with cerebral hemodynamics during sleep
transitions. NeuroImage 42:357-368, 2008.
[99] T. Noponen. Instrumentation for diffuse optical imaging in the frequency do-
main. Master’s thesis, Helsinki University of Technology, 2001. (in Finnish)
[100] T. Noponen. Instrumentation for diffuse optical imaging and near-infrared
spectroscopy and their applications in human brain studies. Licentiate thesis,
Helsinki University of Technology, 2004.

58
[101] M. A. Franceschini, E. Gratton, and S. Fantini. Non-invasive optical method
to measure tissue and arterial saturation: an application to absolute pulse
oximetry of the brain. Opt. Lett. 24:829-831, 1999.
[102] N. Gavrielides. Extending a frequency domain optical tomography system for
the functional imaging of the infant brain. Master’s thesis, Helsinki University
of Technology, 2006.
[103] K. G. Libbrecht and J. L. Hall. A low-noise high-speed diode laser current
controller. Rev. Sci. Instrum. 64:2133-2135, 1993.
[104] K. Kotilahti. Optical imaging of brain activation. Master’s thesis, Helsinki
University of Technology, 2001. (in Finnish)
[105] F. G. Shellock and E. Kanal. Magnetic Resonance: Bioeffects, Safety, and Pa-
tient Management. Second Edition, Lippincott-Raven Press, New York, 1996.
[106] R. J. Ilmoniemi, J. Ruohonen, and J. Karhu. Transcranial mag-
netic stimulation − a new tool for functional imaging of the brain.
Crit. Rev. Biomed. Eng. 27:241-284, 1999.
[107] D. W. Swanson and L. R. Enlow. Stress effects of epoxy adhesives on ceramic
substrates and magnetics. Microelectronics Reliability 41:499-510, 1999.
[108] J. F. Nunn. Applied respiratory physiology. Butterworths, London, 1987.
[109] L. Qin, P. van Gelderen, J. A. Derbyshire, F. Jin, J. Lee, J. A. de
Zwart, Y. Tao, and J. H. Duyn. Prospective head-movement correction for
high-resolution MRI using an in-bore optical tracking system. Magn. Re-
son. Med. 62:924-934, 2009.
[110] P. M. Bloomfield, T. J. Spinks, J. Reed, L. Schnorr, A. M. Westrip, L. Livier-
atos, R. Fulton, and T. Jones. The design and implementation of a motion
correction scheme for neurological PET. Acad. Radiol. 13:1093-1103, 2006.
[111] D. T. Wehner, M. S. Hamalainen, M. Mody, and S. P. Ahlfors. Head move-
ments of children in MEG: quantification, effects on source estimation, and
compensation. NeuroImage 40:541-550, 2008.
[112] M. Izzetoglu, A. Devaraj, S. Bunce, and B. Onaral. Motion artifact can-
cellation in NIR spectroscopy using Wiener filtering. IEEE Trans. Biomed.
Eng. 52:934-938, 2005.
[113] H. Sato, N. Tanaka, M. Uchida, Y. Hirabayashi, M. Kanai, T. Ashida, I. Kon-
ishi, and A. Maki. Wavelet analysis for detecting body-movement artifacts in
optical topography signals. NeuroImage 33:580-587, 2006.

59
[114] T. J. Farrell, M. S. Patterson, and B. Wilson. A diffusion theory model of
spatially resolved, steady-state diffuse reflectance for the noninvasive determi-
nation of tissue optical properties in vivo. Med. Phys. 19:879-888, 1992.
[115] S. Suzuki, S. Takasaki, T. Ozaki, and Y. Kobayashi Y. A tissue oxygenation
monitor using NIR spatially resolved spectroscopy. Proc. SPIE 3597:582-592,
1999.
[116] S. J. Matcher, M. Cope, and D. T. Delpy. In vivo measurements of the
wavelength dependence of tissue-scattering coefficients between 760 and 900
nm measured with time-resolved spectroscopy. Appl. Opt. 36:386-396, 1997.
[117] H. Obrig, M. Neufang, R. Wenzel, M. Kohl, J. Steinbrink, K. M. Einhaupl,
and A. Villringer. Spontaneous low frequency oscillations of cerebral hemody-
namics and metabolism in human adults. NeuroImage 12:623-639, 2000.
[118] S. R. Seydnejad and R. I. Kitney. Modeling of Mayer waves generation mech-
anisms. IEEE Eng. Med. Biol. Mag. 20:92-100, 2001.
[119] C. E. Elwell, R. Springett, E. Hillman, and D. T. Delpy. Oscillations
in cerebral haemodynamics - implications for functional activation studies.
Adv. Exp. Med. Biol. 471:57-65, 1999.
[120] J. C. T. Pepperell, R. J. O. Davies, and J. R. Stradling. Sleep studies for
sleep apnoea. Physiol. Meas. 23:R39-R74, 2002.
[121] J. R. Stradling and R. J. O. Davies. Is it necessary to record sleep? Sleep
19:S251-S254, 1996.
[122] W. W. Flemons and J. E. Remmers. The diagnosis of sleep apnea: question-
naires and home studies. Sleep 19:S243-S247, 1996.
[123] A. Sadeh, P. J. Hauri, D. F. Kripke, and P. Lavie. The role of actigraphy in
the evaluation of sleep disorders. Sleep 18:288-302, 1995.
[124] P. J. E. Vos and J. R. Stradling. Assessment of sleep times and movement
arousals from video recordings. J. Amb. Mon. 4:35-42, 1991.
[125] J. Empson. Sleep and dreaming. Faber and Faber, London, 1990.
[126] P. Maquet. Functional neuroimaging of normal human sleep by positron emis-
sion tomography. J. Sleep Res. 9:207-231, 2000.
[127] A. Rechtschaffen and A. Kales. A manual of standardized terminology, tech-
niques, and scoring system for sleep stages of human subjects. National In-
stitutes of Health, Publication No. 204, US Government Printing Office, US
Public Health Service, 1968.

60
[128] P. van der Zee, M. Cope, S. R. Arridge, M. Essenpreis, L. A. Potter, and
A. D. Edwards. Experimentally measured optical pathlengths for the adult
head, calf and forearm and the head of the newborn infant as a function of
interoptode spacing. Adv. Exp. Med. Biol. 316:143-153, 1992.
[129] G. Bonmassar, N. Hadjikhani, J. R. Ives, D. Hinton, and J. W. Bel-
liveau. Influence of EEG electrodes on the BOLD fMRI signal. Hum. Brain
Mapp. 14:108-115, 2001.
[130] C. J. Scarff, A. Reynolds, B. G. Goodyear, C. W. Ponton, J. C. Dort, and
J. J. Eggermont. Simultaneous 3-T fMRI and high-density recording of human
auditory evoked potentials. NeuroImage 23:1129-1142, 2004.
[131] C. Mulert, L. Jager, R. Schmitt, P. Bussfeld, O. Pogarell, H. J. Moller,
G. Juckel, and U. Hegerl. Integration of fMRI and simultaneous EEG: to-
wards a comprehensive understanding of localization and time-course of brain
activity in target detection. NeuroImage 22:83-94, 2004.
[132] R. P. Kennan, S. G. Horovitz, A. Maki, Y. Yamashita, H. Koizumi, and
J. C. Gore. Simultaneous recording of event-related auditory oddball response
using transcranial near infrared optical topography and surface EEG. Neu-
roImage 16:587-592, 2002.
[133] H. Obrig, H. Israel, M. Kohl-Bareis, K. Uludag, R. Wenzel, B. Muller,
G. Arnold, and A. Villringer. Habituation of the visually evoked potential and
its vascular response: implications for neurovascular coupling in the healthy
adult. NeuroImage 17:1-18, 2002.
[134] M. Moosmann, P. Ritter, I. Krastel, A. Brink, S. Thees, F. Blankenburg,
B. Taskin, H. Obrig, and A. Villringer. Correlates of alpha rhythm in func-
tional magnetic resonance imaging and near infrared spectroscopy. NeuroIm-
age 20:145-158, 2003.
[135] S. G. Horovitz and J. C. Gore. Simultaneous event-related potential
and near-infrared spectroscopic studies of semantic processing. Hum. Brain
Mapp. 22:110-115, 2004.
[136] S. P. Koch, J. Steinbrink, A. Villringer, and H. Obrig. Synchronization be-
tween background activity and visually evoked potential is not mirrored by
focal hyperoxygenation: implications for the interpretation of vascular brain
imaging. J. Neurosci. 26:4940-4948, 2006.
[137] L. Rovati, G. Salvatori, L. Bulf, and S. Fonda. Optical and electrical recording
of neural activity evoked by graded contrast visual stimulus. BioMed. Eng. On-
line 6:28, 2007.
61
[138] M. J. Herrmann, T. Huter, M. Plichta, A. C. Ehlis, G. W. Alpers,
A. Muhlberger, and A. J. Fallgatter. Enhancement of activity of the primary
visual cortex during processing of emotional stimuli as measured with even-
trelated functional near-infrared spectroscopy and event related potentials.
Hum. Brain Mapp. 29:28-35, 2008.
[139] S. P. Koch, S. Koendgen, R. Bourayou, J. Steinbrink, and H. Obrig. Individ-
ual alpha-frequency correlates with amplitude of visual evoked potential and
hemodynamic response. NeuroImage 41:233-242, 2008.
[140] T. Nasi, K. Kotilahti, T. Noponen, I. Nissila, L. Lipiainen, and P. Merilainen.
Correlation of visual evoked hemodynamic responses and potentials in human
brain. Exp. Brain Res., 2009. (Accepted)
[141] J. Virtanen, J. Ruohonen, R. Naatanen, and R. J. Ilmoniemi. Instrumenta-
tion for the measurement of electric brain responses to transcranial magnetic
stimuli. Med. Biol. Eng. Comput. 37:322-326, 1999.
[142] G. F. A. Harding, J. V. Odom, W. Spileers, and H. Spekreijse. Standard for
visual evoked potentials 1995. Vision Res. 36:3567-3572, 1995.
[143] J. R. Fineman, S. J. Soifer, and M. A. Heymann. Regulation of pulmonary
vascular tone in the perinatal period. Annu. Rev. Physiol. 57:115-134, 1995.
[144] American Academy of Pediatrics. Committee on Fetus and Newborn. Use of
inhaled nitric oxide. Pediatrics 106:344-345, 2000.
[145] M. H. Zou and V. Ullrich. Peroxynitrite formed by simultaneous generation
of nitric oxide and superoxide selectively inhibits bovine aortic prostacyclin
synthase. FEBS Lett. 382:101-104, 1996.
[146] M. Ehlen and B. Wiebe. Iloprost in persistent pulmonary hypertension of the
newborn. Cardiol. Young 13:361-363, 2003.
[147] V. Lambert, A. Serraf, P. Durand, and J. Losay. Aerosolized iloprost therapy
in an infant with chronic pulmonary hypertension after a neonatal arterial
switch operation. Arch. Pediatr. 8:1218-1221, 2001.
[148] K. Olmsted, O. Oluola, A. Parthiban, and T. Raghuveer T. Can inhaled
prostacyclin stimulate surfactant in ELBW infants? J. Perinatol. 27:724-726,
2007.
[149] M. De Vroomen, P. Steendijk, R. H. Lopes Cardozo, H. H. Brouwers, F. Van
Bel, and J. Baan. Enhanced systolic function of the right ventricle during respi-
ratory distress syndrome in newborn lambs. Am. J. Physiol. Heart Circ. Phys-
iol. 280:H392-H400, 2001.

62
[150] V. Perez-de-Sa, D. Cunha-Goncalves, A. Nordh, S. Hansson, A. Larsson,
D. Ley, V. Fellman, and O. Werner. High brain tissue oxygen tension during
ventilation with 100% oxygen after fetal asphyxia in newborn sheep. Pedi-
atr. Res. 65:57-61, 2009.
[151] K. A. Marks, E. C. Mallard, I. Roberts, C. E. Williams, E. S. Sirimanne,
B. Johnston, P. D. Gluckman, and A. D. Edwards. Delayed vasodilation and
altered oxygenation after cerebral ischemia in fetal sheep. Pediatr. Res. 39:48-
54, 1996.
[152] D. A. Boas, T. J. Gaudette, and S. R. Arridge. Simultaneous imaging and
optode calibration with diffusive optical tomography. Opt. Express 8:263-270,
2001.
[153] M. Schweiger, I. Nissila, D. A. Boas, and S. R. Arridge. Image reconstruction
in optical tomography in the presence of coupling errors. Appl. Opt. 46:2743-
2756, 2007.
[154] B. W. Pogue and M. S. Patterson. Frequency-domain optical absorption
spectroscopy of finite tissue volumes using diffusion theory. Phys. Med. Biol.
39:1157-1180, 1994.
[155] R. C. Haskell, L. O. Svaasand, T.-T. Tsay, T.-C. Feng, M. S. McAdams, and
B. J. Tromberg. Boundary conditions for the diffusion equation in radiative
transfer. J. Opt. Soc. Am. A 11:2727-2741, 1994.
[156] F. Martelli, D. Contini, A. Taddeucci, and G. Zaccanti. Photon migration
through a turbid slab described by a model based on diffusion approximation.
II. Comparison with Monte Carlo results. Appl. Opt. 36:4600-4612, 1997.
[157] M. Gerken and G. W. Faris. High-precision frequency-domain measurements
of the optical properties of turbid media. Opt. Lett. 24 930-932, 1999.
[158] B. W. Pogue, K. D. Paulsen, C. Abele, and H. Kaufman. Calibra-
tion of near-infrared frequency-domain tissue spectroscopy for absolute
absorption coefficient quantitation in neonatal head-simulating phantoms.
J. Biomed. Opt. 5:185-193, 2000.
[159] F. Martelli, M. Bassani, L. Alianelli, L. Zangheri, and G. Zaccanti. Accuracy
of the diffusion equation to describe photon migration through an infinite
medium: numerical and experimental investigation. Phys. Med. Biol. 45:1359-
1373, 2000.
[160] G. Zaccanti, S. Del Bianco, and F. Martelli. Measurements of optical prop-
erties of high-density media. Appl. Opt. 42:4023-4030, 2003.

63
[161] F. Martelli and G. Zaccanti. Calibration of scattering and absorption prop-
erties of a liquid diffusive medium at NIR wavelengths. CW method. Opt. Ex-
press 15:486-500, 2007.
[162] S. Fantini, M. A. Franceschini, and E. Gratton. Effective source term in the
diffusion equation for photon transport in turbid media. Appl. Opt. 36:156-
163, 1997.
[163] V. Venugopalan, J. S. You, and B. J. Tromberg. Radiative transport in the
diffusion approximation: An extension for highly absorbing media and small
source-detector separations. Phys. Rev. E 58:2395-2407, 1998.
[164] M. Hiraoka, M. Firbank, M. Essenpreis, M. Cope, S. R. Arridge, P. van der
Zee, and D. T. Delpy. A Monte Carlo investigation of optical pathlength in
inhomogeneous tissue and its application to near-infrared spectroscopy. Phys.
Med. Biol. 38:1859-1876, 1993.
[165] T. J. Germon, P. D. Evans, A. R. Manara., N. J. Barnett, P. Wall, and
R. J. Nelson. Sensitivity of near infrared spectroscopy to cerebral and extra-
cerebral oxygenation changes is determined by emitter-detector separation.
J. Clin. Monit. Comput. 14:353-360, 1998.
[166] J. Virtanen, T. Noponen, and P. Merilainen. Comparison of principal and
independent component analysis in removing extracerebral interference from
near-infrared spectroscopy signals. J. Biomed. Opt. 14:054032, 2009.
[167] J. C. Hebden and T. Austin. Optical tomography of the neonatal brain.
Eur. Radiol. 17:2926-2933, 2007.
[168] H. Zhao, F. Gao, Y. Tanikawa, and Y. Yamada. Time-resolved diffuse
optical tomography and its application to in vitro and in vivo imaging.
J. Biomed. Opt. 12:062107, 2007.
[169] M. Toiviainen. Intermediate frequency amplifier for a frequency domain op-
tical tomography instrument. Special assignment, Helsinki University of Tech-
nology, 2009.
[170] J. Virtanen. Near-infrared spectroscopy in measuring changes of cerebral
haemoglobin concentrations during natural sleep. Master’s thesis, Helsinki
University of Technology, 2007.
[171] T. Nasi, K. Kotilahti, H. Maki, I. Nissila, and Pekka Merilainen. Com-
bining near-infrared spectroscopy with electroencephalography and repetitive
transcranial magnetic stimulation. European Conferences on Biomedical Op-
tics. Munich, Germany, 14 − 18 June, 2009.

64
[172] L. P. Safonova, A. Michalos, U. Wolf, M. Wolf, D. M. Hueber, J. H. Choi,
R. Gupta, C. Polzonetti, W. W. Mantulin, and E. Gratton. Age-correlated
changes in cerebral hemodynamics assessed by near-infrared spectroscopy.
Arch. Gerontol. Geriatr. 39: 207-225, 2004.
[173] W. Liboni, F. Molinari, G. B. Allais, O. Mana, E. Negri, G. D’Andrea,
G. Bussone, and C. Benedetto. Patent foramen ovale detected by near-
infrared spectroscopy in patients suffering from migraine with aura. Neu-
rol. Sci. 29(Suppl 1):S182-185, 2008.
[174] S. Magon, G. Basso, P. Farace, G. K. Ricciardi, A. Beltramello, and A. Sbar-
bati. Reproducibility of BOLD signal change induced by breath holding. Neu-
roImage 45:702-712, 2009.
[175] G. Themelis, H. D’Arceuil, S. G. Diamond, S. Thaker, T. J. Huppert,
D. A. Boas, and M. A. Franceschini. Near-infrared spectroscopy measurement
of the pulsatile component of cerebral blood flow and volume from arterial
oscillations. J. Biomed. Opt. 12:014033, 2007.
[176] D. A. Boas, G. Strangman, J. P. Culver, R. D. Hoge, G. Jasdzewski,
R. A. Poldrack, B. R. Rosen, and J. B. Mandeville. Can the cerebral
metabolic rate of oxygen be estimated with near-infrared spectroscopy?
Phys. Med. Biol. 48:2405-2418, 2003.
[177] Y. Hoshi, S. Kosaka, Y. Xie, S. Kohri, and M. Tamura. Relationship be-
tween fluctuations in the cerebral hemoglobin oxygenation state and neuronal
activity under resting conditions in man. Neurosci. Lett. 245:147-150, 1998.
[178] I. Tachtsidis, C. E. Elwell, T. S. Leung, C.-W. Lee, M. Smith, and
D. T. Delpy. Investigation of cerebral haemodynamics by near-infrared spec-
troscopy in young healthy volunteers reveals posture-dependent spontaneous
oscillations. Physiol. Meas. 25:437-445, 2004.
[179] R. L. Barbour, H. L. Graber, Y. Pei, S. Zhong, and C. H. Schmitz. Op-
tical tomographic imaging of dynamic features of dense-scattering media.
J. Opt. Soc. Am. A 18:3018-3036, 2001.
[180] S. G. Diamond, T. J. Huppert, V. Kolehmainen, M. A. Franceschini,
J. P. Kaipio, S. R. Arridge, and D. A. Boas. Dynamic physiological modeling
for functional diffuse optical tomography. NeuroImage 30:88-101, 2006.
[181] P. Sleight and B. Casadei. Relationships between heart rate, respiration, and
blood pressure variabilities. In M. Malik and A. J. Camm, eds. Heart Rate
Variability. Futura Pub. Co., pp. 311-327, 1995.

65
[182] K. Iwasaki, Y. Ogawa, S. Shibata, and K. Aoki. Acute exposure to normo-
baric mild hypoxia alters dynamic relationships between blood pressure and
cerebral blood flow at very low frequency. J. Cereb. Blood Flow Metab. 27:776-
784, 2007.
[183] T. Katura, N. Tanaka, A. Obata, H. Sato, and A. Maki. Quantitative eval-
uation of interrelations between spontaneous low-frequency oscillations in
cerebral hemodynamics and systemic cardiovascular dynamics. NeuroImage
31:1592-1600, 2006.
[184] T. Hayakawa, M. Terahima, Y. Kayukawa, T. Ohta, and T. Okada. Changes
in cerebral oxygenation and hemodynamics during obstructive sleep apneas.
Chest 109:916-921, 1996.
[185] A. D. McGown, H. Makker, C. Elwell, P. G. Al-Rawi, A. Valipour, and
S. G. Spiro. Measurement of changes in cytochrome oxidase redox state during
obstructive sleep apnea using near-infrared spectroscopy. Sleep 26:710-716,
2003.
[186] P. Lapinlampi. Assessment of the depth of natural sleep with Datex-Ohmeda
S/5 TM Entropy Module. Special assignment, Helsinki University of Technol-
ogy, 2005.
[187] R. J. Cooper, N. L. Everdell, L. C. Enfield, A. P. Gibson, A. Worley, and
J. C. Hebden. Design and evaluation of a probe for simultaneous EEG and
near-infrared imaging of cortical activation. Phys. Med. Biol. 54:2093-2102,
2009.
[188] B. M. Mackert, G. Wubbeler, S. Leistner, K. Uludag, H. Obrig, A. Villringer,
L. Trahms, and G. Curio. Neurovascular coupling analyzed non-invasively in
the human brain. Neuroreport 15:63-66, 2004.
[189] W. Ou, I. Nissila, H. Radhakrishnan, D. A. Boas, M. S. Hamalainen, and
M. A. Franceschini. Study of neurovascular coupling in humans via simulta-
neous magnetoencephalography and diffuse optical imaging acquisition. Neu-
roImage 46:624-632, 2009.
[190] P. Smielewski, P. Kirkpatrick, P. Minhas, J. D. Pickard, and M. Czosnyka.
Can cerebrovascular reactivity be measured with near-infrared spectroscopy?
Stroke 26:2285-2292, 1995.
[191] S. S. Dixit, H. Kim, B. Visser, and G. W. Faris. Development of a tran-
sillumination infrared modality for differential vasoactive optical imaging.
Appl. Opt. 48:178-186, 2009.
66
[192] L. J. Kemna and S. Posse. Effect of respiratory CO(2) changes on the tem-
poral dynamics of the hemodynamic response in functional MR imaging. Neu-
roImage 14:642-649, 2001.
[193] S. Posse, L. J. Kemna, B. Elghahwagi, S. Wiese, and V. G. Kiselev. Effect
of graded hypo- and hypercapnia on fMRI contrast in visual cortex: quantifi-
cation of T(*)(2) changes by multiecho EPI. Magn. Reson. Med. 46:264-271,
2001.
[194] H. D. Davies, W. M. Carroll, and F. L. Mastaglia. Effects of hyperventilation
on pattern-reversal visual evoked potentials in patients with demyelination.
J. Neurol. Neurosurg. Psychiatry 49:1392-1396, 1986.
[195] J. Bednarik and O. Novotny. Value of hyperventilation in pattern-reversal
visual evoked potentials. J. Neurol. Neurosurg. Psychiatry 52:1107-1109, 1989.
[196] V. S. Gavriysky. Influence of a twofold voluntary hyperventilation on visually
evoked cortical potentials and human pupillogram. Doc. Ophthalmol. 77:213-
224, 1991.
[197] Y. Minagawa-Kawai, K. Mori, J. C. Hebden, and E. Dupoux. Optical imag-
ing of infants’ neurocognitive development: recent advances and perspectives.
Developmental Neurobiology 68:712-728, 2008.
[198] J. Choi, M. Wolf, V. Toronov, U. Wolf, C. Polzonetti, D. Hueber, L. P. Sa-
fonova, R. Gupta, A. Michalos, W. Mantulin, and E. Gratton. Noninvasive
determination of the optical properties of adult brain: near-infrared spec-
troscopy approach. J. Biomed. Opt. 9:221-229, 2004.
[199] C. E. Cooper, C. E. Elwell, J. H. Meek, S. J. Matcher, J. S. Wyatt, M. Cope,
and D. T. Delpy. The noninvasive measurement of absolute cerebral deoxyhe-
moglobin concentration and mean optical path length in the neonatal brain
by second derivative near infrared spectroscopy. Pediatr. Res. 39:32-38, 1996.

ISBN 978-952-248-210-5ISBN 978-952-248-211-2 (PDF)ISSN 1795-2239ISSN 1795-4584 (PDF)