inside honeybee hives: impact of natural propolis on the
TRANSCRIPT

insects
Article
Inside Honeybee Hives: Impact of Natural Propolison the Ectoparasitic Mite Varroa destructorand VirusesNora Drescher 1, Alexandra-Maria Klein 2, Peter Neumann 3,4, Orlando Yañez 3,4 andSara D. Leonhardt 5,*
1 Institute of Ecology, Leuphana University of Lüneburg, Scharnhorststr. 1, Lüneburg D-21335, Germany;[email protected]
2 Department of Nature Conservation and Landscape Ecology, University of Freiburg, Tennenbacher Str. 4,Freiburg D-79106, Germany; [email protected]
3 Institute of Bee Health, Vetsuisse Faculty, University of Bern, Schwarzenburgstrasse 161, Bern CH-3003,Switzerland; [email protected] (P.N.); [email protected] (O.Y.)
4 Swiss Bee Research Centre, Agroscope, Bern CH-3003, Switzerland5 Department of Animal Department of Ecology and Tropical Biology, University of Würzburg, Biocenter-Am
Hubland, Würzburg D-97074, Germany* Correspondence: [email protected]
Academic Editors: Steven Cook, Jay Daniel Evans and Brian T. ForschlerReceived: 14 July 2016; Accepted: 22 January 2017; Published: 6 February 2017
Abstract: Social immunity is a key factor for honeybee health, including behavioral defensestrategies such as the collective use of antimicrobial plant resins (propolis). While laboratory datarepeatedly show significant propolis effects, field data are scarce, especially at the colony level. Here,we investigated whether propolis, as naturally deposited in the nests, can protect honeybees againstectoparasitic mites Varroa destructor and associated viruses, which are currently considered the mostserious biological threat to European honeybee subspecies, Apis mellifera, globally. Propolis intakeof 10 field colonies was manipulated by either reducing or adding freshly collected propolis.Mite infestations, titers of deformed wing virus (DWV) and sacbrood virus (SBV), resin intake,as well as colony strength were recorded monthly from July to September 2013. We additionallyexamined the effect of raw propolis volatiles on mite survival in laboratory assays. Our resultsshowed no significant effects of adding or removing propolis on mite survival and infestation levels.However, in relation to V. destructor, DWV titers increased significantly less in colonies with addedpropolis than in propolis-removed colonies, whereas SBV titers were similar. Colonies with addedpropolis were also significantly stronger than propolis-removed colonies. These findings indicatethat propolis may interfere with the dynamics of V. destructor-transmitted viruses, thereby furtheremphasizing the importance of propolis for honeybee health.
Keywords: Apis mellifera; deformed wing virus; plant-insect interactions; resin; sacbrood virus;social immunity
1. Introduction
Western honeybees, Apis mellifera, struggle with multiple environmental impacts, includingnumerous pests and pathogens. Particularly managed colonies of the European derived subspeciescontinue to suffer high (winter) losses, which is observed with increasing attention and concern [1–4].Honeybees are effective pollinators of various crops, and managed honeybees become increasinglyimportant in securing yields, particularly with decreasing diversity and abundance of many wildpollinator species [5,6] and with increasing demand for agricultural products [7,8].
Insects 2017, 8, 15; doi:10.3390/insects8010015 www.mdpi.com/journal/insects

Insects 2017, 8, 15 2 of 18
The reasons for the observed elevated mortalities of managed honeybee colonies are still subjectto debate [9–15]. Honeybees have been kept by humans for centuries, and it is likely that beekeepingpractices (including breeding), which focus primarily on traits such as bee handling and productivity,conflict with the bees’ local adaptions [16–18]. Moreover, the commercial use and international tradeof bees and bee products likely promotes the dispersal of diseases and pests [13,19–21]. Consequently,honeybees worldwide suffer from various pests and pathogens [21–24].
Among these, Varroa destructor, an ectoparasitic mite that feeds on the hemolymph of pupae andadult bees, is considered one of the most challenging threats [15,25–28]. Since these mites have shiftedtheir host from the Eastern honeybee A. cerana to A. mellifera, V. destructor is spreading rapidly onalmost every continent [3,23,25]. It has become a ubiquitous pest which commonly leads to colonycollapse within two to three years, unless they are treated by beekeepers [25,29], because V. destructorvectors several honeybee viruses, which generate a fatal disease epidemic within the colony [11,30–33].
At least seven viruses have been detected in V. destructor mites (i.e., acute bee paralysis virus(ABPV), Kashmir bee virus (KBV), Israeli acute bee paralysis virus (IAPV), chronic bee paralysisvirus (CBPV), sacbrood virus (SBV), deformed wing virus (DWV), and Varroa destructor virus-1(VDV-1) [28,34–36], supporting its putative role in virus transmission. A particularly strong linkis known for V. destructor and DWV. Several field and laboratory experiments demonstrated a positivecorrelation between mite infestations and virus titers [30,31,37–40]. Besides promoting horizontaltransmission, these mites likely play a crucial role in activating latent virus infections [40,41]. WhileDWV is of generally low virulence and causes rather asymptomatic infections, it became one of themost prevalent viruses in apiaries and is highly pathogenic in association with V. destructor [11,32,35].In contrast to DWV, other V. destructor-associated viruses, such as SBV, mostly occur less frequentlyand in rather moderate amounts in mites [35,42]. Unlike DWV, SBV titers are not directly correlatedwith V. destructor infestations, but are highest in spring and decrease towards late summer [35,43].In contrast, DWV loads typically increase relative to V. destructor infestation from spring to latesummer [30], thereby affecting the development of the long-living winter bees, which are essentialfor colony survival in temperate regions [26,30]. Thus, V. destructor and associated DWV can causesubstantial damage to colonies and most likely play a key role for colony losses during winter [12,33,37].
Because dense aggregation of hosts in colonies can facilitate the spread of diseases, honeybeesand other eusocial insects have evolved social immunity [44], including hygienic behavior (i.e., nesthygiene and allogrooming) [45–47], and social analogs of immune functions, such as social fever [48],encapsulation [49], and apoptosis [50] to combat pathogens. Honeybees [51], stingless bees [52,53],and some ant species [54,55] also collect plant resin, a sticky substrate secreted by plants to protectyoung sprouts and leaf buds [56], which is used for nest construction and defense against pestsand pathogens (reviewed in [51]). Propolis, the apicultural term for a mixture from various plantresins and wax, has long been known for its antibiotic properties and been used by humans intraditional medicine for centuries (reviewed in [57,58]). Chemically, it is a complex and highly variablemixture with up to 300 different substances, whose composition depends on the available plantresources [59–61]. The functional properties of propolis derive mainly from a variety of water insolublecompounds, such as various phenolic constitutions (flavonoids, aromatic acids, and benzopyranes) andterpenoids [62–67]. Volatile substances generally represent only a small fraction (1%–3%) of the entirebouquet, but significantly contribute to typical propolis characteristics, such as its distinctive aromaand its biological activity [68,69]. The biological activity and pharmacological properties of propolishave been intensively investigated [60] with a wide range of antimicrobial [70,71], antifungal [72,73],antiviral [72,74], and immunomodulatory [75] properties described. However, while numerous studiesexamined the pharmacological value of propolis for humans, only few investigated how propolisbenefits the bees themselves. For example, Simone-Finstrom et al. [76] showed that treating hives withpropolis extract can reduce overall bacterial loads and immune activity in individual bees. Propolis wasfurther found to be active against the causative agent of American foulbrood (Paenibacillus larvae) [77,78],as well as of chalkbrood (Ascosphaera apis) [79]. Propolis extracts can also have narcotic and lethal

Insects 2017, 8, 15 3 of 18
effects on V. destructor depending on the dosage used [80,81]. Consequently, propolis appears tobe active against a range of honeybee pests and pathogens and can be considered a social immunedefense mechanism, which is likely to be important for maintaining colony health [76,82–84]. However,the majority of studies which investigated the effect of propolis on honeybee pests used propolisethanolic extracts, and therefore do not inevitably reflect the functional properties of propolis inits natural (solid) form as placed in hives by bees. Moreover, testing effects of propolis on certainpathogens in laboratory assays may not necessarily implicate colony level effects [85].
In this study, we therefore investigated the effect of raw propolis on four common honeybeeviruses and on V. destructor mite infestations. We manipulated the amount of resin present within ahive by either removing or adding resin deposited above the brood nest. Due to the known antiviralproperties of propolis [74,86–88], we hypothesized that viral titers would be reduced in colonies treatedwith extra propolis compared to propolis-removed colonies. We further expected that V. destructorinfestation would be reduced due to the possible acaricide activity of propolis.
2. Material and Methods
2.1. Bioassay to Test for Effects of Propolis on Virus Infections and Mite Loads
2.1.1. Experimental Site and Set-Up
The experimental site was located in an agricultural landscape close to Lüneburg, lower Saxony,Germany, comprising comparatively small arable fields with varying crops (such as rapeseed, grain,sugar beet, and potato) and pastures as well as some scattered trees and mixed forest patches.The experiment was conducted between June and October 2013 (local summer/early autumn).Ten honeybee colonies with young, naturally mated queens were established in May 2013 in cleanpropolis-free wooden Dadant boxes consisting of a single brood chamber. Experimental colonieswhere maintained by splitting colonies of a local stock of Apis mellifera carnica, which were all reared inthe same apiary and provided with three brood frames as well as honey and pollen storage. Sourcecolonies had routinely been treated against ectoparasitic mites V. destructor with organic acids in theprevious winter (November 2012), and none of them showed any obvious clinical disease symptomsduring visual inspections.
Experimental manipulations of propolis were conducted between June, when bees initiatedsubstantial resin collection (noticed by the deposits in propolis traps and/or inner hive parts), andSeptember 2013. All 10 hives were placed in pairs of two neighboring colonies (high and low propolistreatment) with a distance of 0.25 m and placed in a row with a distance of 1.5 m between the pairs.Five colonies were provided with additional propolis—in the following called “high” (propolis)treatment—that was removed from the other half—referred to as having “low” (propolis) treatment.A commercial plastic propolis trap (Logar trade d.o.o., Šencur, Slovenia) was placed on the top ofthe frames to stimulate resin deposition. We assumed that bees deposit a considerable amount of thegathered resin into the grids, but some resin was clearly also deposited elsewhere within the hive.To remove as much of the gathered resins as possible from the “low” treatment group, propolis gridswere removed from the low propolis colonies once per week in June and every three days betweenJuly to September 2013. Grids were stored in a freezer and propolis deposits on grids were collectedby flexing the frozen grids to break off propolis. Propolis from frames and inner hive walls wasfurther removed by scratching it off with an apiary chisel. Following the collection, propolis wasmixed, ground, weighed, and evenly distributed across the five “high” propolis treatment coloniesby placing it on top of the hive frames no later than one day after removal from the “low” treatmentcolonies. Each portion of grounded propolis was compressed and gently pressed on the frames toensure that propolis remains on the frames. Overall, each “high” propolis treatment colony received16 g (± SD 0.5) of extra propolis, which represented between 9% and 70% (median 12%, ± SD 26) ofthe amount of propolis deposited in their own propolis grids.

Insects 2017, 8, 15 4 of 18
2.1.2. Data Collection and Sampling
Quantitative resin intake per colony was quantified by weighing all grids each time propolis wasremoved. As the amount of resin collected by the bees varied between colonies and often exceededthe amount of propolis which was used for the “high” propolis treatment, we additionally tested forpossible correlations between pathogen loads and propolis collection (see below). The status of allcolonies was controlled by estimating colony strength (see below) and verifying queen-state once permonth between the end of June and the beginning of September 2013. Further, winter survival of allcolonies was controlled in March 2014.
2.1.3. Bee Sampling and Determination of Mite Infestation Levels
The sampling protocol for assessing virus [43] and mite infestation [89] followed the COLOSSguidelines for A. mellifera pest and pathogen research. Once per month (July, August, September),~ 300 adult workers were sampled from three brood free frames located next to the brood of eachcolony [43], placed immediately on ice, and subsequently stored at −80◦ C until analyses. Phoreticmite infestation levels were investigated for each colony by the alcohol washing method describedin Dietemann et al.[90] and by counting dead mites which had fallen on bottom boards (i.e., naturalmite fall) (see Supplementary Material). Therefore, bottom boards were placed underneath eachhive and covered with a thick (0.3 cm) layer of aroma free petrolatum, to prevent wind or predators(e.g., ants) from removing mites and thus biasing mite quantification (“sticky board method”) [90,91].For moderate infestation levels, mite fall—i.e., natural mite mortality—is known to be directlycorrelated with mite population size in a colony and can therefore be used as a proxy for overallmite infestation [92]. Dead mites which had fallen on bottom boards were counted every 24 h overa time period of 10 days each month. Total numbers of mites were divided by the total number ofdays to calculate daily mite fall. Daily mite fall was further divided by the colony strength to estimaterelative mite infestation rates for each colony. Thus, mite infestation is hitherto presented as infestationper 1000 bees. Mite infestation rates as calculated by both methods (alcohol washing and natural mitefall) were highly correlated (Kendall’s rank correlation: z = 3.05, p = 0.002), and we therefore used onlynatural mite mortality in the statistical analyses.
Parallel to bee sampling, colony strength was recorded as the number of adult bees and broodcells according to the “Liebefelder-method” [93]. We recorded colony size early (before sunrise) inthe morning, before flight activity started. For each side of every frame within a hive, the proportionoccupied by bees was visually assessed. Proportions were then summed up for all frames within ahive to obtain the total number of frames occupied by bees. We finally calculated the total number ofbees for each hive by multiplying the number of frames fully occupied by bees with the number ofbees, which fit onto one side of a frame (i.e., ~1400 bees per 1130 cm2 for Dadant hives).
Brood cells were quantified using a grid with 1.5 × 1 × 0.5 dm2 square fields to estimate the totalarea of brood on each side of a frame. The total brood area (in dm2) was then converted into broodcells by multiplying brood area with the average number of cells occupying 1 dm2 (i.e., 400 cells forDadant hives).
2.1.4. Determination of Viral Loads
Pooled samples of ~300 adult workers per colony were used for the detection and quantificationof four common honeybee viruses: (1) black queen cell virus (BQCV); (2) deformed wing virus(DWV); (3) Israeli acute paralysis virus (IAPV); and (4) sacbrood virus (SBV). Virus analyses wereperformed using reverse transcription and quantitative PCR following [43,94]. In brief, each samplewas homogenized in TN buffer (10 mM Tris—10 mM NaCl, pH 7.6) using MACS M tubes with aDispomix® Drive homogenizer (Medic tools, Zug, Switzerland). RNA was then extracted using theRNA II NucleoSpin kit (Macherey-Nagel, Dueren, Germany) and eluted in 50 µL of RNAse-free waterfollowing the manufacturer’s instructions. Reverse transcription was performed using the M-LV RT

Insects 2017, 8, 15 5 of 18
enzyme (Promega, Madison, WI, USA) with 1 µg of extracted RNA and 100 µM of random hexamersin a 25 µL final volume following the manufacturer’s recommendations. Viral loads were determinedby a relative quantification method using, as standard curves, serial dilutions of purified PCR productsof known concentration. The qPCR reaction for each sample was performed in duplicate using KapaSYBR® Fast Master Mix (Kapa Biosystems, Woburn, MA, USA). Individual reactions contained 10 µLmaster mix, 3 µL cDNA template, 0.4 µL forward and reverse target primers (10 mM; Table 1) and6.2 µL of Milli-Q water. Reactions were performed in an EcoTM Real-Time PCR System (Illumina,San Diego, CA, USA) thermocycler. The following cycling conditions were used: 3 min at 95 ◦C,followed by 40 cycles of 95 ◦C for 3 s, and 55 ◦C for 30 s, during which fluorescence measurementswere taken. A melting curve (95 ◦C for 15 s, 55 ◦C for 15 s, and 95 ◦C for 15 s) was performed at theend of each run to ascertain the amplification of the target.
Table 1. Primers, sequences, and references used for quantification of the honeybee viruses black queencell virus (BQCV), deformed wing virus (DWV), Israeli acute paralysis virus (IAPV), and sacbroodvirus (SBV). Target virus genes were quantified in relation to a non-regulated Apis mellifera (A. m.)reference gene (β-actin analyzed in parallel in each sample).
Assay Primers Sequence (5′–3′) Reference
BQCVBQCV-qF7893 AGTGGCGGAGATGTATGC
Locke et al. [95]BQCV-qB8150 GGAGGTGAAGTGGCTATATC
DWVDWV-F8668 TTCATTAAAGCCACCTGGAACATC Forsgren et al. [96]DWV-B8757 TTTCCTCATTAACTGTGTCGTTGA
IAPVIAPV-F6627 CCATGCCTGGCGATTCAC
de Miranda et al. [97]KIABPV-B6707 CTGAATAATACTGTGCGTATC
SBVSBV-qF3164 TTGGAACTACGCATTCTCTG
Locke et al. [95]SBV-qB3461 GCTCTAACCTCGCATCAAC
β-actin (A.m.) Am-actin2-qF CGTGCCGATAGTATTCTTGLocke et al. [95]Am-actin2-qB CTTCGTCACCAACATAGG
The target gene (Cq) was quantified in relation to a non-regulated reference gene (β-actin analyzedin parallel in each sample). We calculated efficiency corrected ratio values according to Pfaff to account
for differences in PCR efficiency [98]: Ratio : Etarget∧−Cq Virus[sample]
Ere f∧−Cq Actin[sample] , with Etarget = real time PCR
efficiency of target gene transcript, Eref = real time PCR efficiency of reference gene transcript andCq = quantification cycles.
2.2. Bioassay to Test for Effect of Propolis on V. destructor Mite Survival
Whether raw propolis affected the survival of adult V. destructor mites, was tested in a laboratoryassay, in June 2014 and again in August 2014. Propolis for the assay was obtained from two honeybeecolonies near Lüneburg, Lower Saxony, Germany between June and August 2013, using a commercialpropolis grid (see above). In order to test for a cofounding effect of a thymol based acaricide treatment,one colony had previously been treated with thymol (propolis B), whereas the other one had notreceived any thymol treatment (propolis A). Propolis collected from each colony was groundedseparately using an electric coffee mill (typ3871, Severin, Sundern, Germany) and stored at −18 ◦C.V. destructor mites were collected prior to the experiment from infested brood of three colonies placedin the same apiary.
Collection of V. destructor Mites and Performance of Bioassays
In order to obtain mites, sealed brood was removed from brood combs and transferred to thelaboratory where we opened the wax cap of each brood cell, removed pupae and collected attendantmites with forceps. Only the larger female mites with dark color were used for the assays, while

Insects 2017, 8, 15 6 of 18
those that appeared to have recently malted (pale color) or did not move were discarded. Prior totesting, mites were kept in petri dishes together with a bee pupa as described in Delaplane et al. [93] toprevent starvation.
For bioassays, 6 g of grounded propolis were placed in the lid of a plastic container (160 mL).Between 10 and 14 mites were placed in the bottom of each container with a small piece of moist tissue.Propolis and mites were separated by a nylon net which prevented direct contact, but allowed freeevaporation of volatiles. A container without any propolis was used as control. We performed fiverepeats for each propolis sample and the control. Fresh mites were used for all tests. All containerswere kept in an incubator at 34 ◦C for 36 h. Following the protocol of Garedew et al. [80] and Damianiet al. [99], mite survival was monitored under a microscope 12, 18, 24, and 36 h after the assay hadstarted. Mites were classified as “mobile” when they were still active (i.e., able to move extremities);“immobile” when they were inactive, but still alive (as validated by careful touching them with aneedle); or “dead” when they showed no movement after three subsequent needle stimulations.
2.3. Statistical Analyses
Generalized linear mixed effect models (GLMM, glmer function in lme4 package) were used toanalyze the effect of propolis treatment on honeybee worker viral loads (normalized fold ratios). Dataof viral loads were log2-transformed to achieve normality. For the SBV load, only data from Augustand September were used, as SBV titers peaked before, or approximately with the beginning of theexperiment, which may interfere with possible treatment effects. Due to the known positive correlationbetween V. destructor infestation and the degree of viral infection as described in Shen et al. [40],Dainat et al. [30] and Francis et al. [31], differences in V. destructor infestation between coloniesmay have masked treatment effects. Therefore, initial models for each virus included “treatment”,“V. destructor infestation rate”, and their interaction as explanatory variables. To account for possiblecolony specific differences in initial viral loads and viral fluctuations over the season, “colony” and“sampling time” were included as random factors in all models. We used backward elimination andmaximum likelihood ratio estimators to fit the most parsimonious model. Models were ranked basedon their Akaike’s information criterion (AIC) values and compared to the null model (including onlythe random variables colony and sampling time) using likelihood ratio tests (ANOVA command in thelme4 package). We additionally compared the ratio of viral titers and mite infestation (ratio = virustiter/V. destructor mite infestation) between the two treatment groups using Wilcoxon rank sum teststo confirm GLMM results. Ratios were calculated for each colony and each sampling point.
We further tested for a possible correlation between quantitative resin collection and pathogenloads (V. destructor mite, viral infection) using Kendall’s rank correlation tests. Correlations were testedfor all colonies pooled as well as for each treatment group separately.
We composed and compared additional GLMMs to examine whether V. destructor infestation,virus loads, or colony size best explained the amount of resin collected by colonies. Here, initial modelsincluded the explanatory variables treatment and either V. destructor infestation rate, or viral load,or the number of adult bees. Models were fitted as described above with “colony” and “sampling time”included as random factors in all models, and the variances explained by each model were comparedby marginal (R2m) and conditional R (R2c) squared values following Nakagawa [50] (Multi-modelinference, r.squaredGLMM function in MuMIn package). A Wilcoxon rank sum test was further usedto compare quantitative resin collection between the two treatment groups.
In order to assess the survival of V. destructor mites exposed to propolis and to test for differencesbetween propolis samples and the control, the Kaplan Meier estimator (corrected for multiple testingwith Bonferroni) was used (surv function in survival package). For survival analyses, we combineddata for the categories “immobile” and “dead” as both would lead to dropping of mites from bees andthus prevent them from causing further harm to bees. Therefore, numbers of immobile and dead miteswere summed up and compared to the number of mobile mites for each record. All statistical analyseswere performed in R [100].

Insects 2017, 8, 15 7 of 18
3. Results
3.1. Resin Intake and Colony Strength
After bees initiated resin intake in June, it was low for the first 20 days (mean amount of resin ± SD:0.9 g/colony and day ±0.5) and increased from the second half of July to August (2.8 g/colony andday ±1.9). Resin intake decreased again from late August (0.75 g/colony and day ±0.2) to September(0.6 g/colony and day ± 0.3). The total amount of resin collected over the experimental period rangedfrom 28 g to 205 g (mean ± SD: 131.2 g ± 71.3) per colony and was positively correlated with colonystrength (Kendall’s rank correlation: z = 3.52, r = 0.46, p < 0.001). Colony strength was further higher incolonies which received additional propolis (Wilcoxon rank sum test: W = 63, p = 0.041, Figure 1a).
Insects 2017, 8, 15 7 of 18
3.1. Resin Intake and Colony Strength
After bees initiated resin intake in June, it was low for the first 20 days (mean amount of resin ± SD: 0.9 g/colony and day ±0.5) and increased from the second half of July to August (2.8 g/colony and day ±1.9). Resin intake decreased again from late August (0.75 g/colony and day ±0.2) to September (0.6 g/colony and day ± 0.3). The total amount of resin collected over the experimental period ranged from 28 g to 205 g (mean ± SD: 131.2 g ± 71.3) per colony and was positively correlated with colony strength (Kendall’s rank correlation: z = 3.52, r = 0.46, p < 0.001). Colony strength was further higher in colonies which received additional propolis (Wilcoxon rank sum test: W = 63, p = 0.041, Figure 1a).
(a) (b)
(c) (d)
Figure 1. (a–d) Effects of the high (dark grey) and low (light grey) propolis treatment on the development of (a) colony strength; (b) Varroa destructor infestation rates (natural mite fall/colony strength); (c) sacbrood virus titers (SBV); and (d) deformed wing virus titers (DWV) over the course of the experiment from July to September 2013. Viral titers are expressed as log2 transformed, efficiency corrected ΔCq values (Cq = quantification cycles). Each boxplot represents median values of both treatment groups (N = 5) per month with default ranges for boxes (75th and 25th percentile), whiskers (±1.5) and outliers (dots).
3.2. Effects of Propolis Manipulation on Virus Infections and Mite Loads
Varroa destructor infestation generally increased from June to September 2013 in all experimental colonies (Figure 1b), but mite infestation levels strongly varied among colonies (Figure 1b) and were higher in stronger colonies (Kendall’s rank correlation: z = 3.43, p = 0.001). We found no significant effect of propolis treatment on mite infestation (Wilcoxon rank sum test: W = 97, p = 0.534). Of the four viruses assessed in the study, only SBV and DWV were detected. Viral titers differed between
Figure 1. (a–d) Effects of the high (dark grey) and low (light grey) propolis treatment on thedevelopment of (a) colony strength; (b) Varroa destructor infestation rates (natural mite fall/colonystrength); (c) sacbrood virus titers (SBV); and (d) deformed wing virus titers (DWV) over the course ofthe experiment from July to September 2013. Viral titers are expressed as log2 transformed, efficiencycorrected ∆Cq values (Cq = quantification cycles). Each boxplot represents median values of bothtreatment groups (N = 5) per month with default ranges for boxes (75th and 25th percentile), whiskers(±1.5) and outliers (dots).
3.2. Effects of Propolis Manipulation on Virus Infections and Mite Loads
Varroa destructor infestation generally increased from June to September 2013 in all experimentalcolonies (Figure 1b), but mite infestation levels strongly varied among colonies (Figure 1b) and werehigher in stronger colonies (Kendall’s rank correlation: z = 3.43, p = 0.001). We found no significanteffect of propolis treatment on mite infestation (Wilcoxon rank sum test: W = 97, p = 0.534). Of thefour viruses assessed in the study, only SBV and DWV were detected. Viral titers differed between thecolonies, but generally increased (DWV, Figure 1d) or decreased (SBV, Figure 1c) from July to August.
Insects 2017, 8, 15 8 of 18
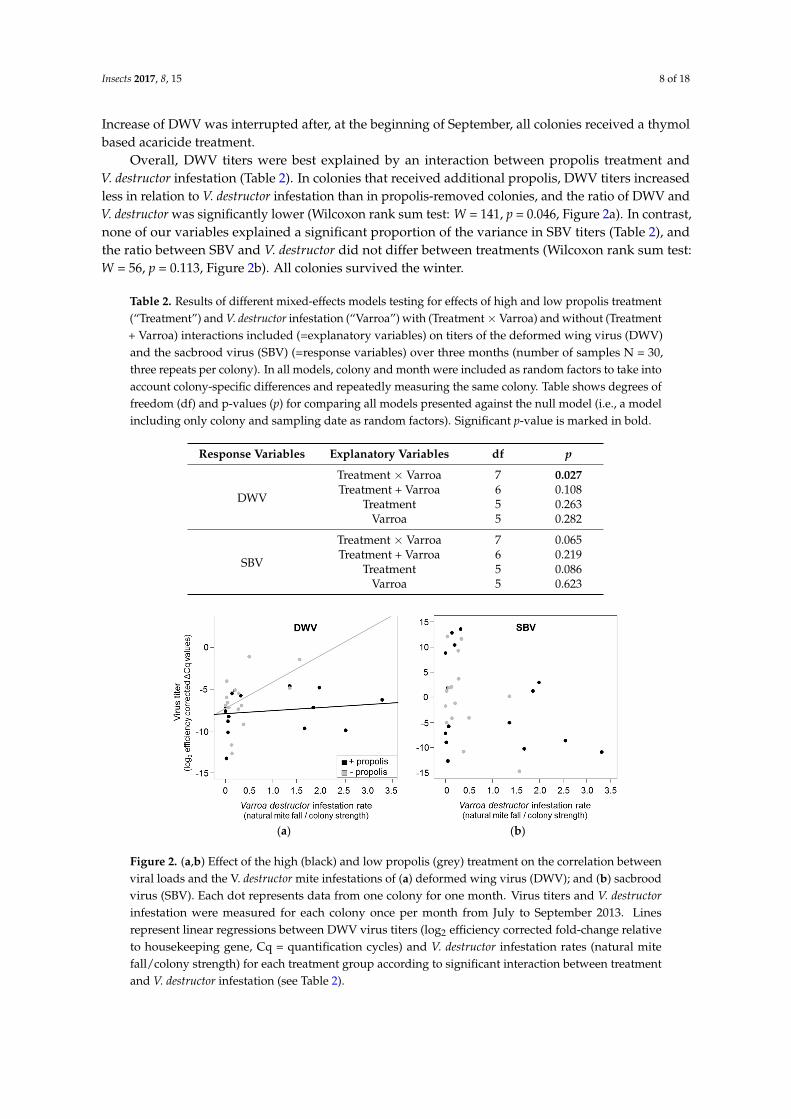
Increase of DWV was interrupted after, at the beginning of September, all colonies received a thymolbased acaricide treatment.
Overall, DWV titers were best explained by an interaction between propolis treatment andV. destructor infestation (Table 2). In colonies that received additional propolis, DWV titers increasedless in relation to V. destructor infestation than in propolis-removed colonies, and the ratio of DWV andV. destructor was significantly lower (Wilcoxon rank sum test: W = 141, p = 0.046, Figure 2a). In contrast,none of our variables explained a significant proportion of the variance in SBV titers (Table 2), andthe ratio between SBV and V. destructor did not differ between treatments (Wilcoxon rank sum test:W = 56, p = 0.113, Figure 2b). All colonies survived the winter.
Table 2. Results of different mixed-effects models testing for effects of high and low propolis treatment(“Treatment”) and V. destructor infestation (“Varroa”) with (Treatment × Varroa) and without (Treatment+ Varroa) interactions included (=explanatory variables) on titers of the deformed wing virus (DWV)and the sacbrood virus (SBV) (=response variables) over three months (number of samples N = 30,three repeats per colony). In all models, colony and month were included as random factors to take intoaccount colony-specific differences and repeatedly measuring the same colony. Table shows degrees offreedom (df) and p-values (p) for comparing all models presented against the null model (i.e., a modelincluding only colony and sampling date as random factors). Significant p-value is marked in bold.
Response Variables Explanatory Variables df p
DWV
Treatment × Varroa 7 0.027Treatment + Varroa 6 0.108
Treatment 5 0.263Varroa 5 0.282
SBV
Treatment × Varroa 7 0.065Treatment + Varroa 6 0.219
Treatment 5 0.086Varroa 5 0.623
Insects 2017, 8, 15 8 of 18
the colonies, but generally increased (DWV, Figure 1d) or decreased (SBV, Figure 1c) from July to August. Increase of DWV was interrupted after, at the beginning of September, all colonies received a thymol based acaricide treatment.
Overall, DWV titers were best explained by an interaction between propolis treatment and V. destructor infestation (Table 2). In colonies that received additional propolis, DWV titers increased less in relation to V. destructor infestation than in propolis-removed colonies, and the ratio of DWV and V. destructor was significantly lower (Wilcoxon rank sum test: W = 141, p = 0.046, Figure 2a). In contrast, none of our variables explained a significant proportion of the variance in SBV titers (Table 2), and the ratio between SBV and V. destructor did not differ between treatments (Wilcoxon rank sum test: W = 56, p = 0.113, Figure 2b). All colonies survived the winter.
(a) (b)
Figure 2. (a,b) Effect of the high (black) and low propolis (grey) treatment on the correlation between viral loads and the V. destructor mite infestations of (a) deformed wing virus (DWV); and (b) sacbrood virus (SBV). Each dot represents data from one colony for one month. Virus titers and V. destructor infestation were measured for each colony once per month from July to September 2013. Lines represent linear regressions between DWV virus titers (log2 efficiency corrected fold-change relative to housekeeping gene, Cq = quantification cycles) and V. destructor infestation rates (natural mite fall/colony strength) for each treatment group according to significant interaction between treatment and V. destructor infestation (see Table 2).
Table 2. Results of different mixed-effects models testing for effects of high and low propolis treatment (“Treatment”) and V. destructor infestation (“Varroa”) with (Treatment × Varroa) and without (Treatment + Varroa) interactions included (=explanatory variables) on titers of the deformed wing virus (DWV) and the sacbrood virus (SBV) (=response variables) over three months (number of samples N = 30, three repeats per colony). In all models, colony and month were included as random factors to take into account colony-specific differences and repeatedly measuring the same colony. Table shows degrees of freedom (df) and p-values (p) for comparing all models presented against the null model (i.e., a model including only colony and sampling date as random factors). Significant p-value is marked in bold.
Response Variables Explanatory Variables df p
DWV
Treatment × Varroa 7 0.027 Treatment + Varroa 6 0.108
Treatment 5 0.263 Varroa 5 0.282
SBV
Treatment × Varroa 7 0.065 Treatment + Varroa 6 0.219
Treatment 5 0.086 Varroa 5 0.623
Figure 2. (a,b) Effect of the high (black) and low propolis (grey) treatment on the correlation betweenviral loads and the V. destructor mite infestations of (a) deformed wing virus (DWV); and (b) sacbroodvirus (SBV). Each dot represents data from one colony for one month. Virus titers and V. destructorinfestation were measured for each colony once per month from July to September 2013. Linesrepresent linear regressions between DWV virus titers (log2 efficiency corrected fold-change relativeto housekeeping gene, Cq = quantification cycles) and V. destructor infestation rates (natural mitefall/colony strength) for each treatment group according to significant interaction between treatmentand V. destructor infestation (see Table 2).

Insects 2017, 8, 15 9 of 18
3.3. Correlation between Resin Intake and Pathogen Loads
Resin intake was generally higher in colonies with added propolis than in propolis-removedcolonies (Wilcoxon rank sum test: W = 58, p = 0.025), and positively correlated with V. destructorinfestation (Kendall’s rank correlation: z = 3.43, r = 0.45, p < 0.001), DWV titers (Kendall’s rankcorrelation: z = 1.95, r = 0.25, p = 0.026, Figure 3a) and colony strength (Kendall’s rank correlation:z = 2.34, r = 0.30, p = 0.01), but not with SBV titers (Kendall’s rank correlation: z = 0.70 r = 0.09,p = 0.243, Figure 3b). However, variance in the amount of resin collected by bees was best explainedby the interaction of DWV and treatment (R2m = 32%, R2c = 72%, Figure 3a, Table 3). The positivecorrelations between resin collection and pathogen loads were highly significant for colonies withadditional propolis (Kendall’s rank correlation: V. destructor: z = 2.43, r = 0.47, p = 0.008; DWV: z = 2.58,r = 0.5, p = 0.005), but weaker (Kendall’s rank correlation: V. destructor: z = 1.89, r = 0.37, p = 0.029)or not significant (Kendall’s rank correlation: DWV: z = 1, r = 0.20, p = 0.16) for propolis removedcolonies (Figure 3a). No significant correlations were found for colony strength and resin collection,when treatment groups were tested separately (Kendall’s rank correlation: low treatment: z = 0.90,r = 0.18, p = 0.190; high treatment: z = 1.49, r = 0.29, p = 0.069).
Insects 2017, 8, 15 9 of 18
3.3. Correlation between Resin Intake and Pathogen Loads
Resin intake was generally higher in colonies with added propolis than in propolis-removed colonies (Wilcoxon rank sum test: W = 58, p = 0.025), and positively correlated with V. destructor infestation (Kendall’s rank correlation: z = 3.43, r = 0.45, p < 0.001), DWV titers (Kendall’s rank correlation: z = 1.95, r = 0.25, p = 0.026, Figure 3a) and colony strength (Kendall’s rank correlation: z = 2.34, r = 0.30, p = 0.01), but not with SBV titers (Kendall’s rank correlation: z = 0.70 r = 0.09, p = 0.243, Figure 3b). However, variance in the amount of resin collected by bees was best explained by the interaction of DWV and treatment (R2m = 32%, R2c = 72%, Figure 3a, Table 3). The positive correlations between resin collection and pathogen loads were highly significant for colonies with additional propolis (Kendall’s rank correlation: V. destructor: z = 2.43, r = 0.47, p = 0.008; DWV: z = 2.58, r = 0.5, p = 0.005), but weaker (Kendall’s rank correlation: V. destructor: z = 1.89, r = 0.37, p = 0.029) or not significant (Kendall’s rank correlation: DWV: z = 1, r = 0.20, p = 0.16) for propolis removed colonies (Figure 3a). No significant correlations were found for colony strength and resin collection, when treatment groups were tested separately (Kendall’s rank correlation: low treatment: z = 0.90, r = 0.18, p = 0.190; high treatment: z = 1.49, r = 0.29, p = 0.069).
(a) (b)
Figure 3. (a,b) Effect of viral infection with (a) deformed wing virus (DWV); and (b) sacbrood virus (SBV) on the amount of resin (g) collected by bees. Each dot represents data from one colony for one month. Lines represent linear regression between resin collection and virus titers (log efficiency corrected fold-change relative to housekeeping gene) for each treatment group (black = ”high propolis treatment”, gray = “low propolis treatment”) with * indicating a significant correlation with p < 0.05 and n.s. a non-significant correlation.
Table 3. Results of mixed-effects models testing for effects of V. destructor infestation (“Varroa”), DWV infection (DWV) and treatment (“Treatment”) as well as their interactions (indicated with x) on the quantity of resin collected by each colony over three months (number of samples N = 30, three repeats per colony). In all models, colony and month were included as random factors to take into account colony-specific differences and repeatedly measuring the same colony. Table shows p-values (p) and R2-values (i.e., percentage explained variance) for comparing all models presented against the null model (i.e., a model including only colony and sampling date as random factors), marginal R squared values (R2m: representing the explanatory power of the fixed effects only) and conditional R squared values (R2c: representing the explanatory power of the whole model, including the random effects). Significant p-value is marked in bold.
Explanatory Variables p R2m (%) R2c (%) Treatment × DWV 0.022 32 72
DWV 0.203 2 76 Treatment × Varroa 0.176 24 71
Varroa 0.706 0.5 68 Treatment × Colony strength 0.475 18 72
Figure 3. (a,b) Effect of viral infection with (a) deformed wing virus (DWV); and (b) sacbrood virus(SBV) on the amount of resin (g) collected by bees. Each dot represents data from one colony forone month. Lines represent linear regression between resin collection and virus titers (log efficiencycorrected fold-change relative to housekeeping gene) for each treatment group (black = ”high propolistreatment”, gray = “low propolis treatment”) with * indicating a significant correlation with p < 0.05and n.s. a non-significant correlation.
Table 3. Results of mixed-effects models testing for effects of V. destructor infestation (“Varroa”), DWVinfection (DWV) and treatment (“Treatment”) as well as their interactions (indicated with x) on thequantity of resin collected by each colony over three months (number of samples N = 30, three repeatsper colony). In all models, colony and month were included as random factors to take into accountcolony-specific differences and repeatedly measuring the same colony. Table shows p-values (p) andR2-values (i.e., percentage explained variance) for comparing all models presented against the nullmodel (i.e., a model including only colony and sampling date as random factors), marginal R squaredvalues (R2m: representing the explanatory power of the fixed effects only) and conditional R squaredvalues (R2c: representing the explanatory power of the whole model, including the random effects).Significant p-value is marked in bold.
Explanatory Variables p R2m (%) R2c (%)
Treatment × DWV 0.022 32 72DWV 0.203 2 76
Treatment × Varroa 0.176 24 71Varroa 0.706 0.5 68
Treatment × Colony strength 0.475 18 72Colony strength 0.127 <0.01 72
Treatment 0.886 17 71

Insects 2017, 8, 15 10 of 18
3.4. Effect of Propolis on V. destructor Mite Survival
Survival of V. destructor mites differed between propolis samples and the control (χ2 = 103,p < 0.0001; Figure 4). Mites that were exposed to volatiles of propolis not treated with thymol (propolisA) lived about as long as the control group which had not been exposed to propolis (survival test:χ2 = 1.5, p = 0.23; propolis A: median survival time ± SE = 36 h ± 0.03 h, control: 36 h ± 0.02 h;Figure 4). In contrast, propolis obtained from colonies treated with thymol significantly reducedmite survival (24 h ± 0.03 h) when compared with propolis A (χ2 = 75.9, p < 0.0001) and the control(χ2 = 59.2, p < 0.0001; Figure 4). After 36 h, on average, 96% of all mites had died irrespective ofthe treatment.
Insects 2017, 8, x 10 of 17
Colony strength 0.127 <0.01 72
Treatment 0.886 17 71
3.4. Effect of Propolis on V. destructor Mite Survival
Survival of V. destructor mites differed between propolis samples and the control (χ2 = 103, p <
0.0001; Figure 4). Mites that were exposed to volatiles of propolis not treated with thymol (propolis
A) lived about as long as the control group which had not been exposed to propolis (survival test: χ2
= 1.5, p = 0.23; propolis A: median survival time ± SE = 36 h ± 0.03 h, control: 36 h ± 0.02 h; Figure 4). In
contrast, propolis obtained from colonies treated with thymol significantly reduced mite survival (24
h ± 0.03 h) when compared with propolis A (χ2 = 75.9, p < 0.0001) and the control (χ2 = 59.2, p < 0.0001;
Figure 4). After 36 h, on average, 96% of all mites had died irrespective of the treatment.
Figure 4. Kaplan-Meyer survival curves showing survival rates of Varroa destructor mites when
exposed to propolis obtained from colonies treated with thymol (Propolis B = dashed line N = 58), not
treated with thymol (Propolis A = gray line, N = 58) or not exposed to propolis (Control = black line,
N = 58) under laboratory conditions. Dotted lines mark 95% confidence intervals.
4. Discussion
Our results show that natural propolis can reduce DWV viral loads in relation to infestations
with V. destructor, which further supports the key role of social immunity for eusocial insect health
[101,102].
4.1. Effects of Propolis on Virus Infections and Mite Loads
Both viruses detected in our study, i.e., the deformed wing virus (DWV) and the sacbrood virus
(SBV), are likely to be transmitted by V. destructor [35,103], but only DWV is known to be highly
correlated with mite loads [30,31] and therefore usually increases from early summer to autumn
[35,38]. Accordingly, DWV titers varied proportionally with V. destructor infestation in all of our
colonies, whereas SBV titers decreased continuously from June to September, irrespective of mite
infestation. Such seasonal dynamics observed for SBV confirm earlier studies (e.g., [35]). However,
in colonies provided with additional propolis, DWV titers increased significantly less with V.
destructor infestation compared to propolis-removed colonies. This finding suggests that the long
known antiviral effect of propolis [74,86–88] may also account at the level of the honeybee colony.
However, the effect of added propolis on DWV titers was relatively low and depended on V.
destructor mite infestation. Thus, alternatively, but not mutually exclusive, bees in colonies with
Figure 4. Kaplan-Meyer survival curves showing survival rates of Varroa destructor mites when exposedto propolis obtained from colonies treated with thymol (Propolis B = dashed line N = 58), not treatedwith thymol (Propolis A = gray line, N = 58) or not exposed to propolis (Control = black line, N = 58)under laboratory conditions. Dotted lines mark 95% confidence intervals.
4. Discussion
Our results show that natural propolis can reduce DWV viral loads in relation to infestations withV. destructor, which further supports the key role of social immunity for eusocial insect health [101,102].
4.1. Effects of Propolis on Virus Infections and Mite Loads
Both viruses detected in our study, i.e., the deformed wing virus (DWV) and the sacbroodvirus (SBV), are likely to be transmitted by V. destructor [35,103], but only DWV is known to be highlycorrelated with mite loads [30,31] and therefore usually increases from early summer to autumn [35,38].Accordingly, DWV titers varied proportionally with V. destructor infestation in all of our colonies,whereas SBV titers decreased continuously from June to September, irrespective of mite infestation.Such seasonal dynamics observed for SBV confirm earlier studies (e.g., [35]). However, in coloniesprovided with additional propolis, DWV titers increased significantly less with V. destructor infestationcompared to propolis-removed colonies. This finding suggests that the long known antiviral effectof propolis [74,86–88] may also account at the level of the honeybee colony. However, the effect ofadded propolis on DWV titers was relatively low and depended on V. destructor mite infestation. Thus,alternatively, but not mutually exclusive, bees in colonies with higher amounts of propolis may bettercope with DWV infections due to a positive effect of propolis on their immune system [84]. Such apositive effect on colony health is further supported by significantly higher colony strength in colonies

Insects 2017, 8, 15 11 of 18
with added propolis in our study. Likewise, Nicodemo et al. [82] found increased brood viabilityand higher worker longevity in Africanized honeybees that were bred for high propolis production.Propolis may thus benefit honeybee colonies by increasing general vitality [76,79]. This increase invitality may also explain why colonies that were provided with multiple grids to encourage formationof a “natural propolis envelope” were more likely to survive winter and were stronger in springthan colonies without envelope in the study of Borba et al. [84]. Our own study did not see an effectof propolis enrichment on survival over winter, but this may be due to the smaller sample size ofsix colonies (compared to twelve in Borba et al. [84]). Unlike our study, Borba et al. [84] found nodifference in DWV infection between colonies with “natural propolis envelope” and colonies without.This discrepancy may be explained by differences in overall propolis amounts and thus DWV infectiondynamics between studies. Moreover, Borba et al. [84] did not actively manipulate propolis amounts,quantify resin intake of colonies, or analyze the interaction between mites and DWV, which renders adirect comparison between studies difficult.
In contrast to DWV, we found no significant effect of propolis on SBV infection. This findingmay be explained by the fact that SBV infection peaked approximately with the beginning of ourexperiment and then decreased in all colonies. Thus, differences in SBV infection between treatmentsmay have been masked by the virus’ general demise.
Although antiviral activity of various propolis extracts against envelope and non-envelope viruseswas demonstrated by several studies, the exact mode of action is still not completely understood [74,87].Reduction of viral replication tends to be highest when extracts were applied prior to or at the timeof infection, suggesting that propolis-derived compounds interfere with the binding or entering ofviruses at host cells [87,88]. However, propolis is a complex mixture of various substances with a broadtherapeutic spectrum, including immunomodulatory activity resulting primarily from stimulationof macrophage activity [87,88,96]. It was further shown to enhance the recognition of pathogensand support the initial steps of the immune response by upregulating the expression of two toll-likereceptors [104]. In honeybees, viral defense is mediated mainly by RNA interference (RNAi), but alsoby immune-related mechanisms (i.e., the pathogen-associated molecular pattern (PAMP) and inducedtoll pathways) [105]. Thus, resistance to viral infections may be improved by propolis compoundsthrough enhancing the non-specific immune defense, while simultaneously reducing the generalinvestment in the cost intensive activation of humoral immune responses. In fact, the presence ofpropolis within bee hives was found to reduce the expression of immune-related genes withoutaffecting levels of pathogens and parasites [84]. Other studies showed however that resin/propolisfurther reduced bacterial loads in the nests [54,76].
Constant removal of propolis may in turn increase physiological stress, which results in increasedimmune activity and thus reduced individual fitness. Such immune system weakening effects can playa critical role for viral infections such as with DWV [38,41,95]. While bees are generally able to combatDWV infections, physiological stress through mite pressure can enhance virus expansion and leadto a destabilized parasite-host relationship [27,32]. In fact, Nazzi et al. [32] found 19 immune relatedgenes to be downregulated in V. destructor-infested colonies, indicating that mites not only functionas vector for viruses, but also enhance viral infections by actively suppressing the immune functionof bees. This finding was further confirmed by Ryabov et al. [106] who revealed that mite pressureincreased replication of a virulent DWV strain, which was itself not detected in mites.
Our results suggest that the immune suppressive effect caused by mites may be (partly)compensated by the immune supportive effect of propolis, which can have important implications forcolony health, as the levels of viral titers are known to be critical for the development of clinical diseasesymptoms [41]. Contrary to our expectations, our results showed no impact of propolis on V. destructoritself, which agrees with previous studies investigating the efficacy of natural propolis [37,83]. Survivalof mites, in our study, was only reduced by raw propolis obtained from colonies that have previouslybeen treated with thymol which is known to accumulate in propolis [107].

Insects 2017, 8, 15 12 of 18
In contrast, other studies showed that direct exposure of mites to ethanolic propolis extracts cancause mortality and narcotic effects [80,99], suggesting that propolis can have a detrimental influenceon mites. However, lethal effects were mainly observed for extracts with high alcohol content (70%)and less (or not) for extracts with lower alcohol content (40%), which may be explained by a comparablelower content of bioactive compounds [80]. Under natural conditions, mites rarely get in direct contactwith high concentrations of non-volatile propolis compounds as found in 70% alcohol extracts [80],but may be exposed to volatiles evaporating from propolis deposited in varying areas of the hive(including cell rims). Our results thus indicate that such propolis volatiles do not affect mite survival(at least not for the propolis samples from our study area).
However, the chemical composition of propolis is highly variable and depends largely on the plantsources used by bees [59,108]. Bees may actually learn or evolve to shift their resin collection towardssources with acaricide activity as suggested by the study of Popova et al. [109] who found a highercontent of three biologically active compounds in propolis from V. destructor resistant colonies (for areview see [110]). In fact, the existence of several V. destructor mite-surviving A. mellifera populationsindicates that natural selection can lead to a stable parasite-host relationship, as seen, e.g., in Africanand Africanized honeybees which occur in large wild V. destructor mite resistant populations [97].Compared to the European subspecies, African and Africanized honeybees generally collect largeramounts of propolis and have a better resistance against most of the common honeybee diseases [111],which further supports the beneficial role of propolis for A. mellifera colony health.
4.2.Correlation between Resin Intake and Pathogen Loads
Resin intake was comparatively higher in colonies with added propolis which may be explainedby the observed differences in colony size between the two treatment groups. Interestingly,the quantity of resin collected by each colony was, overall, positively correlated with levels ofDWV infection, suggesting that bees actively respond to viral pressure by increasing resin collection.Such “self-medication” was also described by Simone-Finstrom and Spivak [79], who showedthat colonies increased resin foraging rates after having been challenged with the fungal parasiteAscosphaera apis (causative agent of chalkbrood).
However, we observed no such correlation between resin collection and SBV titers. As thecollection of resins depends on its availability, which increases towards the end of summer [56], theapparent lack of response towards SBV infection may also be related to the earlier peak of SBV infection.
5. Conclusions
In conclusion, our study provides new insights into the functional properties of propolis as acolony level defense mechanism and thereby further supports its substantial role for honeybee colonyhealth. We have shown that propolis can naturally benefit honeybee field colonies by reducing DWVloads in relation to V. destructor infestation, suggesting that it may be vital for bees to overcome thispathogen challenge. However, future studies (ideally with more colonies) should verify this interactionand follow colony strength, health, and viral titers over winter to better understand whether and(if so) how reduced DWV loads actually impact colony survival. Further studies including additionalhealth parameters are also needed in order to better understand the actual mode of action of propolis.Our result on the activity of propolis against V. destructor contradicts previous studies which usedethanolic extracts and stresses the general need for more studies conducted under natural conditionsat the colony level to obtain more biologically relevant data [85]. We further suggest that missingresin sources or the removal of propolis may have negative implications for honeybee colonies. Resincollection, as a natural defense of honeybees, should therefore find more consideration in practicalbeekeeping, particularly as many bee keepers constantly remove propolis from bee hives duringroutine control.
Supplementary Materials: The supplementary materials are available online at http://www.mdpi.com/2075-4450/8/1/15/s1.

Insects 2017, 8, 15 13 of 18
Acknowledgments: Financial support was granted by the Swiss National Science Foundation (SNSF) and theVinetum Foundation to Peter Neumann and Orlando Yañez, and the Deutsche Forschungsgemeinschaft (DFGproject: LE 2750/1-1) to Sara D. Leonhardt. Nora Drescher was supported by the Leuphana University of Lüneburg.Kaspar Roth is greatly acknowledged for technical laboratory support and Manfred Lütke for assistance withpractical beekeeping.
Author Contributions: Conceived and designed the experiments: Nora Drescher, Alexandra-Maria Klein,Peter Neumann and Sara D. Leonhardt. Performed the experiments: Nora Drescher. Analyzed the data:Nora Drescher, Peter Neumann, Orlando Yañez and Sara D. Leonhardt. Contribution to materials/analysis tools:Peter Neumann and Sara D. Leonhardt. Wrote the paper: Nora Drescher, Alexandra-Maria Klein, Peter Neumann,Orlando Yañez and Sara D. Leonhardt.
Conflicts of Interest: The authors declare no conflict of interest.
References
1. Ellis, J.D.; Evans, J.D.; Pettis, J. Colony losses, managed colony population decline, and Colony CollapseDisorder in the United States. J. Apic. Res. 2010, 49, 134–136. [CrossRef]
2. Potts, S.G.; Roberts, S.P.M.; Dean, R.; Marris, G.; Brown, M.A.; Jones, R.; Neumann, P.; Settele, J. Declines ofmanaged honey bees and beekeepers in Europe. J. Apic. Res. 2010, 49, 15–22. [CrossRef]
3. Neumann, P.; Carreck, N.L. Honey bee colony losses. J. Apic. Res. 2010, 49, 1–6. [CrossRef]4. VanEngelsdorp, D.; Hayes, J., Jr.; Underwood, R.M.; Caron, D.; Pettis, J. A survey of managed honey bee
colony losses in the USA, fall 2009 to winter 2010. J. Apic. Res. 2011, 50, 1–10. [CrossRef]5. Kosior, A.; Celary, W.; Olejniczak, P.; Fijal, J.; Krol, W.; Solarz, W.; Plonka, P. The decline of the bumble bees
and cuckoo bees (Hymenoptera: Apidae: Bombini) of Western and Central Europe. Oryx 2007, 41, 79–88.[CrossRef]
6. Potts, S.G.; Biesmeijer, J.C.; Kremen, C.; Neumann, P.; Schweiger, O.; Kunin, W.E. Global pollinator declines:Trends, impacts and drivers. Trends Ecol. Evol. 2010, 25, 345–353. [CrossRef] [PubMed]
7. Aizen, M.A.; Garibaldi, L.A.; Cunningham, S.A.; Klein, A.M. Long-Term Global Trends in Crop Yield andProduction Reveal No Current Pollination Shortage but Increasing Pollinator Dependency. Curr. Biol. 2008,18, 1572–1575. [CrossRef] [PubMed]
8. Klein, A.M.; Vaissière, B.E.; Cane, J.H.; Steffan-Dewenter, I.; Cunningham, S.A.; Kremen, C.; Tscharntke, T.Importance of pollinators in changing landscapes for world crops. Proc. R. Soc. B Biol. Sci. 2007, 274, 303–313.[CrossRef] [PubMed]
9. Frazier, M.; Mullin, C.; Frazier, J.; Ashcraft, S. What have pesticides got to do with it? Am. Bee J. 2008, 148,521–523.
10. Orantes-Bermejo, F.J.; Pajuelo, A.G.; Megias, M.M.; Fernandez-Pinar, C.T. Pesticide residues in beeswax andbeebread samples collected from honey bee colonies (Apis mellifera L.) in Spain. Possible implications for beelosses. J. Apic. Res. 2010, 49, 243–250. [CrossRef]
11. Martin, S.J. The role of Varroa and viral pathogens in the collapse of honeybee colonies: A modellingapproach. J. Appl. Ecol. 2001, 38, 1082–1093. [CrossRef]
12. Moritz, R.F.A.; de Miranda, J.; Fries, I.; Le Conte, Y.; Neumann, P.; Paxton, R.J. Research strategies to improvehoneybee health in Europe. Apidologie 2010, 41, 227–242. [CrossRef]
13. Smith, K.M.; Loh, E.H.; Rostal, M.K.; Zambrana-Torrelio, C.M.; Mendiola, L.; Daszak, P. Pathogens, pests,and economics: Drivers of honey bee colony declines and losses. Ecohealth 2013, 10, 434–445. [CrossRef][PubMed]
14. Pohorecka, K.; Bober, A.; Skubida, M.; Zdanska, D.; Toroj, K. A comparative study of environmentalconditions, bee management and epidemiological situation in apiaries in the level of colony losses. J. Apic. Sci.2014, 58, 107–132. [CrossRef]
15. Le Conte, Y.; Ellis, M.; Ritter, W. Varroa mites and honey bee health: Can Varroa explain part of the colonylosses? Apidologie 2010, 41, 353–363. [CrossRef]
16. Meixner, M.D.; Costa, C.; Kryger, P.; Hatjina, F.; Bouga, M.; Ivanova, E.; Buchler, R. Conserving diversity andvitality for honey bee breeding. J. Apic. Res. 2010, 49, 85–92. [CrossRef]
17. De la Rua, P.; Jaffe, R.; Munoz, I.; Serrano, J.; Moritz, R.F.A.; Bernhard Kraus, F. Conserving genetic diversityin the honeybee: Comments on Harpur et al. (2012). Mol. Ecol. 2013, 22, 3208–3210. [CrossRef] [PubMed]

Insects 2017, 8, 15 14 of 18
18. Jones, R. European beekeeping in the 21st century: Strengths, weaknesses, opportunities, threats. Bee World2004, 85, 77–80. [CrossRef]
19. Klee, J.; Besana, A.M.; Genersch, E.; Gisder, S.; Nanetti, A.; Tam, D.Q.; Chinh, T.X.; Puerta, F.; Ruz, J.M.;Kryger, P.; et al. Widespread dispersal of the microsporidian Nosema ceranae, an emergent pathogen of thewestern honey bee, Apis mellifera. J. Invertebr. Pathol. 2007, 96, 1–10. [CrossRef] [PubMed]
20. Mutinelli, F. The spread of pathogens through trade in honey bees and their products (including queenbees and semen): Overview and recent developments. Rev. Sci. Tech. Off. Int. Epizoot. 2011, 30, 257–271.[CrossRef]
21. Neumann, P.; Pettis, J.S.; Schäfer, M.O. Quo vadis Aethina tumida? Biology and control of small hive beetles.Apidologie 2016, 47, 427–466. [CrossRef]
22. Chen, Y.P.; Siede, R. Honey Bee Viruses; Elsevier Academic Press Inc.: San Diego, CA, USA, 2007; Volume 70,pp. 33–80.
23. Ellis, J.D.; Munn, P.A. The worldwide health status of honey bees. Bee World 2005, 86, 88–101. [CrossRef]24. Chantawannakul, P.; de Guzman, L.; Williams, G. Parasites and pests of honey bees in Asia. Apidologie 2016,
47, 301–324. [CrossRef]25. Rosenkranz, P.; Aumeier, P.; Ziegelmann, B. Biology and control of Varroa destructor. J. Invertebr. Pathol. 2010,
103 (Suppl. 1), 96–119. [CrossRef] [PubMed]26. Dainat, B.; Evans, J.D.; Chen, Y.P.; Gauthier, L.; Neumann, P. Predictive markers of honey bee colony collapse.
PLoS ONE 2012. [CrossRef] [PubMed]27. Yang, X.; Cox-Foster, D. Effects of parasitization by Varroa destructor on survivorship and physiological traits
of Apis mellifera in correlation with viral incidence and microbial challenge. Parasitology 2007, 134, 405–412.[CrossRef] [PubMed]
28. Ball, B.V.; Allen, M.F. The prevalence of pathogens in honey bee (Apis mellifera) colonies infested with Theparasitic mite Varroa Jacobsoni. Ann. Appl. Biol. 1988, 113, 237–244. [CrossRef]
29. Fries, I.; Imdorf, A.; Rosenkranz, P. Survival of mite infested (Varroa destructor) honey bee (Apis mellifera)colonies in a Nordic climate. Apidologie 2006, 37, 564–570. [CrossRef]
30. Dainat, B.; Evans, J.D.; Chen, Y.P.; Gauthier, L.; Neumann, P. Dead or alive: Deformed wing virus andVarroa destructor reduce the life span of winter honeybees. Appl. Environ. Microbiol. 2011, 78, 981–987.[CrossRef] [PubMed]
31. Francis, R.M.; Nielsen, S.L.; Kryger, P. Varroa-virus interaction in collapsing honey bee colonies. PLoS ONE2013. [CrossRef] [PubMed]
32. Nazzi, F.; Brown, S.P.; Annoscia, D.; Del Piccolo, F.; Di Prisco, G.; Varricchio, P.; Della Vedova, G.; Cattonaro, F.;Caprio, E.; Pennacchio, F. Synergistic parasite-pathogen interactions mediated by host immunity can drivethe collapse of honeybee colonies. PLoS Pathog. 2015. [CrossRef] [PubMed]
33. Neumann, P.; Yañez, O.; Fries, I.; de Miranda, J.R. Varroa invasion and virus adaptation. Trends Parasitol.2012, 28, 353–354. [CrossRef] [PubMed]
34. Di Prisco, G.; Pennacchio, F.; Caprio, E.; Boncristiani, H.F.; Evans, J.D.; Chen, Y.P. Varroa destructor is aneffective vector of Israeli acute paralysis virus in the honeybee, Apis mellifera. J. Gen. Virol. 2011, 92, 151–155.[CrossRef] [PubMed]
35. Tentcheva, D.; Gauthier, L.; Zappulla, N.; Dainat, B.; Cousserans, F.; Colin, M.E.; Bergoin, M. Prevalence andseasonal variations of six bee viruses in Apis mellifera L. and Varroa destructor mite populations in France.Appl. Environ. Microbiol. 2004, 70, 7185–7191. [CrossRef] [PubMed]
36. Ongus, J.R.; Peters, D.; Bonmatin, J.M.; Bengsch, E.; Vlak, J.M.; van Oers, M.M. Complete sequence of apicorna-like virus of the genus Iflavirus replicating in the mite Varroa destructor. J. Gen. Virol. 2004, 85,3747–3755. [CrossRef] [PubMed]
37. Genersch, E.; von der Ohe, W.; Kaatz, H.; Schroeder, A.; Otten, C.; Buchler, R.; Berg, S.; Ritter, W.; Muhlen, W.;Gisder, S.; et al. The German bee monitoring project: A long term study to understand periodically highwinter losses of honey bee colonies. Apidologie 2010, 41, 332–352. [CrossRef]
38. Di Prisco, G.; Zhang, X.; Pennacchio, F.; Caprio, E.; Li, J.L.; Evans, J.D.; DeGrandi-Hoffman, G.; Hamilton, M.;Chen, Y.P. Dynamics of persistent and acute Deformed wing virus infections in honey bees, Apis mellifera.Viruses 2011, 3, 2425–2441. [CrossRef] [PubMed]

Insects 2017, 8, 15 15 of 18
39. Bowen-Walker, P.L.; Martin, S.J.; Gunn, A. The transmission of deformed wing virus between honeybees(Apis mellifera L.) by the ectoparasitic mite Varroa jacobsoni Oud. J. Invertebr. Pathol. 1999, 73, 101–106.[CrossRef] [PubMed]
40. Shen, M.Q.; Yang, X.L.; Cox-Foster, D.; Cui, L.W. The role of varroa mites in infections of Kashmir bee virus(KBV) and Deformed wing virus (DWV) in honey bees. Virology 2005, 342, 141–149. [CrossRef] [PubMed]
41. Yang, X.L.; Cox-Foster, D.L. Impact of an ectoparasite on the immunity and pathology of an invertebrate:Evidence for host immunosuppression and viral amplification. Proc. Natl. Acad. Sci. USA 2005, 102,7470–7475. [CrossRef] [PubMed]
42. Mondet, F.; de Miranda, J.R.; Kretzschmar, A.; Le Conte, Y.; Mercer, A.R. On the Front Line: QuantitativeVirus Dynamics in Honeybee (Apis mellifera L.) Colonies along a New Expansion Front of the ParasiteVarroa destructor. PLoS Pathog. 2014, 10. [CrossRef] [PubMed]
43. De Miranda, J.R.; Bailey, L.; Ball, B.V.; Blanchard, P.; Budge, G.E.; Chejanovsky, N.; Chen, Y.P.; Gauthier, L.;Genersch, E.; de Graaf, D.C.; et al. Standard methods for virus research in Apis mellifera. J. Apic. Res. 2013.[CrossRef]
44. Evans, J.D.; Spivak, M. Socialized medicine: Individual and communal disease barriers in honey bees. J.Invertebr. Pathol. 2010, 103, S62–S72. [CrossRef] [PubMed]
45. Boecking, O.; Spivak, M. Behavioral defenses of honey bees against Varroa jacobsoni Oud. Apidologie 1999, 30,141–158. [CrossRef]
46. Spivak, M.; Reuter, G.S. Resistance to American foulbrood disease by honey bee colonies Apis mellifera bredfor hygienic behavior. Apidologie 2001, 32, 555–565. [CrossRef]
47. Neumann, P.; Härtel, S. Removal of small hive beetle (Aethina tumida) eggs and larvae by African honeybeecolonies (Apis mellifera scutellata). Apidologie 2004, 35, 31–36. [CrossRef]
48. Starks, P.T.; Blackie, C.A.; Seeley, T.D. Fever in honeybee colonies. Naturwissenschaften 2000, 87, 229–231.[CrossRef] [PubMed]
49. Neumann, P.; Pirk, C.W.W.; Hepburn, H.R.; Solbrig, A.J.; Ratnieks, F.L.W.; Elzen, P.J.; Baxter, J.R. Socialencapsulation of beetle parasites by Cape honeybee colonies (Apis mellifera capensis Esch.). Naturwissenschaften2001, 88, 214–216. [PubMed]
50. Page, P.; Lin, Z.; Buawangpong, N.; Zheng, H.; Hu, F.; Neumann, P.; Chantawannakul, P.; Dietemann, V.Social apoptosis in honey bee superorganisms. Sci. Rep. 2016. [CrossRef] [PubMed]
51. Simone-Finstrom, M.; Spivak, M. Propolis and bee health: The natural history and significance of resin useby honey bees. Apidologie 2010, 41, 295–311. [CrossRef]
52. Leonhardt, S.D.; Bluthgen, N. A sticky affair: Resin collection by bornean stingless bees. Biotropica 2009, 41,730–736. [CrossRef]
53. Roubik, D.W. Stingless bee nesting biology. Apidologie 2006, 37, 124–143. [CrossRef]54. Castella, G.; Chapuisat, M.; Christe, P. Prophylaxis with resin in wood ants. Anim. Behav. 2008, 75, 1591–1596.
[CrossRef]55. Chapuisat, M.; Oppliger, A.; Magliano, P.; Christe, P. Wood ants use resin to protect themselves against
pathogens. Proc. R. Soc. B Biol. Sci. 2007, 274, 2013–2017. [CrossRef] [PubMed]56. Langenheim, J. Plant Resins: Chemistry, Evolution, Ecology, and Ethnobotany; Timber Press: Portland, OR, USA;
Cambridge, UK, 2003.57. Ghisalberti, E.L. Propolis: A review. Bee World 1979, 60, 59–84. [CrossRef]58. Burdock, G.A. Review of the biological properties and toxicity of bee propolis (propolis). Food Chem. Toxicol.
1998, 36, 347–363. [CrossRef]59. Greenaway, W.; Scaysbrook, T.; Whatley, F.R. The composition and plant origin of propolis: A report of work
at Oxford. Bee World 1990, 71, 107–118. [CrossRef]60. Marcucci, M.C. Propolis—Chemical composition, biological properties and therapeutic activity. Apidologie
1995, 26, 83–99. [CrossRef]61. Bankova, V.S.; de Castro, S.L.; Marcucci, M.C. Propolis: Recent advances in chemistry and plant origin.
Apidologie 2000, 31, 3–15. [CrossRef]62. Bonvehi, J.S.; Coll, F.V.; Jorda, R.E. The composition, active components and bacteriostatic activity of propolis
in dietics. J. Am. Oil Chem. Soc. 1994, 71, 529–532. [CrossRef]63. Cushnie, T.P.T.; Lamb, A.J. Antimicrobial activity of flavonoids. Int. J. Antimicrob. Agents 2005, 26, 343–356.
[CrossRef] [PubMed]

Insects 2017, 8, 15 16 of 18
64. Popova, M.P.; Chinou, I.B.; Marekov, I.N.; Bankova, V.S. Terpenes with antimicrobial activity from Cretanpropolis. Phytochemistry 2009, 70, 1262–1271. [CrossRef] [PubMed]
65. Massaro, C.F.; Smyth, T.J.; Smyth, W.F.; Heard, T.; Leonhardt, S.D.; Katouli, M.; Wallace, H.M.; Brooks, P.Phloroglucinols from anti-microbial deposit-resins of australian stingless bees (Tetragonula carbonaria).Phytother. Res. 2015, 29, 48–58. [CrossRef] [PubMed]
66. Melliou, E.; Stratis, E.; Chinou, I. Volatile constituents of propolis from various regions ofGreece—Antimicrobial activity. Food Chem. 2007, 103, 375–380. [CrossRef]
67. Kujumgiev, A.; Bankova, V.; Ignatova, A.; Popov, S. Antibacterial activity of propolis, some of Its componentsand their analogs. Pharmazie 1993, 48, 785–786. [PubMed]
68. Bankova, V.; Christov, R.; Popov, S.; Pureb, O.; Bocari, G. Volatile constituents of propolis. Z. Naturforsch. CJ. Biosci. 1994, 49, 6–10.
69. Bankova, V.; Popova, M.; Trusheva, B. Propolis volatile compounds: Chemical diversity and biologicalactivity: A review. Chem. Cent. J. 2014, 8, 28:1–28:8. [CrossRef] [PubMed]
70. Bonvehi, J.S.; Gutierrez, A.L. The antimicrobial effects of propolis collected in different regions in the BasqueCountry (Northern Spain). World J. Microbiol. Biotechnol. 2012, 28, 1351–1358. [CrossRef] [PubMed]
71. Vardar-Unlu, G.; Silici, S.; Unlu, M. Composition and in vitro antimicrobial activity of Populus buds andpoplar-type propolis. World J. Microbiol. Biotechnol. 2008, 24, 1011–1017. [CrossRef]
72. Kujumgiev, A.; Tsvetkova, I.; Serkedjieva, Y.; Bankova, V.; Christov, R.; Popov, S. Antibacterial, antifungal andantiviral activity of propolis of different geographic origin. J. Ethnopharmacol. 1999, 64, 235–240. [CrossRef]
73. Silici, S.; Koc, N.A.; Ayangil, D.; Cankaya, S. Antifungal activities of propolis collected by different races ofhoneybees against yeasts isolated from patients with superficial mycoses. J. Pharmacol. Sci. 2005, 99, 39–44.[CrossRef] [PubMed]
74. Gekker, G.; Hu, S.X.; Spivak, M.; Lokensgard, J.R.; Peterson, P.K. Anti-HIV-1 activity of propolis in CD4(+)lymphocyte and microglial cell cultures. J. Ethnopharmacol. 2005, 102, 158–163. [CrossRef] [PubMed]
75. Dimov, V.; Ivanovska, N.; Manolova, N.; Bankova, V.; Nikolov, N.; Popov, S. Immunomodulatory actionof propolis—Influence on antiinfectious protection and macrophage function. Apidologie 1991, 22, 155–162.[CrossRef]
76. Simone-Finstrom, M.; Evans, J.D.; Spivak, M. Resin collection and social immunity in honey bees. Evolution2009, 63, 3016–3022. [CrossRef] [PubMed]
77. Bastos, E.; Simone, M.; Jorge, D.M.; Soares, A.E.E.; Spivak, M. In vitro study of the antimicrobial activity ofBrazilian propolis against Paenibacillus larvae. J. Invertebr. Pathol. 2008, 97, 273–281. [CrossRef] [PubMed]
78. Wilson, M.B.; Brinkman, D.; Spivak, M.; Gardner, G.; Cohen, J.D. Regional variation in composition andantimicrobial activity of US propolis against Paenibacillus larvae and Ascosphaera apis. J. Invertebr. Pathol. 2015,124, 44–50. [CrossRef] [PubMed]
79. Simone-Finstrom, M.D.; Spivak, M. Increased Resin Collection after Parasite Challenge: A Case ofSelf-Medication in Honey Bees? PLoS ONE 2012, 7, e34601. [CrossRef] [PubMed]
80. Garedew, A.; Lamprecht, I.; Schmolz, E.; Schricker, B. The varroacidal action of propolis: A laboratory assay.Apidologie 2002, 33, 41–50. [CrossRef]
81. Damiani, N.; Daniel Maggi, M.; Brenda Gende, L.; Faverin, C.; Javier Eguaras, M.; Augusto Marcangeli, J.Evaluation of the toxicity of a propolis extract on Varroa destructor (Acari: Varroidae) and Apis mellifera(Hymenoptera: Apidae). J. Apic. Res. 2010, 49, 257–264. [CrossRef]
82. Nicodemo, D.; Malheiros, E.B.; De Jong, D.; Nogueira Couto, R.H. Increased brood viability and longerlifespan of honeybees selected for propolis production. Apidologie 2013, 45, 269–275. [CrossRef]
83. Nicodemo, D.; De Jong, D.; Couto, R.H.N.; Malheiros, B. Honey bee lines selected for high propolisproduction also have superior hygienic behavior and increased honey and pollen stores. Genet. Mol. Res.2013, 12, 6931–6938. [CrossRef] [PubMed]
84. Borba, R.S.; Klyczek, K.K.; Mogen, K.L.; Spivak, M. Seasonal benefits of a natural propolis envelope to honeybee immunity and colony health. J. Exp. Biol. 2015, 218, 3689–3699. [CrossRef] [PubMed]
85. Retschnig, G.; Williams, G.R.; Odemer, R.; Boltin, J.; Di Poto, C.; Mehmann, M.M.; Retschnig, P.; Winiger, P.;Rosenkranz, P.; Neumann, P. Effects, but no interactions, of ubiquitous pesticide and parasite stressors onhoney bee (Apis mellifera) lifespan and behaviour in a colony environment. Environ. Microbiol. 2015, 17,4322–4331. [CrossRef] [PubMed]

Insects 2017, 8, 15 17 of 18
86. Shimizu, T.; Hino, A.; Tsutsumi, A.; Park, Y.K.; Watanabe, W.; Kurokawa, M. Anti-influenza virus activity ofpropolis in vitro and its efficacy against influenza infection in mice. Antivir. Chem. Chemother. 2008, 19, 7–13.[CrossRef] [PubMed]
87. Amoros, M.; Sauvager, F.; Girre, L.; Cormier, M. In vitro antiviral activity of propolis. Apidologie 1992, 23,231–240. [CrossRef]
88. Schnitzler, P.; Neuner, A.; Nolkemper, S.; Zundel, C.; Nowack, H.; Sensch, K.H.; Reichling, J. Antiviralactivity and mode of action of propolis extracts and selected compounds. Phytother. Res. 2010, 24, 20–28.[CrossRef] [PubMed]
89. Dietemann, V.; Ellis, J.D.; Neumann, P. COLOSS BEEBOOK; International Bee Research Association: Cardiff,UK, 2013; Volume II.
90. Dietemann, V.; Nazzi, F.; Martin, S.J.; Anderson, D.L.; Locke, B.; Delaplane, K.S.; Wauquiez, Q.; Tannahill, C.;Frey, E.; Ziegelmann, B.; et al. Standard methods for varroa research. J. Apic. Res. 2013. [CrossRef]
91. Dainat, B.; Kuhn, R.; Cherix, D.; Neumann, P. A scientific note on the ant pitfall for quantitative diagnosis ofVarroa destructor. Apidologie 2011, 42, 740–742. [CrossRef]
92. Branco, M.R.; Kidd, N.A.C.; Pickard, R.S. A comparative evaluation of sampling methods for Varroa destructor(Acari: Varroidae) population estimation. Apidologie 2006, 37, 452–461. [CrossRef]
93. Delaplane, K.S.; van der Steen, J.; Guzman-Novoa, E. Standard methods for estimating strength parametersof Apis mellifera colonies. J. Apic. Res. 2013, 52, 1–12. [CrossRef]
94. Evans, J.D.; Schwarz, R.S.; Chen, Y.P.; Budge, G.; Cornman, R.S.; De la Rua, P.; de Miranda, J.R.; Foret, S.;Foster, L.; Gauthier, L.; et al. Standard methods for molecular research in Apis mellifera. J. Apic. Res. 2013.[CrossRef]
95. Locke, B.; Forsgren, E.; Fries, I.; de Miranda, J.R. Acaricide treatment affects viral dynamics inVarroa destructor-infested honey bee colonies via both host physiology and mite control. Appl. Environ.Microbiol. 2012, 78, 227–235. [CrossRef] [PubMed]
96. Huleihel, M.; Isanu, V. Anti-herpes simplex virus effect of an aqueous extract of propolis. Isr. Med. Assoc. J.2002, 4, 923–927. [PubMed]
97. Hepburn, R.H.; Radloff, S.E. Honeybees of Africa; Springer: Berlin/Heidelberg, Germany; New York, NY,USA, 1998.
98. Pfaffl, M.W. A new mathematical model for relative quantification in real-time RT-PCR. Nucleic Acids Res.2001. [CrossRef]
99. Damiani, N.; Fernandez, N.J.; Maldonado, L.M.; Alvarez, A.R.; Eguaras, M.J.; Marcangeli, J.A. Bioactivity ofpropolis from different geographical origins on Varroa destructor (Acari: Varroidae). Parasitol. Res. 2010, 107,31–37. [CrossRef] [PubMed]
100. R Development Core Team. R: A Language and Environment for Statistical Computing; R Foundation forStatistical Computing: Vienna, Austria, 2014.
101. Masri, L.; Cremer, S. Individual and social immunisation in insects. Trends Immunol. 2014, 35, 471–482.[CrossRef] [PubMed]
102. Meunier, J. Social immunity and the evolution of group-living in insects. Philos. Trans. R. Soc. B Biol. Sci.2015. [CrossRef] [PubMed]
103. Shen, M.Q.; Cui, L.W.; Ostiguy, N.; Cox-Foster, D. Intricate transmission routes and interactions betweenpicorna-like viruses (Kashmir bee virus and Sacbrood virus) with the honeybee host and the parasitic Varroamite. J. Gen. Virol. 2005, 86, 2281–2289. [CrossRef] [PubMed]
104. Orsatti, C.L.; Missima, F.; Pagliarone, A.C.; Bachiega, T.F.; Bufalo, M.C.; Araujo, J.P.; Sforcin, J.M. PropolisImmunomodulatory action in Vivo on Toll-like receptors 2 and 4 expression and on pro-inflammatorycytokines production in mice. Phytother. Res. 2010, 24, 1141–1146. [PubMed]
105. Brutscher, L.M.; Daughenbaugh, K.F.; Flenniken, M.L. Antiviral defense mechanisms in honey bees.Curr. Opin. Insect Sci. 2015, 10, 71–82. [CrossRef] [PubMed]
106. Ryabov, E.V.; Wood, G.R.; Fannon, J.M.; Moore, J.D.; Bull, J.C.; Chandler, D.; Mead, A.; Burroughs, N.;Evans, D.J. A virulent strain of Deformed wing virus (DWV) of honeybees (Apis mellifera) prevails afterVarroa destructor-mediated, or in vtro, transmission. PLoS Pathog. 2014, 10, e1004230. [CrossRef] [PubMed]
107. Miguel, M.G.; Nunes, S.; Cruz, C.; Duarte, J.; Antunes, M.D.; Cavaco, A.M.; Mendes, M.D.; Lima, A.S.;Pedro, L.G.; Barroso, J.G.; et al. Propolis volatiles characterisation from acaricide-treated and -untreatedbeehives maintained at Algarve (Portugal). Nat. Prod. Res. 2013, 27, 743–749. [CrossRef] [PubMed]

Insects 2017, 8, 15 18 of 18
108. Teixeira, E.W.; Negri, G.; Meira, R.; Message, D.; Salatino, A. Plant origin of green propolis: Bee behavior,plant anatomy and chemistry. Evid.-Based Complement. Altern. Med. 2005, 2, 85–92. [CrossRef] [PubMed]
109. Popova, M.; Reyes, M.; Le Conte, Y.; Bankova, V. Propolis chemical composition and honeybee resistanceagainst Varroa destructor. Nat. Prod. Res. 2014, 28, 788–794. [CrossRef] [PubMed]
110. Locke, B. Natural Varroa mite-surviving Apis mellifera honeybee populations. Apidologie 2016, 47, 467–482.[CrossRef]
111. Pirk, C.W.W.; Human, H.; Crewe, R.M.; van Engelsdorp, D. A survey of managed honey bee colony losses inthe Republic of South Africa-2009 to 2011. J. Apic. Res. 2014, 53, 35–42. [CrossRef]
© 2017 by the authors; licensee MDPI, Basel, Switzerland. This article is an open accessarticle distributed under the terms and conditions of the Creative Commons Attribution(CC BY) license (http://creativecommons.org/licenses/by/4.0/).