inorganic and organic nitrogen cycling in chesapeake · pdf fileinorganic and organic nitrogen...
TRANSCRIPT

Vol. 15: 177-189,1998 l
AQUATIC MICROBIAL ECOLOGY Aquat Microb Ecol l Published July 2
Inorganic and organic nitrogen cycling in Chesapeake Bay: autotrophic versus heterotrophic
processes and relationships to carbon flux
Deborah A. B r o n k l r * , Patricia M. G l i b e r t 2 , Thomas C. t alone^, Susan Banahan3, Elisabeth Sahlsten4
'Department of Marine Sciences, University of Georgia. Athens, Georgia 30602-3636, USA 'Horn Point Laboratory, University of Maryland Center for Environmental Science, PO Box 775, Cambridge,
Maryland 21613, USA 3 ~ o a s t a l Oceans Office, NOAA, 1315 East-West Highway, Rm 15140, Silver Springs, Maryland 20910-3223, USA
'Department of General and Marine Microbiology, University of Goteborg, Medicinaregatan 9C. S-41390 Goteborg, Sweden
ABSTRACT: To define the role of dissolved organic nitrogen (DON) in Chesapeake Bay (USA) nitrogen cycling, we performed experiments in the mesohaline Chesapeake Bay dunng 3 seasons: May, during the mid to late spring bloom, August, when patchy summer blooms often develop, and October, after the fall overturn. Every 3 h for 30 h we measured ambient nitrogen concentrations and used "N trac- ers to determine uptake and regeneration rates of NH,' and urea, uptake rates of NO,- (NO; was mea- sured in October only), and rates of DON release due to NH,' uptake. Autotrophic production and dis- solved organic carbon (DOC) release were determined sunultaneously using 'v tracer techniques to compare with nitrogen flux rates We found that first, the water column nitrogen demand exceeded nitrogen regeneration in May but n~ t rogen regeneration was over 3 times greater than the nitrogen demand in October. Second, mean rates of autotrophic DON release were highest in May but hetero- trophic release was more important in summer and fall. Third, dunng all 3 studies, the C N ratio of DOC to DON release rates was 3.4 to 4.5, indicating release of nitrogen-rich compounds. Release of dissolved organic matter (DOM) \nth a low C:N ratio was corroborated by an observed increase in DON concen- trations from 7 to 4 2 pg-at. N I-' from May to August and a concomitant decrease in the C . N ratio of the ambient DOM pool from 36.6 to 8.8. These data suggest that Chesapeake Bay IS primarily autotrophic In the spring, but becomes progressively more heterotrophic later in the year. These data also suggest that DON is an Important intermediate in this transition and serves as a link between the allochthonous nitrogen-based autotrophic production In the spring and the autochthonous nitrogen-based hetero- trophic system in the summer and fall.
KEY WORDS: Nitrogen . Chesapeake Bay . Dissolved organic nitrogen . Dissolved organic carbon . C:N ratios
INTRODUCTION
Planktonic nutrient dynamics has been studied in Chesapeake Bay (USA) for several decades. The pic- ture emerging from this work is a system that is pre- dominantly autotrophic in the spring when large
amounts of new nitrogen, primarily in the form of No3-, enter the Bay via rivers (Malone et al. 1988, Smith & Kemp 1995). As the year progresses, the Bay becomes more heterotrophic in character with a planktonic conlmunity increasingly dependent on regenerated forms of nitrogen either from the sedi- ments or recycled within the water column (Malone et al. 1988, Smith & Kemp 1995). Consistent with this scenario, seasonal phytoplankton biomass and pro-
O Inter-Research 1998
Aquat Microb Ecol 15: 177-189, 1998
ductivity, integrated throughout the water column, are out of phase, wlth a spring accumulation of bio- mass fueled by riverine NO3- input and a summer productivity maximum fueled by benthic and water column nitrogen regeneration (Boynton & Kemp 1985, Malone et al. 1988, Kemp & Boynton 1992). The switch from a primarily autotrophic system to a pri- marily heterotrophic system is also accompanied by a change in the limiting factor of planktonic growth rates-phosphorus limitation predominates in the spring while nitrogen limitation predominates in the summer (Malone et al. 1996).
While the supply of new nitrogen, as NO3-, is great- est in the spring, maximum phytoplankton produc- tion, which is ultimately fueled by these spring-time nitrogen inputs, does not occur until summer (Kemp & Boynton 1984). The role dissolved organic nitrogen (DON) plays in this scenario is largely unknown because nutrienl studies in the Bay have focused pri- marily on the availability and fluxes of dissolved inor- ganic nitrogen (DIN; e.g. Horrigan et al. 1990, Fisher et al. 1992). In batch cultures and a number of other aquatic environments, however, DON has been shown to be a dynamic component of the nitrogen cycle (Collos 1992, Collos et al. 1992, 1996, Bronk et al. 1994, Lopez-Veneroni & Cifuentes 1994, Slawyk & Raimbault 1995). Specifically, in Chesapeake Bay we know that during the decline of the spring bloom, rates of DON release from phytoplankton can be quite high, and rates of uptake of recently released DON during these periods can rival rates of uptake of DIN (Bronk & Glibert 1991, 1993a). In addition, one form of DON, urea, can be an important source of nitrogen for the biota of the Bay, in the spring contributing from -6 % of the total nitrogen utilized in the northern reaches of the Bay to >30% in the south (Glibert et al. 1995).
This study is part of a continuing effort to incorporate the DON pool into our understanding of Chesapeake Bay nutrient dynamics. We measured rates of nitrogen uptake and release during 3 seasons in the mesohaline reach of the Bay to provide detailed pictures of organic and inorganic nitrogen cycling in the water column. Our objectives were: (1) to determine the short-term v;riabi!ity (h) in rztes of nitrogen uptake a n d release: (2) to compare gross NH,' uptake rates, which correct for 15N label lost to the DON pool, with traditionally measured net uptake rates (Bronk et al. 1994); (3) to compare DON release (assumed to be a primarily autotrophic process with the methods we employed) with NH,' and urea regeneration (assumed to be pri- marily heterotrophic in nature); and (4) to compare rates of nitrogen uptake and release with rates of car- bon uptake and release over short-term and seasonal time scales.
MATERIALS AND METHODS
Field sampling. We occupied an anchor station in the mainstem of Chesapeake Bay (Station #3 in Mal- one et al. 1991) on 15 to 16 May, 31 August to l Sep- tember, and 20 to 21 October 1988. During each sam- pling period, near-surface water was collected every 3 h for 30 h with either an acid.-washed Niskin bottle or a polyethylene bucket.
Concentrations and standing stocks. At each time point, water was first filtered through precombusted (450°C for 2 h) Whatman GF/F filters and flash frozen in liquid nitrogen for later determination of nutrient concentrations in the laboratory (within several weeks). Concentrations of NO3-, NOz-, and phosphate were determined with a Technicon AutoAnalyzer, con- centrations of urea were measured with the urease method (Parsons et al. 1984), concentrations of NH,' were measured manually with the phenol/hypochlo- rite technique (Parsons et al. 1984), and concentrations of DON were determined by the persulfate oxidation technique (Valderrama 1981). Water was also filtered through a 0.2 pm Nuclepore filter for subsequent determination of the concentration of dissolved pri- mary amines (DPA; Parsons et al. 1984). Concentra- tions of dissolved organic carbon (DOC) were mea- sured with wet persulfate digestion as originally described by Menzel & Vaccaro (1964) and as modified by McDowell et al. (1987). Concentrations of chloro- phyll a (chl a) were measured according to the fluoro- metric technique in Parsons et al. (1984). Particulate nitrogen (PN) and particulate carbon (PC) were ana- lyzed with a Control Equipment CHN analyzer.
Uptake and regeneration of inorganic nitrogen. At each time point, we used 15N tracer techniques to esti- mate nitrogen flux rates. We used nutrient concentra- tions from prior years to estimate the 15N additions that would yield about 10% enrichment over ambient lev- els. The initial atom % enrichment of the substrate pool was calculated based on the ambient concentration and the amount of I5N added. In the 1 5 ~ mass balance, final atom % enrichments were calculated in a similar fashion with the exception that the initial substrate concentration was corrected for the amount of sub- strate taken up during the incubation, based on the measured uptake rate. The target enrichment levels were achieved in May and October. Due to the highly variable nature of the ambient concentrations in August, however, enrichments were 31 + 17 and 71 +- 21 % for NH4+ and NO,-, respectively.
Incubations were done in 1 1 polycarbonate bottles, in on-deck flow-through incubators under simulated in situ light and temperature conditions. Incubations were ln~tiated within 20 min of sample collection, and all samples were incubated for -0.5 h; in high biomass

Bronk et al.. N a n d C c ycl~ng In Chesapeake Bay 179
waters such as Chesapeake Bay, this incubation time allows measurement of ambient rates while minimiz- ing the risk of substrate depletion (Wheeler et al. 1982, Glibert & Capone 1993). At the end of the incubation we filtered only enough sample, through precom- busted GF/F filters, to collect enough nitrogen on the filter for analysis; filtration times were -5 min in May and August and 10 min in October. Filters were subse- quently dried at 50°C, ampoulated, and analyzed by mass spectrometry (Glibert et al. 1991). We note that GF/F filters retain autotrophic phytoplankton, includ- ing most picoplankton, and about 50% of the het- erotrophic bacteria in Chesapeake Bay (Glibert et al. 1995). Therefore, our measurements include uptake by bacteria but likely do not represent total bacterial uptake.
The filtrate from the NH4+ incubation was collected, split into 2 aliquots, and frozen for later determination of ISN atom ?40 enrichment of the NH,' and DON pools (see below). The NH,+ atom % enrichment was deter- mined by distillation and evaporation followed by mass spectrometric analysis. These data were used to calcu- late the rate of NH,' regeneration and to correct the NH,' uptake rates for isotope dilution (Glibert et al. 1982).
Uptake and regeneration of urea. Urea uptake rates were determined with the same I5N tracer techniques used to measure rates of inorganic nitrogen uptake. Enrichment levels were -10% for May and October, and -25 % for August. Rates of urea regeneration were determined from isotope dilution in parallel 250 m1 samples enriched with the same concentration of I4C- labeled urea (Hansell & Goering 1989, Glibert &
Capone 1993). Urea uptake rates were corrected for isotope dilution.
Isolation of the DON pool. From the NH4+ incuba- tion experiments, one of the aliquots of filtrate was fil- tered through a 0.2 pm Nuclepore filter and frozen in liquid nitrogen for later processing. On shore, we mea- sured the DON concentration, as above, and we passed 9 m1 of the remaining filtrate through ion retar- dation resin (BioRad AG 11 A8), which removed inor- ganic ions (including NH,' and NO,-), leaving eluate containing the DON (Bronk & Glibert 1991, 199313). Eluates were boiled down to -2 ml, blotted onto a pre- combusted GF/F filter, and analyzed by mass spec- trometry (Bronk & Glibert 1991).
We note that DOW Chemical has changed the man- ufacturing process of the BioRad AG 11 A8 resin within the last few years. As a result of the manufacturing change, the new resin now retains variable amounts of DON. This DON retention is believed to be due to an accumulation of an organic film on the resin beads dur- ing manufacturing (BioRad pers, comm.). The original resin, including the resin we used in this study, did not
retain DON. We are presently investigating methods to manufacture the original form of the resin in the labo- ratory (Bronk unp.ub1. data).
Calculation of uptake rates. Uptake rates of NO,- and NO2 were calc.ulated according to the commonly used equations introduced by Dugdale & Goering (1967):
PN atU/oxs P = DIN atS;xs X Time X IPNI
where p is the uptake rate in pg-at. N 1-' h-'; PN at%xs is the ''N atom % enrichment of the PN minus atmos- pheric liN enrichment (typically 0.365) in atom %; DIN at%xs is the initial enrichment of the DIN pool minus atmospheric 15N enrichment in atom %; time is the period of incubation in hours; and [PN] is the concen- tration of PN in the sample at the end of the incubation in pg-at. N 1-l. In the case of NH4+ and urea, the at%xs in the denominator was corrected for isotopic dilution as described by Glibert et al. (1982) for NH4+ and Hansell & Goering (1989), as modified by Glibert &
Capone (1993), for urea. These rates are net uptake rates as they represent the I5N retained within the par- ticulate material at the end of the incubation (Bronk et al. 1994).
To calculate the gross NH4+ uptake rate, we first cal- culated the gross atom '% enrichment of the PN, which includes 'W measured in both the PN and the extra- cellular DON pools with the equation:
PNG at%xs =
([PN] X PN at%xs) +([DON] X DON at%xs) (2) [PNI
where PNG at%xs is the gross atom % enrichment of the PN pool modified to include I5N accumulated in the extracellular DON pool, minus atmospheric I5N enrich- ment in atom %; [PN] and [DON] are the concentra- tions of PN and DON respectively in pg-at. N 1-l; PN and DON at%xs are the atom % enrichments of the PN and DON pools minus atmospheric I5N enrichment in atom %. To calculate the final gross uptake rate (pG) we substitute PNG at%xs (from Eq. 2) for PN at%xs in Eq. (1) (Bronk et al. 1994, Collos pers. comm.) to gen- erate the following equation:
([PN] X PN atO%xs) + ([DON] X DON at%xs) PG =
DIN aty'oxs X Time (3 )
where p~ is the gross uptake rate in pg-at. N 1-' h-' and other terms are as described above.
Laws (1985) proposed that a distinction be made between an assimilation rate, A, and an apparent uptake rate, U. The traditionally determined rate, which we term the net uptake rate, is virtually identi- cal to the assimilation rate described by Laws (1985). However, our calculation of gross NH4' uptake rates
180 Aquat Microb Ecc
and the apparent uptake rate, U, are not the same. Our calculations are based on a direct measurement of the 15N content in the DON pool, whereas U 1s not.
Calculation of DON release rates. In the "NH,' incubations, the rate of DON release was calculated by subtracting the net NH,+ uptake rate (Eq . 1) from the gross NH,' uptake rate (Eq. 3; Bronk et al. 1994). The DON release rates we present here are net rates, because they are a measure of the DON which has been released from the phytoplankton and is present in the extracellular pool at the end of the incubation. We note that this DON release rate only represents DON release that results from NH,' uptake. If the atom % enrichments of the DON pool had been determined for incubations with other inorganic nitrogen sub- strates, the same formulations could be used.
The method of determining the rate of DON release presented here differs from a method previously reported (Bronk & Gliberi 1991, 1993b). Whereas both methods require isolation of the extracellular DON pool, the method presented here does not require a separate analysis of the 15N content of the intracellular organic pool, and is thus considerably less labor inten- sive.
To compare flux rates with changes in ambient nitro- gen pools, we calculated cumulative daily nitrogen flux rates by integrating the hourly rates, measured every 3 h, over a 24 h period by assuming that the mea- sured rate was constant for the -3 h that separated the individual rate measurements. The resulting rate is the mass of nltrogen taken up or released during a 24 h period expressed as pg-at. N 1-I d-l. We note that nitro- gen flux rates were measured at -09:OO and 12:OO h on 2 consecutive days; both of the rates measured at 09:OO and 3.2:00 h were averaged and then used in the calcu- lation to obtain the integrated flux for a 24 h period.
Error analysis. We were unable to perform duplicate I5N incubations. To estimate the variability associated with the final rate measurements, a propagation of error analysis was performed as described in Beving- ton (1969). The variance of the nutrient concentrations and atom % enrichments were calculated from repli- cate analyses (i.e. duplicates or triplicates depending on the analysis). This method provides a conservative cstlmate of the variance.
Uptake and release of carbon. Details of the meth- ods used to determine rates of carbon uptake and DOC release are described in Malone et al. (1991). In brief, whole water and prefractionated (1 pm Nuclepore fil- ter) samples were incubated with ',C-labeled NaHC03 for 6 h, beginning at dawn, and subsamples were with- drawn on an hourly basis. The rates reported in Mal- one et al. (1991), and used in this paper. were calcu- lated from the slope of the least squares regression line generated during the 6 h time-course. To calculate
daily rates, we multiplied the rate determined from the least squares regression by 16 h if the process was light dependent [i.e. dissolved inorganic carbon (DIC) uptake] or 24 h if it was not light dependent (i.e. DOC release). The amount of label incorporated was also measured after 24 h to determine autotrophic produc- tion for the whole water samples. The difference between hourly rates, determined in the short-term incubations, and the 24 h rates was used to estimate the respiration rate.
RESULTS
Ambient environmental conditions
Changes in the concentrations of inorganic nutrients were generally consistent with previous reports for Chesapeake Ray during spring, summer, and fall (Fig. 1A-F). In May, mean No3- concentrations ap- proached 30 pg-at. N 1-l, reflecting the large influx of nitrogen-rich freshwater into the Bay from the Susque- hanna River; concentrations of NO3- were depleted during the other months in the study (Fig. ID-F). In contrast, concentrations of the regenerated forms of ni- trogen (NH,', urea, and DPA) were relatively low in May, and the highest NH4+ concentrations were mea- sured in October (Fig. 1A-C). Large variations in urea and DPA were not observed between seasons, sug- gesting a tight coupling between uptake and regener- ation processes. Alternatively, concentrations of the bulk DON pool more than doubled from May to Au- gust, before decreasing again in October (Fig. ID-F). Phosphate concentrations were 0.10 + 0.06 in May, 0.18 + 0.08 in August, and 0.07 + 0.02 in October. Am- bient D1N:DIP ratios ranged from 84 to 430, ? to S?, and 74 to 184 in May, August, and October, respectively.
In August, concentrations of NO2- were very h ~ g h , nearly reaching 10 pg-at. N 1-' (Fig. 1E). The day before our August sampling began, the remnants of a tropical depression, 'Chris', passed through the Bay. Wind events can trigger a series of short-lived nutrient and microbial processes. In particular, wind mixing of NH,+ rich water, likely of sedimentary origin, across the pycnocline may have led to enhanced rates of nitri- fication; this response to storm-induced mixing in Chesapeake Bay has also been noted in McCarthy et al. (1984) and Horrigan et al. (1990).
The highest and most variable concentrations of PN and chl a were observed in August, and the lowest concentrations were seen in October (Fig. 1G-I). The mean and standard deviations of PN:chl a ratios were 1.0 + 0.2, 1.3 + 0.3, and 0.4 + 0.1 for May, August, and October, respectively, suggesting that the PN was composed largely of living phytoplankton or phyto-

Bronk et a l . . N and C cycling in Chesapeake Bay 181
Fig 1 Concentrations of NH,' ( m ) , urea ( v ) , dis- solved pnmary amines (DPA. V), No3- (e), NO2- (0), dissolved organic ni- trogen (DON, o), chlor- ophyll a (chl, m), and par- ticulate nitrogen (PN, r ) versus time of day for 3 die1 studies performed in the mesohaline Chesa- peake Bay. The black bars denote the dark
p e r ~ o d
May August October
.-.-a
DPA
- - - - 1 - . * - - - - - - - - -
plankton-derived material (McCarthy & Nevins 1986). During August, we observed a patch of 'brown' water between 12:00 and 18:OO h, coincident with substantial increases in the concentration of PN and chl a, and decreases in the concentrations of NH,', NO2-, and urea (Fig. 1). Sporadic and localized dinoflagellate blooms often develop in the summer in Chesapeake Bay (Loftus et al. 1972, Seliger et al. 1981), and it is likely that such a patchy bloom passed through our sampling site on the afternoon of Day 1 and returned 12 h later; such a patch may have either been carried with the tide or migrated vertically.
Rates of nitrogen uptake and release
Mass balances of I5N label were reasonably achieved for all uptake experiments. For the NO3- and urea incubations, 100 2 0.3 and 100 * 3.8% of the 15N label was accounted for in the combined PN and sub- strate pools at the end of the incubations. For the NH4+ measurements, 105 A 27% of the 15N label was accounted for in the combined PN, NH,', and DON pools at the end of the incubations; 15N in the DON pool alone accounted for 15 + 13, 4 * 4, and 1 k 1 % of the total 15N recovered in May, August, and October, respectively.
In general, rates of nitrogen uptake were highest overall in August and lowest in October (Fig. 2). We
Time of Day (h)
normalized uptake and DON release rates to ambient chl a concentrations (units were pg-at. N pg-' chl h-'; data not shown) and found the same patterns over the course of the 30 h study as we present in Figs. 2 & 3A-F. During May, uptake rates of all measured sub- strates were comparable, and NO3- uptake rates were the highest we measured during the 3 cruises. In August, however, net uptake rates varied by a factor of 15 (Fig. 2) . Unfortunately, rates of NO2- uptake were not determined in August when NO2- concentrations were high. By October, NH,' was the dominant nitro- gen form used.
Relative to uptake rates, the mean rates of DON release were similar between seasons (Fig. 3D-F). The cumulative amount of DON released during 24 h was highest in May and decreased throughout successive cruises (1.73, 1.29, and 0.82 pg-at. N 1-' d-' for May, August, and October, respectively). We note that we did not measure the production of DON during incuba- tions with NO3- or urea. Therefore, our estimates of DON release would be an underestimate of the total DON release rate. Mass balances of I5N for experi- ments with NO3- and urea, done in May and October, showed complete recovery of the 15N we added, and so we have no empirical evidence for significant rates of DON release; direct measurements are needed to con- firm this in future studies.
In all 3 studies, rates of DON release measured at dawn and dusk appeared to be higher than those mea-

182 Aquat Microb Ecol 15: 177-189, 1998
sured at other times during the day, though the rela- and dusk, and thus greater release due to 'sloppy tionship was not significant at the 95% confidence feeding'. level (Fig. 4). Cellular metabolites could be released as The cumulative amount of NH,+ regenerated per the cells shift from light dependent to non light depen- liter during 24 h was lowest in May and highest in dent reactions and vice versa. It 1s also possible that August ( l .? , 11.0, and 8.3 pg-at. N 1-' d-' for May, this pattern reflects greater grazing activity at dawn August, and October, respectively). Rates of regenera-
May August October
Time of Day (h)
Fig. 2. Net uptake rates of NH,' ( a ) , urea (v ) , NO3' (e), and NO2- (0, October only) versus time of day for 3 die1 studies performed in the mesohallne Chesapeake Bay. The black bars denote the dark period. Note the large change in scale in the October graph. Data are plotted with error bars indicating standard deviations; where error bars are not shown, error bars are smaller than the
symbols
May August October
Time of Day (h)
Fig. 3 Rates of (A-C) gross (v) and net (0 ) NFI,' uptake. (D-F) net dissolved organic nitrogen (DON) release resulting from NH,' uptake (a ) , and (G-I) NH4+ ( a ) and urea (v ) regeneration for 3 d ~ e l studies in the mesohallne Chesapeake Bay. Rates of DON release represent the difference between the gross and net NH,' uptake curves. Note that uptake rates are plotted with different scales while all DON release and NH,' and urea regeneration rates are plotted on the same scale. The black bars denote the dark period. Data are plotted with error bars i n d c a t ~ n g standard deviations; where error bars are not shown, error bars are smaller
than the symbols

Bronk et al.: N and C cycling in Chesapeake Bay 183
May August October
Fig 4 Mean (+ standard deviation) rates of dissolved organic nitrogen (DON) release measured during dawn and dusk (B) and at all other times of the day (E) during 3 die1 studies in
the mesohaline Chesapeake Bay
Percent of Total N Percent of Total N Uptake Regeneration
tion of urea were comparable in May and August and virtually undetectable in October (Fig. 3G-I).
Relationships between nitrogen uptake and release rea
From season to season, the relationship between total nitrogen .uptake and regeneration differed con- siderably, as did the percentage of each nitrogen form used and regenerated. During May and August, the ratio of total nitrogen release, NH,' regeneration, and urea regeneration to their respective uptake rates were all €1, indicating that uptake exceeded release (Table 1). In October, however, the total amount of nitrogen released and NH,' regenerated was -3 times greater than the amount of total nitrogen or NH4+ taken up. As a percentage of gross uptake, 32, 10, and 36 % of the total flux of NH,' into cells was released as DON in May, August, and October, respectively (Table 1).
In May, NH,+, No3- , and urea contributed roughly equal proportions to total nitrogen uptake, while in
Fig 5 Percentage of the total amount of nitrogen taken up as NH,', urea, and NO3- (NO2- uptake was only measured in October), and the percentdge of the total amount of nitrogen regenerated as NH,', .urea, and dissolved organic nitrogen
(DON) over a 24 h penod
August and October the proportion of NH,' taken up exceeded all the other substrates combined (Fig. 5). Likewise, in May, urea, NH,', and DON were all released or regenerated in roughly equal proportions. However, with time, the relative release of urea declined, such that by October, the contribution of urea to regenerated nitrogen was barely detectable. The contrib'ution of autotrophic DON release to total nitrogen release likewise decreased from May to August, and remained low in October (Fig. 5) .
Seasonally, the relative propor- tion of nitrogen in the PN, DIN
Table l . Autotrophic and heterotrophic nitrogen release relative to uptake. Rates of uptake are defined as the nitrogen taken up by organisms collected on a GF/F filter, which thus includes autotrophs as well as some heterotrophs. Nitrogen flux values were integrated over 24 h, assuming a measured rate was constant for the interval between measurements. Total nitrogen release includes NH,' and urea regenera- tion and DON release. Total nitrogen uptake includes gross NH,' uptake and net
N O 3 and urea uptake (NO; uptake was included in October)
Total N release NH.,' regeneration Urea regeneration DON release .
Total N i p t a k e Gross NH,- uptake Urea uptake NH,' uptake
May 0.4 1 0.32 0.51 0.32 August 0.76 0.86 0.43 0.10 October 2.87 3.69 0.24 0.36
and DON pools also changed (Fig. 6) . Coincident with these concentration changes were dra- matic shifts in the C:N ratio of the dissolved organic matter (DOM) .pool (Table 2) . In May, this ratio was 36.8, indicative of a relatively nitrogen poor mixture (Table 2) . In August, however, the C:N of the DOM pool had dropped to 8.8, and the mean DON concentration had increased from 7 to 42 1.1~-at. N 1-I (Fig. 6). By October, the con- centration of the DON pool was

184 Aquat Microb Ecol 15: 177-189. 1998
0 October
C-N = 17.7 20
PN DIN DON
Fig. 6. Concentrations of part~culate nltrogen (PN) , di.ssolved inorganic nitrogen (DIN!, and dissolved organic nitrogen (DON) during 3 die1 studies in the mesohaline Chesapeake Eay The C:N ratio of the entlre DON pool is glven above the DON bars. The C:N ratio of the DON pool present in May is
indicated during all 3 months by the light gray fill (8)
reduced by more than 50% from August, and the C:N ratio of the DOM pool had doubled to 17.7 (Table 2) . The C:N ratios of the particulate material a.veraged 8.5 in May and 5.8 in August (C:N values of the par- ticulate fracti.on were not available for October).
Table 2. Carbon to nitrogen molar rat~os for parti.culate and dissolved organic fractions and various rate processes. Ratios were calculated using data from Fig. 7 . Total carbon uptake includes autotrnphic production and bartenai aissoivea organic carbon (DOC) uptdke. Total nitrogen uptake includes gross :;I-l,+ uptake and net NO, and urea uptake (NO2-
uptake was included in October). nd: not determined
1 PC Total C uptake DOC DOC release ~ u 6 l K uptake DOG D O N release
hlav 8.5 3.6 36.8 3.4 August 5.8 3.6 8.8 4.5 October nd 22.5 17.7 4.4
Carbon flux
Autotrophic production, including autotrophic DIC uptake and DOC release, was lowest in May but com- parable in August and October (Table 3; Malone et al. 1991). Rates of DOC uptake and release were compa- rable in May and August but very low in October (Table 3; Malone et al. 1991). We estimated respiration rates for each study by calculating the difference between the carbon uptake rate measured in the 24 h incubation and the carbon uptake rate measured in the short-term incubation. This approach yielded esti- mates of respiration loss that were very similar to direct respiration measurements done in the mesohaline Chesapeake Bay in 1989/1990 by Smith & Kemp (1995; Table 3).
Turnover times
Turnover times for NO3- were longest in May, when NO3- concentrations were highest, and shortest in August, when No3- concentrations were near the limit of detection (Table 4 ) . Turnover times for the regener- ated forms of nitrogen, NH4+ and urea, were lowest in May and August, and increased several-fold in Octo- ber (Table 4 ) . Mean turnover times for DON were com- parable to NO3- in, the spring, and much longer than the inorganic nitrogen forms or urea in August and October (Table 4). The turnover times for DOC, at 40 to 87 d , were 8 times longer than DON turnover times in the spring but comparable in summer and fall (Table 4).
DISCUSSION
Odum (1956) introduced the use of the ratio of autotrophic production to total community respiration as an indicator of th.e relative importance of autotrophy versus heterotrophy in aquatic systems. Based on this principle, Smith & Kemp (1995) measured rates of plankton communi.ty production a.nd respiration and concluded that the mesohaline Chesapeake Bay is pri- marily al~totrophic in the spring and primarily het- erotrophic in the summer and fall. Our results m May, August, and October are consistent with these find- ings. From spring to fall, we observed a switch from a system in May dominated by autotrophic processes, in which rates of total nitrogen uptake exceeded regener- ation (Table 1.) and the ratio of autotrophic DON release to total release was the highest tve observed (Fig. 51, to one in October dominated by heterotrophic processes, in which total nitrogen regeneration was 3- fold greater than total nitrogen uptake (Table 1) and

Bronk et al.. N and C cycling in Chesapeake Bay 185 - - -
Table 3. Carbon flux estimates (taken from Malone et al. 1991) Autotroph~c production includes autotrophic dissolved organic carbon (DOC) uptake and DOC release. Estimated respiration rates were calculated by t ak~ng the difference between the carbon uptake rate measured in a 24 h incubation and the carbon uptake rate measured during a short-term 6 h time-course. Direct measurements of respiration made by S m ~ t h & Kemp (1995) in the mesohaline Chesapeake Bay are supplied for compar.ison
Autolrophic DOC DOC Estimated Smith & Kemp production uptake release respiration respirdtion meas.
(pm01 C I-] h- ') (pmol C 1- ' h ') (pm01 C: 1.' h- ' ) (pm01 C 1.' d.') (prnol C 1-' d-l) - - - - P P
May 2.03 0 146 0.24 14.1 16.5 August 2.67 0.170 0.24 21.9 21.0 October 2.67 0 049 0.014 28.2 13.5
heterotrophic NH,+ regeneration far exceeded auto- trophic DON release (Fig. 5). These data provide a consistent picture of a Bay relying on allochthonous new nitrogen in the spring, and becoming increasingly reliant on autochthonous regenerated nitrogen during the transition to summer and then fall. Here we discuss our experimental assumptions, the balance between carbon and nitrogen flux rates, and provide a synthesis of how carbon and nitrogen flux rates varied with season.
Experimental considerations and assumptions
To compare heterotrophic release with autotrophic release processes, we measured release of 3 nitrogen substrates: NH,', urea, and DON. Measurements of NH,+ and urea regeneration rates were based on iso- tope dilution, and therefore are measures of het- erotrophic release. With these techniques, we cannot separate the contribution of bacteria from other het- erotrophs. Generally, microzooplankton are responsi- ble for the bulk of NH,+ regenerated in a range of sys- tems, including summer in Chesapeake Bay (e.g. Harrison 1978, Glibert et al. 1992). However, the low C:N ratio of released DON we measured suggests that
Table 4. Turnover tunes (mean + SDI of NO3-, NOz-, NH4+, and urea (hours) and dissolved organic nitrogen (DON) and carbon (DOC) (days) measured in the mesohaline region of Chesapeake Bay during May, August, and October, nd: not
determined
May August October
No3' 120.0 * 21.6 5.3 * 7.7 6.0 * 16.8 NO2- nd nd 21.5 * 5.0 NH4 + 3.4 * 2.4 3.1 * 3.8 45.6 * 14.4 Urea 2.9 * 0.7 7.9 + 7.9 24.0 -t 7.2
DON 6.4 + 5.5 48.2 + 27.1 60.8 + 60.9 DOC 53.0 49.0 87.0
this material would be a substrate that would promote bacterial regeneration of NH4+ (Goldman et al. 1987, Jargensen et al. 1993).
In contrast, the method we used to measure DON release differs substantially from the isotope dilution methods used to measure NH4+ or urea regeneration. Our method for measuring DON release is dependent on cells becoming labeled with inorganic nitrogen (in this case, NH,+), so we view the DON release we mea- sured as largely an autotrophic process. Release of DON from autotrophic cells would include such pro- cesses as direct release across the cell membranes, cell death and lysis, grazer-mediated release (i.e. sloppy feeding), and release due to autotrophic viral infection. Release by bacteria may also occur, although it would likely be a small percentage of the release from autotrophic cells.
Balance between carbon and nitrogen uptake and release
The carbon and nitrogen flux data were used to esti- mate a number of C:N relationships (Table 2 , Fig. 7 ) . The C:N ratio of total carbon to total nitrogen uptake was below the Redfield ratio in May, suggesting a nitrogen sufficient plankton community (Redfield 1958; Table 2 ) . Ratios of C:N uptake below Redfield proportions have previously been documented for the mesohaline Chesapeake Bay during spring (Glibert et al. 1995), as well as for the coast of Brazil (Metzler et al. 1997), and the equatorial Pacific (McCarthy et al. 1996) during strong upwelling conditions. These low ratios may have resulted from uptake of nitrogen in excess of growth requirements (for example, diatoms have the capacity for large internal storage pools of nitrogen; Wheeler et al. 1983), light limitation of carbon uptake due to the shallow euphotic zone, or nitrogen uptake by heterotrophic bacteria. In May, a likely cause of the low C:N uptake ratios was the dominance of diatoms and their capacity for maintaining large internal stor- age pools of nitrogen. In August, the C:N ratio for car-
186 Aquat Microb Ecol 15: 177-189, 1998
- --
bon and nltrogen uptake was again below Redfield found in October, suggest a physiologically stressed proportions at 3.6. In August, however, a more likely assemblage. cause for the low ratios was substantial uptake of nitro- The uptake and release of DOM appears to be sea- gen by bacteri.a; bacterial productivity is at an annual sonally out of phase, resuIting in an accumulation of maximum in the summer (Boynton et al. 1982, h4alone nitrogen-rich DOM from spring to summer and then 1992, Shiah & Ducklow 1994). In contrast to May and utilization of this material from summer to fall. The August, the C:N ratio of uptake in October was 22.5, C:N ratio of the released DOM was very low, 3.4 to approximately 4-fold higher than Red.field proportions 4.5, during all 3 seasons (Table 2), which indicates (Table 2). Ratios of C:N uptake in excess of Redfield release of nitrogen-rich compounds, such as DPA. The proportions, combined with the very low uptake rates, lowest mean ratio was observed in May, when con-
centrations of DPA were the highest mea- sured (Fig. l ) .
The low C:N ratios of D0C:DON release rates are consistent with the large changes
Hererorrophic we observed between studies in the C:N grazing (C) Total N relcasc
ratio of the dmbient DOM pool (Fig. 6). In Autotrophicl May, the DOM pool had a C:N ratio of 36.8, bacterial N uptake probably reflecting the influx of carbon-rich
DON rclcase terrestrial or marsh-derived organic matter during the spring freshet (Table 2) ; for
Total C example, humic substances, a prominent Aurorrophic/ DOC release component of terrestrial and marsh-derived bocrerial C ~rprake DOM, have C:N ratios ranging from 40
(Moran & Hodson 1994) to 70 (Bano et al.
May 1997). By August, the C:N ratio of the DOM pool had decreased to 8.8 (Table 2). If we make the assumption that the high C:N
W Total N 13.8
Total N DON
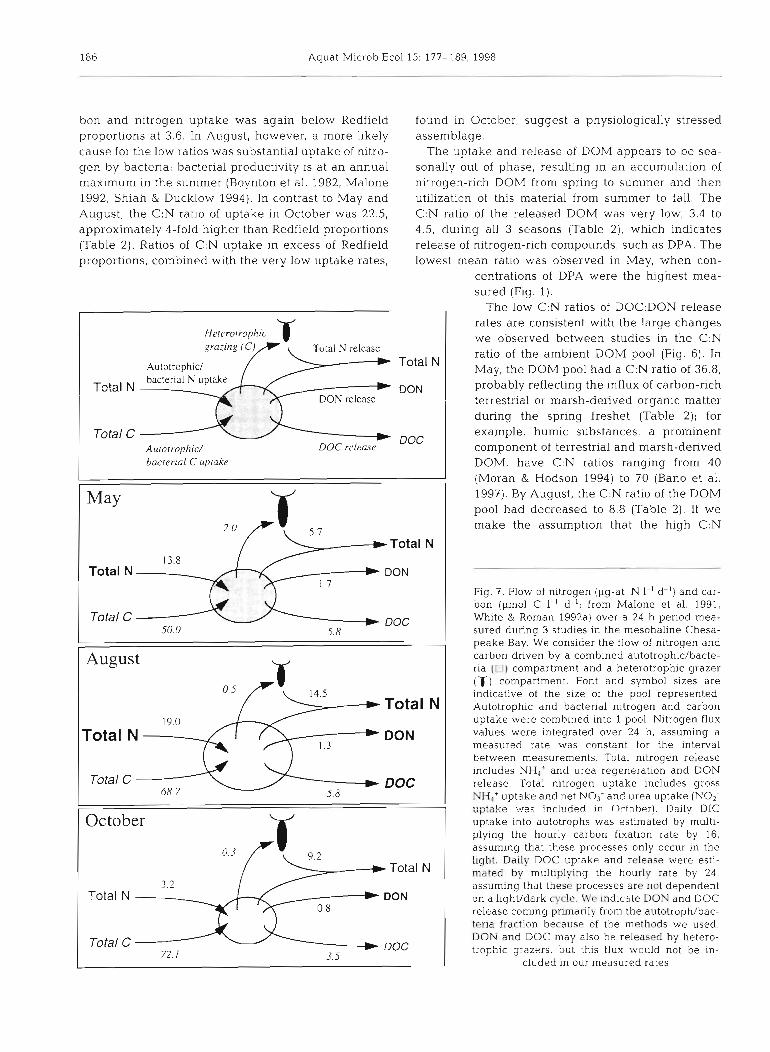
Fig. 7. Flow of nitrogen (pg-at. N I-' d-') and car- bon (pm01 C 1.' d-'; from Malone et al. 1991,
Total C W DOC 50.0 5.8
W Total N
' DON
DOc
October
,Total N 3.2
Total N DON
Total C 72 1
W DOC 3.5
Whlte & Roman 1992a) over a 24 h perlod mea- sured during 3 studies in the mesohaline Chesa- peake Bay. We consider the flow of nitrogen and carbon driven by a combined autotrophic/bacte- rIa (01 compartment and a heterotrophic grazer ('() compartment. Font and symbol sizes are indicative of the size of the pool represented. Autotrophic and bacterial nitrogen and carbon uptake were combined into 1 pool. Nitrogen flux values were ~ntegrated over 24 h, assuming a measured rate was constant for the interval between measurements. Total nitrogen release includes NH4' and urea regeneration and DON release. Total nltrogen uptake includes gross NH,' uptake and net N O , and urea uptake (NO2- uptake was inc!uded in Ortoher!. Daily DIC uptake into autotrophs was estimated by multi- plying the hourly carbon fixation rate by 16, assuming that these processes only occur in the I~ght . Daily DOC uptake and release were esti- mated by multiplying the hourlv rate by 24. assuming that these processes arc not dependent on a light/dark cycle. We indicate DON and DOC release coming primarily from the autotroph/bac- teria fraction because of the methods we used. DON and DOC may also be released by hetero- trophic grazers, but this flux would not be in-
cluded in our measured rates

Bronk et al.: N and C c :ycllng in Chesapeake Bay 187
DOM we measured in May was refractory and remained in the water column, the C:N of the DOM that was added to this pool from May to August would require a C:N of -3.1; this is consistent with the low C:N ratios we measured for D0C:DON release. By October, the concentration of the DON pool was reduced by more than 50% from August, and the C:N ratio of the DOM pool had doubled to 17.7. As the biota of the Bay apparently relied more on regenerated nitrogen throughout the summer, the increase in the C:N ratio of the DOM pool observed in October could be due to preferential use of nitrogen-containing organic moieties resulting in the accumulation of rela- tively carbon-rich DOM (Sambrotto et al. 1993).
Seasonal synthesis
Our results in May are consistent with previous observations in Chesapeake Bay which suggest that the Bay is primarily autotrophic in the spring and dependent on new N O , inputs. Based on trends in chl a concentrations and primary production measured in the mesohaline Chesapeake Bay during 1988 (Mal- one et al. 1991), our May cruise appeared to take place during the mid to late spring bloom. Concentrations of NO3- were still elevated during our study and chl a concentrations were approaching the seasonal maxi- mum (-19 pg chll-') measured by Malone et al. (1991). The spring bloom in Chesapeake Bay is usually diatom based and typically declines by mid-May due to inor- ganic nutrient limitation of biomass production (Sell- ner & Brownlee 1988, Conley & Malone 1992, Glibert et al. 1995). The decline of the spring bloom also tends to mark the change from a plankton community whose growth rate, as opposed to biomass accumulation, is limited by phosphorus to one limited by nitrogen (Mal- one et al. 1996). The high DIN:DIP ratio we measured (249 ? 92) and long turnover times of the DIN pool (120 rt 22 h for No3- alone; Table 4) are consistent with a trend towards phosphate limitation in the spring (Mal- one et al. 1996).
Quantitatively, more DON was released from autotrophs in May than during August or October. In parallel experiments with ours, White & Roman (1992a) found that grazing rates were also highest in May relative to the other 2 seasons (Fig. 7). This sug- gests that breakage of cells during 'sloppy feeding' may have contributed to the relatively high DON release rates we measured. While grazing rates of the macrozooplankton were at a seasonal high, our measured nitrogen regeneration rates were at a sea- sonal low (Fig. 3G). During this time of year, how- ever, it would be expected that the macrozooplank- ton would be retaining much of their incorporated
nitrogen for growth and egg production (White & Roillan 199213).
Our results in August are consistent with previous observations in Chesapeake Bay which suggest the Bay becomes increasingly heterotrophic in the sum- mer, as well as having an increased dependence on regenerated NH,+ (Malone et al. 1988, Smith & Kemp 1995). As a percentage of total nitrogen regeneration, heterotrophic regeneration increased from 70% in May to over 93% in August (Fig. 5).
The August study took place immediately after a tropical depression passed through the area. During this study, we observed patches of chl a-rich water alternating with patches of increased NH,', urea, and NO2- concentrations (Fig. lB, E). Increased concentra- tions of NH,' may have been the result of sediment regeneration and then transport to the surface during the storm. Benthic regeneration rates in the mesoha- line Bay are at a seasonal maximum during the sum- mer (Kemp & Boynton 1981), and are believed to sup- port the summer productivity maximum in the Bay (Kemp & Boynton 1984). The ratio of our measured NH,' regeneration to NH4+ uptake was 0.86 in August, suggesting that another nitrogen source, such as release from the sediments, was necessary to sustain the plankton nitrogen demand (Table 1).
In general, Chesapeake Bay is also characterized by nitrogen limitation of biomass specific rates in the sum- mer (Malone et al. 1996). Consistent with this scenario, D1N:DIP ratios (7 to 57) were much lower than those measured in May and, at times, even dropped below the Redfield ratio. Turnover times for DIN decreased but turnover times for organic nitrogen (urea and DON) increased (Table 4). Also, nitrogen use was less diverse, with NH,+ being the dominant substrate used, perhaps reflecting heterotrophic bacterial utilization (Kirchman 1994). The lower mean particulate C:N ratio measured in August (5.8 compared to 8.5 in May; Table 2) would be consistent with an increase in bac- terial biomass.
The relative proportion of DON release to gross NH4+ uptake in August was the lowest we measured at 10% (Table 1). This low proportion of DON release to NH4+ uptake could be due to rapid incorporation of recently released DON, a process which was likely occurring during the warm summer month of August, particularly in view of the nitrogen-deficient status of the Bay. Alternatively, this low ratio of release to uptake could reflect the lower abundance of grazers observed during the August cruise (White & Roman 1992a).
Our results in October are again consistent with the results of previous observations that suggest the meso- haline Chesapeake Bay is predominantly hetero- trophic in the fall (Smith & Kemp 1995). Heterotrophic

188 Aquat Microb Ec
ni t rogen regenerat ion w a s 3 to 4 times higher than t h e primarily autotrophic nitrogen d e m a n d (Table 1). In sp i te of t h e relatively h igh concentrations of ambien t DIN a n d favorable DIN:DIP ratios, ni t rogen u p t a k e rates w e r e t h e lowest of t h e seasons s tudied a n d D O N release rates w e r e relatively high, t h e combination of which suggests a nutrient-stressed assemblage .
Conclusions
W e w e r e ab le to m e a s u r e a broad sui te of nitrogen a n d carbon fluxes in t h e near-surface wate rs of Chesa- p e a k e Bay dur ing 3 cruises t o provide a m o r e compre- hensive view of t h e dynamics of these pools t h a n h a s b e e n available to da te . We found that wate r column ni t rogen d e m a n d exceeded ni t rogen regenerat ion in t h e spring bu t nitrogen regenerat ion w a s over 3 times g r e a t e r t h a n the ni t rogen d e m a n d by t h e fall. M e a n rates of autotrophic D O N re lease w e r e highest i n M a y b u t heterotrophic release w a s m o r e important in s u m - m e r a n d fall. During all seasons, t h e C : N ratio of the released D O M w a s in t h e r a n g e of 3.4 to 4.5, suggest- ing release of nitrogen-rich compounds such a s a m i n o acids. Release of D O M with a low C:N ratio w a s cor- roborated by observed c h a n g e s i n t h e ambien t D O N pool, which increased in concentration over 4-fold while t h e C : N ratio of the D O M pool decreased by a factor of 4.
T h e s e d a t a provide a consistent picture of a system tha t is primarily autotrophic i n t h e spring, b u t becomes progressively more heterotrophic la ter in the year. T h e s e d a t a also suggest that D O N is an important intermediate in this transition a n d serves a s a link b e t w e e n t h e allochthonous ni t rogen-based autotrophic production in t h e spring a n d t h e autochthonous nitro- gen-based heterotrophic system i n t h e summer a n d fall.
Acknowledgements. We thank S. Pike and B. Wendler for assistance in the field, and H . Ducklow for the opportunity to participate in the cruises. T Fisher graciously provided the DOC data. We acknowledge helpful discllqsions of rate calcu- lations with Y Collos, G . Slawyk, and P. Raimbault. This research was supported by NSF grant OCE-88-17585 to P.M.Z.; WSF yralri GCE-3522617 ts ?.FVf.G. ~zc! Z.A.E., Sca Grant PNA66RG0282 to D.A.B., and a post-doctoral scholar- ship to E.S. from the Swedish Natural Science Research Counc~l. This is contnbution number 3064 from the University of Maryland Center for Environmental Science.
LITERATURE CITED
Bano N, Moran MA, Hodson RE (1997) Bacterial utilization of dissolved humic substances from a freshwater swamp. Aquat Microb Ecol 12:233-238
Bevington PR (1969) Data reduction and error analysis for the
physical sciences. McGraw-Hill, Nrw York, p 56-65 Boynton WR, Kemp WM (1985) Nutrient regeneration and
oxygen consumption by sediments along an estuanne salinity gradient. Mar Ecol Prog Ser 23:45-55
Boynton WR, Kemp WM, Keefe CW (1982) A comparative analysis of nutrients and other factors influencing estuar- ine phytoplankton production. In: Kennedy VS (ed) Estu- arine comparisons. Academic Press, New York, p 69-90
Bronk DA, Glibert PM (1991) A ''N tracer method for the measurement of dissolved organic nitrogen release by phytoplankton. Mar Ecol Prog Ser 77:171-182
Bronk DA, Glibert PM (1993a) Application of a ''N tracer method to the study of dissolved organic nitrogen uptake dunng spring and summer in Chesapeake Bay. Mar Biol 115.501-508
Bronk DA. Glibert PM (1993b) Contrasting patterns of dis- solved organic nitrogen release by two size fractions of estuarine plankton during a period of rapid NH,+ con- sumptiot? and NO?- production. Mar Ecol Prog Ser 96: 291-299
Bronk DA, Glibert PM, Ward BB (1994) Nitrogen uptake, dis- solved organic nitrogen release, and new production. Science 265:1843-1846
Collos Y (1992) Nitrogen budgets and dissolved organic mat- ter cycling. Mar Ecol Prog Ser 90:201-206
Collos Y , Descolas-Gros C, Mornet F (1996) Die1 variation in dissolved organic nitrogen in a coastal pond: relationships wlth carbon and nltrogen metabolism. J Exp Mar Biol Ecol 202:177-189
Collos Y, Dohler G, Biermann I (1992) Production of dissolved organic nitrogen during uptake of nitrate by Synedra planctonica: implications for estimating new production in the oceans. J Plankton Res 14:1025-1029
Conley DJ, Malone TC (1992) Annual cycle of dissolved sih- cate in Chesapeake Bay: implicabons for the production and fate of phytoplankton biomass. Mar Ecol Prog Ser 81: 121-128
Dugdale RC, Goering JJ (1967) Uptake of new and regener- ated forms of nitrogen in primary productivity. L~mnol Oceanogr 12:196-206
Fisher TR, Peele ER, Ammerman JW, Harding LW Jr (1992) Nutrient limitation of phytoplankton in Chesapeake Bay. Mar Ecol Prog Ser 82:51-63
Glibert PM, Capone DG (1993) Mineralization and assimila- tion in aquatic, sediment, and wetland systems In: Knowles R, Blackburn TH (eds) Nitrogen isotope tech- niques in plant, soil, and aquatic systems. Academic Press, New York, p 243-272
Glibert PM, Conley DJ, Fisher TR, Harding LW Jr, Malone TC (1995) Dynamics of the 1990 winter/spring bloom in Chesapeake Bay. Mar Ecol Prog Ser 122:27-43
Glibert PM, Garside C, Fuhrman JA, Roman MR (1991) Time- dependent coupling of inorganic and organic nitrogen uptake and regeneration in the plume of the Chesapeake Bay estuary anrl i ts regulation by large heterotrophs. Limnol Oceanogr 36:895-909
Glibert PM, Lipschultz F, McCarthy JJ , Altabet MA (1982) Isotope dilution models of uptake and reminerahzat~on of ammonium by marine plankton. L~mnol Oceanogr 27: 639-650
Glibert PM, Miller CA, Garside C, Roman MR, McManus GB (1992) NH,' regeneration and grazing: interdependent processes in size-fractionation I iNHj- experiments. Mar Ecol Prog Ser 82~65-74
Goldmdn JC, Caron D, Dennett MR (1987) Reg'ulation of gross growth efficiency and ammonium regeneration in bacteria by substra.te C:N rat~o. Limnol Oceanogr 32:1239-1252

Bronk et al.: N and C cycling in Chesapeake Bay 189
Hansell PA, Goerlng J J (1989) A method for estimating uptake and production rates for urea in seawater using I4C urea and I5N urea. Can J Fish Aquat Sci 46198-202
Harrison WG (1978) Experimental measurements of nitrogen remineralization in coastal waters. Limnol Oceanogr 23: 684 -694
Horrigan SG, Montoya JP. Nevins JL, Mc(:arthy JJ, Ducklow H, Goericke R, Malone T (1990) Nitrogenous nutrient transformations in the spring and fall in the Chesapeake Bay. Estuar Coast Shelf Sci 30:369-391
Jsrgensen NOG, Kroer N, Coffin RB, Yang XH, Lee C (1993) Dissolved free amino acids, combined amino acids, and DNA as sources of carbon and nitrogen to marine bacteria. Mar Ecol Prog Ser 98:135-148
Kemp WM, Boynton WR (1981) External and ihternal factors regulating metabolic rates in an estuarine benthic commu- nity. Oecologia 51 :19-27
Kemp WM, Boynton WR (1984) Spatial and temporal coupling of nutrient inputs to estuarine primary production: the role of particulate transport and decomposition. Bull Mar Sci 35.522-535
Kemp WM, Boynton WR (1992) Benthic-pelagic interactions: nutrients and oxygen dynamics. In: Smith DE, Leffler M, Mackiernan G (eds) Oxygen dynamics in the Chesapeake Bay-a synthesis of recent results. Maryland Sea Grant College, College Park. p 149-209
Kirchman DL (1994) The uptake of inorganic nutrients by het- erotrophic bacteria. Microbial Ecol28:255-271
Laws EA (1985) Analytical models of NII,' uptake and regen- eration experiments. Limnol Oceanogr 30:1340-1350
Loftus ME, Subba Rao DV, Seliger HH (1972) Growth and dissipation of phytoplankton in Chesapeake Bay. I. Response to a large pulse of rainfall. Chesapeake Scl 13:282-299
Lopez-Veneroni D, Cifuentes LA (1994) Transport of dis- solved organic nitrogen in Mississippi River plume and Texas-Louisiana continental shelf near-shore waters. Estuanes 17-796-808
Malone TC (1992) Effects of water col.umn processes on dls- solved oxygen, nutrients, phytoplankton, and zooplank- ton. In: Smith DE, Leffler M, Mackiernan G (eds) Oxygen dynamics in the Chesapeake Bay. Maryland Sea Grant College, College Park, p 61-112
Malone TC, Conley DJ, Fisher TR, Glibert PM, Harding LW (1996) Scales of nutrient limited phytoplankton productiv- ity in Chesapeake Bay. Estuaries 19:371-385
Malone TC, Crocker LH, Pike SE, Wendler BM1 (1988) Influ- ences of river flow on the dynamics of phytoplankton pro- duction in a partially stratified estuary. Mar Ecol Prog Ser 48:235-249
Malone TC, Ducklow HW, Peele ER, Pike SE (1991) Pico- plankton carbon flux in Chesapeake Bay. Mar Ecol Prog Ser 78:ll-22
McCarthy JJ, Garside C, Nevins JL, Barber RT (1996) New production along 140°W in the equatorial Pacific during
. and following the 1992 El Nino event. Deep Sea Res I1 43: 1065-1093
McCarthy JJ , Kaplan W, Nevins JL (1984) Chesapeake Bay nutrients and phytoplankton dynamics. 2. Sources and sinks of NO2-. Limnol Oceanogr 29184-98
McCarthy JJ, Nevins JL (1986) Utilization of nitrogen and phosphorus by primary producers in warm-core ring 82-B
Editorial responsibility: Fereidoun Rassoulzadegan, Villefranche-sur-Mer, France
following deep convective mixing. Deep Sea Res 33: 1773-1788
McDoivell WH, Cole JJ , Driscoll CT (1987) Simplified version of the ampoule-persulfate method for determination of dissolved organic carbon. Can J Fish Aquat Sci 44: 214-218
"vlonzel DW, Vaccaro RF (1964) The measurement of dis- solved and particulate carbon in seawater. Limnol Oceanogr 9:138-142
Metzler P. Glibert P, Gaeta S, Ludlam J (1997) New and regenerated production in the South Atlantic off Brazil. Deep Sea Res 44:363-384
Moran MA, Hodson RE (1994) Dissolved humic substances of vascular plant origin in a coastal marine environment. Linlnol Oceanogr 39:762-771
Odum HT (1956) Primary production in flowing waters. Lim- no1 Oceanogr 1:102-117
Parsons TR, Maita Y, L a b C (1984) A manual of chemical and biological methods for seawater analysis Pergamon Press, Oxford, p 173
Redfleld AC (1958) The biological control of chemical factors in the environment. Am Sci 46205-221
Sambrotto RN, Savidge G, Robinson C, Boyd P, Takahashi T, Karl DM, Langdon C, Chipman D, Marra J, Codispoti L (1993) Elevated consumption of carbon relative to nitro- gen in the surface ocean. Nature 363:248-250
Seliger HH, McKinley WH, Biggley WH. Rivkin RB, Aspden KRH (1981) Phytoplankton patchiness in frontal regions. Mar Biol61:119-131
Sellner KG, Brownlee DC (1988) Chesapeake Bay Water Quality Monitoring Program: Phytoplankton and Micro- Zooplankton Component Data Summary. Maryland Department of the Environment. Baltimore
Shiah FK, Ducklow HW (1994) Temperature and substrate regulation of bacterial abundance, production and specific growth rate in Chesapeake Bay, USA. Mar Ecol Prog Ser 103:297-308
Slawyk G, Raimbault P (1995) Simple procedure for simulta- neous recovery of dissolved inorganic and organlc nitro- gen in I5N-tracer experiments and improving the isotopic mass balance. Mar Ecol Prog Ser 124.289-299
Smith EM, Kemp WM (1995) Seasonal and regional variations In plankton community production and respiration for Chesapeake Bay. Mar Ecol Prog Ser 116:217-231
Valderrama J C (1981) The simultaneous analysis of total nitrogen and total phosphorus in natural waters. Mar Chem 10:109-122
Wheeler PA, Glibert PM, McCarthy J J (1982) Ammonium uptake and incorporation by Chesapeake Bay phyto- plankton: short term uptake kinetics. Limnol Oceanogr 27. 1113-1128
Wheeler PA, Olson RJ, Chishold SW (1983) Effects of photo- cycles and periodic ammonium supply on three marine phytoplankton species. 11. Ammonium uptake and assimi- lation. J Phycol 19528-533
White JR, Roman MR (1992a) Seasonal study of grazing by metazoan zooplankton in the mesohaline Chesapeake Bay. Mar Ecol Prog Ser 86251-261
White JR, Roman MR (199213) Egg production by the calanoid copepod Acartia tonsa in the mesohaline Chesapeake Bay: the importance of food resources and temperature. Mar Ecol Prog Ser 86:239-249
Submitted: March 13, 1997; Accepted: January 12, 1998 Proofs received from authorls): June 8, 1998