changes in nitrogen cycling following the clearcutting of ... · changes in nitrogen cycling...
TRANSCRIPT
BOREAL ENVIRONMENT RESEARCH 3: 9–21 ISSN 1239-6095Helsinki 7 July 1998 © 1998
Changes in nitrogen cycling following theclearcutting of drained peatland forests insouthern Finland
Mika Nieminen
The Finnish Forest Research Institute, Vantaa Research Centre, P.O. Box 18,FIN-01301 Vantaa, Finland
Nieminen, M. 1998. Changes in nitrogen cycling following the clearcutting ofdrained peatland forests in southern Finland. Boreal Env. Res. 3: 9–21. ISSN1239-6905
The effects of forest clearcutting on the leaching of organic N, NH4+-N and NO3
–-N andthe processes likely to influence them were studied in two Norway spruce (Picea abies)dominated catchments located on nutrient-rich old peatland drainage areas in southernFinland. The concentrations of NH4
+-N in precipitation reaching the ground increasedafter clearcutting. Those of NO3
–-N increased in the area where the atmospheric Ndeposition was average, but decreased in the area subjected to higher than average Ndeposition. Ammonium-N concentrations in percolation water passing through the sur-face peat increased, both under slash-piles and in slash-free areas. Gaseous N2O and N2
emissions or leached amounts of N2O were not influenced by clearcutting. Organic Nconcentrations in runoff increased immediately after clearcutting, whereas the concen-trations of NH4
+-N and NO3–-N only increased after the first growing season after cut-
ting. The causes for increased runoff nitrogen concentrations are discussed.
Introduction
The effects of forest clearcutting on leaching ofelements from mineral soils have long been ofgreat concern, e.g. in North America (Bormannet al. 1968, Verry 1972, Martin et al. 1985, Mar-tin and Harr 1988, Tiedemann et al. 1988) andSweden (Wiklander 1981, Grip 1982, Rosén andLundmark-Thelin 1987). Recognition of the ef-fects of clearcutting on nutrient losses from min-eral soils in Finland has also increased in recentyears (Kubin 1995, Lepistö et al. 1995). How-
ever, the effects of clearcutting on leaching ofnutrients from peatlands has received little atten-tion (cf. Knighton and Stiegler 1980, M. Ahtiainenand P. Huttunen unpubl.). Results concerningleaching from clearcutting old drainage areas havenot been published.
The area of peatlands in Finland is about 10million hectares, covering one third of the totalland area. About half of this area has been drainedfor forestry purposes. The ability to predict theresponse of nitrogen leaching to clearcuttings ondrained peatlands would thus be important for

10 Nieminen • BOREAL ENV. RES. Vol. 3
water quality planning and protection. Achievingsuch a predictive capability requires an under-standing of the effects of clearcutting on all theprocesses controlling the nitrogen cycle (Fig. 1),including nitrogen inputs (precipitation, gas ab-sorption, N fixation), internal transformations(mineralization, nitrification, denitrification, im-mobilization, plant uptake and litter production),and nitrogen outputs (leaching of organic and in-organic nitrogen, gaseous nitrogen emissions andleaching of dissolved N2O).
Clearcutting has the immediate effect of re-moving the large absorptive surface of the foreststem, branches and canopy. This would have theeffect of decreasing nitrogen inputs by gas ab-sorption but increasing the amount of wet deposi-tion nitrogen at the soil surface. The adsorptionof N from wet depositon by tree canopies in theboreal zone has been shown in a number of stud-ies (e.g. Hyvärinen 1990). Regardless of the ex-tent of change in wet and gaseous nitrogen depo-sition, the effect of clearcutting on the leaching ofnitrogen from clear-cut basins may be most pro-nounced in areas subjected to higher than aver-age N deposition, particularly if N deposition ex-ceeds the demand by ground vegetation and mi-cro-organisms and the adsorption capacity of thesoil (i.e. “nitrogen saturated” systems). The im-portance of atmospheric nitrogen fixation to thenitrogen budget of peatlands is poorly known.
The most immediate effect of clearcutting onthe internal cycle of nitrogen is the tremendousreduction in plant uptake. According to Finér(1989), the annual uptake of nitrogen in well-de-veloped peatland forests varies from 26 to 49 kgha–1. Because of the climatic conditions prevail-ing in Finland, the re-establishment of nitrogen
Fig. 1. A simplified model of nitrogen cycle in forestecosystems. Redrawn according to Vitousek (1981).
Table 1. Basic information on study areas.—————————————————————————————————————————————————
Ruotsinkylä Vesijako—————————————— ——————————————Clear-cut Control Clear-cut Control
—————————————————————————————————————————————————Catchment area, ha 7.8 3.7 4.3 5.5Clear-cut area, ha 2.6 – 3.1 –Peatlands, ha 1.9 1.4 2.5 4.9Peatland site type1) Rhtkg Mtkg Mtkg MtkgPeat depth, m 1.0 0.5 0.5 1.0Basic drainage year 1927 1932 1914 1914Stand volume, m3 ha–1 234 250 259 249Tree species, % of volume
Pinus sylvestris 0 0 4 10Picea abies 100 100 90 85Betula spp. 0 0 6 5
—————————————————————————————————————————————————1) According to Heikurainen and Pakarinen (1982): “Herb-rich type (Rhtkg) is usually spruce-dominated with anadmixture of hardwoods. It has developed after the drainage of peatlands of the highest fertility. The groundvegetation is characterized by an abundance of ferns, shrubs and herbs, both in number and in coverage (e.g.Rubus idaeus, Oxalis ecetosella, Athyrium filix-femina).”“Vaccinium myrtillus type (Mtkg) has developed from moderately fertile peatlands. Spruce is usually the dominanttree species; however, sites which have developed from the most fertile pine swamps may be dominated bypine, but in this case birch is also usually frequent. The ground vegetation is characterized by the occurrence ofVaccinium myrtillus and V. vitis idaea, whilst in the bottom layer, Hylocomium splendens is conspicuous. Thefrequent occurrence of certain herbs (Melampyrum spp., Trientalis europaea, Orthilia secunda) is also typicalof this site.”

11BOREAL ENV. RES. Vol. 3 • Clearcutting and nitrogen cycling
uptake after clearcutting may take a long time. Atthe same time that plant uptake is reduced, con-ventional cutting adds live needles, leaves andbranches to the soil surface. If this material is rap-idly mineralised, the loss of nitrogen from clear-cut areas may sharply increase. Because of thehigh C/N ratio of slash, nitrogen immobilizationwill be greater than mineralization at first. De-composition and immobilization gradually reducethe C/N ratio of the substrate until net nitrogenmineralization occurs. Thus, there may be a sub-stantial delay before any net nitrogen mineraliza-tion and leaching of nitrogen from slash occurs.
Compared to mineral soils, nitrogen reservesin organic soils are much greater. If mineraliza-tion of soil nitrogen increases considerably afterclearcutting, the loss of nitrogen to water courcesmay thus be expected to be much higher on drainedpeatlands than for mineral soils. Due to its highadsorption to exchange sites, mineralized ammo-nium is effectively retained by the soil. There-fore, if there is any enhanced leaching of inor-ganic nitrogen from drained peatlands after clear-cutting, it is most probably due to nitrification andthe production of nitrate (Vitousek et al. 1982).Nitrification rates of drained peatlands are poorlyknown. However, it is a well established fact thatnitrification and nitrate production is reduced orprevented in anaerobic, acid, nutrient-poor andcold soil conditions such as typify peats. Conse-quently, the potential for increased leaching ofinorganic N from forested peatlands after clear-cutting is greatest in the most nutrient-rich, well-drained minerotrophic peatlands in the southern-most Finland.
Increased nitrification after clearcutting doesnot necesserily lead to leaching of nitrate from clear-cut areas, however, because the production of ni-trate may stimulate the production of N2O and N2,which are emitted to the atmosphere. However, N2Ois highly soluble in water, and it has been suggestedthat N2O could be transported by soil water tostreams and seeps where it degasses to the atmos-phere (Bowden and Bormann 1986).
Clearcutting can also increase production andleaching of soluble organic N compounds fromdrained peatlands. The processes controlling theleaching of organic N from drained peatlands arealso poorly known. However, the risk for highleaching losses of organic N after clearcutting isprobably greatest from the same areas as the risk
Fig. 2. The experimental layouts at Ruotsinkylä andVesijako.
for enhanced leaching of inorganic N, i.e. from themost nitrogen-rich minerotrophic peat soils.
The aim of this study was to investigate theeffects of clearcutting on leaching of nitrogen fromnutrient-rich drained peatland forests. In particu-lar, the effect of clearcutting on the different proc-esses involved in the cycling of nitrogen are ex-amined and their relative importance in control-ling the loss of nitrogen to water courses are evalu-ated.
Study sites
The calibration period and control basin methodwas used at two locations in southern Finland; atRuotsinkylä (60°21´N, 25°03´E, 49 m a.s.l.) andVesijako (61°23´N, 25°03´E, 125 m a.s.l.). A con-trol and treatment basin were selected at each lo-cation (Fig. 2). The study areas are described inTable 1. The average temperature in January 1993
12 Nieminen • BOREAL ENV. RES. Vol. 3
at Ruotsinkylä was –1.9 °C and – 4.2 °C in 1994.Average temperatures for July in 1993 and 1994were +15.7 °C and +19.9 °C, respectively. AtVesijako, the average temperatures for January1993 and 1994 were – 2.8 °C and –5.8 °C, and forJuly they were +15.7 °C and +19.3 °C. The rain-fall at Ruotsinkylä for 1993 totalled 602 mm andfor 1994, 743 mm. At Vesijako, the correspond-ing amount of rainfall were 501 and 583 mm. Themeasurements of the Finnish Environment Insti-tute at the nearby permanent sample plots showedthat nitrogen deposition at Ruotsinkylä (about 8.0kg ha–1) is much higher than at Vesijako (4.5 kgha–1) (Järvinen and Vänni 1996).
According to the classification of drained peat-lands used in Finland (Heikurainen and Pakarinen1982), the study areas had reached the final stageof drainage succession. At this stage the groundvegetation and the tree stand resemble the corre-sponding fertility levels on mineral soils. On thebasis of a visual inventory, all the ditches in thedifferent study areas had maintained their drain-age effect. On the basis of peat analysis, the Ruotsin-kylä control basin was less fertile than the otherbasins, particularly concerning nitrogen (Table 2).Except for the low nitrogen content at the Ruotsin-kylä control basin, nutrient contents were as highor higher than those described by Kaunisto andPaavilainen (1988) for nutrient-rich peatland siteson old drainage areas. The peat layer at Ruotsinkyläwas underlain mainly by sandy till, and clay atVesijako.
Conventional clearcutting was carried outduring two days in the winter of 1994. Because of
the flat topography and frozen surface peat dur-ing the cuttings, erosion of the peat was negligi-ble and only a little logging slash was found inthe ditches after the cuttings.
Material and methods
Nitrogen deposition and the runoff of nitrogen, aswell as gaseous nitrogen emissions from the peatwere measured in all the catchment areas. Nitro-gen mineralisation from peat and slash was in-ferred on the basis of percolate chemistry collectedusing zero tension lysimeters.
Nitrogen deposition to the forest floor wasmonitored prior to clearcutting in 1993 and afterthe cuttings in 1994. Ten precipitation collectorswere located systematically under the tree canopyin a square (4 × 16 m) at intervals of four metersin each catchment area prior to clearcutting in1993. After clearcutting in 1994, the collectors inthe clear-cut areas were left in the open, whereasthe collectors in the control areas were still undertrees. It is to be noted here that the samples col-lected after clearcutting in the open should benamed as bulk precipitation, while those sampledunder the tree canopy are usually referred to asthroughfall samples (Päivänen 1974). In this study,however, both the samples collected under the treecanopy and in the open are referred to as “pre-cipitation reaching the ground”.
The collectors consisted of a PVC funnel con-nected to a 1-litre polyethene collection bottle.The collection surface of the funnel (surface area
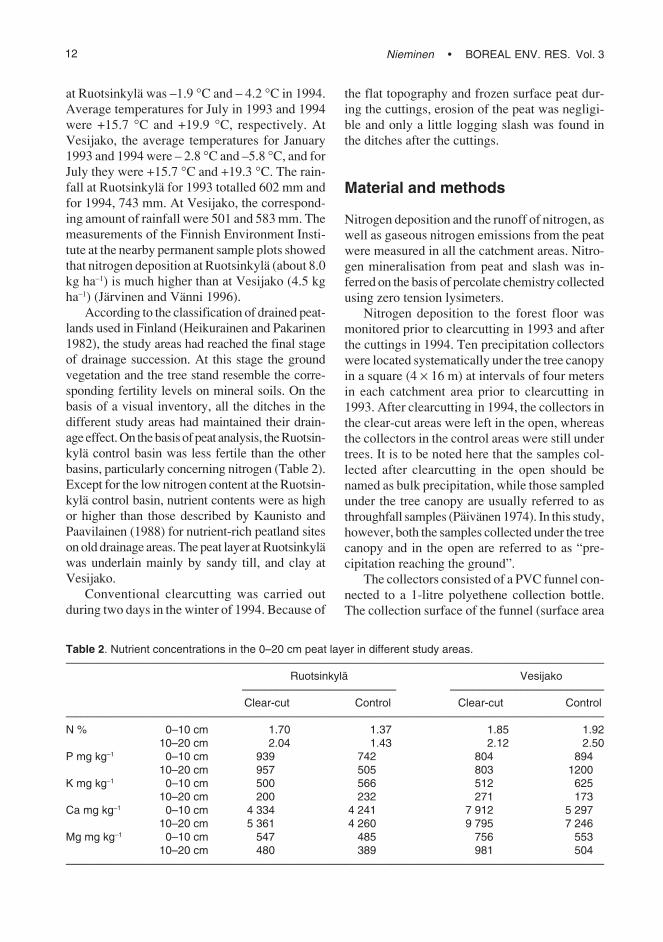
Table 2. Nutrient concentrations in the 0–20 cm peat layer in different study areas.—————————————————————————————————————————————————
Ruotsinkylä Vesijako—————————————— ——————————————Clear-cut Control Clear-cut Control
—————————————————————————————————————————————————N % 0–10 cm 1.70 1.37 1.85 1.92
10–20 cm 2.04 1.43 2.12 2.50P mg kg–1 0–10 cm 939 742 804 894
10–20 cm 957 505 803 1200K mg kg–1 0–10 cm 500 566 512 625
10–20 cm 200 232 271 173Ca mg kg–1 0–10 cm 4 334 4 241 7 912 5 297
10–20 cm 5 361 4 260 9 795 7 246Mg mg kg–1 0–10 cm 547 485 756 553
10–20 cm 480 389 981 504—————————————————————————————————————————————————

13BOREAL ENV. RES. Vol. 3 • Clearcutting and nitrogen cycling
201 cm2) was at a height of 1 m. Precipitationsamples were collected weekly during the frost-free period. The weekly collected samples fromeach catchment area were combined for analysis.
From the autumn of 1992, runoff water sam-ples were taken in each catchment area twice aweek during the snow-melt period in spring andonce a week during other seasons. The sampleswere taken from the overflow of the V-notchedweir.
Eight percolation water samplers (Fig. 3) wereinstalled in the clearcut areas and four samplersin the control areas. After clearcutting, four of theeight lysimeters in the clear-cut areas were leftunder slash-free areas and four lysimeters underrepresentative piles of slash. The lysimeters wereinstalled by first removing an intact soil core downto the required depth, inserting the lysimeter, andthen carefully replacing the upper part of the soilcore. At Ruotsinkylä, a vacuum pump was usedto empty the collectors weekly during the frost-free periods in 1993 and in 1994. Samples werecomposited on the basis of treatment (control,below slash, without slash). At Vesijako,lysimeters were not installed until the summer of1994. Sampling was then as described for Ruotsin-kylä.
All the water samples were transported in styroxboxes to the Central Laboratory of the Finnish For-est Research Institute, where analysis could bestarted within 48 hours of sampling. Prior to analy-sis, the samples were kept at + 4 °C. The pretreat-ment of the samples and all the nutrient analysiswere done according to Jarva and Tervahauta(1994). The water samples were at first filtered(Schleicher & Schull Rundfilter 589 (3)). The run-off and precipitation samples were analysed forNtot and NH4
+-N by flow injection analysis andfor NO3
–-N by ion chromatography. The lysimetersamples were analysed for all the nitrogen com-pounds (Ntot, NH4
+-N and NO3–-N) by flow injec-
tion analysis. Organic N was calculated as the dif-ference between Ntot and NH4
+-N plus NO3– -N.
N2O-N and N2 fluxes were measured fourtimes in 1994 using two static chambers per catch-ment area according to the method of Crill et al.(1988) and Martikainen et al. (1993). Cylinder-shaped chambers (volume 20 l, height 35 cm) withan open bottom were pushed against the soil sur-face so that the lower edge of the chamber sank
about 5 cm below the peat surface. N2O was al-ways sampled first. Nitrous oxide emissions fromthe soil to the chamber were measured by suck-ing gas samples from the chambers with thepolypropylene syringes (60 ml) at four time in-tervals (5, 15, 25, 35 min) after placing the cham-bers. The height from peat surface to the upperedge of the chamber and the temperature insidethe chamber were measured. The gas sampleswere transported to the National Public HealthInstitute (NPHI), where analysis was startedwithin 24 hours of sampling. In order to deter-mine the amount of nitrous oxide that was trans-ported from catchment areas with the run-offwater, two run-off water samples per each catch-ment area were also taken at the same time asthe autumn gas collection and also sent to NPHIfor analysis. One sample was taken from theoverflow of the weir and the other about 100 mupstream from the weir.
N2O produced by either nitrification or denitrif-ication can be reduced to N2 and emitted. The acety-lene-inhibition method was used to evaluate the
Fig. 3. Diagram showing the construction of lysimeter.The arrows depict the potential ways of percolationwater movement. During the wettest periods of yearthe collectors may also be filled due to the rise of theground water level.
14 Nieminen • BOREAL ENV. RES. Vol. 3
amount of N2 in gaseous nitrogen emissions. Acety-lene is used to prevent N2O from reducing to N2
and, consequently, the total nitrogen emissions canbe measured by just analysing for N2O (Balderstonet al. 1976, Yoshinari and Knowles 1976, Yoshinariet al. 1977, Tiedje et al. 1989). The chamber wasthus filled to 10% volume with acetylene prior totaking the gas samples. The samples were taken 5,60, 120 and 180 minutes after placing chambersand loading them with acetylene.
The gas samples were analysed for N2O-N bya HP 5890 Series II gas chromatograph (Nykänenet al. 1995). Nitrous oxide concentrations in run-off water were determined according to McAullife(1971).
Using the equation for ideal gases and the lin-ear regression describing the relationship betweenthe concentration of N2O inside the chamber andsampling time, N2O-N emissions were calculatedusing the following formula:
E =PR ×10–6 M × t × A
T× h × k (1)
where E = N2O-N (μg m– 2 d–1), P = standard pres-sure (atm), R = gas standard (l atm K–1 mol–1), M =molecular weight (g mol–1), t = time dimension forwhich E is calculated, A = area dimension for whichE is calculated, T = temperature inside the cham-ber (K), h = mean height from the peat surface tothe upper edge of the chamber (cm), k = regressioncoefficient from the linear regression equation forthe relationship between the concentration of N2Oinside the chamber and sampling time.
The correlation between the concentration ofN2O inside the chamber and sampling time wasusually high and statistically significant (r >0.85***). If not statistically significant, the N2O-N emission was not calculated for that samplingoccasion.
Changes in the nitrogen concentrations of pre-cipitation and runoff resulting from clearcuttingwere studied using the calibration period and con-trol area method. On the basis of the measure-ments during the calibration period (1992–1993),a linear regression equation was calculated for therelationship between measured values in the areato be clear-cut and respective values from controlarea. After clearcutting values were predicted forthe area as if it had not been cut using this equa-
tion and measured values from the control area.The effect of clearcutting on water quality is thedifference between measured values followingclearcutting in the clear-cut area and the predictedvalues. If the relationship between values in theclear-cut area and respective values in the controlarea during the calibration period was not statisti-cally significant, the average ratio of values in theclear-cut area to respective values in the controlarea was used to calculate the predicted values.
Non-parametric Wilcoxon signed-rank t-test(either two-group or matched pairs t-test) was usedto calculate statistical differences between yearsor between treatments (also between observed andpredicted values) using BMDP (1990) softwarepackage. In a few cases, 95% confidence inter-vals were calculated for differences between themeans of the different treatments.
Results
Precipitation reaching the ground
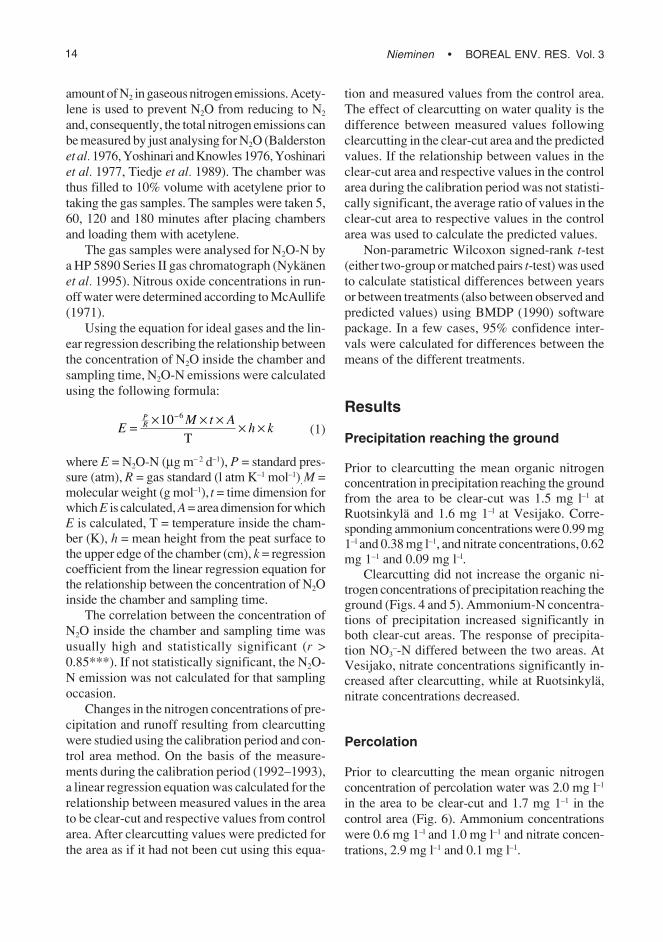
Prior to clearcutting the mean organic nitrogenconcentration in precipitation reaching the groundfrom the area to be clear-cut was 1.5 mg l–1 atRuotsinkylä and 1.6 mg 1–l at Vesijako. Corre-sponding ammonium concentrations were 0.99 mg1–l and 0.38 mg l–1, and nitrate concentrations, 0.62mg 1–1 and 0.09 mg l–l.
Clearcutting did not increase the organic ni-trogen concentrations of precipitation reaching theground (Figs. 4 and 5). Ammonium-N concentra-tions of precipitation increased significantly inboth clear-cut areas. The response of precipita-tion NO3
–-N differed between the two areas. AtVesijako, nitrate concentrations significantly in-creased after clearcutting, while at Ruotsinkylä,nitrate concentrations decreased.
Percolation
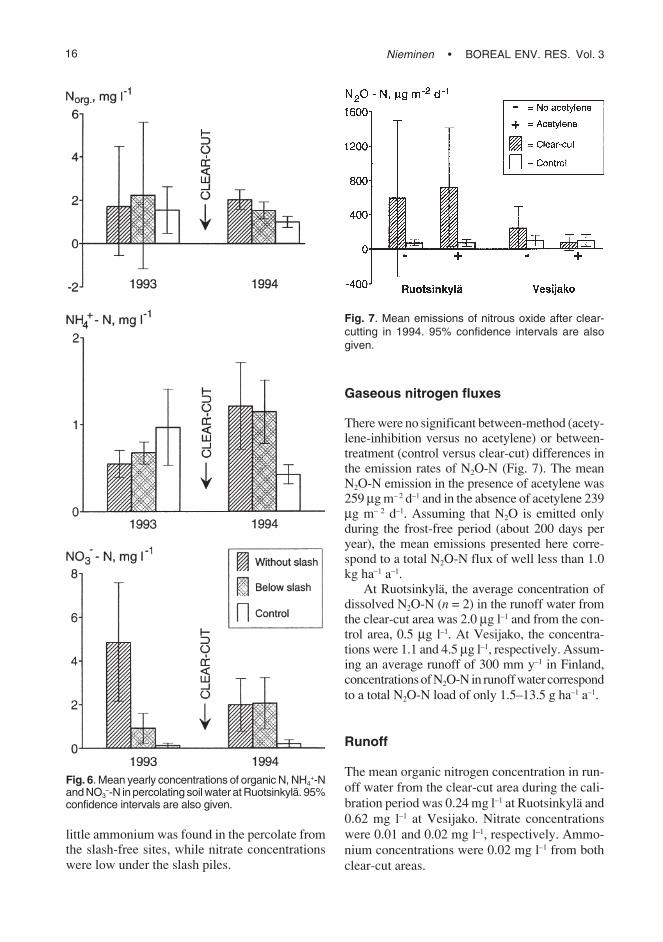
Prior to clearcutting the mean organic nitrogenconcentration of percolation water was 2.0 mg l–1
in the area to be clear-cut and 1.7 mg 1–1 in thecontrol area (Fig. 6). Ammonium concentrationswere 0.6 mg 1–l and 1.0 mg l–1 and nitrate concen-trations, 2.9 mg l–1 and 0.1 mg l–1.
15BOREAL ENV. RES. Vol. 3 • Clearcutting and nitrogen cycling
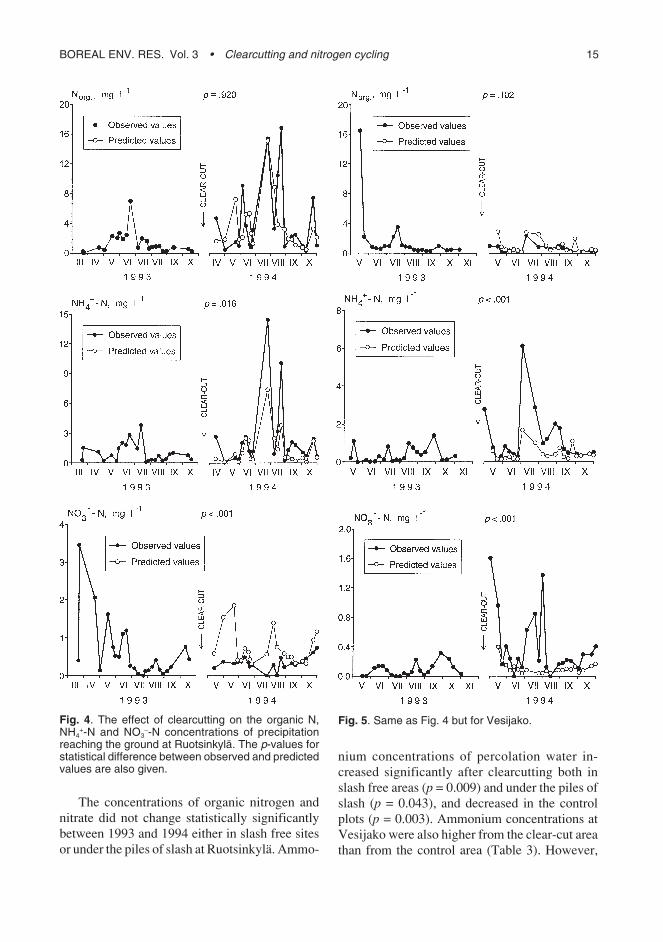
Fig. 4. The effect of clearcutting on the organic N,NH4
+-N and NO3–-N concentrations of precipitation
reaching the ground at Ruotsinkylä. The p-values forstatistical difference between observed and predictedvalues are also given.
Fig. 5. Same as Fig. 4 but for Vesijako.
The concentrations of organic nitrogen andnitrate did not change statistically significantlybetween 1993 and 1994 either in slash free sitesor under the piles of slash at Ruotsinkylä. Ammo-
nium concentrations of percolation water in-creased significantly after clearcutting both inslash free areas (p = 0.009) and under the piles ofslash (p = 0.043), and decreased in the controlplots (p = 0.003). Ammonium concentrations atVesijako were also higher from the clear-cut areathan from the control area (Table 3). However,
16 Nieminen • BOREAL ENV. RES. Vol. 3
little ammonium was found in the percolate fromthe slash-free sites, while nitrate concentrationswere low under the slash piles.
Gaseous nitrogen fluxes
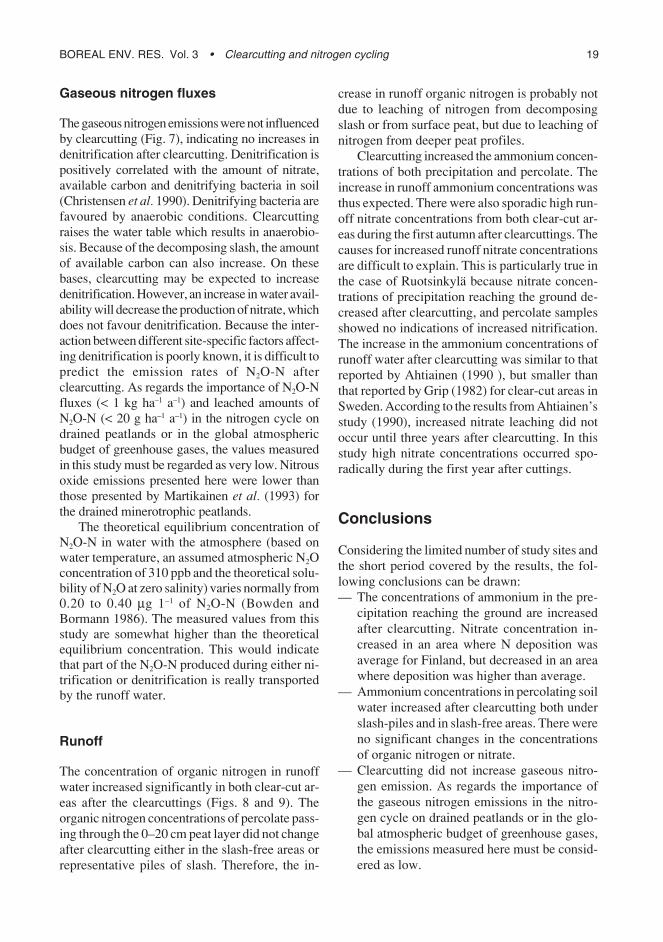
There were no significant between-method (acety-lene-inhibition versus no acetylene) or between-treatment (control versus clear-cut) differences inthe emission rates of N2O-N (Fig. 7). The meanN2O-N emission in the presence of acetylene was259 μg m– 2 d–1 and in the absence of acetylene 239μg m– 2 d–1. Assuming that N2O is emitted onlyduring the frost-free period (about 200 days peryear), the mean emissions presented here corre-spond to a total N2O-N flux of well less than 1.0kg ha–1 a–1.
At Ruotsinkylä, the average concentration ofdissolved N2O-N (n = 2) in the runoff water fromthe clear-cut area was 2.0 μg l–1 and from the con-trol area, 0.5 μg l–1. At Vesijako, the concentra-tions were 1.1 and 4.5 μg l–1, respectively. Assum-ing an average runoff of 300 mm y–1 in Finland,concentrations of N2O-N in runoff water correspondto a total N2O-N load of only 1.5–13.5 g ha–1 a–1.
Runoff
The mean organic nitrogen concentration in run-off water from the clear-cut area during the cali-bration period was 0.24 mg l–1 at Ruotsinkylä and0.62 mg l–1 at Vesijako. Nitrate concentrationswere 0.01 and 0.02 mg l–1, respectively. Ammo-nium concentrations were 0.02 mg l–1 from bothclear-cut areas.
Fig. 6. Mean yearly concentrations of organic N, NH4+-N
and NO3–-N in percolating soil water at Ruotsinkylä. 95%
confidence intervals are also given.
Fig. 7. Mean emissions of nitrous oxide after clear-cutting in 1994. 95% confidence intervals are alsogiven.

17BOREAL ENV. RES. Vol. 3 • Clearcutting and nitrogen cycling
Organic nitrogen concentrations in runoff in-creased significantly after clearcutting at bothRuotsinkylä and Vesijako (Figs. 8 and 9). Theconcentrations for the clear-cut areas were two-threefold compared to those of the control areasin the autumn of 1994. The observed values ofammonium differed significantly from those pre-dicted only at Ruotsinkylä, and those of nitrate atVesijako. However, when the differences werecalculated only for autumn (September and Oc-tober) of 1994, statistically significant differenceswere observed also for nitrate at Ruotsinkylä (p =0.031) and ammonium at Vesijako (p = 0.021).
Discussion
Precipitation reaching the ground
Both ammonium and nitrate are absorbed frombulk precipitation by tree canopies (Hyvärinen1990). Higher ammonium and, in the case ofVesijako, also nitrate concentrations in precipita-tion reaching the ground were to be expected af-ter clearcutting (Figs. 4 and 5). However, the dis-tinct decrease in the nitrate concentrations atRuotsinkylä was surprising. Ruotsinkylä is situ-ated close to the Helsinki-Vantaa airport and nearto a major arterial road and the dry deposition ofoxidized N to forest canopies in the area is prob-ably significant. During rainfall events the differ-ent forms of oxidized N attached to tree canopiesmight be converted into nitrate and added to for-est canopy throughfall. Clearcutting resulted inthe loss of this additional canopy-filtered dry depo-sition of oxidized N.
The results presented here are in accordancewith Hyvärinen’s (1990) study, where higher pre-cipitation nitrate concentrations were found in theopen than under the tree canopy in other parts of
Table 3. Mean nitrogen concentrations of percolation water in 1994 in Vesijako. 95% confidence intervals inparentheses.—————————————————————————————————————————————————
Without slash Under slash Control(n = 7) (n = 7) (n = 3)
—————————————————————————————————————————————————Norg., mg l–1 1.76 (1.16–2.36) 2.18 (1.63–2.73) 1.14 (0.99–1.28)NH4
+-N, mg l–1 0.33 (0.17–0.48) 1.50 (1.21–1.79) 0.11(– 0.20–0.42)NO3
–-N, mg l–1 1.12 (0.03–2.20) 0.16 (0.01–0.31) 1.88 (1.06–2.70)—————————————————————————————————————————————————
Finland, besides at Ruotsinkylä.Precipation collectors of the type used in this
study have been widely used in deposition stud-ies. However, as stated by Hyvärinen (1990): “Thesampling technique is an obvious source of error.In addition to wet precipitation, the open funnelscollect an unknown amount of dry deposition andleachate from litterfall that accumulates in thecollector funnel.” In this study, the funnels werenot equipped with loops to retard evaporation.Even if the sampling interval was only one week,the throughfall chemistry may also have been in-fluenced by evaporation.
Percolate
The interpretation of the effects of clearcuttingon the percolation water chemistry is difficultbecause there were no (at Vesijako) or only a few(at Ruotsinkylä) samples from the calibration pe-riod. This contrasted with the situation afterclearcutting when samples could be collected al-most every week. Lysimeters of the type used inthis study probably better depict the real situationin the soil than the filled-in type of lysimeters usedby Rosén and Lundmark-Thelin (1987). With thefilled-in lysimeters, horizontal water movementand uptake of water and nutrients from the soilabove the collector are excluded. However, thesample chemistry may have been affected by min-eralization, which may well have been stimulatedas a result of installation. The aerobic conditionsprevailing in the lysimeters may also have resultedin the mineralization and possible nitrification ofthe collected sample.
Except for the control area at Ruotsinkylä, thepercolate showed high sporadic nitrate concen-trations, which suggests that the study areas had apotential for high leaching losses of nitrogen af-

18 Nieminen • BOREAL ENV. RES. Vol. 3
Fig. 8. The effect of clearcutting on the organic N,NH4
+-N and NO3–-N concentrations of runoff water at
Ruotsinkylä. The p-values for statistical differencebetween observed and predicted values are also given.
Fig. 9. Same as Fig. 8 but for Vesijako.
ter clearcutting (Vitousek 1981). Clearcutting didnot, however, significantly affect the nitrate con-centrations of the percolation water (Fig. 6). AtVesijako, nitrate concentrations were even lowerin the clear-cut area than in control area (Table 3).Ammonium concentrations, in contrast, clearlyincreased after clearcutting. At Vesijako, ammo-nium concentrations were higher under piles of
slash than in the slash-free areas, while there wereno difference between the two lysimeter positionsat Ruotsinkylä. Rosén and Lundmark-Thelin(1987) found both high nitrate and ammoniumconcentrations of percolation water under slash-piles on mineral soils during the second and thirdgrowing season after clearfelling. Nitrate andammonium concentrations collected from spotsbetween the piles of slash were at the same levelas could be expected from a forested area.
19BOREAL ENV. RES. Vol. 3 • Clearcutting and nitrogen cycling
Gaseous nitrogen fluxes
The gaseous nitrogen emissions were not influencedby clearcutting (Fig. 7), indicating no increases indenitrification after clearcutting. Denitrification ispositively correlated with the amount of nitrate,available carbon and denitrifying bacteria in soil(Christensen et al. 1990). Denitrifying bacteria arefavoured by anaerobic conditions. Clearcuttingraises the water table which results in anaerobio-sis. Because of the decomposing slash, the amountof available carbon can also increase. On thesebases, clearcutting may be expected to increasedenitrification. However, an increase in water avail-ability will decrease the production of nitrate, whichdoes not favour denitrification. Because the inter-action between different site-specific factors affect-ing denitrification is poorly known, it is difficult topredict the emission rates of N2O-N afterclearcutting. As regards the importance of N2O-Nfluxes (< 1 kg ha–1 a–1) and leached amounts ofN2O-N (< 20 g ha–1 a–1) in the nitrogen cycle ondrained peatlands or in the global atmosphericbudget of greenhouse gases, the values measuredin this study must be regarded as very low. Nitrousoxide emissions presented here were lower thanthose presented by Martikainen et al. (1993) forthe drained minerotrophic peatlands.
The theoretical equilibrium concentration ofN2O-N in water with the atmosphere (based onwater temperature, an assumed atmospheric N2Oconcentration of 310 ppb and the theoretical solu-bility of N2O at zero salinity) varies normally from0.20 to 0.40 μg 1–1 of N2O-N (Bowden andBormann 1986). The measured values from thisstudy are somewhat higher than the theoreticalequilibrium concentration. This would indicatethat part of the N2O-N produced during either ni-trification or denitrification is really transportedby the runoff water.
Runoff
The concentration of organic nitrogen in runoffwater increased significantly in both clear-cut ar-eas after the clearcuttings (Figs. 8 and 9). Theorganic nitrogen concentrations of percolate pass-ing through the 0–20 cm peat layer did not changeafter clearcutting either in the slash-free areas orrepresentative piles of slash. Therefore, the in-
crease in runoff organic nitrogen is probably notdue to leaching of nitrogen from decomposingslash or from surface peat, but due to leaching ofnitrogen from deeper peat profiles.
Clearcutting increased the ammonium concen-trations of both precipitation and percolate. Theincrease in runoff ammonium concentrations wasthus expected. There were also sporadic high run-off nitrate concentrations from both clear-cut ar-eas during the first autumn after clearcuttings. Thecauses for increased runoff nitrate concentrationsare difficult to explain. This is particularly true inthe case of Ruotsinkylä because nitrate concen-trations of precipitation reaching the ground de-creased after clearcutting, and percolate samplesshowed no indications of increased nitrification.The increase in the ammonium concentrations ofrunoff water after clearcutting was similar to thatreported by Ahtiainen (1990 ), but smaller thanthat reported by Grip (1982) for clear-cut areas inSweden. According to the results from Ahtiainen’sstudy (1990), increased nitrate leaching did notoccur until three years after clearcutting. In thisstudy high nitrate concentrations occurred spo-radically during the first year after cuttings.
Conclusions
Considering the limited number of study sites andthe short period covered by the results, the fol-lowing conclusions can be drawn:— The concentrations of ammonium in the pre-
cipitation reaching the ground are increasedafter clearcutting. Nitrate concentration in-creased in an area where N deposition wasaverage for Finland, but decreased in an areawhere deposition was higher than average.
— Ammonium concentrations in percolating soilwater increased after clearcutting both underslash-piles and in slash-free areas. There wereno significant changes in the concentrationsof organic nitrogen or nitrate.
— Clearcutting did not increase gaseous nitro-gen emission. As regards the importance ofthe gaseous nitrogen emissions in the nitro-gen cycle on drained peatlands or in the glo-bal atmospheric budget of greenhouse gases,the emissions measured here must be consid-ered as low.
20 Nieminen • BOREAL ENV. RES. Vol. 3
— The runoff organic nitrogen concentrations in-creased significantly after clearcutting. Theincreased organic nitrogen in runoff appearsto come from deep peat profiles. The causesfor sporadic increases in nitrate concentrationsremained unexplained. Because of the increasein ammonium deposition and ammonium con-centrations in percolation water, the increasein runoff ammonium concentrations afterclearcutting was logical.
Acknowledgements: I am grateful to Inkeri Suopanki, RaijaLinnainmaa, Hilkka Granlund, Johanna Ylinen, Yrjö Sulkalaand Hannu Nousiainen for their conscientious assistance inpreparing the manuscript. I also wish to thank Dr. ErkkiAhti and Dr. Leena Finér for reading the manuscript andgiving valuable advice. The English language was revisedby Dr. Michael Starr.
References
Ahtiainen M. 1990. [The effects of clear-cutting and for-estry drainage on water quality of forest brooks]. Vesi-ja ympäristöhallituksen julkaisuja — sarja A nro 45.Helsinki. 122 pp. [In Finnish with English abstract].
Balderston W.L., Sherr B. & Payne W.J. 1976. Blockageby acetylene of nitrous oxide reduction in Pseudomonasperfectomarinus. Applied and Environmental Micro-biology 31: 504–508.
Bormann F.H., Likens G.E. & Fisher D.W. & Pierce R.S.1968. Nutrient loss accelerated by clear-cutting of aforest ecosystem. Science 159: 882-884.
Bosatta E. & Staaf H. 1982. The control of nitrogen turn-over in forest litter. Oikos 39: 143–151.
Bowden W.B. & Bormann F.H. 1986. Transport and lossof nitrous oxide in soil water after forest clear-cutting.Science 233: 867–869.
Christensen S., Simkins S. & Tiedje J.M. 1990. Spatial vari-ation in denitrification: Dependency of activity centerson the soil environment. Soil Science Society of AmericaProceedings 54: 1608–1613.
Crill P.M., Bartlett K.B., Harriss R.C., Gorham E., VerryE.S., Sebacher D.I., Madzar L. & Sanner W. 1988.Methane fluxes from Minnesota peatlands. Global Bio-chemical Cycles 2: 371–384.
Finér L. 1989. Biomass and nutrient cycle in fertilized andunfertilized pine, mixed birch and pine and spruce standson a drained mire. Acta Forestalia Fennia 208: 1–63.
Grip H. 1982. Water chemistry and runoff in forest streamsat Kloten. UNGI Report 58, Division of Hydrology,Department of Physical Geography, Uppsala Univer-sity. 144 pp.
Heikurainen L. & Pakarinen P. 1982. Peatland classifica-tion. In: Laine J. (ed.), Peatlands and their utilizationin Finland. Finnish Peatland Society, Finnish National
Committee of the International Peatland Society, pp.14–23.
Hyvärinen, A. 1990. Deposition on forest soils — effect oftree canopy on throughfall. In: Kauppi P., Anttila P. &Kenttämies K. (eds.), Acidification in Finland. SpringerVerlag, Berlin Heidelberg, pp. 199–213.
Jarva M. & Tervahauta A. 1994. [Methods of water analy-sis]. Metsäntutkimuslaitoksen tiedonantoja 477: 1–171.[In Finnish with English abstract].
Järvinen O. & Vänni T. 1996. Sadeveden pitoisuus- jalaskeuma-arvot Suomessa vuonna 1994. Suomenympäristökeskuksen moniste 13, pp. 1–67.
Kaunisto S. & Paavilainen E. 1988. Nutrient stores in olddrainage areas and growth of stands. CommunicationesInstituti Forestalis Fenniae 145: 1–39.
Knighton M.D. & Stiegler J.H. 1980. Phosphorus releasefollowing clearcutting of a black spruce fen and a blackspruce bog. In: Proceedings of the 6th InternationalPeatland Congress, 17–23.8.1980, Duluth, Minnesota.,pp. 577–583.
Kubin E. 1995. The effect of clearcutting, waste wood col-lecting and site preparation on the nutrient leaching togroundwater. In: Nilsson L.O., Hüttl R.E. & JohanssonU.T. (eds.), Nutrient uptake and cycling in forest eco-systems. Kluwer Academic Publishers, Netherlands, pp.661–670.
Lepistö A., Seuna P., Saukkonen S. & Kortelainen P. 1995.Hakkuun vaikutus hydrologiaan ja ravinteidenhuuhtoutumiseen rehevältä metsävaluma-alueelta Etelä-Suomessa. In: Saukkonen S. & Kenttämies K. (eds.),Metsätalouden vesistövaikutukset ja niiden torjunta.METVE-projektin loppuraportti. Suomen ympäristö 2— ympäristönsuojelu, pp. 73–84.
Martikainen P.J., Nykänen H., Crill P. & Silvola J. 1993.Effect of a lowered water table on nitrous oxide fluxesfrom northern peatlands. Nature 366: 51–53.
Martin C.W. & Harr R.D. 1988. Logging of mature Doug-las-fir in western Oregon has little effect on nutrientoutput budgets. Canadian Journal of Forest Research19: 35–43.
Martin C.W., Noel D.S. & Federer C.A. 1985. Clearcuttingand the biogeochemistry of streamwater in New Eng-land. Journal of Forestry 83: 686–689.
McAullife C. 1971. GC determination of solutes by multi-ple phase equilibration. Chemical Technology 46: 46–51.
Nykänen H., Alm J., Lång K., Silvola J. & Martikainen P.J.1995. Emissions of CH4, N2O and CO2 from a virginfen and a fen drained for grassland in Finland. Journalof Biogeography 22: 351–357.
Päivänen J. 1974. Nutrient removal from Scots pine canopyon drained peatland by rain. Acta Forestalia Fennica139: 1–19.
Rosén K. & Lundmark-Thelin A. 1987. Increased nitrogenleaching under piles of slash — a consequence of mod-ern forest harvesting techniques. Scandinavian Jour-nal of Forest Research 2: 21–29.
Tiedemann A.R., Quigley T.M. & Anderson T.D. 1988.
21BOREAL ENV. RES. Vol. 3 • Clearcutting and nitrogen cycling
Effects of timber harvest on stream chemistry and dis-solved nutrient losses in Northeast Oregon. Forest Sci-ence 34: 344–358.
Tiedje J.M., Simkins, S. & Groffman P.M. 1989. Perspec-tives on measurement of denitrification in the field in-cluding recommended protocols for acetylene basedmethods. Plant and Soil 115: 261–284.
Verry E.S. 1972. Effect of an aspen clearcutting on wateryield and quality in northern Minnesota. In: NationalSymposium On Watersheds in Transition. Proceedingsof a Symposium of American Water Resources Associa-tion, June 1972, Fort Collins, Colorado, pp. 276–284.
Vitousek P.M. 1981. Clear-cutting and the nitrogen cycle.In: Clark F.E. & Rosswall T. (eds.), Terrestial Nitro-gen Cycles. Ecological Bulletins 33: 631–642.
Vitousek P.M., Gosz J.R., Charles C.G., Melillo J.M. &Reiners W.A. 1982. A comparative analysis of poten-tial nitrification and nitrate mobility in forest ecosys-tems. Ecological Monographs 52: 155–177.
Wiklander G. 1981. Heterogenous nitrogen leaching after clear-cutting. In: Clark F.E. & Rosswall T. (eds.), Terrestialnitrogen cycles. Ecological Bulletins 33: 642–647.
Yoshinari T., Hynes R. & Knowles R. 1977. Acetylene in-hibition of nitrous oxide reduction and measurementof denitrification and nitrogen fixation in soil. Soil Bi-ology and Biochemistry 9: 177–183.
Yoshinari T. & Knowles R. 1976. Acetylene inhibition ofnitrous oxide reduction by denitrifying bacteria. Bio-chemical and Biophysical Research Communications69: 705–710.
Received 20 September 1996, accepted 3 March 1998