effects on soil carbon and nitrogen cycling …
TRANSCRIPT
UNIVERSITY OF CALIFORNIA, SANTA CRUZ
EFFECTS ON SOIL CARBON AND NITROGEN CYCLING ASSOCIATED WITH GRAZING BY DIFFERENT SPECIES IN A KANSAS TALLGRASS PRAIRIE
A Senior Thesis submitted in partial satisfaction
of the requirements for the degree of
BACHELOR OF ARTS
in
ENVIRONMENTAL STUDIES
by
Christopher James Barnard
March 2016
ADVISOR(S): Weixin Cheng, Environmental Studies
ABSTRACT: The world’s soils are an enormously important sink of atmospheric CO2, sequestering significantly more carbon. Consequently, alterations to soil carbon cycling can have huge implications concerning climate change. In cases of heavy grazing, intensity-reduction or exclusion has been shown to increase primary productivity and sequester carbon, as opposed to release. However, these studies focus on sheep or cattle-grazed land. It has been almost 30 years since the near-extinction of the Plains bison in Midwest America and their numbers are returning. Aboveground comparisons have been made between cattle and bison-grazed lands, but not much has been researched belowground. This experiment conducted on Konza Prairie Biological Station (KPBS), a tallgrass prairie in Manhattan, Kansas, analyzes root and soil properties, using microbial biomass carbon (MBC), total nitrogen (TN) and total carbon (TC) as proxies for carbon and nitrogen cycling. MBC content was over 60% greater, while TC and TN were 40% and 35% greater respectively in the bison-grazed site compared to cattle-grazed. These differences are quite significant and could have long lasting effects on soil nutrient cycling in middle North America. KEYWORDS: Konza Prairie Biological Station, Soil carbon/nitrogen cycling, Grazing, Climate change I claim the copyright to this document but give permission for the Environmental Studies department at UCSC to share it with the UCSC community. _________________________________________ ______________________ Student Signature Date
2
Introduction
There is more carbon stored in the soils of the world than there is in the atmosphere; so
ecosystem-level fluctuations in carbon cycling and sequestration can have profound effects on
global warming and climate change (Davidson and Janssens, 2006). This study uses soil
microbial biomass carbon (MBC) measurements as an indication of soil carbon cycling to
compare bison (Bos bison) and cattle (Bos taurus) grazed lands with an ungrazed control. MBC
can be useful as such an indicator because it has numerous direct and indirect effects on soil
carbon pools and their turnover, in addition to the biomass being a carbon pool itself. For
example, microbial communities dominated by fungi exhibit increased turnover rates and soil
microbes are known to enhance aggregation, which can physically entrap soil organic matter (Six
et al., 2006).
The reintroduction of the Plains bison to Midwest America has been hailed as a great
conservation success, however little is known about the grazing effects of bison in comparison to
cattle grazing. The majority of research concerning the ecological effects of the two ungulate
species focuses mainly on how differences in behavior and resource selection affect plant
community composition and diversity. Previous studies have suggested that grassland grazed by
bison has been shown to have a more rapid increase in annual and perennial forb cover as well as
a trend towards greater overall species richness. However, despite observations of slight
alterations to some vegetation components, the plant communities did not vary significantly
between the bison and cattle pastures. Instead, variations in how the herbivores are managed
have been hypothesized as the major contributors to differences between pastures grazed by the
two species (Towne, Hartnett, & Cochran, 2005). This study will see how these differences
affect soil properties and if they translate into variations in soil carbon and nitrogen pools.
3
Methods
Study Site
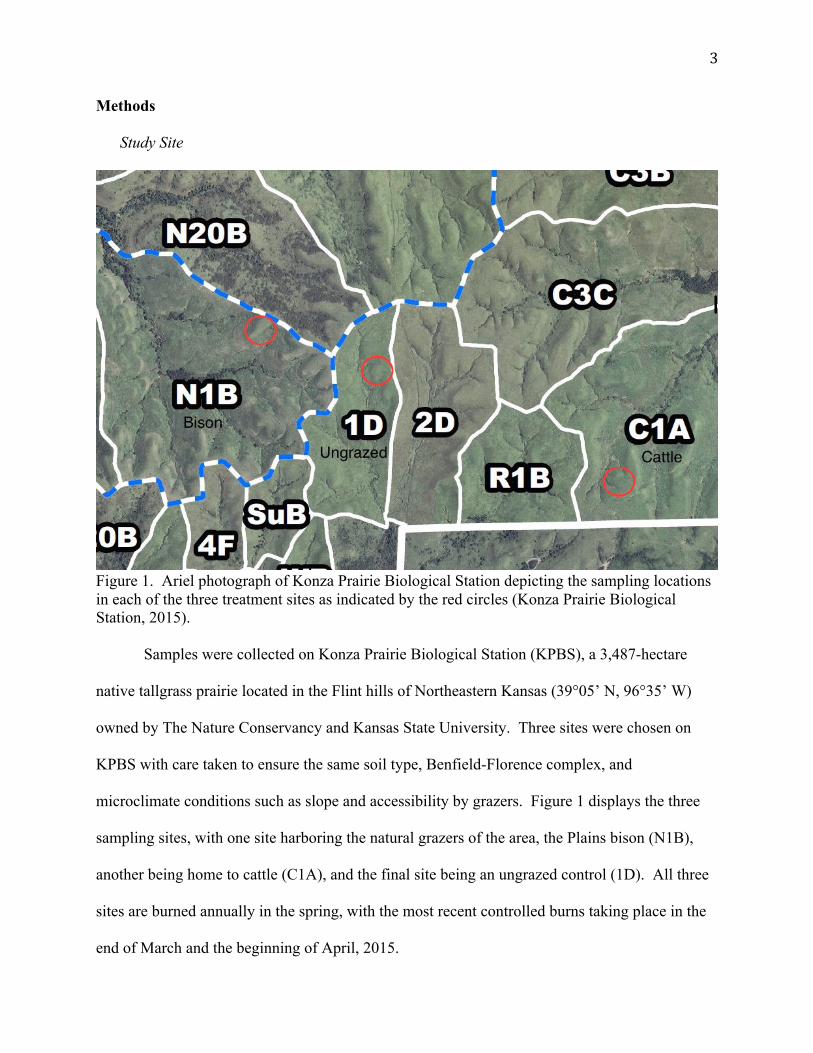
Figure 1. Ariel photograph of Konza Prairie Biological Station depicting the sampling locations in each of the three treatment sites as indicated by the red circles (Konza Prairie Biological Station, 2015). Samples were collected on Konza Prairie Biological Station (KPBS), a 3,487-hectare
native tallgrass prairie located in the Flint hills of Northeastern Kansas (39°05’ N, 96°35’ W)
owned by The Nature Conservancy and Kansas State University. Three sites were chosen on
KPBS with care taken to ensure the same soil type, Benfield-Florence complex, and
microclimate conditions such as slope and accessibility by grazers. Figure 1 displays the three
sampling sites, with one site harboring the natural grazers of the area, the Plains bison (N1B),
another being home to cattle (C1A), and the final site being an ungrazed control (1D). All three
sites are burned annually in the spring, with the most recent controlled burns taking place in the
end of March and the beginning of April, 2015.
4
Cattle and Bison Management
The goal when managing the stocking rate at KPBS is to remove 25% of the available
forage annually, which works out to approximately eight grazable acres per cow/calf pair and 11
grazable acres per bison. A notable difference between the two plots is that the bison graze year-
round, while the cattle have a grazing season of May through October. However, this is a normal
practice in cattle-grazed systems.
Experimental design
There is inevitably going to be variability in such a complex, natural ecosystem, so in an
attempt to compensate and observe statistically significant effects of the treatments a mass
bulking approach was utilized.
Samples were taken at each site during a three-day period at the end of August 2015. In
order to isolate the effect of the treatment, grazing, care was taken to randomize the sampling
design by throwing a ball in a random direction when setting up the transects. Two 45 meter
transects were created for each treatment. Evenly spaced along each transect (every 9 meters),
five 1-square meter quadrats that had been divided into 16 equal (.0625m2) squares were placed.
Then, a random number generator was used to pick five of the .0625m2 squares, in which 1-inch
diameter soil cores were taken to a depth of 10 centimeters. Additionally, a 2-inch diameter soil
core was taken at each quadrat location and wrapped in plastic wrap for determination of bulk
density and gravimetric water content. The 1-inch cores taken within each quadrat were
homogenized and the roots picked for determination of root biomass, C%, and N%. All samples
were refrigerated at 4 degrees Celsius until analyses could be completed.
5
Root Analysis
The roots picked from the homogenized 1-inch soil cores were used to compare average
root density, then were ground in a ball mill grinder and weighed for carbon and nitrogen
elemental composition. Carbon and nitrogen elemental composition was determined by Dumas
combustion using a Carlo Erba 1108 elemental analyzer coupled to a ThermoFinnigan Delta Plus
XP isotope ratio mass spectrometer. Analyses were run at the University of California, Santa
Cruz Stable Isotope Laboratory.
Soil Analysis
Substrate-induced respiration (SIR) measurements were taken using the protocol outlined
in Anderson & Domsch (1978) to get an indication of microbial biomass carbon (MBC). MBC
was estimated from the substrate-induced respiration measurements, while carbon availability
was determined by the ratio of basal respiration to substrate-induced respiration. (Samples had
to be transported back to the University of California, Santa Cruz before SIR could be
completed, so the results may be slightly skewed). The remainder of the soil from the
homogenized 1-inch cores was oven-dried at 105 degrees Celsius for 72-hours. The oven-dried
soil was then ground, weighed, and analyzed for carbon and nitrogen elemental composition
using the same method outlined above.
Statistical Analysis
One-way ANOVA was used to compare the effects of the grazing treatments using the
variables in question. JMP Pro 12 was used for all statistical analyses and the significance level
was set at P < 0.05.
6
Results
Bulk Density
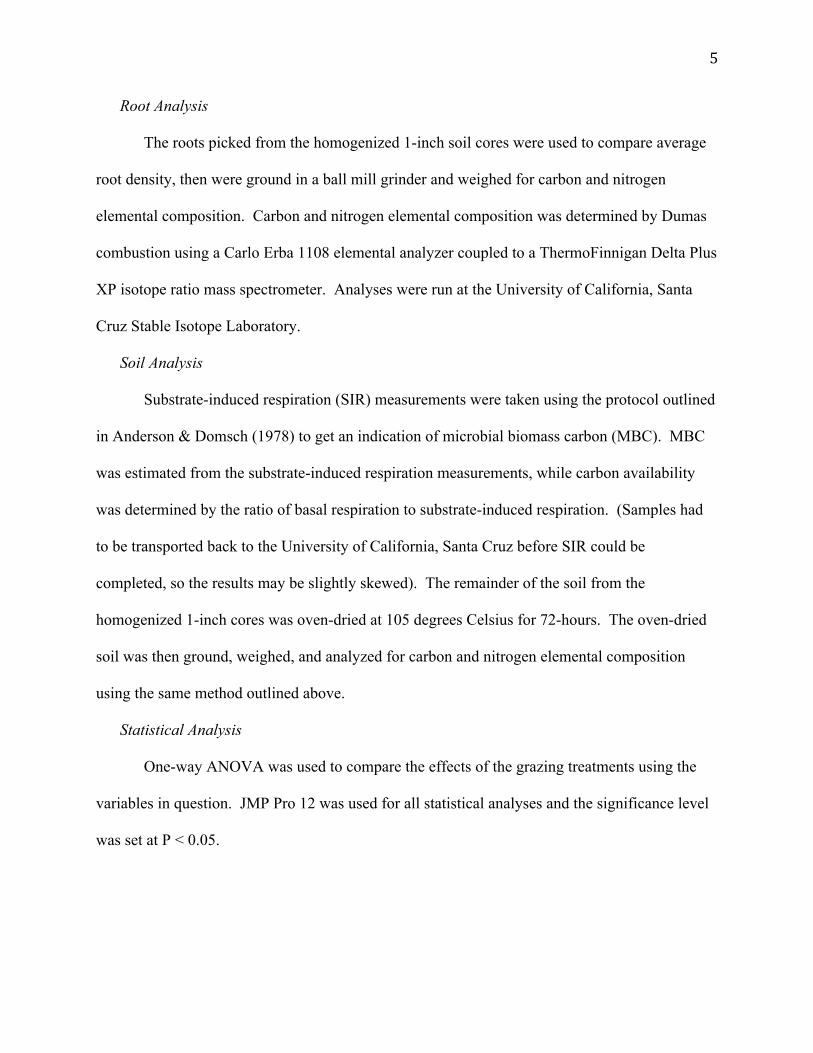
Figure 2. Mean bulk density at 0-10 cm depth for the three treatment sites. (1D, C1A, N1B; n=10) *Site N1B was very rocky making it extremely difficult to take intact cores.
The bulk density was slightly greater in the site hosting cattle, compared to the bison and
ungrazed sites, however there is no statistically significant difference between them (Figure 2).
0.80
0.85
0.90
0.95
1.00
1.05
1.10
1D C1A N1B
Density(g/cm
3 )
Site
BulkDensity
7
Elemental Analysis
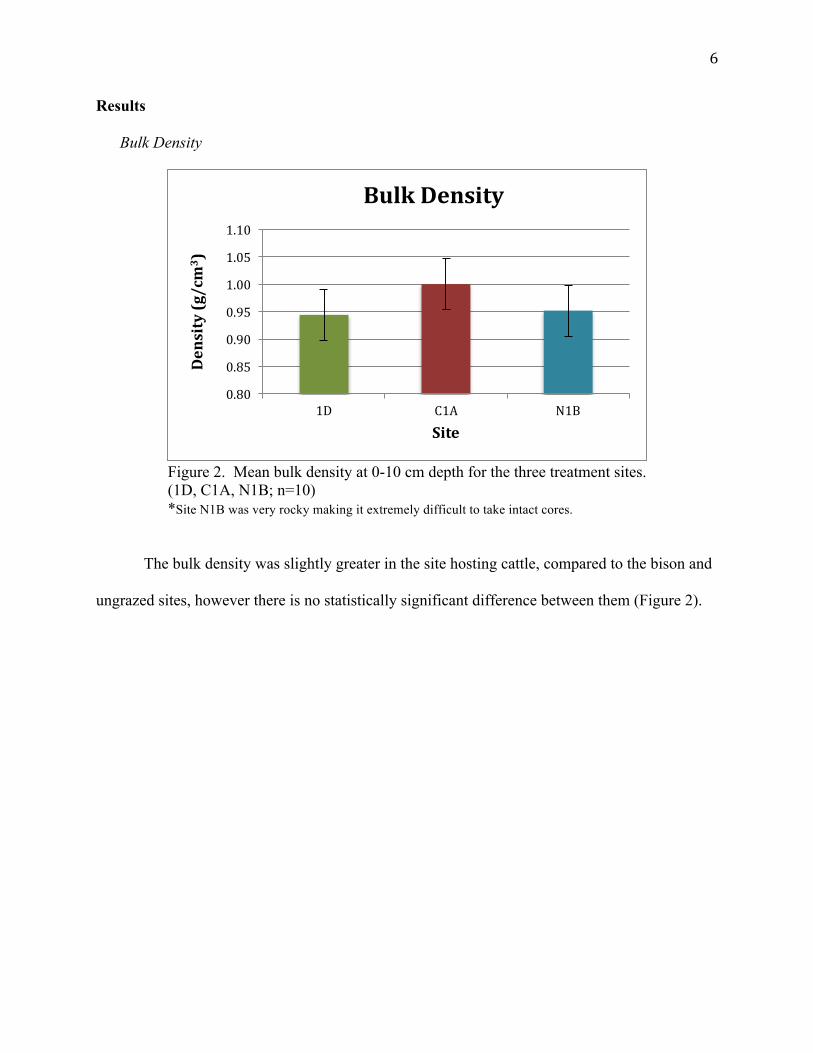
Figure 3. Mean total soil carbon values for the three treatment sites (µg C g-1 of soil). (1D – n=9, C1A – n=7, N1B – n=9)
There is a trend of increasing TC associated with grazing as well as the bison-
grazed plot having a 40% increase in TC when compared to cattle-grazed. C1A and
N1B are not statistically different (Figure 3).
Figure 4. Mean total soil nitrogen values (µg N g-1 soil) for the three treatment sites. (1D – n=9, C1A – n=7, N1B – n=9)
020040060080010001200140016001800
1D C1A N1B
TotalCarbon(µgCg-1soil)
Site
TotalCarbon
020406080100120140160
1D C1A N1B
TotalNitrogen(µgNg-1soil)
Site
TotalNitrogen
8
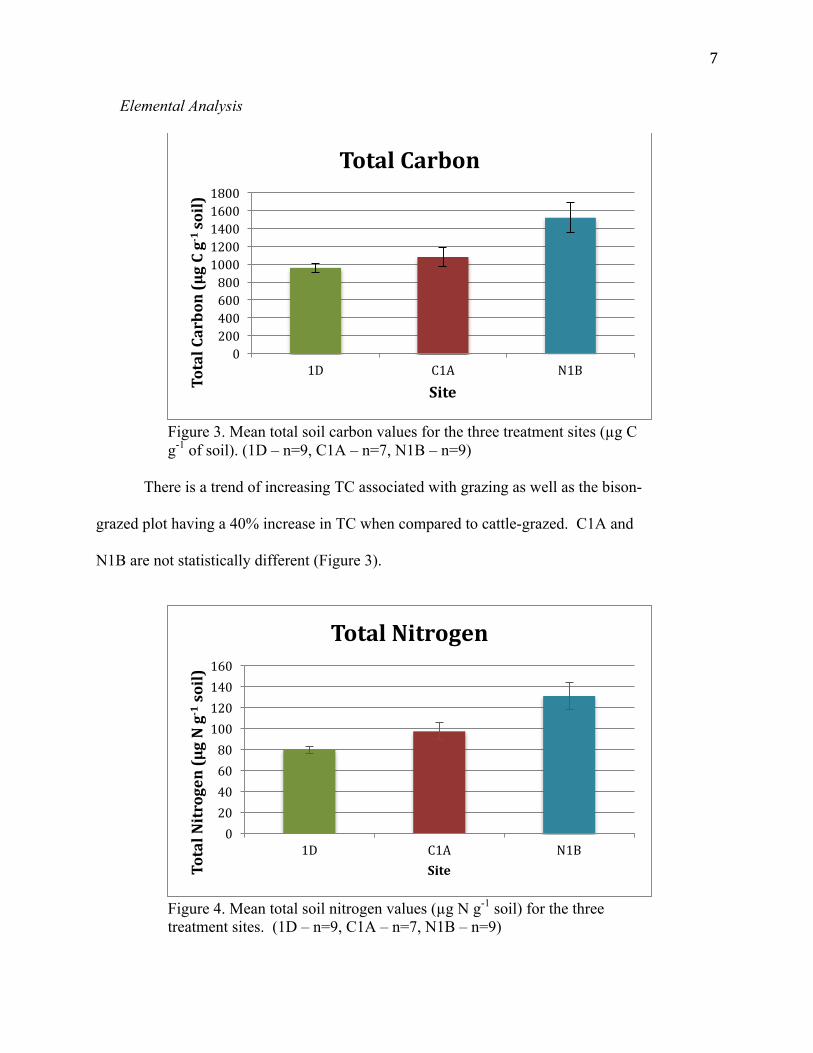
Similar to TC, there is a trend of increasing TN associated with grazing in
addition to the bison-grazed plot having a 35% increase in TN when compared to
cattle-grazed. However, C1A and N1B are statistically different (Figure 4).
Figure 5. Mean carbon:nitrogen ratio of roots across the three sites. (1D – n=10, C1A – n=9, N1B – n=9)
C:N analysis of roots showed the ungrazed site, 1D, having a significantly greater ratio
than the two grazed sites. There was no significant difference in the C/N content of roots from
either of the grazed sites, but N1B did have a slightly lower mean value (figure 5).
0102030405060708090
1D C1A N1B
C:N
Site
Carbon:Nitrogen(Roots)
9
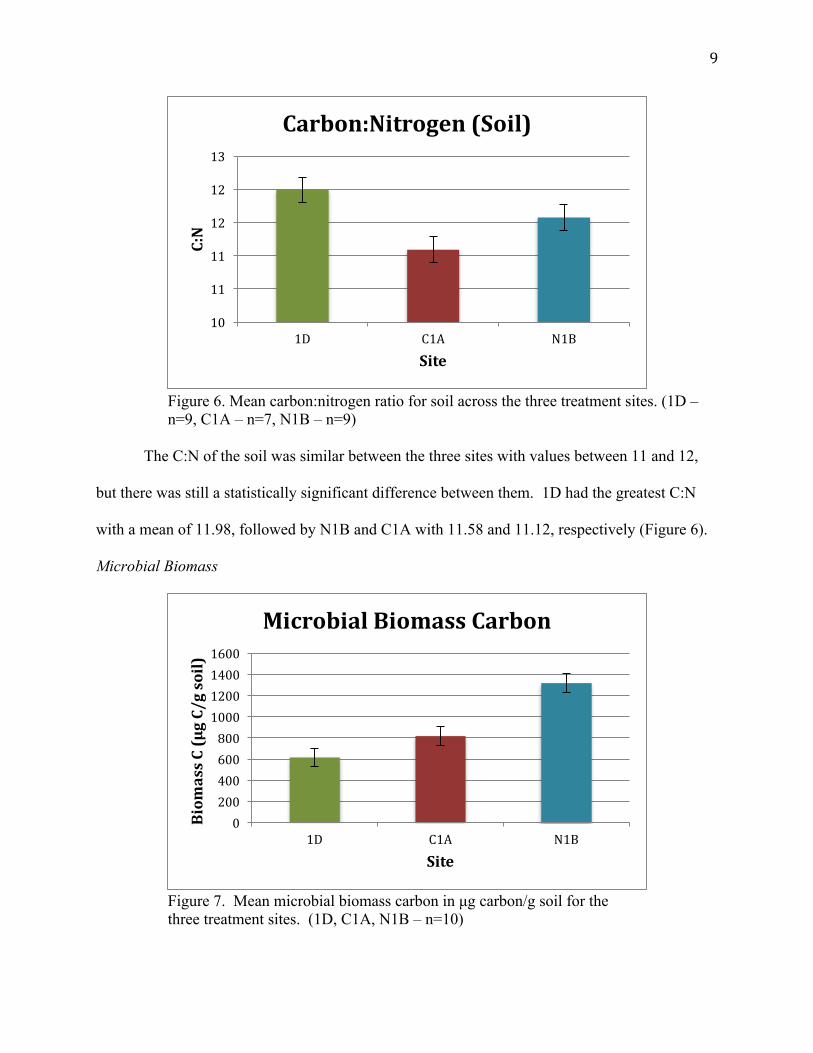
Figure 6. Mean carbon:nitrogen ratio for soil across the three treatment sites. (1D – n=9, C1A – n=7, N1B – n=9)
The C:N of the soil was similar between the three sites with values between 11 and 12,
but there was still a statistically significant difference between them. 1D had the greatest C:N
with a mean of 11.98, followed by N1B and C1A with 11.58 and 11.12, respectively (Figure 6).
Microbial Biomass
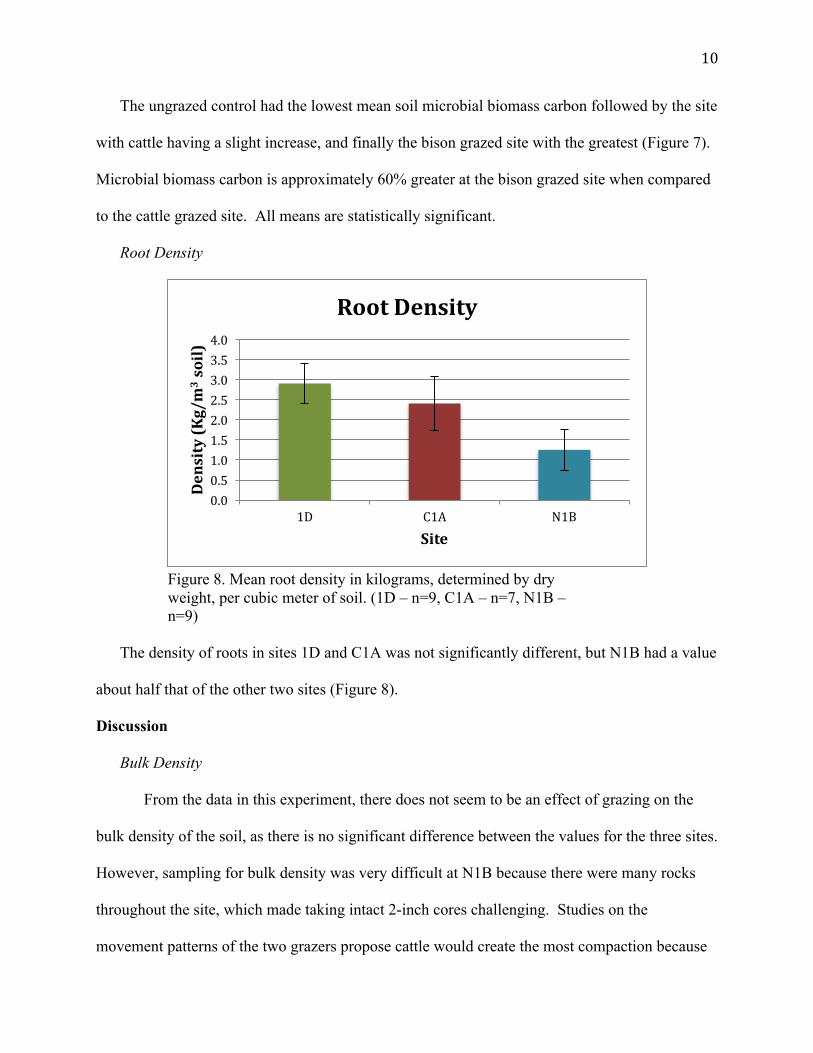
Figure 7. Mean microbial biomass carbon in µg carbon/g soil for the three treatment sites. (1D, C1A, N1B – n=10)
10
11
11
12
12
13
1D C1A N1B
C:N
Site
Carbon:Nitrogen(Soil)
02004006008001000120014001600
1D C1A N1B
Biom
assC(µgC/gsoil)
Site
MicrobialBiomassCarbon
10
The ungrazed control had the lowest mean soil microbial biomass carbon followed by the site
with cattle having a slight increase, and finally the bison grazed site with the greatest (Figure 7).
Microbial biomass carbon is approximately 60% greater at the bison grazed site when compared
to the cattle grazed site. All means are statistically significant.
Root Density
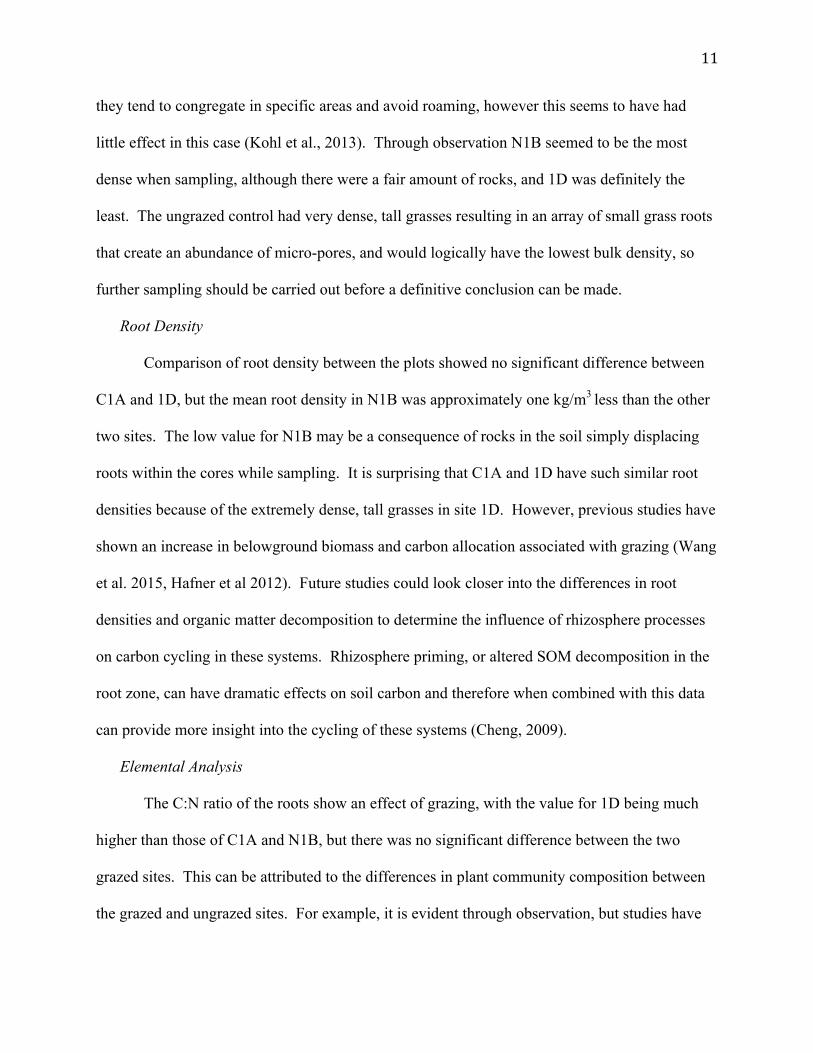
Figure 8. Mean root density in kilograms, determined by dry weight, per cubic meter of soil. (1D – n=9, C1A – n=7, N1B – n=9)
The density of roots in sites 1D and C1A was not significantly different, but N1B had a value
about half that of the other two sites (Figure 8).
Discussion
Bulk Density
From the data in this experiment, there does not seem to be an effect of grazing on the
bulk density of the soil, as there is no significant difference between the values for the three sites.
However, sampling for bulk density was very difficult at N1B because there were many rocks
throughout the site, which made taking intact 2-inch cores challenging. Studies on the
movement patterns of the two grazers propose cattle would create the most compaction because
0.00.51.01.52.02.53.03.54.0
1D C1A N1B
Density(Kg/m
3soil)
Site
RootDensity
11
they tend to congregate in specific areas and avoid roaming, however this seems to have had
little effect in this case (Kohl et al., 2013). Through observation N1B seemed to be the most
dense when sampling, although there were a fair amount of rocks, and 1D was definitely the
least. The ungrazed control had very dense, tall grasses resulting in an array of small grass roots
that create an abundance of micro-pores, and would logically have the lowest bulk density, so
further sampling should be carried out before a definitive conclusion can be made.
Root Density
Comparison of root density between the plots showed no significant difference between
C1A and 1D, but the mean root density in N1B was approximately one kg/m3 less than the other
two sites. The low value for N1B may be a consequence of rocks in the soil simply displacing
roots within the cores while sampling. It is surprising that C1A and 1D have such similar root
densities because of the extremely dense, tall grasses in site 1D. However, previous studies have
shown an increase in belowground biomass and carbon allocation associated with grazing (Wang
et al. 2015, Hafner et al 2012). Future studies could look closer into the differences in root
densities and organic matter decomposition to determine the influence of rhizosphere processes
on carbon cycling in these systems. Rhizosphere priming, or altered SOM decomposition in the
root zone, can have dramatic effects on soil carbon and therefore when combined with this data
can provide more insight into the cycling of these systems (Cheng, 2009).
Elemental Analysis
The C:N ratio of the roots show an effect of grazing, with the value for 1D being much
higher than those of C1A and N1B, but there was no significant difference between the two
grazed sites. This can be attributed to the differences in plant community composition between
the grazed and ungrazed sites. For example, it is evident through observation, but studies have
12
also shown dramatic increases in species richness and aboveground diversity associated with
grazing (Boughton, et al. 2016). Additionally, it is known that graminoids have a higher C:N
than forbs and other herbaceous plants (Towne, Hartnett, & Cochran, 2005). Therefore as a
result of predominately graminoid species growing in the ungrazed plot, the root C:N is much
higher than those of the grazed plots which have a variety of forbs and herbaceous plant species
growing on them.
The values for total nitrogen (TN) and total carbon (TC) in the soils reflect the results of
the microbial biomass carbon analysis and therefore can give insight into soil carbon and
nitrogen pools in these two systems. The bison-grazed plot had a 35% and 45% increase in TN
and TC respectively when compared to the cattle-grazed. Plant community composition has
cascading effects on microbial processes and nutrient cycling which can lead to significant
effects on soil carbon and nitrogen content (Hooper & Vitousek, 1998). Therefore, the increase
in TC and TN in the soils of N1B could be attributed to the known preferences in resource
selection between the two ungulates and the resulting differences in plant community
composition (Towne, Hartnett, & Cochran, 2005).
The C:N of the soil for the three sites, despite being statistically different, were very
similar with all three values falling between 11.12-11.98. However, globally the majority of soil
C:N ratios fall within this range, so even a slight variation is a notable difference (Batjes, 1996).
Also, feedback from the stable isotope laboratory indicated that high levels of organic matter in
the soil resulted in incomplete combustion and chromatography. Therefore, decreasing the
sample size for EA-iRMS analysis would provide more accurate results if the analysis were to be
repeated.
13
Microbial Biomass
The trend of increasing microbial biomass carbon associated with grazing is supported by
studies that found more carbon being allocated belowground when aboveground biomass is
being continually removed (Hafner et al, 2012). With more carbon being sent belowground,
there is an increased food source for the microbial population as a result of increased root
turnover, presence of more root exudates, or both. Similarly, a previous study by Aldezabal et
al. (2015) found that an increase in root density and exudation in the top 10 centimeters of the
soil as a result of grazing led to increased microbial activity. Likewise, an important factor is the
quality (C:N primarily) of the food source for the microbial population. Microbes need a food
source with a C:N of approximately 24:1, with anything above that slowing down
decomposition. Therefore, root turnover and exudation, being one of the only fresh organic
matter inputs below the surface, can greatly influence microbial activity. With 1D having such a
high root C:N ratio (mean = 77.2) compared to C1A (52.1) and N1B (44.6), it is not surprising
the MBC was lower.
The results for microbial biomass carbon seem higher than anticipated for a healthy
prairie soil, but this could be explained by the amount of time between sampling and analysis.
There was a three week period before substrate induced resperation was completed when the
samples were transported from Kansas to the University of California, Santa Cruz. Even though
the soil was refrigerated or kept in a cooler with ice packs at all times to maintain a temperature
of 4 degrees celsius, metabolic activity over time would utilize some of the available carbon to
grow the microbial population.
14
Conclusions
The positive effects of grazing on carbon cycling and the associated implications for
carbon sequestration and global warming have been researched in different systems around the
globe (Hafner et al., 2012; Wang, 2015, Han et al., 2016), but only for cattle grazed lands and
traditionally through grazing exclusion. This study supports those findings and suggests that in a
tallgrass prairie, the effect may be even greater when bison as opposed to cattle graze the land.
Elevated levels of microbial biomass carbon, total nitrogen, and total carbon equate to increased
carbon and nitrogen cycling as well as greater pools sequestered in the soil.
Further research should be done to quantify the direct effects on carbon and nitrogen
cycling in lands grazed by various ungulates, as the implications in the United States alone could
be dramatic. Bison have largely recovered since the 1980’s when over thirty million were killed,
and currently graze a large portion of the American Midwest. Their reintroduction and role as
grazers could have lasting effects on the battle against global warming and should not be
dismissed (Craine, et al. 2015).
15
Works Cited
Aldezabal, A., Moragues, L., Odriozola, I., & Mijangos, I. (2015). Impact of grazing
abandonment on plant and soil microbial communities in an Atlantic mountain grassland.
Applied Soil Ecology, 96, 251-260
Anderson, J. P E., & Domsch, K. H. (1978). A physiological method for the quantitative
measurement of microbial biomass in soils. Soil Biology and Biochemistry, 10(3), 215-
221
Batjes, N.H. (1996). Total carbon and nitrogen in the soils of the world. European Journal of
Soil Science, 47, 151-163
Boughton, E. H., Quintana-Ascencio, P. F., Bohlen, P. J., Fauth, J. E., & Jenkins, D. G. (2016).
Interactive effects of pasture management intensity, release from grazing and prescribed
fire on forty subtropical wetland plant assemblages. Journal of Applied Ecology, 53, 159-
170
Cheng, W. (2009). Rhizosphere priming effect: Its functional relationships with microbial
turnover, evapotranspiration, and C-N budgets. Soil Biology & Biochemistry, 41, 1795-
1801
Craine, J. M., Towne, E. G., Miller, M., & Fierer, N. (2015). Climatic warming and the future of
bison as grazers. Scientific Reports, 5, 16738
Davidson, E. A. & Janssens, I. A. (2006). Temperature sensitivity of soil carbon decomposition
and feedbacks to climate change. Nature, 7081, 165-173
Hafner, S., Unteregelsbacher, S., Seeber, E., Lena, B., Xu, X., Li, X., Guggenberger, G., Miege,
G., Kuzyakov, Y. (2012). Effect of grazing on carbon stocks and assimilate partitioning
16
in a Tibetan montane pasture revealed by 13CO2 pulse labeling. Global Change Biology,
18, 528-538
Han, Q., Luo, G., Li, C., Shakir, A., Wu, M., & Saidov, A. (2016). Simulated grazing effects on
carbon emission in Central Asia. Agricultural and Forest Meteorology, 216, 203-214
Hooper, D.U., & Vitousek, P.M. (1998). Effects of plant composition and diversity on nutrient
cycling. Ecological Monographs, 68(1), 121-149
Kohl, M. T., Krausman, P. R., Kunkel, K., & Williams, D. M. (2013). Bison versus cattle: are
they ecologically synonymous? Rangeland Ecology & Management, 66(6), 721-731
Six, J., Frey, S. D., Thiet, R. K., & Batten, K. M. (2006) Bacterial and fungal contributions to
carbon sequestration in agroecosystems. Soil Science Society of America Journal, 70(2),
555-569
Towne, E. G., Hartnett, D. C., & Cochrane, R. C., (2005). Vegetation trends in tallgrass prairie
from bison and cattle grazing. Ecological Applications, 15(5), 1550-1559
Wang, K., Deng, L., Ren, Z., Li, J., Shangguan, Z. (2015). Grazing exclusion significantly
improves grassland ecosystem C and N pools in a desert steppe of Northwest China.
Catena, 137, 441-448