innovative solutions, expanded capabilities, …
TRANSCRIPT
THE NEW CB&I.
INNOVATIVE SOLUTIONS,
EXPANDED CAPABILITIES,
GREATER SCOPE AND
CONSISTENT PERFORMANCE
WORLDWIDE.
C H I C A G O B R I D G E & I R O N C O M PA N Y N . V. 2 0 0 2 A N N U A L R E P O R T
C B & I 2 0 0 2 A N N U A L R E P O R T
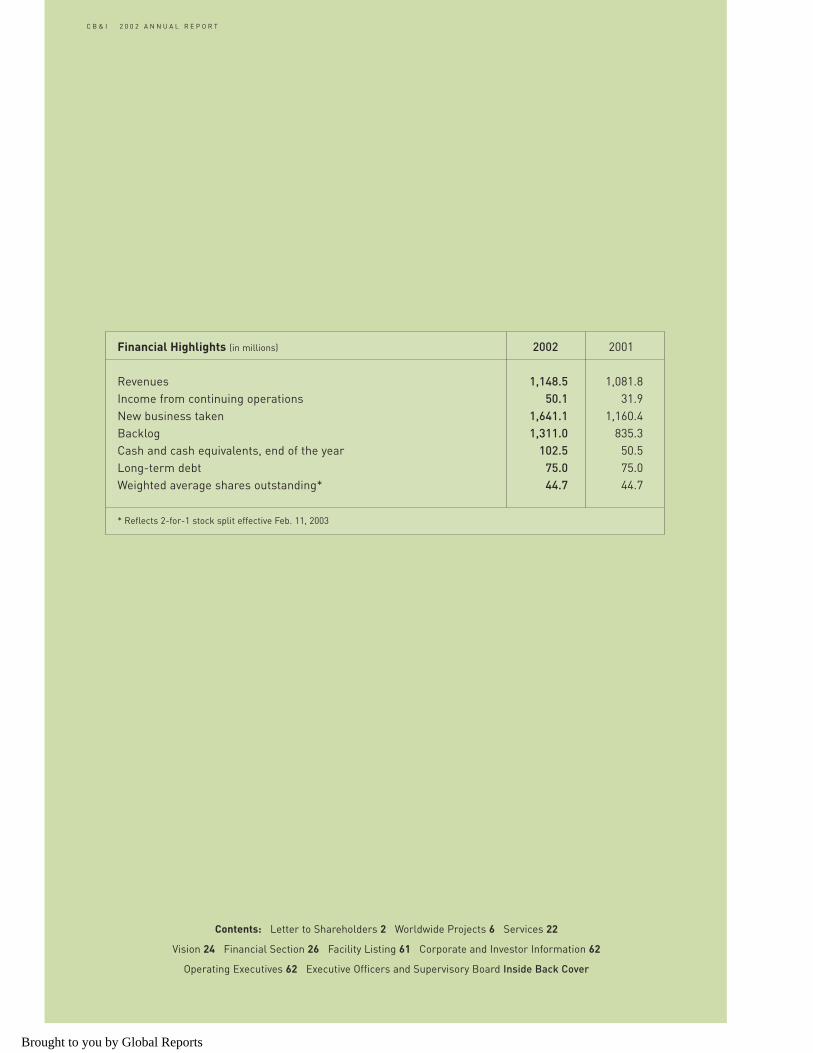
Financial Highlights (in millions) 2002 2001
Revenues 1,148.5 1,081.8Income from continuing operations 50.1 31.9New business taken 1,641.1 1,160.4Backlog 1,311.0 835.3Cash and cash equivalents, end of the year 102.5 50.5Long-term debt 75.0 75.0Weighted average shares outstanding* 44.7 44.7
* Reflects 2-for-1 stock split effective Feb. 11, 2003
Contents: Letter to Shareholders 2 Worldwide Projects 6 Services 22
Vision 24 Financial Section 26 Facility Listing 61 Corporate and Investor Information 62
Operating Executives 62 Executive Officers and Supervisory Board Inside Back Cover
Brought to you by Global Reports
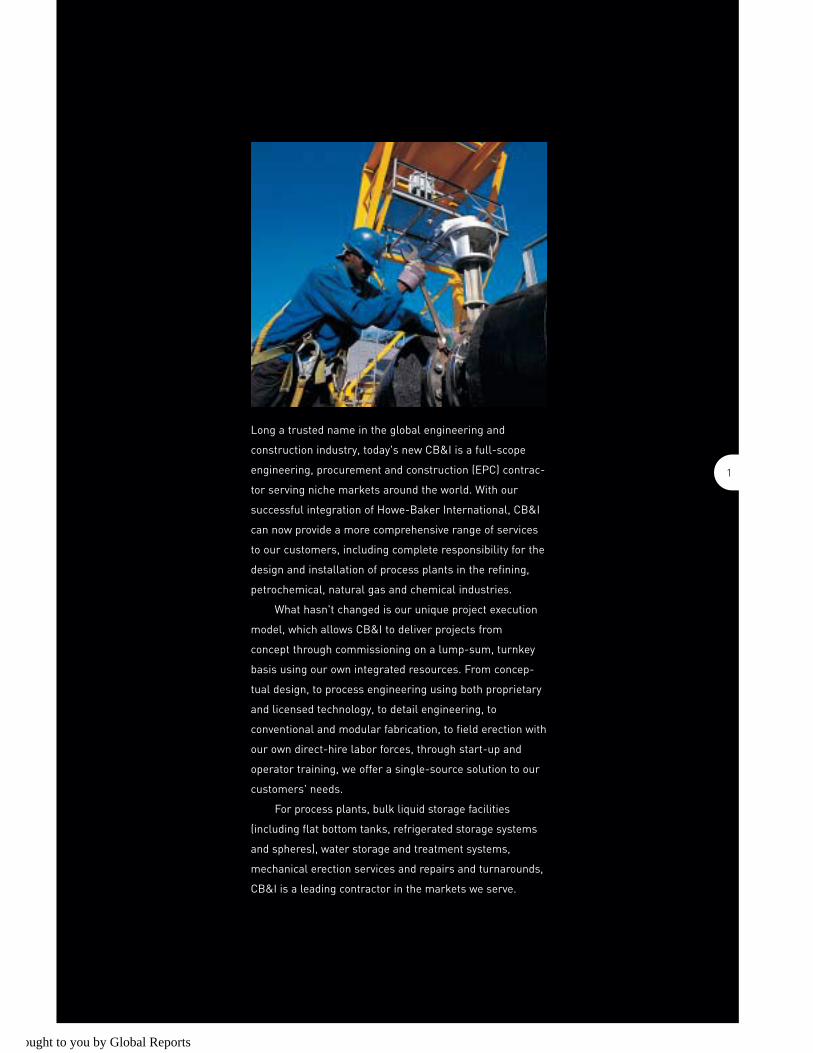
Long a trusted name in the global engineering and
construction industry, today's new CB&I is a full-scope
engineering, procurement and construction (EPC) contrac-
tor serving niche markets around the world. With our
successful integration of Howe-Baker International, CB&I
can now provide a more comprehensive range of services
to our customers, including complete responsibility for the
design and installation of process plants in the refining,
petrochemical, natural gas and chemical industries.
What hasn't changed is our unique project execution
model, which allows CB&I to deliver projects from
concept through commissioning on a lump-sum, turnkey
basis using our own integrated resources. From concep-
tual design, to process engineering using both proprietary
and licensed technology, to detail engineering, to
conventional and modular fabrication, to field erection with
our own direct-hire labor forces, through start-up and
operator training, we offer a single-source solution to our
customers' needs.
For process plants, bulk liquid storage facilities
(including flat bottom tanks, refrigerated storage systems
and spheres), water storage and treatment systems,
mechanical erection services and repairs and turnarounds,
CB&I is a leading contractor in the markets we serve.
1
ought to you by Global Reports
Can a company that's been around since 1889 truly be "new", or is it really the same company that our
customers have relied on for more than a century?
The answer to both questions is yes.
What's New
The new CB&I is a fully-integrated, full-service engineering, procurement and construction (EPC) company
that can manage the entire scope of large-scale process plant design and installation projects, as well as
turnkey storage facilities. We marshal these capabilities on a global basis for our customers in several high
growth end markets, including hydrocarbon refining, natural gas, water and the energy sector in general.
The new CB&I combines the process engineering know-how of Howe-Baker International (acquired in
December 2000) and CB&I's worldwide sales and operations infrastructure. The result is a nimble, technically
savvy company that can help add value to our customers in more ways than ever before.
A good example is a current project in Saudi Arabia, where CB&I has had a presence for some 75 years.
Here, long-time CB&I customer Saudi Aramco is taking advantage of our expanded capabilities by contracting
with us to engineer and construct a turnkey gas/oil separation plant (GOSP) as part of the Qatif oilfield devel-
opment project. It's a job that would have been beyond the scope of the "old" CB&I, and that Howe-Baker,
which has built numerous GOSPs, would have had difficulty executing without in-country resources. Our
expertise in process engineering, combined with our local fabrication and field erection capabilities, afford
Aramco a single-source solution with an established business partner.
What Hasn't Changed
While the scope of our technology and our ability to tackle large-scale EPC projects has grown, mission-criti-
cal CB&I business practices that our customers have come to expect have not changed. We still specialize in
lump-sum, turnkey project execution that provides cost and schedule certainty to our customers. This project
execution model focuses on providing facilities and systems, not services or work-hours. We still do almost
everything it takes to deliver a project with our own forces – direct-hire employees working for CB&I. From
design and estimating, to engineering, procurement and fabrication, to construction, commissioning and start-
up, we do it all with our own people.
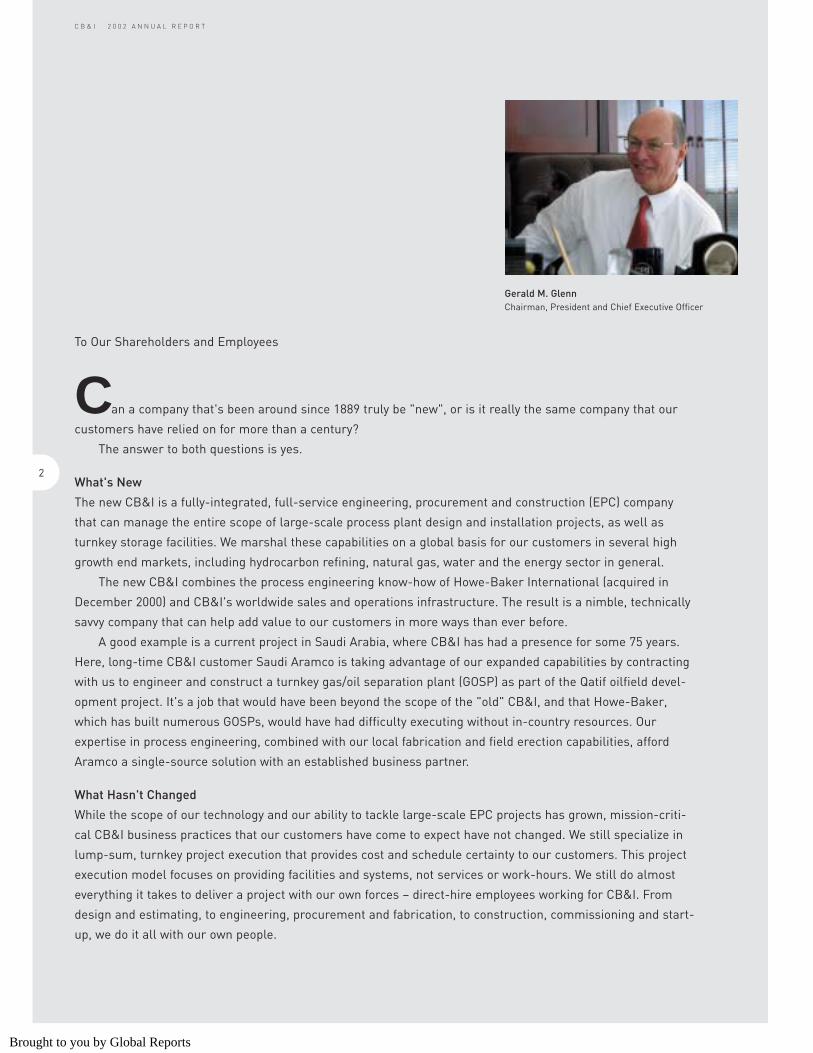
Gerald M. GlennChairman, President and Chief Executive Officer
C B & I 2 0 0 2 A N N U A L R E P O R T
To Our Shareholders and Employees
2
Brought to you by Global Reports
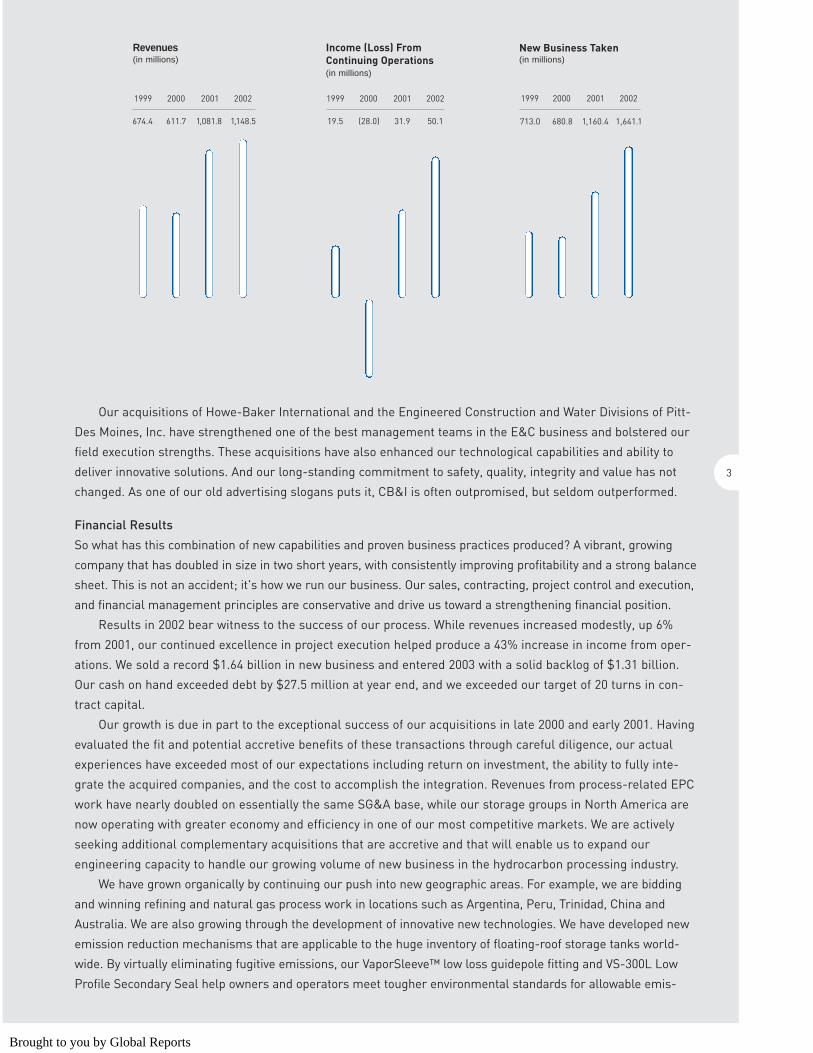
1999 2000 2001 2002 1999 2000 2001 2002 1999 2000 2001 2002
Revenues (in millions)
Income (Loss) FromContinuing Operations(in millions)
713.0 680.8 1,160.4 1,641.1
New Business Taken(in millions)
Our acquisitions of Howe-Baker International and the Engineered Construction and Water Divisions of Pitt-
Des Moines, Inc. have strengthened one of the best management teams in the E&C business and bolstered our
field execution strengths. These acquisitions have also enhanced our technological capabilities and ability to
deliver innovative solutions. And our long-standing commitment to safety, quality, integrity and value has not
changed. As one of our old advertising slogans puts it, CB&I is often outpromised, but seldom outperformed.
Financial Results
So what has this combination of new capabilities and proven business practices produced? A vibrant, growing
company that has doubled in size in two short years, with consistently improving profitability and a strong balance
sheet. This is not an accident; it's how we run our business. Our sales, contracting, project control and execution,
and financial management principles are conservative and drive us toward a strengthening financial position.
Results in 2002 bear witness to the success of our process. While revenues increased modestly, up 6%
from 2001, our continued excellence in project execution helped produce a 43% increase in income from oper-
ations. We sold a record $1.64 billion in new business and entered 2003 with a solid backlog of $1.31 billion.
Our cash on hand exceeded debt by $27.5 million at year end, and we exceeded our target of 20 turns in con-
tract capital.
Our growth is due in part to the exceptional success of our acquisitions in late 2000 and early 2001. Having
evaluated the fit and potential accretive benefits of these transactions through careful diligence, our actual
experiences have exceeded most of our expectations including return on investment, the ability to fully inte-
grate the acquired companies, and the cost to accomplish the integration. Revenues from process-related EPC
work have nearly doubled on essentially the same SG&A base, while our storage groups in North America are
now operating with greater economy and efficiency in one of our most competitive markets. We are actively
seeking additional complementary acquisitions that are accretive and that will enable us to expand our
engineering capacity to handle our growing volume of new business in the hydrocarbon processing industry.
We have grown organically by continuing our push into new geographic areas. For example, we are bidding
and winning refining and natural gas process work in locations such as Argentina, Peru, Trinidad, China and
Australia. We are also growing through the development of innovative new technologies. We have developed new
emission reduction mechanisms that are applicable to the huge inventory of floating-roof storage tanks world-
wide. By virtually eliminating fugitive emissions, our VaporSleeve™ low loss guidepole fitting and VS-300L Low
Profile Secondary Seal help owners and operators meet tougher environmental standards for allowable emis-
674.4 611.7 1,081.8 1,148.5 19.5 (28.0) 31.9 50.1
3
Brought to you by Global Reports
sions of volatile organic compounds (VOCs). Our Howe-Baker unit has been quite successful in winning clean
fuels work. We believe CB&I has won more LNG work worldwide in the last several years than any other contrac-
tor in the world.
Corporate Responsibility
As has been vividly demonstrated in the past several years, financial success that comes at the expense of eth-
ical and moral standards can lead to ruin. CB&I's reputation has been built on years of honesty, integrity and
fair dealings with our customers and full observance of regulatory requirements worldwide. We are already
complying with the requirements of the Sarbanes-Oxley Act of 2002, and with all other applicable rules and
regulations governing our business activities.
Here is how we describe our commitment in our "Standards of Business Conduct":
"CB&I is strongly committed to conducting its worldwide business activities in accordance with high ethical
standards that are derived from such fundamental human values as honesty, integrity, reliability, fairness,
mutual respect and trust. We believe this is the right way to operate our businesses. We believe that all those
involved with our businesses, including customers, suppliers, employees, shareholders and the communities
where we do business, stand to benefit when these standards guide our relationships.
"Accordingly, we expect all of our employees, as well as our consultants, agents, suppliers and contractors, to
perform their work with honesty, integrity and in full compliance with all applicable laws and regulations. This
is a long-standing Company policy that has served us well for more than 100 years of our existence. It is a pol-
icy that cannot be compromised under any circumstance or situation."
Being a good corporate citizen involves supporting communities in locations around the world where our
employees live and work. CB&I employees are involved in health and human service, civic and educational
organizations in communities across the globe. We provide monetary support to local not-for-profit organiza-
tions, primarily though annual campaigns at our U.S. locations and related efforts at facilities outside the U.S.
We hire and train local workers at our jobsites worldwide, often providing a marketable skill to people who
previously had significantly lower wage-earning potential. We do business with local suppliers whenever possi-
ble. And we operate our facilities and jobsites so as to comply with all applicable environmental regulations.
C B & I 2 0 0 2 A N N U A L R E P O R T
The new CB&I combines the process engineering know-how of Howe-BakerInternational (acquired in December 2000)and CB&I's worldwide sales and opera-tions infrastructure. The result is a nimble, technically savvy company thatcan help add value to our customers inmore ways than ever before.
While the scope of our technology and ourability to tackle large-scale EPC projectshas grown, mission-critical CB&I businesspractices that our customers have cometo expect have not changed. We still specialize in lump-sum, turnkey projectexecution that provides cost and schedulecertainty to our customers.
4
Brought to you by Global Reports
Long-Term Strategy
Our vision is to be the leader in providing innovative and value-added engineering and construction solutions to
customers worldwide while creating superior shareholder value. We are turning this vision into reality by con-
tinuing to execute our business strategy.
The elements of this strategy for 2003-2005 include:
• Step-change growth in revenue, profitability and shareholder value through acquisitions and other business
combinations, successful integration of acquired companies and realization of cost and revenue synergies.
• Maintaining financial strength, balance sheet liquidity and exceptional financial relationships.
• Attracting, developing and retaining superior personnel.
• Proactive, team-oriented cost management.
• Maintaining an effective global marketing process.
• Enhancing shareholder value through consistent performance, financial strength and profitable growth.
I'm pleased to report that our management team and employees have improved operations to the point where
excellence in project execution has become the norm around the world. Our financial and marketing efforts
have produced a fiscally strong company with record sales. We believe we have assembled one of the best
management teams in the industry. And we've achieved our targets for revenue and earnings growth and
return on invested capital. Based on these accomplishments, we are confident in our ability to continue to
deliver ongoing growth in shareholder value. We thank our employees, customers, suppliers and shareholders
for your continuing support.
Gerald M. GlennChairman, President and Chief Executive Officer
We are actively seeking additional complementary acquisitions thatare accretive and that will enable usto expand our engineering capacityto handle our growing volume ofnew business in the hydrocarbonprocessing industry.
CB&I is strongly committed to conducting its worldwide businessactivities in accordance with highethical standards that are derivedfrom such fundamental human values as honesty, integrity, reliability, fairness, mutual respectand trust.
...our management team andemployees have improved opera-tions to the point where excellencein project execution has becomethe norm around the world. Ourfinancial and marketing effortshave produced a fiscally strongcompany with record sales.
5
Brought to you by Global Reports
6
C B & I 2 0 0 2 A N N U A L R E P O R T
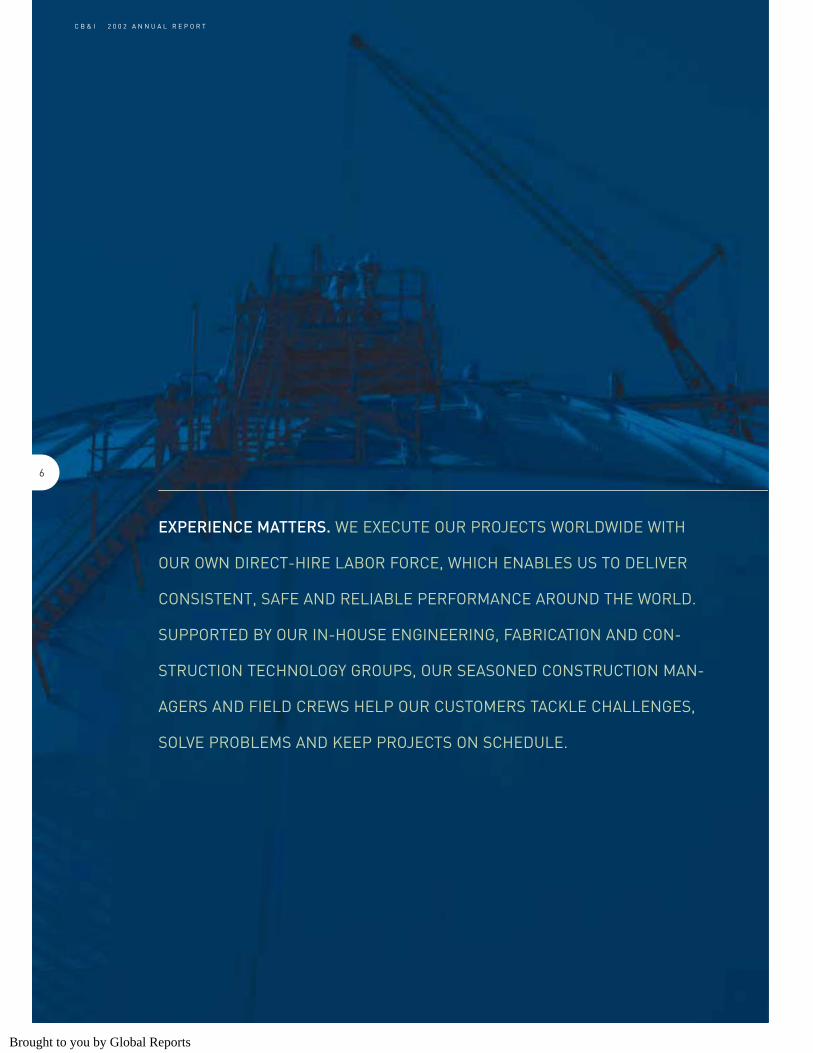
EXPERIENCE MATTERS. WE EXECUTE OUR PROJECTS WORLDWIDE WITH
OUR OWN DIRECT-HIRE LABOR FORCE, WHICH ENABLES US TO DELIVER
CONSISTENT, SAFE AND RELIABLE PERFORMANCE AROUND THE WORLD.
SUPPORTED BY OUR IN-HOUSE ENGINEERING, FABRICATION AND CON-
STRUCTION TECHNOLOGY GROUPS, OUR SEASONED CONSTRUCTION MAN-
AGERS AND FIELD CREWS HELP OUR CUSTOMERS TACKLE CHALLENGES,
SOLVE PROBLEMS AND KEEP PROJECTS ON SCHEDULE.
Brought to you by Global Reports
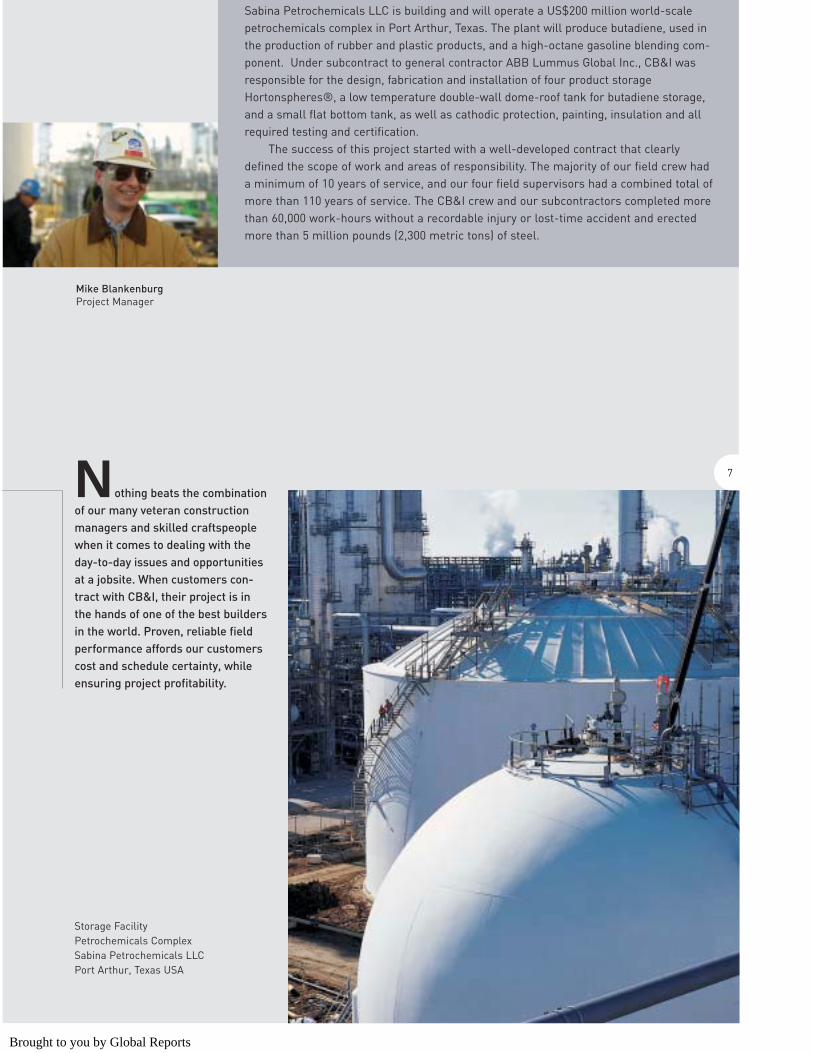
Mike BlankenburgProject Manager
Nothing beats the combinationof our many veteran constructionmanagers and skilled craftspeoplewhen it comes to dealing with theday-to-day issues and opportunitiesat a jobsite. When customers con-tract with CB&I, their project is inthe hands of one of the best buildersin the world. Proven, reliable fieldperformance affords our customerscost and schedule certainty, whileensuring project profitability.
Storage FacilityPetrochemicals ComplexSabina Petrochemicals LLCPort Arthur, Texas USA
7
Sabina Petrochemicals LLC is building and will operate a US$200 million world-scale petrochemicals complex in Port Arthur, Texas. The plant will produce butadiene, used inthe production of rubber and plastic products, and a high-octane gasoline blending com-ponent. Under subcontract to general contractor ABB Lummus Global Inc., CB&I wasresponsible for the design, fabrication and installation of four product storageHortonspheres®, a low temperature double-wall dome-roof tank for butadiene storage,and a small flat bottom tank, as well as cathodic protection, painting, insulation and allrequired testing and certification.
The success of this project started with a well-developed contract that clearly defined the scope of work and areas of responsibility. The majority of our field crew had a minimum of 10 years of service, and our four field supervisors had a combined total ofmore than 110 years of service. The CB&I crew and our subcontractors completed morethan 60,000 work-hours without a recordable injury or lost-time accident and erectedmore than 5 million pounds (2,300 metric tons) of steel.
Brought to you by Global Reports
OUR SUCCESSFUL ACQUISITIONS HAVE TRANSFORMED CB&I INTO A
FULL-SERVICE EPC PROVIDER. WE DO NEARLY EVERYTHING IT TAKES
TO DELIVER A PROJECT WITH OUR OWN FORCES. OUR UNIQUE PROJECT
EXECUTION MODEL ENABLES US TO PROFITABLY MANAGE THE RISK OF
FIXED-PRICE CONTRACTS, WHILE OUR CUSTOMERS BENEFIT FROM
PROJECTS SAFELY DELIVERED ON SCHEDULE, WITHIN BUDGET AND
WITH OPTIMAL OPERATING EFFICIENCY AND THROUGHPUT.
C B & I 2 0 0 2 A N N U A L R E P O R T
8
Brought to you by Global Reports
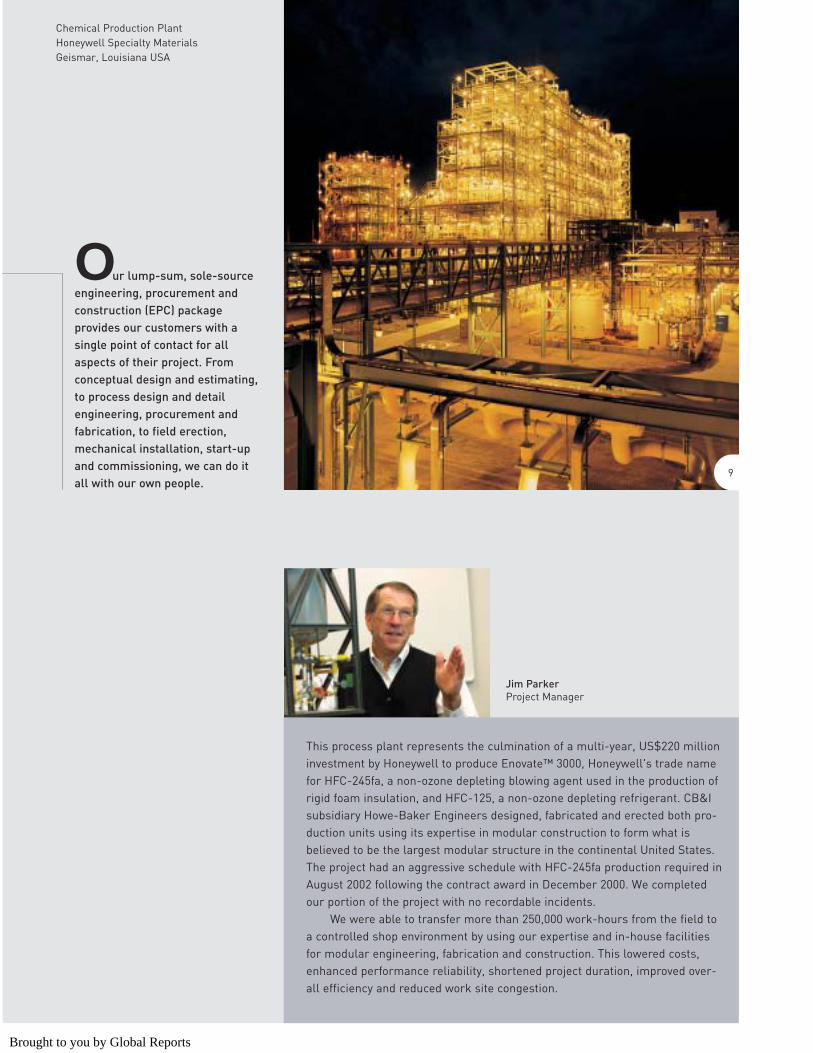
Our lump-sum, sole-sourceengineering, procurement and construction (EPC) package provides our customers with a single point of contact for allaspects of their project. From conceptual design and estimating,to process design and detail engineering, procurement and fabrication, to field erection,mechanical installation, start-upand commissioning, we can do it all with our own people.
Jim ParkerProject Manager
Chemical Production PlantHoneywell Specialty MaterialsGeismar, Louisiana USA
9
This process plant represents the culmination of a multi-year, US$220 millioninvestment by Honeywell to produce Enovate™ 3000, Honeywell's trade namefor HFC-245fa, a non-ozone depleting blowing agent used in the production ofrigid foam insulation, and HFC-125, a non-ozone depleting refrigerant. CB&Isubsidiary Howe-Baker Engineers designed, fabricated and erected both pro-duction units using its expertise in modular construction to form what isbelieved to be the largest modular structure in the continental United States.The project had an aggressive schedule with HFC-245fa production required inAugust 2002 following the contract award in December 2000. We completedour portion of the project with no recordable incidents.
We were able to transfer more than 250,000 work-hours from the field toa controlled shop environment by using our expertise and in-house facilitiesfor modular engineering, fabrication and construction. This lowered costs,enhanced performance reliability, shortened project duration, improved over-all efficiency and reduced work site congestion.
Brought to you by Global Reports
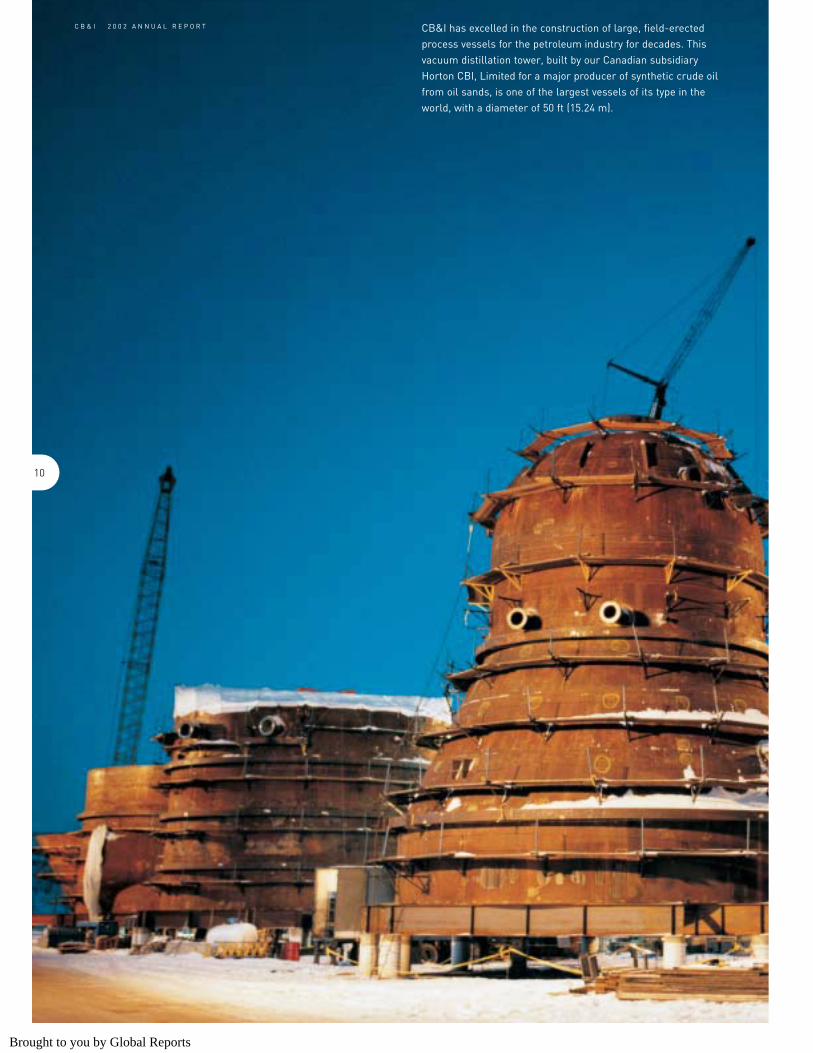
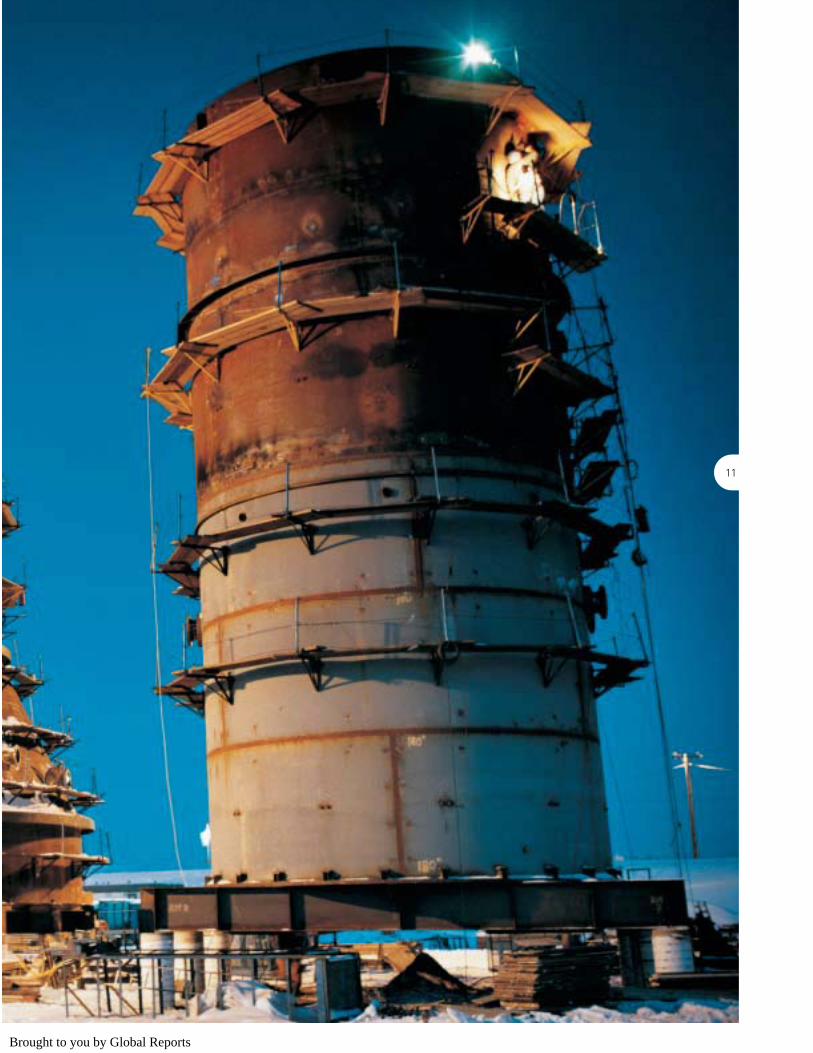
CB&I has excelled in the construction of large, field-erectedprocess vessels for the petroleum industry for decades. Thisvacuum distillation tower, built by our Canadian subsidiaryHorton CBI, Limited for a major producer of synthetic crude oilfrom oil sands, is one of the largest vessels of its type in theworld, with a diameter of 50 ft (15.24 m).
C B & I 2 0 0 2 A N N U A L R E P O R T
10
Brought to you by Global Reports
11
Brought to you by Global Reports
C B & I 2 0 0 2 A N N U A L R E P O R T
WITH OUR EMPHASIS ON LUMP-SUM TURNKEY PROJECTS, CB&I IS
FOCUSED ON DELIVERING STRUCTURES AND SOLUTIONS. DRAWING ON
OUR KNOW-HOW AND PROPRIETARY TECHNOLOGY, OUR EXPERIENCED
PROCESS AND DESIGN ENGINEERS USE STATE-OF-THE-ART ENGINEER-
ING PROGRAMS TO DEVELOP SYSTEMS AND STRUCTURES THAT MEET
OR EXCEED OUR CUSTOMERS' REQUIREMENTS. SUPERIOR VALUE AND
RELIABILITY, ALONG WITH OPTIMAL OPERATING EFFICIENCY AND
THROUGHPUT, ARE CHARACTERISTICS OF A CB&I-BUILT PROJECT.
12
Brought to you by Global Reports
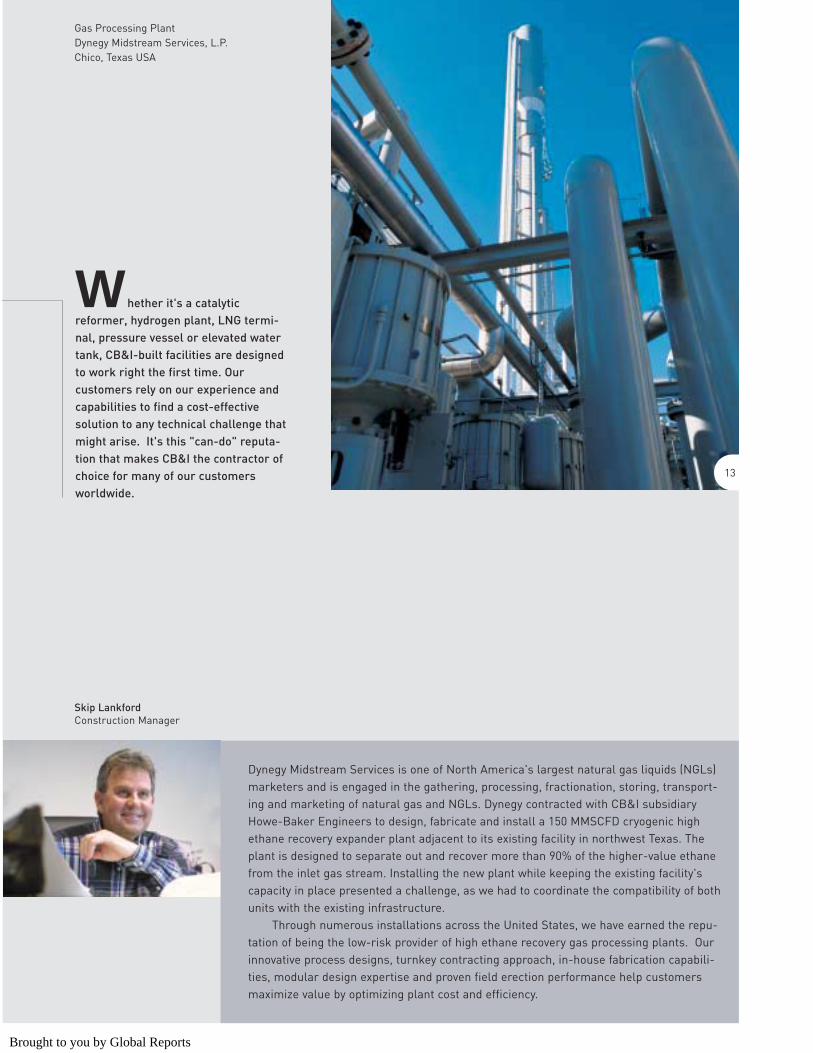
Whether it's a catalyticreformer, hydrogen plant, LNG termi-nal, pressure vessel or elevated watertank, CB&I-built facilities are designedto work right the first time. Our customers rely on our experience andcapabilities to find a cost-effectivesolution to any technical challenge thatmight arise. It's this "can-do" reputa-tion that makes CB&I the contractor ofchoice for many of our customersworldwide.
Skip LankfordConstruction Manager
Gas Processing PlantDynegy Midstream Services, L.P.Chico, Texas USA
13
Dynegy Midstream Services is one of North America's largest natural gas liquids (NGLs)marketers and is engaged in the gathering, processing, fractionation, storing, transport-ing and marketing of natural gas and NGLs. Dynegy contracted with CB&I subsidiaryHowe-Baker Engineers to design, fabricate and install a 150 MMSCFD cryogenic highethane recovery expander plant adjacent to its existing facility in northwest Texas. Theplant is designed to separate out and recover more than 90% of the higher-value ethanefrom the inlet gas stream. Installing the new plant while keeping the existing facility'scapacity in place presented a challenge, as we had to coordinate the compatibility of bothunits with the existing infrastructure.
Through numerous installations across the United States, we have earned the repu-tation of being the low-risk provider of high ethane recovery gas processing plants. Ourinnovative process designs, turnkey contracting approach, in-house fabrication capabili-ties, modular design expertise and proven field erection performance help customersmaximize value by optimizing plant cost and efficiency.
Brought to you by Global Reports
INNOVATION, KNOW-HOW, AND PATENTED AND PROPRIETARY
TECHNOLOGY ARE HALLMARKS OF CB&I. WE HAVE BEEN AT THE
FOREFRONT OF MANY GROUNDBREAKING INDUSTRY DEVELOPMENTS,
INCLUDING THE INTRODUCTION OF THE FLOATING-ROOF STORAGE
TANK TO THE PETROLEUM INDUSTRY. HOWE-BAKER'S PROPRIETARY
TECHNOLOGY IN REFINING AND NATURAL GAS PROCESSING HAS FUR-
THERED OUR REPUTATION AS A TECHNICAL INNOVATOR IN THE ENGI-
NEERING AND CONSTRUCTION INDUSTRY.
C B & I 2 0 0 2 A N N U A L R E P O R T
14
Brought to you by Global Reports
M ore than 75 active U.S.patents are currently held by CB&I,and our engineers participate inmany of the professional associa-tions that set international standardsfor the design and construction ofequipment and facilities. OurConstruction Technology and Weldingand Quality Assurance groups support our field forces with con-structability studies, heavy lift plans,documented construction procedures, and a complete weldingand metallurgical laboratory.
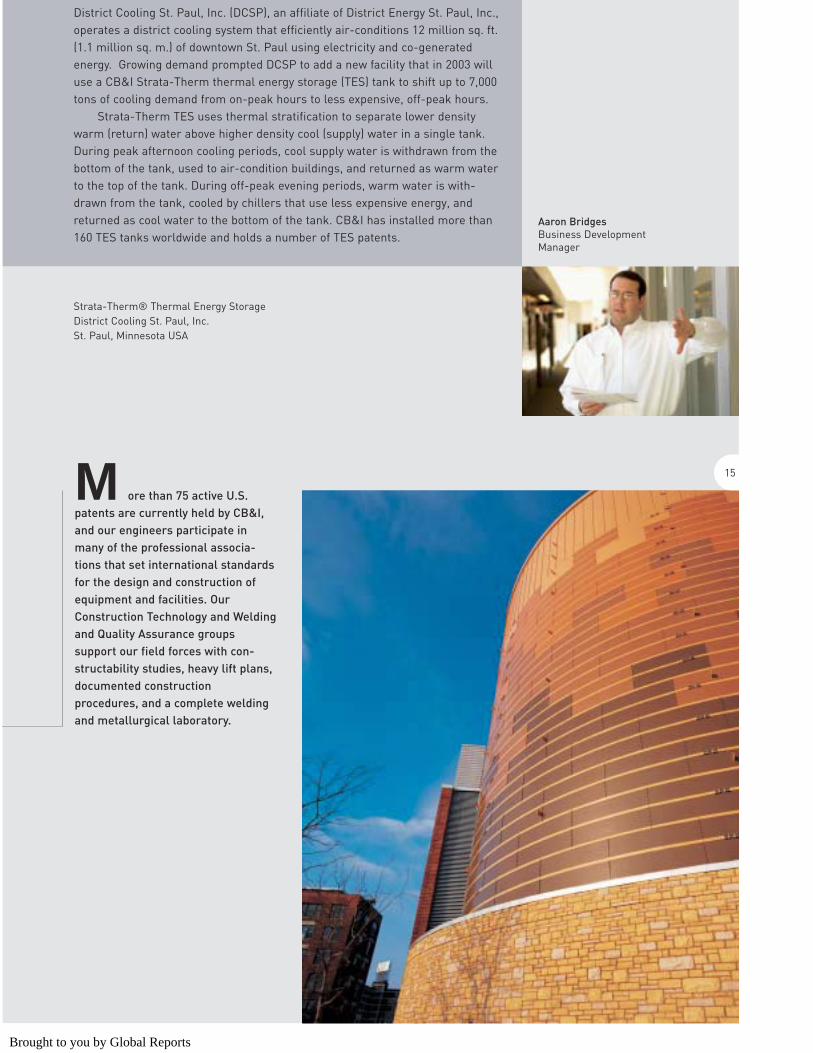
District Cooling St. Paul, Inc. (DCSP), an affiliate of District Energy St. Paul, Inc.,operates a district cooling system that efficiently air-conditions 12 million sq. ft.(1.1 million sq. m.) of downtown St. Paul using electricity and co-generatedenergy. Growing demand prompted DCSP to add a new facility that in 2003 willuse a CB&I Strata-Therm thermal energy storage (TES) tank to shift up to 7,000tons of cooling demand from on-peak hours to less expensive, off-peak hours.
Strata-Therm TES uses thermal stratification to separate lower densitywarm (return) water above higher density cool (supply) water in a single tank.During peak afternoon cooling periods, cool supply water is withdrawn from thebottom of the tank, used to air-condition buildings, and returned as warm waterto the top of the tank. During off-peak evening periods, warm water is with-drawn from the tank, cooled by chillers that use less expensive energy, andreturned as cool water to the bottom of the tank. CB&I has installed more than160 TES tanks worldwide and holds a number of TES patents.
Aaron Bridges Business DevelopmentManager
Strata-Therm® Thermal Energy StorageDistrict Cooling St. Paul, Inc.St. Paul, Minnesota USA
15
Brought to you by Global Reports
C B & I 2 0 0 2 A N N U A L R E P O R T
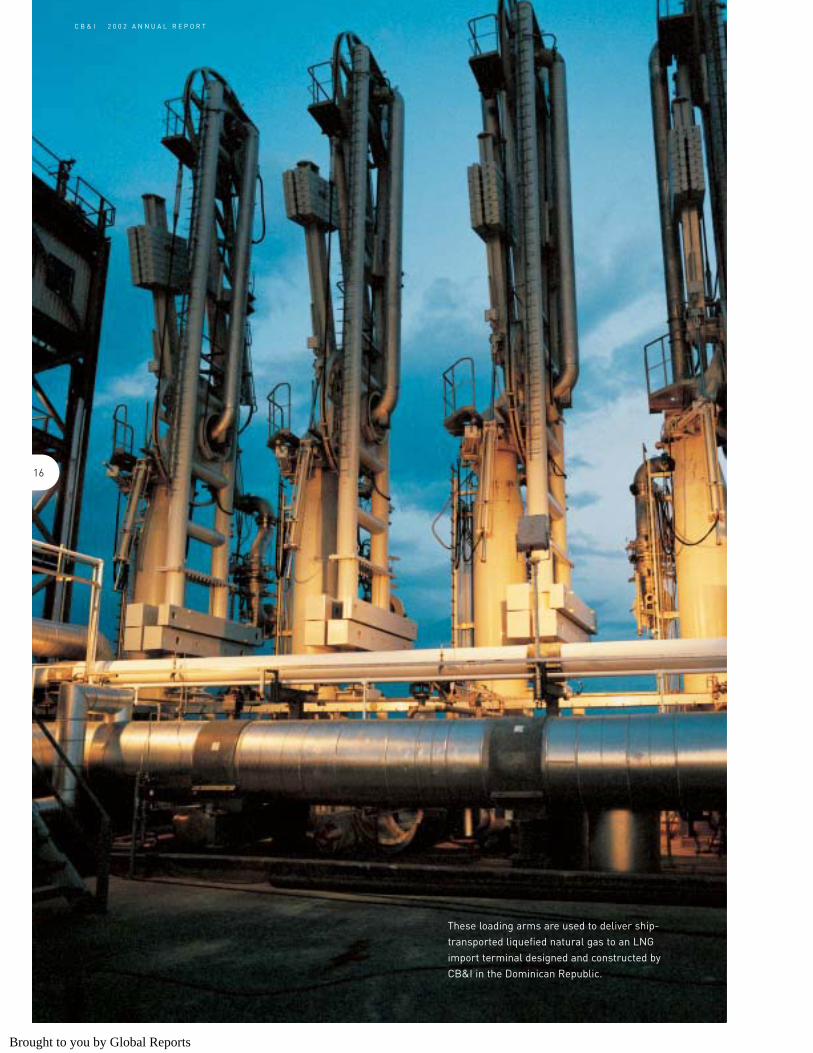
These loading arms are used to deliver ship-transported liquefied natural gas to an LNGimport terminal designed and constructed byCB&I in the Dominican Republic.
16
Brought to you by Global Reports
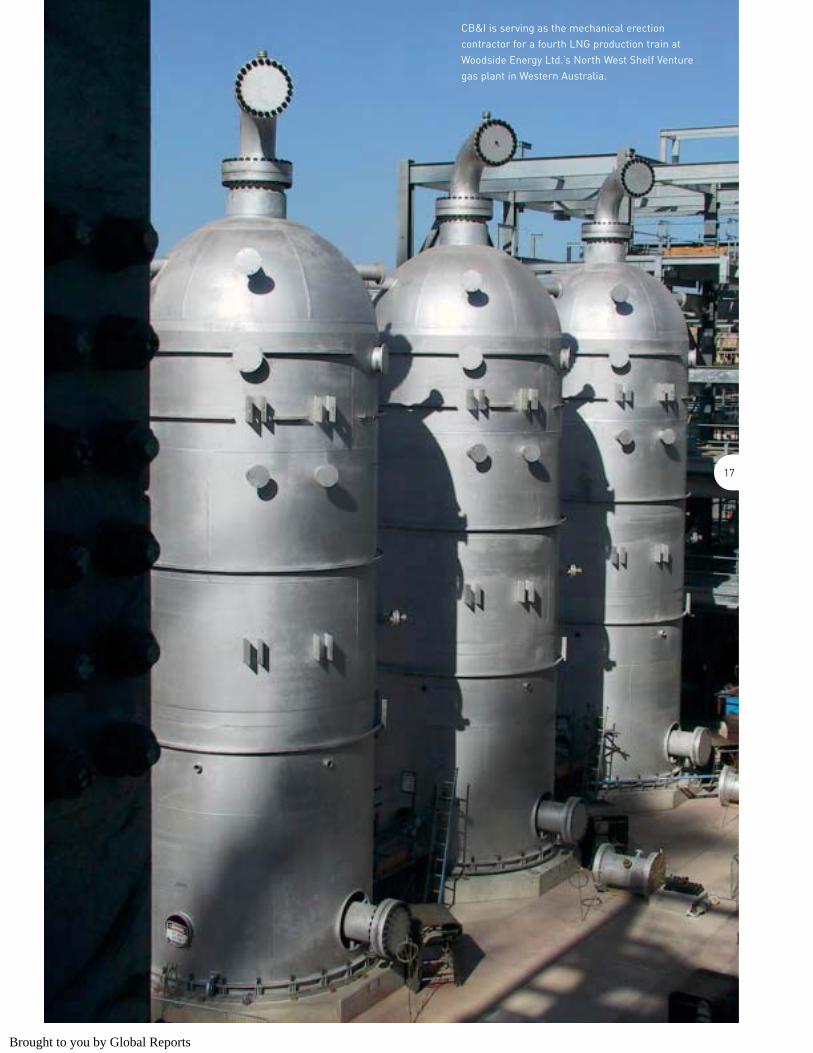
CB&I is serving as the mechanical erection contractor for a fourth LNG production train atWoodside Energy Ltd.’s North West Shelf Venturegas plant in Western Australia.
17
Brought to you by Global Reports
C B & I 2 0 0 2 A N N U A L R E P O R T
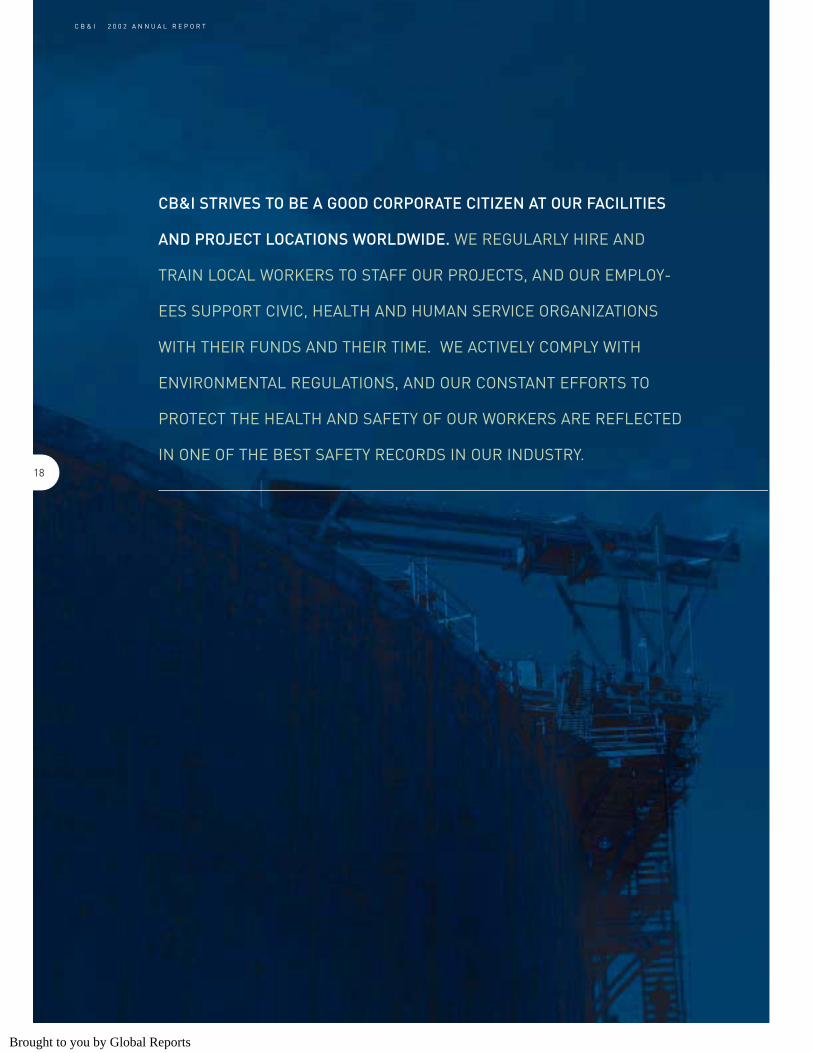
CB&I STRIVES TO BE A GOOD CORPORATE CITIZEN AT OUR FACILITIES
AND PROJECT LOCATIONS WORLDWIDE. WE REGULARLY HIRE AND
TRAIN LOCAL WORKERS TO STAFF OUR PROJECTS, AND OUR EMPLOY-
EES SUPPORT CIVIC, HEALTH AND HUMAN SERVICE ORGANIZATIONS
WITH THEIR FUNDS AND THEIR TIME. WE ACTIVELY COMPLY WITH
ENVIRONMENTAL REGULATIONS, AND OUR CONSTANT EFFORTS TO
PROTECT THE HEALTH AND SAFETY OF OUR WORKERS ARE REFLECTED
IN ONE OF THE BEST SAFETY RECORDS IN OUR INDUSTRY.18
Brought to you by Global Reports
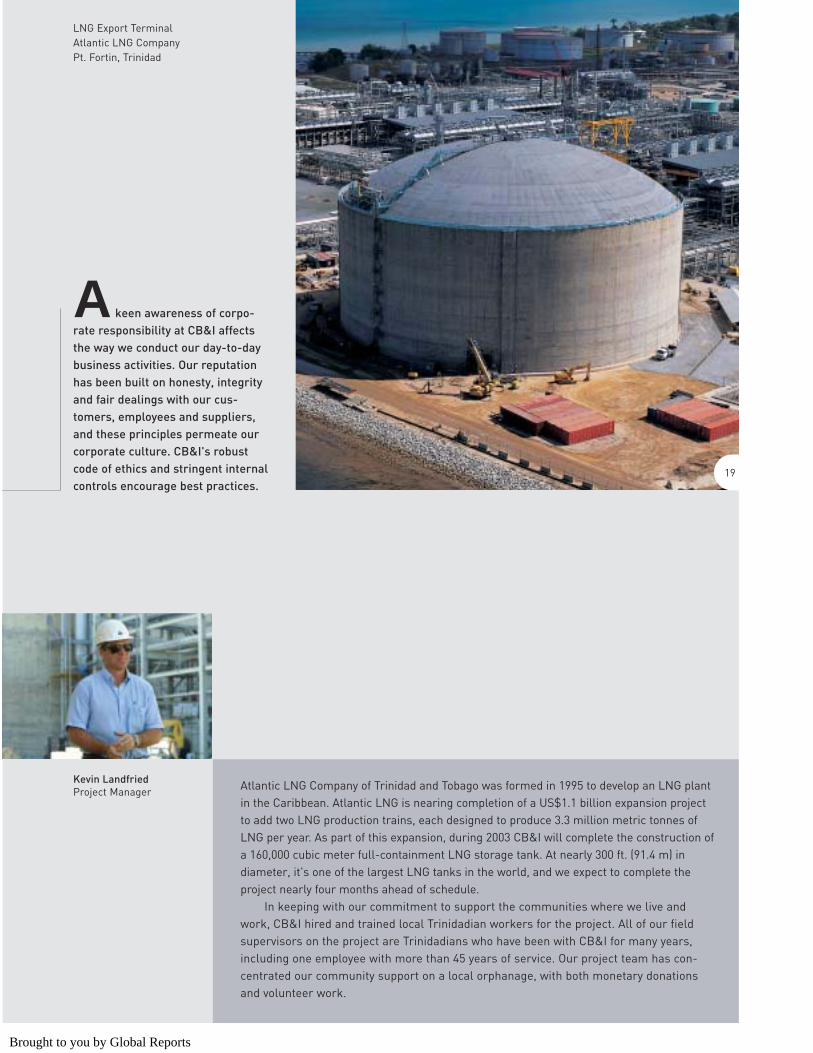
A keen awareness of corpo-rate responsibility at CB&I affectsthe way we conduct our day-to-daybusiness activities. Our reputationhas been built on honesty, integrityand fair dealings with our cus-tomers, employees and suppliers,and these principles permeate ourcorporate culture. CB&I's robustcode of ethics and stringent internalcontrols encourage best practices.
Atlantic LNG Company of Trinidad and Tobago was formed in 1995 to develop an LNG plantin the Caribbean. Atlantic LNG is nearing completion of a US$1.1 billion expansion projectto add two LNG production trains, each designed to produce 3.3 million metric tonnes ofLNG per year. As part of this expansion, during 2003 CB&I will complete the construction ofa 160,000 cubic meter full-containment LNG storage tank. At nearly 300 ft. (91.4 m) indiameter, it's one of the largest LNG tanks in the world, and we expect to complete theproject nearly four months ahead of schedule.
In keeping with our commitment to support the communities where we live andwork, CB&I hired and trained local Trinidadian workers for the project. All of our fieldsupervisors on the project are Trinidadians who have been with CB&I for many years,including one employee with more than 45 years of service. Our project team has con-centrated our community support on a local orphanage, with both monetary donationsand volunteer work.
Kevin LandfriedProject Manager
LNG Export TerminalAtlantic LNG CompanyPt. Fortin, Trinidad
19
Brought to you by Global Reports

CB&I IS ONE OF THE MOST GLOBAL COMPANIES IN THE EPC BUSINESS.
WITH A NETWORK OF MORE THAN 35 SALES AND OPERATIONS OFFICES
AROUND THE WORLD AND ESTABLISHED LABOR AND SUPPLIER RELA-
TIONSHIPS, WE RAPIDLY MOBILIZE PEOPLE, MATERIALS AND EQUIP-
MENT TO EXECUTE PROJECTS IN LOCATIONS RANGING FROM HIGHLY
INDUSTRIALIZED COUNTRIES TO SOME OF THE WORLD'S MOST REMOTE
AND CHALLENGING REGIONS.
C B & I 2 0 0 2 A N N U A L R E P O R T
20
Brought to you by Global Reports
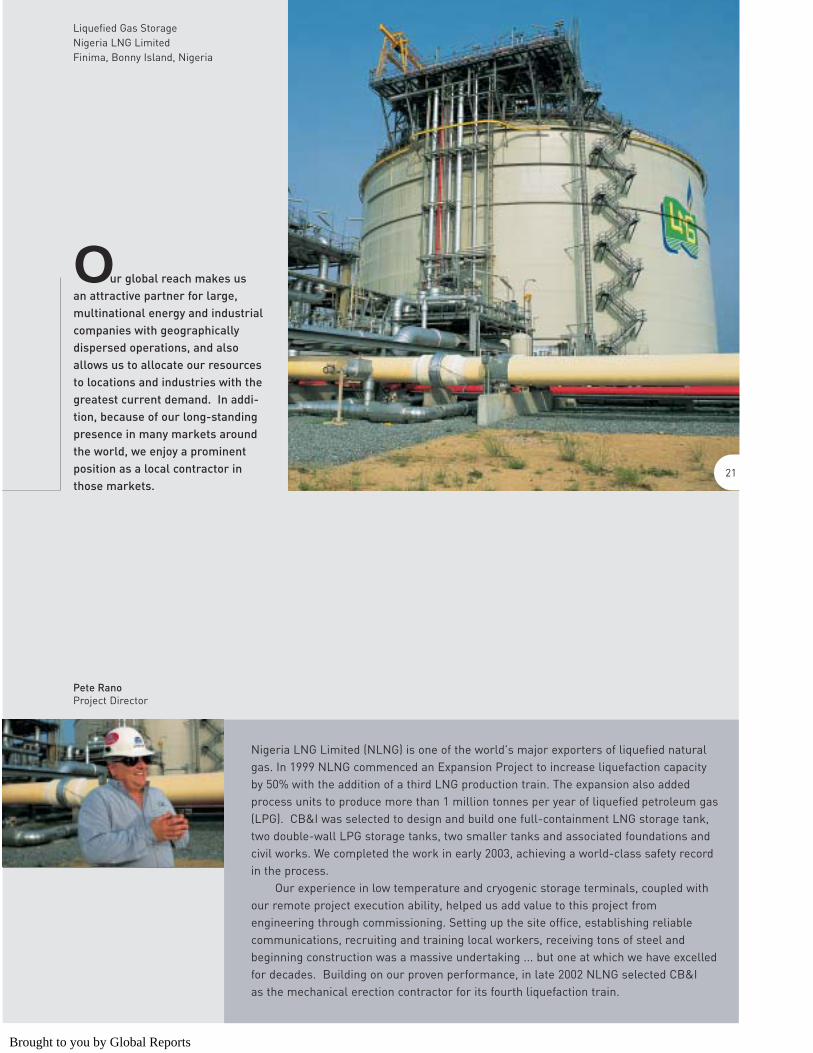
Our global reach makes us an attractive partner for large,multinational energy and industrialcompanies with geographically dispersed operations, and alsoallows us to allocate our resourcesto locations and industries with thegreatest current demand. In addi-tion, because of our long-standingpresence in many markets aroundthe world, we enjoy a prominentposition as a local contractor inthose markets.
Pete RanoProject Director
21
Liquefied Gas StorageNigeria LNG LimitedFinima, Bonny Island, Nigeria
Nigeria LNG Limited (NLNG) is one of the world's major exporters of liquefied naturalgas. In 1999 NLNG commenced an Expansion Project to increase liquefaction capacityby 50% with the addition of a third LNG production train. The expansion also addedprocess units to produce more than 1 million tonnes per year of liquefied petroleum gas(LPG). CB&I was selected to design and build one full-containment LNG storage tank,two double-wall LPG storage tanks, two smaller tanks and associated foundations andcivil works. We completed the work in early 2003, achieving a world-class safety recordin the process.
Our experience in low temperature and cryogenic storage terminals, coupled withour remote project execution ability, helped us add value to this project from engineering through commissioning. Setting up the site office, establishing reliablecommunications, recruiting and training local workers, receiving tons of steel andbeginning construction was a massive undertaking ... but one at which we have excelledfor decades. Building on our proven performance, in late 2002 NLNG selected CB&I as the mechanical erection contractor for its fourth liquefaction train.
Brought to you by Global Reports
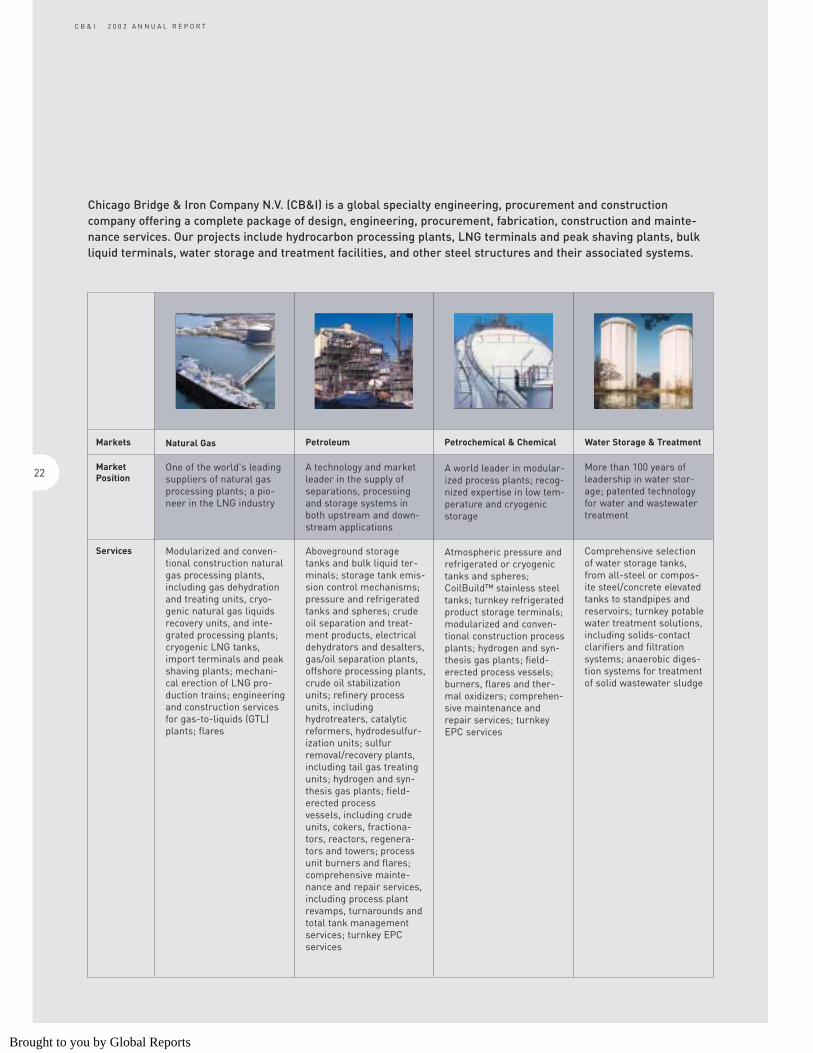
Water Storage & TreatmentPetroleumNatural GasMarkets
Market Position
Services
Petrochemical & Chemical
Chicago Bridge & Iron Company N.V. (CB&I) is a global specialty engineering, procurement and construction company offering a complete package of design, engineering, procurement, fabrication, construction and mainte-nance services. Our projects include hydrocarbon processing plants, LNG terminals and peak shaving plants, bulkliquid terminals, water storage and treatment facilities, and other steel structures and their associated systems.
C B & I 2 0 0 2 A N N U A L R E P O R T
One of the world's leadingsuppliers of natural gasprocessing plants; a pio-neer in the LNG industry
Modularized and conven-tional construction naturalgas processing plants,including gas dehydrationand treating units, cryo-genic natural gas liquidsrecovery units, and inte-grated processing plants;cryogenic LNG tanks,import terminals and peakshaving plants; mechani-cal erection of LNG pro-duction trains; engineeringand construction servicesfor gas-to-liquids (GTL)plants; flares
A technology and marketleader in the supply ofseparations, processingand storage systems inboth upstream and down-stream applications
Aboveground storagetanks and bulk liquid ter-minals; storage tank emis-sion control mechanisms;pressure and refrigeratedtanks and spheres; crudeoil separation and treat-ment products, electricaldehydrators and desalters,gas/oil separation plants,offshore processing plants,crude oil stabilizationunits; refinery processunits, includinghydrotreaters, catalyticreformers, hydrodesulfur-ization units; sulfurremoval/recovery plants,including tail gas treatingunits; hydrogen and syn-thesis gas plants; field-erected process vessels, including crudeunits, cokers, fractiona-tors, reactors, regenera-tors and towers; processunit burners and flares; comprehensive mainte-nance and repair services,including process plantrevamps, turnarounds andtotal tank managementservices; turnkey EPC services
A world leader in modular-ized process plants; recog-nized expertise in low tem-perature and cryogenicstorage
Atmospheric pressure andrefrigerated or cryogenictanks and spheres;CoilBuild™ stainless steeltanks; turnkey refrigeratedproduct storage terminals;modularized and conven-tional construction processplants; hydrogen and syn-thesis gas plants; field-erected process vessels;burners, flares and ther-mal oxidizers; comprehen-sive maintenance andrepair services; turnkeyEPC services
More than 100 years ofleadership in water stor-age; patented technologyfor water and wastewatertreatment
Comprehensive selectionof water storage tanks,from all-steel or compos-ite steel/concrete elevatedtanks to standpipes andreservoirs; turnkey potablewater treatment solutions,including solids-contactclarifiers and filtrationsystems; anaerobic diges-tion systems for treatmentof solid wastewater sludge
22
Brought to you by Global Reports
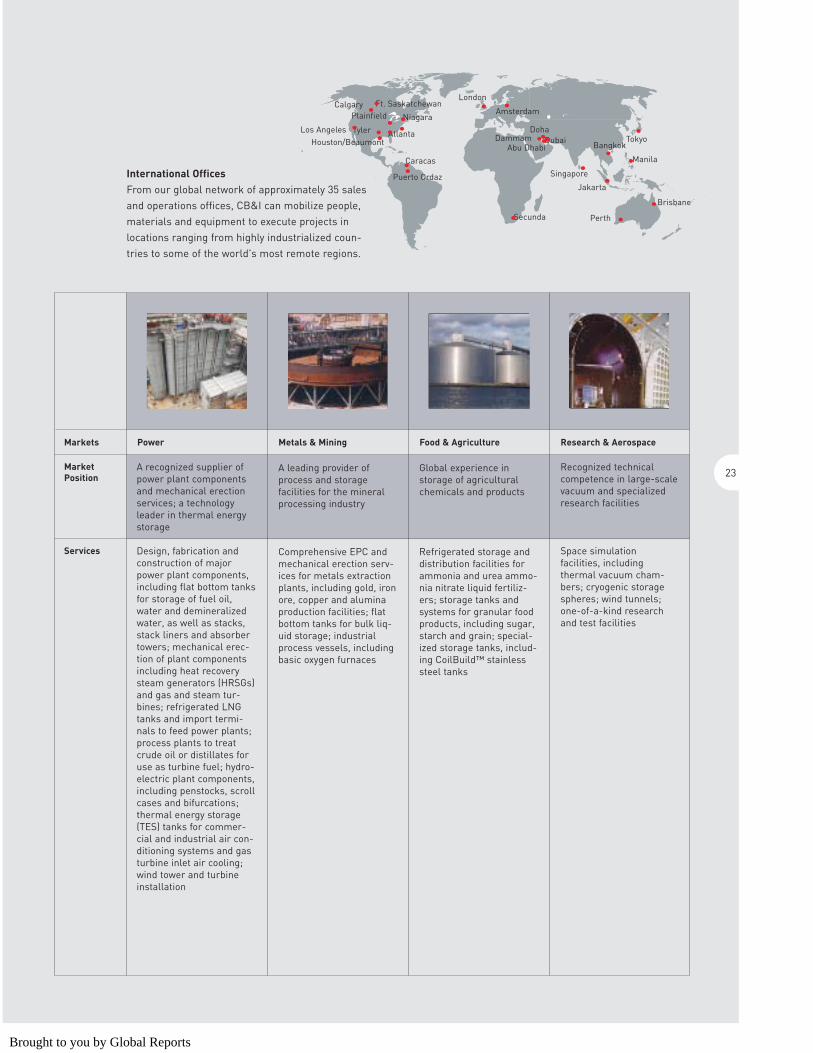
Metals & Mining Food & Agriculture Research & AerospaceMarkets
Market Position
Services
Power
Los AngelesHouston/Beaumont
Puerto Ordaz
Caracas
Atlanta
Niagara
Ft. Saskatchewan London
Secunda
Tyler
PlainfieldCalgary
Abu Dhabi
Perth
Singapore
Tokyo
Manila
Jakarta
Brisbane
Amsterdam
DammamDoha
DubaiBangkok
International OfficesFrom our global network of approximately 35 salesand operations offices, CB&I can mobilize people,materials and equipment to execute projects inlocations ranging from highly industrialized coun-tries to some of the world's most remote regions.
A recognized supplier ofpower plant componentsand mechanical erectionservices; a technologyleader in thermal energystorage
Design, fabrication andconstruction of majorpower plant components,including flat bottom tanksfor storage of fuel oil,water and demineralizedwater, as well as stacks,stack liners and absorbertowers; mechanical erec-tion of plant componentsincluding heat recoverysteam generators (HRSGs)and gas and steam tur-bines; refrigerated LNGtanks and import termi-nals to feed power plants;process plants to treatcrude oil or distillates foruse as turbine fuel; hydro-electric plant components,including penstocks, scrollcases and bifurcations;thermal energy storage(TES) tanks for commer-cial and industrial air con-ditioning systems and gasturbine inlet air cooling;wind tower and turbineinstallation
A leading provider ofprocess and storage facilities for the mineralprocessing industry
Comprehensive EPC andmechanical erection serv-ices for metals extractionplants, including gold, ironore, copper and aluminaproduction facilities; flatbottom tanks for bulk liq-uid storage; industrialprocess vessels, includingbasic oxygen furnaces
Global experience in storage of agriculturalchemicals and products
Refrigerated storage anddistribution facilities forammonia and urea ammo-nia nitrate liquid fertiliz-ers; storage tanks andsystems for granular foodproducts, including sugar,starch and grain; special-ized storage tanks, includ-ing CoilBuild™ stainlesssteel tanks
Recognized technical competence in large-scalevacuum and specializedresearch facilities
Space simulation facilities, including thermal vacuum cham-bers; cryogenic storagespheres; wind tunnels;one-of-a-kind researchand test facilities
.....
..
. .
..
.. ..
.. ........
23
Brought to you by Global Reports
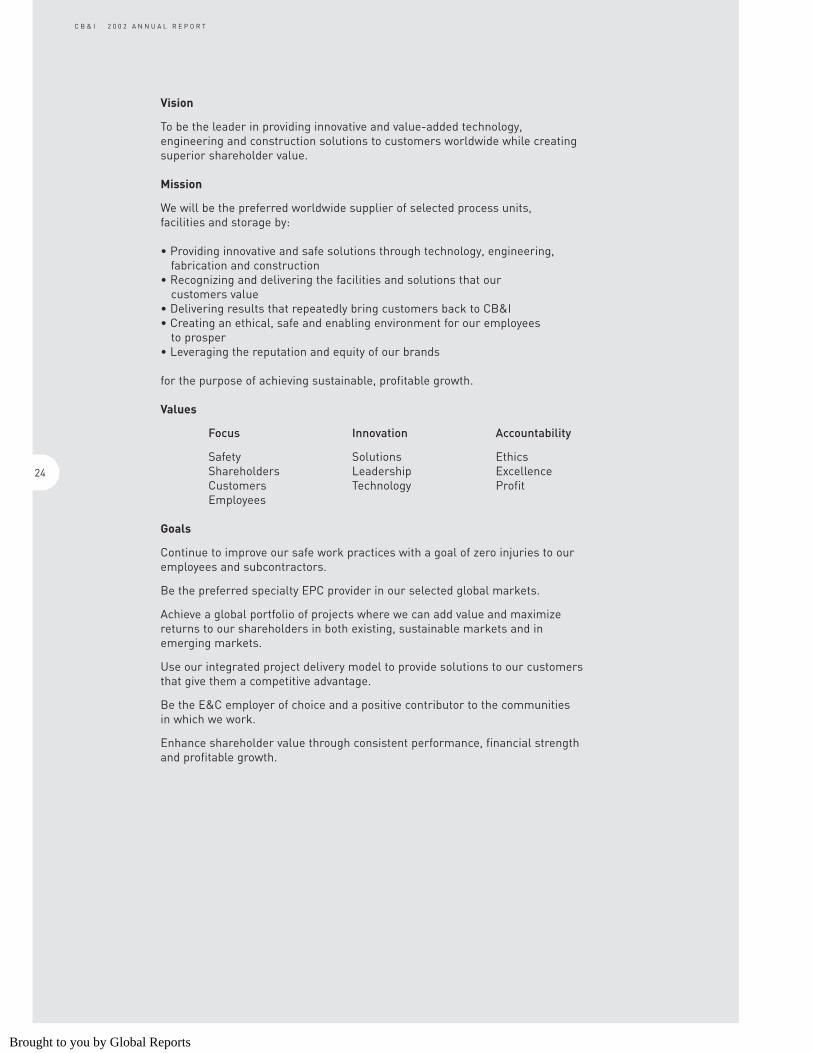
Vision
To be the leader in providing innovative and value-added technology, engineering and construction solutions to customers worldwide while creatingsuperior shareholder value.
Mission
We will be the preferred worldwide supplier of selected process units, facilities and storage by:
• Providing innovative and safe solutions through technology, engineering, fabrication and construction
• Recognizing and delivering the facilities and solutions that our customers value
• Delivering results that repeatedly bring customers back to CB&I• Creating an ethical, safe and enabling environment for our employees
to prosper• Leveraging the reputation and equity of our brands
for the purpose of achieving sustainable, profitable growth.
Values
Focus Innovation Accountability
Safety Solutions EthicsShareholders Leadership ExcellenceCustomers Technology ProfitEmployees
Goals
Continue to improve our safe work practices with a goal of zero injuries to ouremployees and subcontractors.
Be the preferred specialty EPC provider in our selected global markets.
Achieve a global portfolio of projects where we can add value and maximizereturns to our shareholders in both existing, sustainable markets and in emerging markets.
Use our integrated project delivery model to provide solutions to our customersthat give them a competitive advantage.
Be the E&C employer of choice and a positive contributor to the communities in which we work.
Enhance shareholder value through consistent performance, financial strengthand profitable growth.
C B & I 2 0 0 2 A N N U A L R E P O R T
24
Brought to you by Global Reports
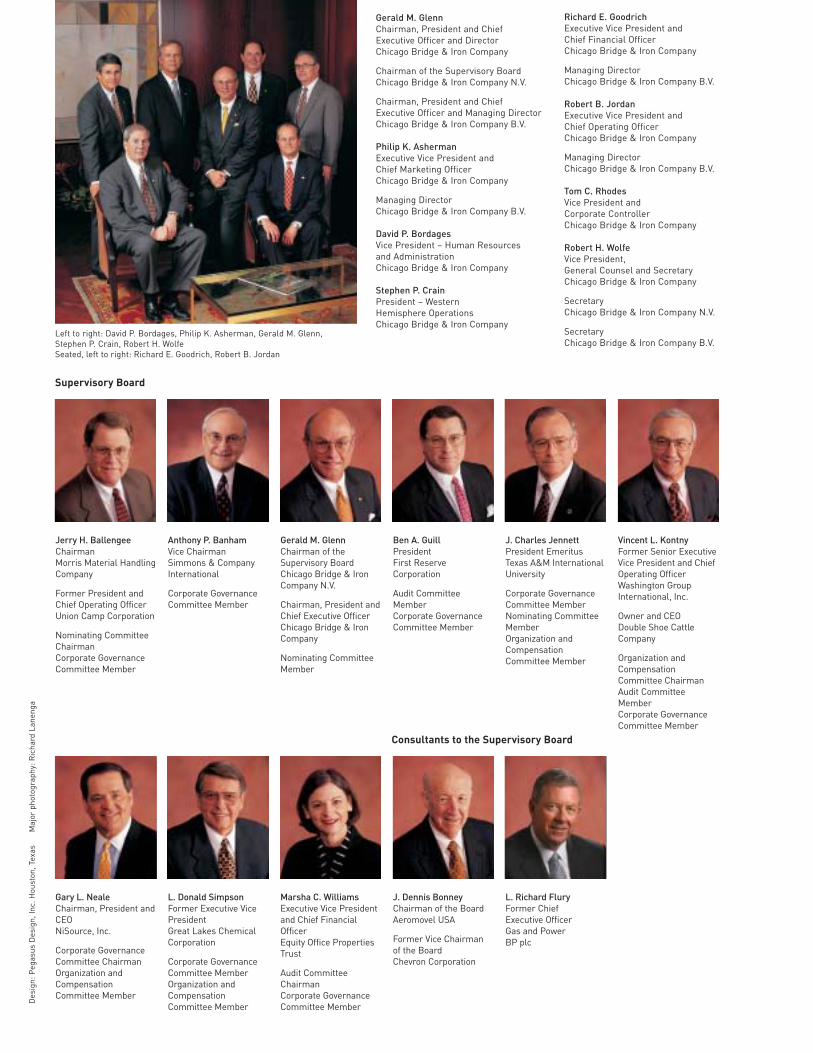
Consultants to the Supervisory Board
Gerald M. GlennChairman, President and Chief Executive Officer and DirectorChicago Bridge & Iron Company
Chairman of the Supervisory BoardChicago Bridge & Iron Company N.V.
Chairman, President and Chief Executive Officer and Managing DirectorChicago Bridge & Iron Company B.V.
Philip K. AshermanExecutive Vice President and Chief Marketing OfficerChicago Bridge & Iron Company
Managing DirectorChicago Bridge & Iron Company B.V.
David P. BordagesVice President – Human Resources and AdministrationChicago Bridge & Iron Company
Stephen P. CrainPresident – Western Hemisphere OperationsChicago Bridge & Iron Company
Richard E. GoodrichExecutive Vice President and Chief Financial OfficerChicago Bridge & Iron Company
Managing DirectorChicago Bridge & Iron Company B.V.
Robert B. JordanExecutive Vice President and Chief Operating OfficerChicago Bridge & Iron Company
Managing DirectorChicago Bridge & Iron Company B.V.
Tom C. RhodesVice President and Corporate ControllerChicago Bridge & Iron Company
Robert H. WolfeVice President, General Counsel and SecretaryChicago Bridge & Iron Company
SecretaryChicago Bridge & Iron Company N.V.
SecretaryChicago Bridge & Iron Company B.V.
Supervisory Board
Left to right: David P. Bordages, Philip K. Asherman, Gerald M. Glenn, Stephen P. Crain, Robert H. Wolfe Seated, left to right: Richard E. Goodrich, Robert B. Jordan
Jerry H. BallengeeChairmanMorris Material HandlingCompany
Former President and Chief Operating OfficerUnion Camp Corporation
Nominating CommitteeChairmanCorporate GovernanceCommittee Member
Anthony P. BanhamVice ChairmanSimmons & CompanyInternational
Corporate GovernanceCommittee Member
Gerald M. GlennChairman of theSupervisory BoardChicago Bridge & IronCompany N.V.
Chairman, President andChief Executive OfficerChicago Bridge & IronCompany
Nominating CommitteeMember
Ben A. GuillPresidentFirst ReserveCorporation
Audit CommitteeMemberCorporate GovernanceCommittee Member
J. Charles JennettPresident EmeritusTexas A&M InternationalUniversity
Corporate GovernanceCommittee MemberNominating CommitteeMemberOrganization andCompensationCommittee Member
Vincent L. KontnyFormer Senior ExecutiveVice President and ChiefOperating OfficerWashington GroupInternational, Inc.
Owner and CEODouble Shoe CattleCompany
Organization andCompensationCommittee ChairmanAudit CommitteeMemberCorporate GovernanceCommittee Member
Gary L. NealeChairman, President andCEONiSource, Inc.
Corporate GovernanceCommittee ChairmanOrganization andCompensation Committee Member
L. Donald SimpsonFormer Executive VicePresidentGreat Lakes ChemicalCorporation
Corporate GovernanceCommittee MemberOrganization andCompensation Committee Member
Marsha C. WilliamsExecutive Vice Presidentand Chief FinancialOfficerEquity Office PropertiesTrust
Audit CommitteeChairmanCorporate GovernanceCommittee Member
J. Dennis BonneyChairman of the BoardAeromovel USA
Former Vice Chairman of the BoardChevron Corporation
L. Richard FluryFormer Chief Executive OfficerGas and PowerBP plc
Des
ign:
Peg
asus
Des
ign,
Inc.
Hou
ston
, Tex
as
M
ajor
pho
togr
aphy
: Ric
hard
Lan
enga

Chicago Bridge & Iron Company N.V.
Polarisavenue 312132 JH HoofddorpThe Netherlandswww.chicagobridge.com
Brought to you by Global Reports
25
Contents: Selected Financial Data 26. Management’s Discussion and Analysis 28.
Report of Independent Public Accountants 35. Consolidated Financial Statements 37.
Notes to Consolidated Financial Statements 41. Facility Listing 61. Corporate and Investor Information 62.
Operating Executives 62. Executive Officers 63. Supervisory Board 63.
Brought to you by Global Reports
26
C B & I 2 0 0 2 A N N U A L R E P O R T
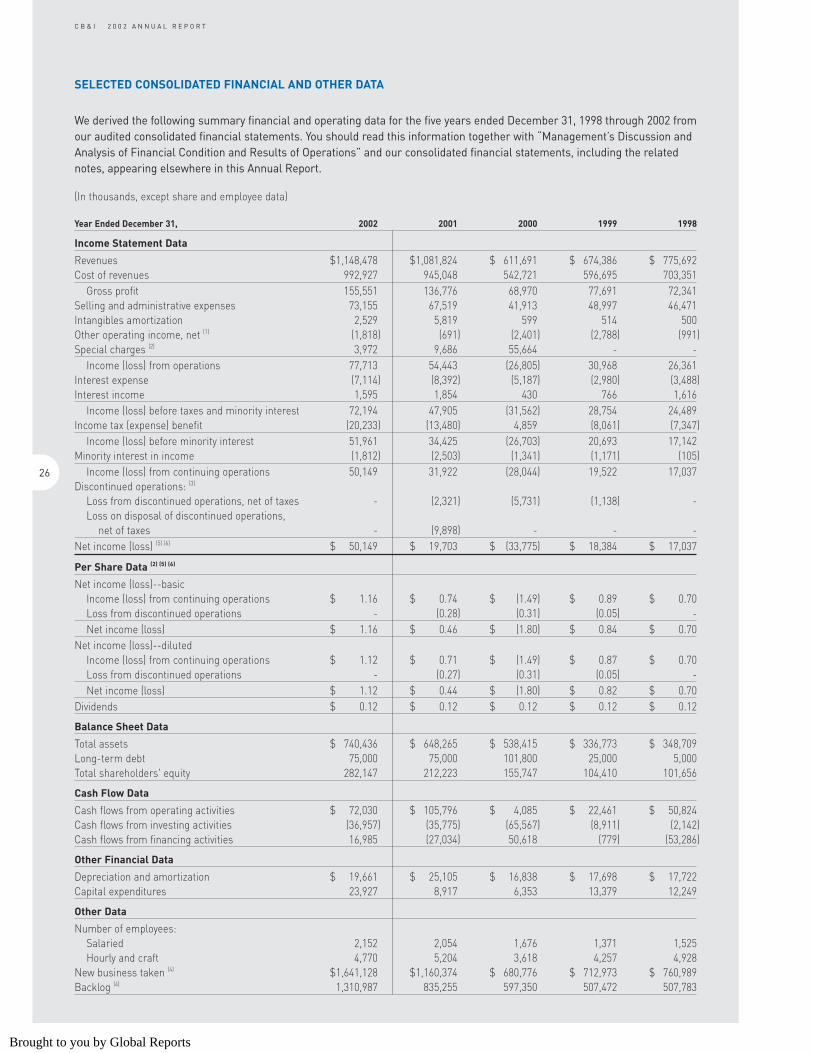
SELECTED CONSOLIDATED FINANCIAL AND OTHER DATA
We derived the following summary financial and operating data for the five years ended December 31, 1998 through 2002 fromour audited consolidated financial statements. You should read this information together with “Management’s Discussion andAnalysis of Financial Condition and Results of Operations” and our consolidated financial statements, including the relatednotes, appearing elsewhere in this Annual Report.
(In thousands, except share and employee data)
Year Ended December 31, 2002 2001 2000 1999 1998
Income Statement Data
Revenues $1,148,478 $1,081,824 $ 611,691 $ 674,386 $ 775,692 Cost of revenues 992,927 945,048 542,721 596,695 703,351
Gross profit 155,551 136,776 68,970 77,691 72,341 Selling and administrative expenses 73,155 67,519 41,913 48,997 46,471 Intangibles amortization 2,529 5,819 599 514 500 Other operating income, net (1) (1,818) (691) (2,401) (2,788) (991)Special charges (2) 3,972 9,686 55,664 - -
Income (loss) from operations 77,713 54,443 (26,805) 30,968 26,361 Interest expense (7,114) (8,392) (5,187) (2,980) (3,488)Interest income 1,595 1,854 430 766 1,616
Income (loss) before taxes and minority interest 72,194 47,905 (31,562) 28,754 24,489 Income tax (expense) benefit (20,233) (13,480) 4,859 (8,061) (7,347)
Income (loss) before minority interest 51,961 34,425 (26,703) 20,693 17,142 Minority interest in income (1,812) (2,503) (1,341) (1,171) (105)
Income (loss) from continuing operations 50,149 31,922 (28,044) 19,522 17,037 Discontinued operations: (3)
Loss from discontinued operations, net of taxes - (2,321) (5,731) (1,138) - Loss on disposal of discontinued operations,
net of taxes - (9,898) - - - Net income (loss) (5) (6) $ 50,149 $ 19,703 $ (33,775) $ 18,384 $ 17,037
Per Share Data (2) (5) (6)
Net income (loss)--basicIncome (loss) from continuing operations $ 1.16 $ 0.74 $ (1.49) $ 0.89 $ 0.70 Loss from discontinued operations - (0.28) (0.31) (0.05) - Net income (loss) $ 1.16 $ 0.46 $ (1.80) $ 0.84 $ 0.70
Net income (loss)--dilutedIncome (loss) from continuing operations $ 1.12 $ 0.71 $ (1.49) $ 0.87 $ 0.70 Loss from discontinued operations - (0.27) (0.31) (0.05) - Net income (loss) $ 1.12 $ 0.44 $ (1.80) $ 0.82 $ 0.70
Dividends $ 0.12 $ 0.12 $ 0.12 $ 0.12 $ 0.12
Balance Sheet Data
Total assets $ 740,436 $ 648,265 $ 538,415 $ 336,773 $ 348,709 Long-term debt 75,000 75,000 101,800 25,000 5,000 Total shareholders' equity 282,147 212,223 155,747 104,410 101,656
Cash Flow Data
Cash flows from operating activities $ 72,030 $ 105,796 $ 4,085 $ 22,461 $ 50,824 Cash flows from investing activities (36,957) (35,775) (65,567) (8,911) (2,142)Cash flows from financing activities 16,985 (27,034) 50,618 (779) (53,286)
Other Financial Data
Depreciation and amortization $ 19,661 $ 25,105 $ 16,838 $ 17,698 $ 17,722 Capital expenditures 23,927 8,917 6,353 13,379 12,249
Other Data
Number of employees:Salaried 2,152 2,054 1,676 1,371 1,525 Hourly and craft 4,770 5,204 3,618 4,257 4,928
New business taken (4) $1,641,128 $1,160,374 $ 680,776 $ 712,973 $ 760,989 Backlog (4) 1,310,987 835,255 597,350 507,472 507,783
Brought to you by Global Reports
Footnotes for Previous Table
(1) Other operating income, net generally represents gains on the sale of property, plant and equipment.
(2) In 2002, we recognized special charges of $4.0 million. Included in the 2002 special charges were $3.4 million for personnelcosts including severance and personal moving expenses associated with the relocation of our administrative offices, $0.5million for integration costs related to integration initiatives associated with the Pitt-Des Moines, Inc. (“PDM”) Divisionsacquisition and $0.4 million for facilities costs relating to the closure and relocation of facilities. During 2002 we alsorecorded income of $0.4 million in relation to adjustments associated with the sale of our XL Technology Systems, Inc. sub-sidiary. In 2001, we recognized special charges of $9.7 million. Included in the 2001 special charges were $5.7 million forpersonnel costs including severance and personal moving expenses associated with the relocation, closure or downsizing ofoffices, and our voluntary resignation offer; $2.8 million for facilities and other charges related to the sale, closure, downsiz-ing or relocation of operations; and $1.2 million for integration costs primarily related to integration initiatives associated withthe PDM Divisions acquisition. In 2000, we recognized special charges of $55.7 million. Included in the 2000 special chargeswere $22.2 million for payments associated with our voluntary resignation offer, severance and other benefits-related costs;$5.3 million in facilities-related expenses and a $28.2 million non-cash valuation allowance against a net long-term receiv-able for the Indonesian Tuban (T.P.P.I.) Project. See Note 4 to our Consolidated Financial Statements for additional details onspecial charges.
(3) During the second quarter of 2001, we decided to discontinue our high purity piping business, UltraPure Systems, due prima-rily to continuing weak market conditions in the microelectronics industry. The loss on disposal of discontinued operations of$9.9 million after tax includes the write-down of equipment (net of proceeds), lease terminations, severance and other costs,and losses during the phase-out period. As a result of this operation being classified as discontinued, prior periods have beenpreviously restated. Our actions necessary to discontinue UltraPure Systems were essentially complete at December 31, 2001.
(4) New business taken represents the value of new project commitments received by us during a given period. Such commit-ments are included in backlog until work is performed and revenue recognized or until cancellation. Backlog may alsofluctuate with currency movements.
(5) On January 22, 2003, we declared a two-for-one stock split effective in the form of a stock dividend payable February 10, 2003to stockholders of record at the close of business on February 3, 2003. All share numbers and amounts have been adjustedfor the stock split for all periods presented.
(6) We changed our method of accounting for goodwill upon adoption of SFAS No. 142 on January 1, 2002. See Note 7 to ourConsolidated Financial Statements.
27
Brought to you by Global Reports
MANAGEMENT’S DISCUSSION AND ANALYSIS OF FINANCIAL CONDITION AND RESULTS OF OPERATIONS
The following “Management’s Discussion and Analysis of Financial Condition and Results of Operations” is provided to assistreaders in understanding our financial performance during the periods presented and significant trends which may impactour future performance. This discussion should be read in conjunction with our Consolidated Financial Statements and therelated notes thereto included elsewhere in this Annual Report.
We are a global specialty engineering, procurement and construction company serving customers in several primary end markets, including hydrocarbon refining, natural gas, water and the energy sector in general. We have been helping customers store and process the earth’s natural resources for more than 100 years by supplying a comprehensive range ofengineered steel structures and systems. We offer a complete package of design, engineering, fabrication, procurement, construction and maintenance services. Our projects include hydrocarbon processing plants, liquefied natural gas (LNG) ter-minals and peak shaving plants, bulk liquid terminals, water storage and treatment facilities, and other steel structures andtheir associated systems. We have been continuously engaged in the engineering and construction industry since our found-ing in 1889. Our subsidiary Howe-Baker International, L.L.C., (“Howe-Baker”) organized in 1947 and acquired by us in 2000, isa global technology company specializing in the engineering and construction of hydrocarbon processing plants for customersin the hydrocarbon refining, petrochemical and natural gas industries.
On January 22, 2003, we declared a two-for-one stock split effective in the form of a stock dividend payable February 10,2003 to stockholders of record at the close of business on February 3, 2003. All share numbers and amounts have beenadjusted for the stock split for all periods presented.
Results of Operations
Our new business taken, revenues and income from operations in the following geographic segments are as follows:
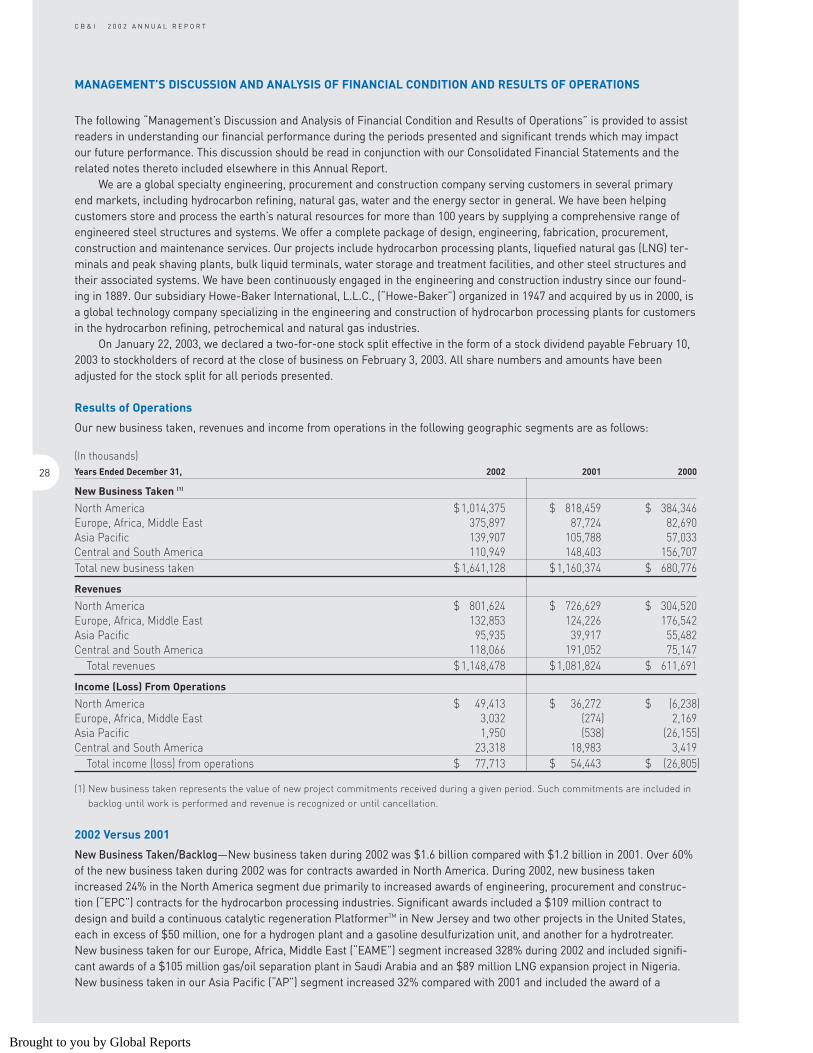
(In thousands)Years Ended December 31, 2002 2001 2000
New Business Taken (1)
North America $1,014,375 $ 818,459 $ 384,346 Europe, Africa, Middle East 375,897 87,724 82,690 Asia Pacific 139,907 105,788 57,033 Central and South America 110,949 148,403 156,707 Total new business taken $1,641,128 $1,160,374 $ 680,776
Revenues
North America $ 801,624 $ 726,629 $ 304,520 Europe, Africa, Middle East 132,853 124,226 176,542 Asia Pacific 95,935 39,917 55,482 Central and South America 118,066 191,052 75,147
Total revenues $1,148,478 $1,081,824 $ 611,691
Income (Loss) From Operations
North America $ 49,413 $ 36,272 $ (6,238)Europe, Africa, Middle East 3,032 (274) 2,169 Asia Pacific 1,950 (538) (26,155)Central and South America 23,318 18,983 3,419
Total income (loss) from operations $ 77,713 $ 54,443 $ (26,805)
(1) New business taken represents the value of new project commitments received during a given period. Such commitments are included inbacklog until work is performed and revenue is recognized or until cancellation.
2002 Versus 2001
New Business Taken/Backlog—New business taken during 2002 was $1.6 billion compared with $1.2 billion in 2001. Over 60%of the new business taken during 2002 was for contracts awarded in North America. During 2002, new business takenincreased 24% in the North America segment due primarily to increased awards of engineering, procurement and construc-tion (“EPC”) contracts for the hydrocarbon processing industries. Significant awards included a $109 million contract todesign and build a continuous catalytic regeneration PlatformerTM in New Jersey and two other projects in the United States,each in excess of $50 million, one for a hydrogen plant and a gasoline desulfurization unit, and another for a hydrotreater.New business taken for our Europe, Africa, Middle East (“EAME”) segment increased 328% during 2002 and included signifi-cant awards of a $105 million gas/oil separation plant in Saudi Arabia and an $89 million LNG expansion project in Nigeria.New business taken in our Asia Pacific (“AP”) segment increased 32% compared with 2001 and included the award of a
28
C B & I 2 0 0 2 A N N U A L R E P O R T
Brought to you by Global Reports
hydrotreater project in Australia and a refrigerated petrochemical storage facility in China. New business taken in the Centraland South America (“CSA”) segment decreased 25% during 2002 as a result of negative political and economic conditions incertain Latin American markets, principally Venezuela. The majority of 2002 new awards were for projects in the Caribbeanregion. We anticipate new business in 2003 to range between $1.6 and $1.7 billion due to an emerging upturn in the energymarket, continued synergistic benefits from recent acquisitions and increased demand for lump-sum, turnkey contracting.
Backlog increased $475.7 million or 57%, to $1.3 billion at December 31, 2002.
Revenues—Revenues in 2002 of $1.1 billion rose 6% compared with 2001. Our revenues fluctuate based on the changing proj-ect mix and are dependent on the amount and timing of new awards, and on other matters such as project schedules. During2002, revenues increased 10% in North America, 7% in the EAME segment, 140% in the AP segment, but declined 38% in theCSA segment. The increase in North America compared with 2001 was due primarily to higher levels of EPC projects for thehydrocarbon processing industries. These process–related revenues rose 52%, as backlog carried over from 2001 was put inplace and strong new business continued in 2002. Revenue growth in the AP segment resulted from large projects beginningin Australia, while CSA’s decrease resulted from several large projects in Venezuela and the Caribbean nearing completion.We anticipate that total revenues for 2003 will be between $1.3 and $1.5 billion. Based on the current backlog, we expect themajority of the 2003 revenue growth to come in the North America and EAME segments.
Gross Profit—Gross profit in 2002 was $155.6 million, or 13.5% of revenues, compared with $136.8 million or 12.6% of rev-enues in 2001, reflecting continued strong project execution, the growing mix of higher margin process-related EPC work andstringent cost control.
Selling and Administrative Expenses—Selling and administrative expenses were $73.2 million, or 6.4% of revenues in 2002compared with $67.5 million, or 6.2% of revenues in 2001. The increase compared with 2001 relates primarily to the impact ofacquired operations and higher insurance costs.
Special Charges—Special charges for 2002 were $4.0 million as compared to $9.7 million in 2001. During 2002 we recordedspecial charges of $3.4 million related to the relocation of our Plainfield, Illinois office personnel to The Woodlands, Texas. Asmany of our multinational customers in the hydrocarbon industry maintain their U.S. headquarters or a significant presencein the Houston area, we believe the move will enhance our ability to maintain and expand existing customer relationships andbuild new ones. Additionally, we also recorded $0.4 million relating to the closure and relocation of facilities and $0.5 millionfor integration activities associated with the acquisition of the Engineered Construction and Water Divisions (“PDM Divisions”)of Pitt-Des Moines, Inc. (“PDM”). During 2002 we also recorded income of $0.4 million in relation to adjustments associatedwith the sale of our XL Technology Systems, Inc. subsidiary. During 2001, we recorded special charges of $5.7 million for per-sonnel costs related to the relocation of our administrative office including costs of senior executives who elected not torelocate, as well as moving-related (which were expensed as incurred) and severance expenses, and our voluntary resignationoffer; $2.8 million for facilities and other charges, including charges related to the sale, closure, downsizing or relocation ofoperations; and $1.2 million for integration costs, primarily related to integration initiatives associated with the PDM Divisionsacquisitions. In accordance with Emerging Issues Task Force (“EITF”) 94-3, moving, replacement personnel and integrationcosts have been expensed as incurred. For a further discussion of the special charges, see Note 4 to the ConsolidatedFinancial Statements.
Income (Loss) from Operations—Income from operations in 2002 was $77.7 million, representing a $23.3 million increasecompared with 2001. The North America segment benefited from a project mix that included increased levels of higher margin EPC work. Storage related work declined in North America from 2001, but the shortfall was more than offset byimprovements in project execution and control of overhead and administrative expenses. Higher volumes in the EAME segment, combined with continued cost control and excellent execution, enabled the segment to post improved operatingincome. The AP segment improved compared with the prior year, due principally to significantly higher volumes in Australia.Despite lower new awards and revenues, the CSA segment reported higher operating income due to the existing backlog ofwork and favorable project execution, resulting in project cost savings. Our adoption of Statement of Financial AccountingStandard No. 142 “Goodwill and Other Intangible Assets” as of January 1, 2002, resulted in the elimination of goodwill andother indefinite lived intangibles amortization, which, in comparison with 2001, benefited 2002 income from operations by$3.6 million.
Interest Expense and Interest Income—Interest expense decreased $1.3 million from the prior year to $7.1 million for 2002,due to lower average debt levels in 2002. Interest income decreased $0.3 million from 2001 to $1.6 million in 2002, attributa-ble to lower interest on our long-term receivable during 2002.
Income Tax (Expense) Benefit—Income tax expense was $20.2 million and $13.5 million in 2002 and 2001, respectively. Theeffective tax rates for 2002 and 2001 were 28.0% and 28.1%, respectively.
Net Income—Net income for 2002 was $50.1 million, or $1.12 per diluted share, compared with $19.7 million, or $0.44 perdiluted share in 2001.
29
Brought to you by Global Reports
2001 Versus 2000
New Business Taken/Backlog—New business taken during 2001 was $1.2 billion compared with $680.8 million in 2000. Over 70% of the new business taken during 2001 was for contracts awarded in North America. During 2001, new business taken increased 113% in the North America segment primarily due to the acquisitions of Howe-Baker International, L.L.C.(“Howe-Baker”) and the PDM Divisions and included the following significant awards: a cryogenic storage tank for an LNGimport terminal in the United States, an award for a gas-to-liquids processing facility, a clean fuels revamp project valued inexcess of $40 million, a refinery relocation project, an oil sands project in Canada valued in excess of $40 million, a contractfor the erection of heat recovery steam generators for an electric utility in the U.S. Northeast and a hydrogen plant in the U.S.Northwest. New business taken in the AP segment increased 85% during 2001 and included awards for an LNG expansionproject in Australia valued at $65 million and piping and mechanical work for an LNG expansion project in Malaysia. Newbusiness taken in the EAME segment increased 6% during 2001. New business taken in the CSA segment decreased 5% during 2001 (after increasing more than 200% during 2000 compared with 1999) and included awards for a heavy oil tankageproject in Venezuela and a cryogenic natural gas plant in Peru.
Backlog at December 31, 2001 was $835.3 million compared with backlog at December 31, 2000 of $597.4 million(including backlog of $125.1 million from the Howe-Baker acquisition). Including the backlog acquired from the acquisition ofthe PDM Divisions in February 2001, backlog would have increased to approximately $741.5 million at December 31, 2000 on apro forma basis.
Revenues—Revenues were $1.1 billion in 2001 compared with $611.7 million in 2000. The increase in revenues was due primarily to the additional revenue stream generated by the acquisitions of Howe-Baker and the PDM Divisions. During2001, revenues increased 154% in the CSA segment and 139% in the North America segment, but declined 30% in the EAMEsegment and 28% in the AP segment. The increase in revenues in the North America and CSA segments was due to theacquired businesses and to the significant amount of work put in place in the Caribbean and Venezuela.
Gross Profit—Gross profit increased $67.8 million to $136.8 million in 2001 from $69.0 million in 2000. Gross profit as a per-centage of revenues was 12.6% in 2001 and 11.3% in 2000 reflecting the significant cost savings achieved from the PDMDivisions integration, the inclusion of higher margin business from Howe-Baker and continued strong project execution.
Selling and Administrative Expenses—Selling and administrative expenses were $67.5 million, or 6.2% of revenues, in 2001compared with $41.9 million, or 6.9% of revenues, in 2000. The 2001 selling and administrative expenses increased due to theacquisitions and a $4.9 million increase in performance-based and variable pay compared with 2000.
Special Charges—Special charges for 2001 were $9.7 million. During 2001, we recorded special charges of $5.7 million forpersonnel costs related to the relocation of our administrative office to The Woodlands, Texas, including costs of senior execu-tives who elected not to relocate, as well as moving-related (which are expensed as incurred) and severance expenses, andour voluntary resignation offer; $2.8 million for facilities and other charges, including charges related to the sale, closure,downsizing or relocation of operations; and $1.2 million for integration costs, primarily related to integration initiatives associated with the PDM Divisions acquisition.
Income (Loss) from Operations—Income from operations was $54.4 million in 2001 compared with a $26.8 million loss in2000. The North America segment results benefited from the inclusion of Howe-Baker and the PDM Divisions, lower thananticipated integration costs and good results from our Industrial, Water and union construction operations in the U.S. andCanada. Despite very low volumes in the EAME segment, focused cost control and excellent execution enabled the segmentto post modest operating income. Excluding poor economic performance in Australia, the AP segment was profitable. TheCSA segment benefited from several large contracts in the field in the Caribbean and Venezuela in 2001. We have experi-enced no material impact from the economic crisis in Argentina. The 2000 results included the recognition of $3.1 millionof income related to a favorable trial court decision from a claim against certain of our insurers to recover legal feesexpended in an environmental litigation. Intangibles amortization increased to $5.8 million in 2001 compared with $0.6 mil-lion in 2000 primarily due to increased goodwill and other intangibles amortization related to the acquisitions ofHowe-Baker and the PDM Divisions.
Interest Expense and Interest Income—Interest expense increased $3.2 million to $8.4 million in 2001 from $5.2 million in2000. The increase was mostly due to higher average debt levels in 2001. Interest income consisting primarily of interestrelated to Howe-Baker’s acquisition of Schedule A, Ltd. (see Note 12 to our Consolidated Financial Statements) and interestearned on cash balances increased to $1.9 million in 2001 compared with $0.4 million in 2000. Net interest expense increased$1.7 million to $6.5 million in 2001 compared with $4.8 million in 2000.
Income Tax (Expense) Benefit—We recorded income tax expense of $13.5 million in 2001 compared with a $4.9 million incometax benefit in 2000.
Loss from Discontinued Operations—During the second quarter of 2001, we decided to discontinue our high purity pipingbusiness, UltraPure Systems, due primarily to continuing weak market conditions in the microelectronics industry. The
30
C B & I 2 0 0 2 A N N U A L R E P O R T
Brought to you by Global Reports
loss from discontinued operations for the year 2001 was $2.3 million, net of taxes, compared with a loss from discontinuedoperations of $5.7 million, net of taxes, for 2000. The loss on disposal of discontinued operations for 2001 was $9.9 million,net of taxes. Our actions necessary to discontinue UltraPure Systems were essentially complete at December 31, 2001.
Net Income—Net income for 2001 was $19.7 million, or $0.44 per diluted share, compared with a net loss of $33.8 million, or$1.80 per diluted share, for 2000.
Liquidity and Capital Resources
At December 31, 2002, cash and cash equivalents equaled $102.5 million. During 2002, our operations generated $72.0 mil-lion of cash flows, attributable to strong profitability and a decrease in working capital. Working capital varies from year toyear and is primarily affected by the mix, stage of completion and commercial terms of our construction contracts.
In 2002, we expended $23.9 million for capital expenditures, which included $11.6 million for the initial land acquisitionand development costs of our new administrative office in Texas. Additionally, we reported proceeds of $4.6 million related tothe sale of property and equipment. Our utilization of cash also included $17.6 million relative to business acquisitions, inclu-sive of a payment for contingent earnout obligations associated with the Howe-Baker acquisition, final purchase priceadjustments relative to the PDM Divisions acquisitions as well as a payment for the purchase of TPA, Inc. We continue to evaluate and selectively pursue opportunities for expansion of our business through acquisition of complementary busi-nesses. These acquisitions, if they arise, may involve the use of cash or, depending upon the size and terms of the acquisition,may require debt or equity financing.
Cash flows from financing activities were $17.0 million, which included $25.2 million of net proceeds generated from apublic offering of our common stock on July 1, 2002. The offering of just over 6 million shares consisted of 4.2 million second-ary shares sold on behalf of a shareholder, WEDGE Engineering B.V., an affiliate of WEDGE Group Incorporated, for which wereceived no proceeds, and 2.01 million primary shares. Cash utilized for financing activities included $5.8 million to settleshort-term notes and $5.2 million for cash dividends. In January 2003, we announced a two-for-one stock split in the form ofa stock dividend, as well as a 33% increase in our annual dividend from $0.12 to $0.16 per share.
Our primary internal source of liquidity is cash flow generated from operations; however, capacity under revolving creditagreements is also available, if necessary, to fund operating or investing activities. We have a four-year $125 million revolvingcredit facility and a 364-day $50 million revolving credit facility which terminate in August 2006 and August 2003, respectively.Both facilities are committed and unsecured. As of year-end, no direct borrowings existed under either facility, but we hadissued $67.6 million of letters of credit under the four-year facility. As of December 31, 2002, we had $107 million of availablecapacity under these facilities for future operating or investing needs. For a further discussion of the revolving credit agree-ments, see Note 9 to the Consolidated Financial Statements.
We also have various short-term, uncommitted revolving credit facilities across several geographic regions of approxi-mately $193.1 million. These facilities are generally used to provide letters of credit or bank guarantees to customers inthe ordinary course of business, to support advance payments, as performance guarantees or in lieu of retention on ourcontracts. At year-end, we had available capacity of $75.7 million under these uncommitted facilities. In addition to provid-ing letters of credit or bank guarantees, we also issue surety bonds in the ordinary course of business to support ourperformance on contracts. For a further discussion of letters of credit and surety bonds see Note 13 to the ConsolidatedFinancial Statements.
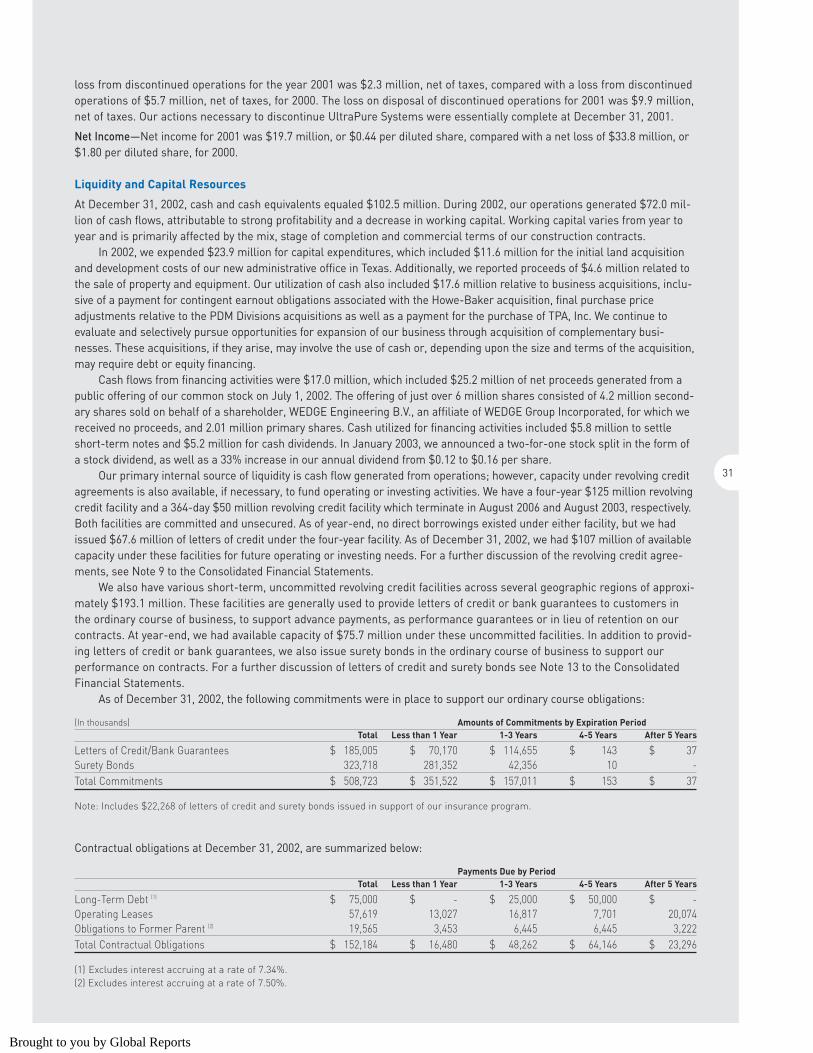
As of December 31, 2002, the following commitments were in place to support our ordinary course obligations:
(In thousands) Amounts of Commitments by Expiration PeriodTotal Less than 1 Year 1-3 Years 4-5 Years After 5 Years
Letters of Credit/Bank Guarantees $ 185,005 $ 70,170 $ 114,655 $ 143 $ 37 Surety Bonds 323,718 281,352 42,356 10 -Total Commitments $ 508,723 $ 351,522 $ 157,011 $ 153 $ 37
Note: Includes $22,268 of letters of credit and surety bonds issued in support of our insurance program.
Contractual obligations at December 31, 2002, are summarized below:
Payments Due by PeriodTotal Less than 1 Year 1-3 Years 4-5 Years After 5 Years
Long-Term Debt (1) $ 75,000 $ - $ 25,000 $ 50,000 $ -Operating Leases 57,619 13,027 16,817 7,701 20,074Obligations to Former Parent (2) 19,565 3,453 6,445 6,445 3,222Total Contractual Obligations $ 152,184 $ 16,480 $ 48,262 $ 64,146 $ 23,296
(1) Excludes interest accruing at a rate of 7.34%.(2) Excludes interest accruing at a rate of 7.50%.
31
Brought to you by Global Reports
We believe funds generated by operations, amounts available under existing credit facilities and external sources ofliquidity, such as the issuance of debt and equity instruments, will be sufficient to finance capital expenditures and workingcapital needs for the foreseeable future. For 2003, capital expenditures are anticipated to be in the $30.0 to $35.0 millionrange, which includes approximately $17.0 million for completion of our new administrative office. However, we cannot giveassurances that such funding will be available, as our ability to generate cash flows from operations and our ability toaccess funding under the revolving credit facilities may be impacted by a variety of business, economic, legislative, finan-cial and other factors which may be outside of our control. Additionally, while we currently have a significant, uncommittedbonding facility, primarily to support various commercial provisions in our engineering and construction contracts, a termi-nation or reduction of the bonding facility could result in the utilization of letters of credit in lieu of performance bonds,thereby reducing our available capacity under the revolving credit facilities. Although we do not anticipate a reduction ortermination of the bonding facility, there is no guarantee that such a facility will be available at reasonable terms to serviceour ordinary course obligations.
Off-Balance Sheet Arrangements
We use operating leases for facilities and equipment when they make economic sense. In 2001, we entered into a sale (forapproximately $14.0 million) and leaseback transaction of our Plainfield, Illinois administrative office with a lease term of 20years. The leaseback structure is not subject to consolidation and the future payments are accounted for as an operatinglease. Rentals under this and all other lease commitments are reflected in rental expense and future rental commitments assummarized in Note 13 to our Consolidated Financial Statements.
We have no other off-balance sheet arrangements.
Quantitative and Qualitative Disclosure About Market Risks
We are exposed to market risk from changes in foreign currency exchange rates, which may adversely affect our results ofoperations and financial condition. We seek to minimize the risks from these foreign currency exchange rate fluctuationsthrough our regular operating and financing activities and, when deemed appropriate, through our limited use of foreign cur-rency forward contracts. Our exposure to changes in foreign currency exchange rates arises from receivables, payables andfirm commitments from international transactions, as well as intercompany loans utilized to finance non-U.S. subsidiaries.We do not use financial instruments for trading or speculative purposes.
The carrying value of our cash and cash equivalents, accounts receivable, accounts payable, notes payable and forwardcontracts approximates their fair values because of the short term nature of these instruments. At December 31, 2002 and2001, the fair value of our fixed rate long-term debt was $80.7 million and $76.7 million respectively based on current marketrates for debt with similar credit risk and maturities. See Note 10 to our consolidated financial statements for quantificationof our financial instruments.
New Accounting Standards
In June 2001, the Financial Accounting Standards Board (“FASB”) issued Statements of Financial Accounting Standard(“SFAS”) No. 141 “Business Combinations” (SFAS No. 141”) and SFAS No. 142 “Goodwill and Other Intangible Assets” (“SFAS No. 142”). These pronouncements changed the accounting for business combinations, goodwill and intangible assets.SFAS No. 141 eliminates the pooling-of-interests method of accounting for business combinations and further clarifies thecriteria to recognize intangible assets separately from goodwill. The requirements of SFAS No. 141 were effective for any business combination accounted for by the purchase method that was completed after June 30, 2001. SFAS No. 142 statesgoodwill and indefinite-lived intangible assets are no longer amortized to earnings, but instead are reviewed for impairmentat least annually. The amortization of existing goodwill and indefinite-lived intangible assets at June 30, 2001 has ceased atJanuary 1, 2002. Goodwill on acquisitions completed subsequent to June 30, 2001, is not amortized. Our adoption of SFAS No.142 resulted in no goodwill and indefinite-lived intangibles amortization in 2002 compared with $4.2 million in 2001. In con-nection with the adoption of these statements during the first quarter of 2002, we completed our goodwill impairmentassessment and concluded that no transitional impairment charge was necessary. Also, as of September 30, 2002, we completed our annual impairment assessment and concluded that no impairment charge was necessary.
In August 2001, the FASB issued SFAS No. 143, “Accounting for Asset Retirement Obligations” which addresses thefinancial accounting and reporting for obligations associated with the retirement of tangible long-lived assets and the associ-ated assets’ retirement costs. The new standard was effective January 1, 2003, and is not anticipated to have a significantimpact on our financial condition or results of operations.
In August 2001, the FASB issued SFAS No. 144, “Accounting for the Impairment or Disposal of Long-Lived Assets”. Thisstatement addresses financial accounting and reporting for the impairment and/or disposal of long-lived assets. We adoptedthis statement effective January 1, 2002, and determined that it did not have a significant impact on our financial statementsas of that date.
32
C B & I 2 0 0 2 A N N U A L R E P O R T
Brought to you by Global Reports
In April 2002, the FASB issued SFAS No. 145, “Rescission of SFAS Statements No. 4, 44, and 64, Amendment of SFAS No.13, and Technical Corrections.” The purpose of this statement is to update, clarify and simplify existing accounting standards.We adopted this statement effective April 1, 2002, and determined that it did not have a significant impact on our financialstatements.
In July 2002, the FASB issued SFAS No. 146, “Accounting for Costs Associated with Exit or Disposal Activities.” This stan-dard requires companies to recognize costs associated with exit or disposal activities when they are incurred rather than atthe date of a commitment to exit or disposal plan. Examples of costs covered by the standard include lease termination costsand certain employee severance costs that are associated with a restructuring, discontinued operation, plant closing, or otherexit or disposal activity. Previous accounting guidance was provided by EITF Issue No. 94-3, “Liability Recognition for CertainEmployee Termination Benefits and Other Costs to Exit an Activity (including Certain Costs Incurred in a Restructuring).” SFASNo. 146 replaces Issue 94-3. SFAS No. 146 is to be applied prospectively to exit or disposal activities initiated after December31, 2002. This statement is effective for our fiscal year beginning January 1, 2003.
In December 2002, the FASB issued SFAS No. 148, “Accounting for Stock-Based Compensation – Transition andDisclosure”, which amends SFAS No. 123, “Accounting for Stock-Based Compensation.” This standard permits two additionaltransition methods for entities that adopt the fair-value-based method of accounting for stock-based employee compensationand amends the disclosure requirements in both annual and interim financial statements. We will continue to applyAccounting Principles Board (APB) Opinion No. 25, “Accounting for Stock Issued to Employees,” and related interpretations inaccounting for stock options. The amended disclosure requirements of SFAS No. 148 have been incorporated into Note 15 tothe Consolidated Financial Statements.
In November 2002, the FASB issued Interpretation No. 45, “Guarantor’s Accounting and Disclosure Requirements forGuarantees, Including Indirect Guarantees of Indebtedness of Others”. This interpretation of SFAS No. 5, 57, and 107, andrescission of FASB Interpretation No. 34 elaborates on the disclosures to be made by a guarantor in its interim and annualfinancial statements about its obligations under certain guarantees that it has issued. It also clarifies that a guarantor isrequired to recognize, at the inception of a guarantee, a liability for the fair value of the obligation undertaken in issuing theguarantee. The initial recognition and measurement provisions of this interpretation are applicable on a prospective basis toguarantees issued or modified after December 31, 2002. The disclosure requirements in this interpretation are applicable forfinancial statements of interim or annual periods ending after December 15, 2002. See Note 13 of our Consolidated FinancialStatements for the disclosure of guarantor relationships.
Critical Accounting Policies
The discussion and analysis of financial condition and results of operations are based upon our consolidated financialstatements, which have been prepared in accordance with accounting principles generally accepted in the United States ofAmerica. The preparation of these financial statements requires us to make estimates and judgments that affect thereported amounts of assets, liabilities, revenues and expenses, and related disclosure of contingent assets and liabilities.We evaluate our estimates on an on-going basis, based on historical experience and on various other assumptions that arebelieved to be reasonable under the circumstances. Actual results may differ from these estimates under differentassumptions or conditions.
We believe that the following critical accounting policies affect our more significant judgments and estimates used in thepreparation of our consolidated financial statements:
Revenue Recognition—We recognize revenues using the percentage-of-completion method. Contract revenues are accruedbased generally on the percentage that costs-to-date bear to total estimated costs. We follow the guidance of Statement ofPosition 81-1, “Accounting for Performance of Construction-Type and Certain Production-Type Contracts,” for accounting policy relating to our use of the percentage-of-completion method, estimating costs, revenue recognition and claim recogni-tion. The use of estimated cost to complete each contract, while the most widely recognized method used forpercentage-of-completion accounting, is a significant variable in the process of determining income earned and is a signifi-cant factor in the accounting for contracts. The cumulative impact of revisions in total cost estimates during the progress ofwork is reflected in the period in which these changes become known. Contract revenue reflects the original contract priceadjusted for agreed-upon change orders and estimated minimum recoveries of claims. Although successful, this contractingmodel has inherent risks. Losses expected to be incurred on contracts in progress are charged to income as soon as suchlosses are known. A significant portion of our work is performed on a fixed price or lump sum basis. The balance of projects isprimarily performed on variations of cost reimbursable and target price approaches. Progress billings in accounts receivableare currently due and exclude retentions until such amounts are due in accordance with contract terms. We have a history ofproven success in estimating and bidding lump sum, fixed price contracts. However, due to the various estimates inherent inour contract accounting, actual results could differ from those estimates.
33
Brought to you by Global Reports
Credit Extension—We extend credit to customers and other parties in the normal course of business only after a review of thepotential customer’s credit worthiness. Additionally, management reviews the commercial terms of all significant contractsbefore entering into a contractual arrangement. We regularly review outstanding receivables and provide for estimated lossesthrough an allowance for doubtful accounts. In evaluating the level of established reserves, management makes judgmentsregarding the parties’ ability to make required payments, economic events and other factors. As the financial condition ofthese parties change, circumstances develop or additional information becomes available, adjustments to the allowance fordoubtful accounts may be required.
Estimated Reserves for Insurance Matters—We maintain insurance coverage for various aspects of our business and opera-tions. However, we retain a portion of anticipated losses through the use of deductibles and self-insured retentions for ourexposures related to third-party liability and workers’ compensation. Management regularly reviews estimates of reportedand unreported claims and provides for losses through insurance reserves. As claims develop and additional informationbecomes available, adjustments to loss reserves may be required.
Recoverability of Goodwill—Effective January 1, 2002, we adopted SFAS No. 142 “Goodwill and Other Intangible Assets.” SFAS No. 142 states that goodwill and indefinite-lived intangible assets are no longer to be amortized but are to be reviewedannually for impairment. The goodwill impairment analysis required under SFAS No. 142 requires us to allocate goodwill toour reporting units, compare the fair value of each reporting unit with our carrying amount, including goodwill, and then, ifnecessary, record a goodwill impairment charge in an amount equal to the excess, if any, of the carrying amount of a report-ing unit’s goodwill over the implied fair value of that goodwill. The primary method that we employ to estimate these fairvalues is the discounted cash flow method. This methodology is based, to a large extent, on assumptions about future eventswhich may or may not occur as anticipated, and such deviations could have a significant impact on the estimated fair valuescalculated. These assumptions include, but are not limited to, estimates of future growth rates, discount rates and terminalvalues of reporting units. See further discussion in Note 7 to the Consolidated Financial Statements. Our goodwill balance atDecember 31, 2002 was $157.9 million.
Our significant accounting policies are more fully discussed in Note 2 to our Consolidated Financial Statements.
Forward Looking Statements
This Annual Report contains forward-looking statements. You should read carefully any statements containing the words“expect,” “believe,” “anticipate,” “project,” “estimate,” “predict,” “intend,” “should,” “could,” “may,” “might,” or similarexpressions or the negative of any of these terms.
Forward-looking statements involve known and unknown risks and uncertainties. Various factors, such as those listedunder “Risk Factors,” as set forth in our Form 10-K, may cause our actual results, performance or achievements to be mate-rially different from those expressed or implied by any forward-looking statements. Among the factors that could cause ourresults to differ are the following: • our ability to realize cost savings from expected execution performance of contracts; • the uncertain timing and funding of new contract awards, and project cancellations and operations risks; • a lack of expected growth in our primary end markets; • cost overruns on fixed price contracts and risks associated with percentage of completion accounting; • increased competition;• lack of necessary liquidity to finance expenditures prior to the receipt of payment for the performance of contracts and to
provide bid and performance bonds and letters of credit securing our obligations under our bids and contracts; • risks inherent in our acquisition strategy and our ability to obtain financing for proposed acquisitions; • adverse outcomes of pending claims or litigation or the possibility of new claims or litigation;• proposed revisions to U.S. tax laws that seek to increase income taxes payable by certain international companies;• a continued downturn in the economy in general; and• disruptions caused by possible war in the Middle East or terrorist attacks in the United States or other countries in which
we operate.Additional factors which could cause actual results to differ from such forward-looking statements are set forth in our
Form 10-K for the year ended December 31, 2002. Although we believe the expectations reflected in the forward-looking statements are reasonable, we cannot guaran-
tee future performance or results. We are not obligated to update or revise any forward-looking statements, whether as aresult of new information, future events or otherwise. You should consider these risks when reading any forward-lookingstatements.
34
C B & I 2 0 0 2 A N N U A L R E P O R T
Brought to you by Global Reports
REPORT OF INDEPENDENT PUBLIC ACCOUNTANTS
To the Shareholders and the Supervisory Board of Chicago Bridge & Iron Company N.V.:
We have audited the accompanying consolidated balance sheet of Chicago Bridge & Iron Company N.V. (a Netherlands corpo-ration) and Subsidiaries (the Company) as of December 31, 2002, and the related consolidated statements of income,shareholders’ equity, and cash flows for the year then ended. These consolidated financial statements are the responsibility ofthe Company’s management. Our responsibility is to express an opinion on these consolidated financial statements based onour audit. The consolidated financial statements of the Company as of December 31, 2001 and for the years ended December31, 2001 and 2000, prior to the revisions discussed in the Notes to the financial statements as indicated below, were auditedby other auditors who have ceased operations. Those auditors expressed an unqualified opinion on those consolidated finan-cial statements in their report dated February 11, 2002.
We conducted our audit in accordance with auditing standards generally accepted in the United States of America. Thosestandards require that we plan and perform the audit to obtain reasonable assurance about whether the financial statementsare free of material misstatement. An audit includes examining, on a test basis, evidence supporting the amounts and disclo-sures in the financial statements. An audit also includes assessing the accounting principles used and significant estimatesmade by management, as well as evaluating the overall financial statement presentation. We believe that our audit provides areasonable basis for our opinion.
In our opinion, such consolidated financial statements present fairly, in all material respects, the financial position of theCompany as of December 31, 2002, and the results of its operations and its cash flows for the year then ended in conformitywith accounting principles generally accepted in the United States of America.
As described in Notes 2 and 7 to the consolidated financial statements, effective January 1, 2002, the Company changedits method of accounting for goodwill and other intangible assets upon the adoption of Statement of Financial AccountingStandards (“SFAS”) No. 142, “Goodwill and Other Intangible Assets.”
As discussed above, the consolidated financial statements of the Company as of December 31, 2001, and for the yearsended December 31, 2001 and 2000 were audited by other auditors who have ceased operations. Such Financial statementshave been revised to give effect to the following adjustments and reclassifications:• February 10, 2003 stock split (see Note 14). We audited the adjustments described in Note 14 that were applied to revise the
2001 and 2000 financial statements for such stock split. Our audit procedures included (1) comparing the amounts shown inthe earnings per share disclosures for 2001 and 2000 to the Company’s underlying accounting analysis obtained from man-agement, (2) comparing the previously reported shares outstanding and income statement amounts per the Company’saccounting analysis to the previously issued financial statements, and (3) recalculating the additional shares to give effect tothe stock split and testing the mathematical accuracy of the underlying analysis.
• Transitional disclosures for adoption of SFAS No. 142 (see Note 7). We audited the adjustments described in Note 7 thatwere applied to revise the 2001 and 2000 financial statements to include the transitional disclosures required by SFAS No.142, which was adopted by the Company as of January 1, 2002. Our audit procedures with respect to the disclosures in Note7 with respect to 2001 and 2000 included (1) comparing the previously reported net income to the previously issued financialstatements and the adjustments to reported net income representing amortization expense (including any related taxeffects) recognized in those periods related to goodwill and intangible assets that are no longer being amortized andchanges in amortization periods for intangible assets that will continue to be amortized as result of initially applying SFASNo. 142 (including any related tax effects) to the Company’s underlying analysis obtained from management, (2) testing themathematical accuracy of the reconciliation of adjusted net income to reported net income and the related earnings-per-share amounts and (3) comparing the separate amounts for goodwill and other intangible assets for 2001 to the Company’sunderlying analysis obtained from management, and (4) testing the mathematical accuracy of the underlying analysis.
• Summarized disclosure of defined benefit plans (see Note 11). We audited the adjustments that were applied to revise the2001 and 2000 financial statements to include combined tabular disclosures of the Company’s defined benefit plans as per-mitted under SFAS No. 132, “Employers’ Disclosures about Pensions and Other Postretirement Benefits,” as compared toprevious tabular presentation of each defined benefit plan. Our audit procedures with respect to the 2001 and 2000 disclo-sures in Note 11 included (1) comparing the previously reported tabular presentation of each defined benefit plan to acombining schedule prepared by management, and (2) testing the mathematical accuracy of the underlying analysis.
In our opinion, the adjustments, transitional disclosures and reclassifications to the 2001 and 2000 financial statementsand disclosures described above have been properly applied. However, we were not engaged to audit, review, or apply anyprocedures to the 2001 and 2000 financial statements of the Company other than with respect to such adjustments, transi-tional disclosures and reclassifications, accordingly, we do not express an opinion or any form of assurance on the 2001 and2000 financial statements taken as a whole.
DELOITTE & TOUCHE LLPHouston, TexasFebruary 13, 2003
35
Brought to you by Global Reports
INFORMATION REGARDING PREDECESSOR INDEPENDENT PUBLIC ACCOUNTANT’S REPORTS
The following reports are copies of reports previously issued by Arthur Andersen, LLP (“Andersen”). The reports have notbeen reissued by Andersen. As discussed in Note 7 “Goodwill and Other Intangibles”, the Company has presented thetransitional disclosures for 2001 and 2000 required by SFAS No. 142, and as discussed in Note 14 “Shareholders’ Equity”,the Company has adjusted prior periods for the stock split for all periods presented. Additionally, the Company revisedthe 2001 and 2000 financial statements to include combined tabular disclosures of the Company’s defined benefit plansas permitted under SFAS No. 132. The Andersen report does not extend these changes to the 2001 and 2000 consolidatedfinancial statements.
To the Shareholders and the Supervisory Board of Chicago Bridge & Iron Company N.V.:
We have audited the accompanying consolidated balance sheets of CHICAGO BRIDGE & IRON COMPANY N.V. (a Netherlandscorporation) and SUBSIDIARIES as of December 31, 2001 and 2000, and the related consolidated statements of income,changes in shareholders’ equity and cash flows for each of the three years ended December 31, 2001. These financial state-ments are the responsibility of the Company’s management. Our responsibility is to express an opinion on these financialstatements based on our audits.
We conducted our audits in accordance with generally accepted auditing standards in the United States of America andThe Netherlands. Those standards require that we plan and perform the audits to obtain reasonable assurance about whetherthe financial statements are free of material misstatement. An audit includes examining, on a test basis, evidence supportingthe amounts and disclosures in the financial statements. An audit also includes assessing the accounting principles used andsignificant estimates made by management, as well as evaluating the overall financial statement presentation. We believethat our audits provide a reasonable basis for our opinion.
In our opinion, the financial statements referred to above present fairly, in all material respects, the financial position ofCHICAGO BRIDGE & IRON COMPANY N.V. and SUBSIDIARIES as of December 31, 2001 and 2000 and the results of its opera-tions and cash flows for each of the three years ended December 31, 2001, in conformity with accounting principles generallyaccepted in the United States of America.
Arthur AndersenAmsterdam, The NetherlandsFebruary 11, 2002
36
C B & I 2 0 0 2 A N N U A L R E P O R T
Brought to you by Global Reports
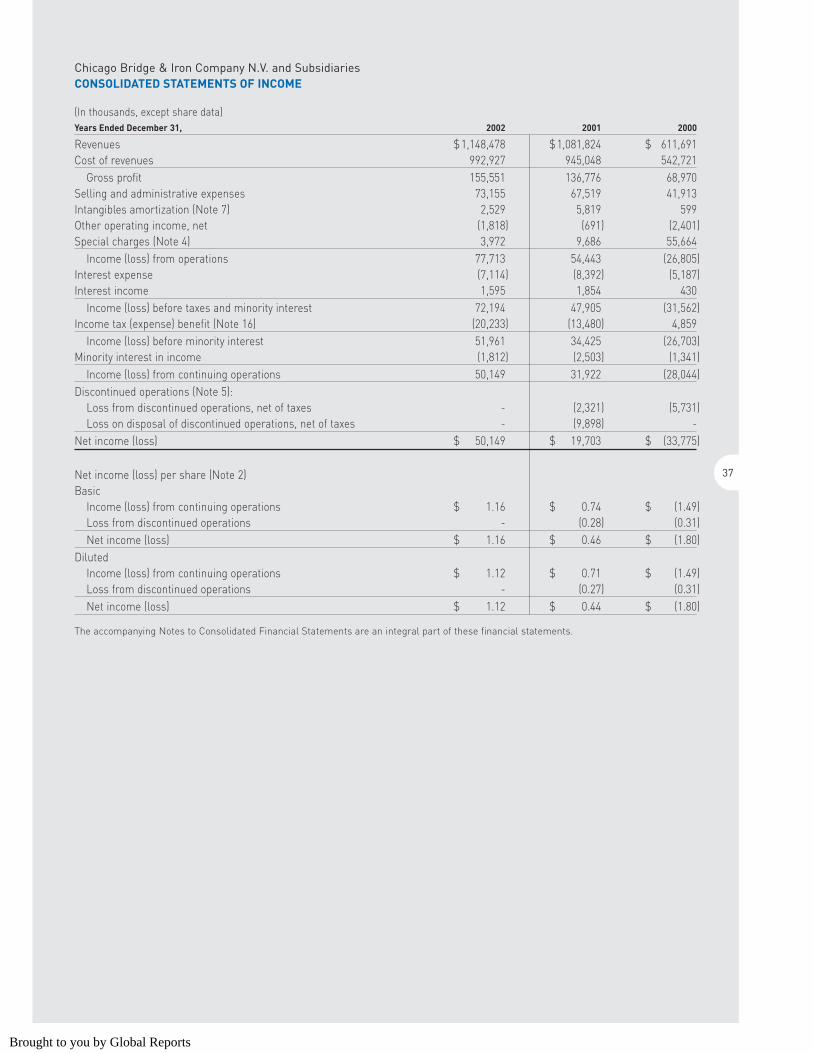
Chicago Bridge & Iron Company N.V. and SubsidiariesCONSOLIDATED STATEMENTS OF INCOME
(In thousands, except share data)Years Ended December 31, 2002 2001 2000
Revenues $1,148,478 $1,081,824 $ 611,691 Cost of revenues 992,927 945,048 542,721
Gross profit 155,551 136,776 68,970 Selling and administrative expenses 73,155 67,519 41,913 Intangibles amortization (Note 7) 2,529 5,819 599 Other operating income, net (1,818) (691) (2,401)Special charges (Note 4) 3,972 9,686 55,664
Income (loss) from operations 77,713 54,443 (26,805)Interest expense (7,114) (8,392) (5,187)Interest income 1,595 1,854 430
Income (loss) before taxes and minority interest 72,194 47,905 (31,562)Income tax (expense) benefit (Note 16) (20,233) (13,480) 4,859
Income (loss) before minority interest 51,961 34,425 (26,703)Minority interest in income (1,812) (2,503) (1,341)
Income (loss) from continuing operations 50,149 31,922 (28,044)Discontinued operations (Note 5):
Loss from discontinued operations, net of taxes - (2,321) (5,731)Loss on disposal of discontinued operations, net of taxes - (9,898) -
Net income (loss) $ 50,149 $ 19,703 $ (33,775)
Net income (loss) per share (Note 2)Basic
Income (loss) from continuing operations $ 1.16 $ 0.74 $ (1.49)Loss from discontinued operations - (0.28) (0.31)Net income (loss) $ 1.16 $ 0.46 $ (1.80)
DilutedIncome (loss) from continuing operations $ 1.12 $ 0.71 $ (1.49)Loss from discontinued operations - (0.27) (0.31)Net income (loss) $ 1.12 $ 0.44 $ (1.80)
The accompanying Notes to Consolidated Financial Statements are an integral part of these financial statements.
37
Brought to you by Global Reports
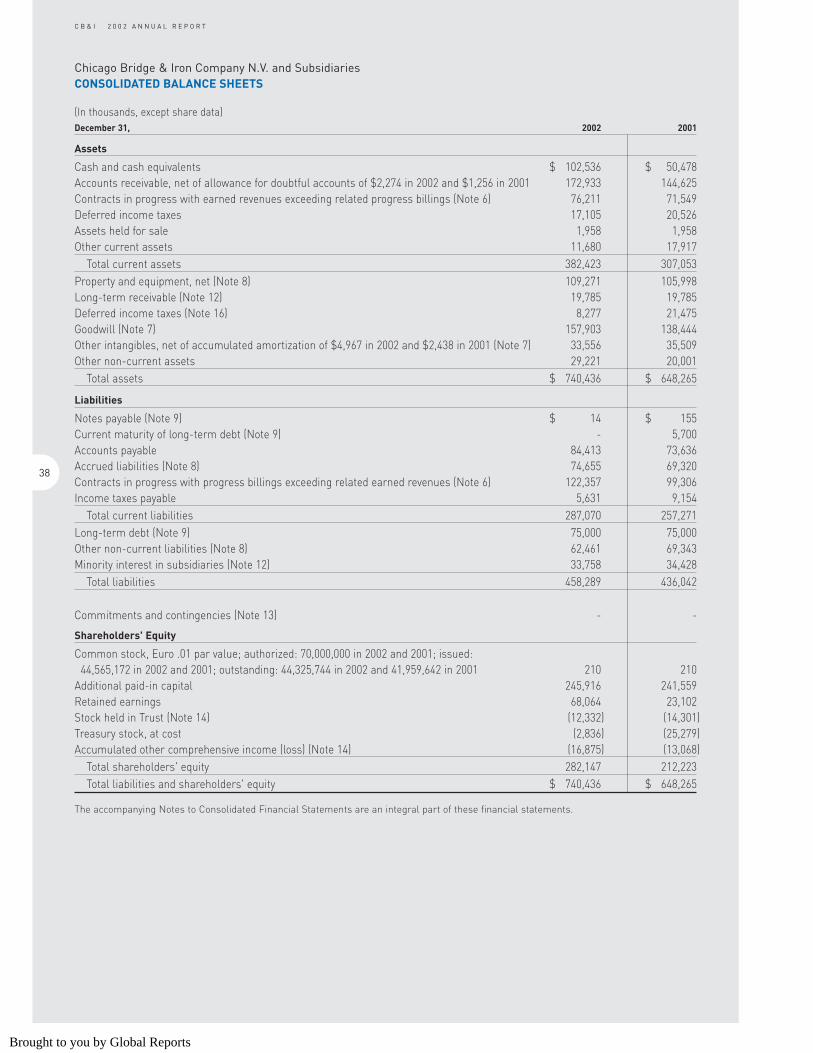
Chicago Bridge & Iron Company N.V. and SubsidiariesCONSOLIDATED BALANCE SHEETS
(In thousands, except share data)December 31, 2002 2001
Assets
Cash and cash equivalents $ 102,536 $ 50,478 Accounts receivable, net of allowance for doubtful accounts of $2,274 in 2002 and $1,256 in 2001 172,933 144,625 Contracts in progress with earned revenues exceeding related progress billings (Note 6) 76,211 71,549 Deferred income taxes 17,105 20,526 Assets held for sale 1,958 1,958 Other current assets 11,680 17,917
Total current assets 382,423 307,053 Property and equipment, net (Note 8) 109,271 105,998 Long-term receivable (Note 12) 19,785 19,785 Deferred income taxes (Note 16) 8,277 21,475 Goodwill (Note 7) 157,903 138,444 Other intangibles, net of accumulated amortization of $4,967 in 2002 and $2,438 in 2001 (Note 7) 33,556 35,509 Other non-current assets 29,221 20,001
Total assets $ 740,436 $ 648,265
Liabilities
Notes payable (Note 9) $ 14 $ 155 Current maturity of long-term debt (Note 9) - 5,700 Accounts payable 84,413 73,636 Accrued liabilities (Note 8) 74,655 69,320 Contracts in progress with progress billings exceeding related earned revenues (Note 6) 122,357 99,306 Income taxes payable 5,631 9,154
Total current liabilities 287,070 257,271 Long-term debt (Note 9) 75,000 75,000 Other non-current liabilities (Note 8) 62,461 69,343 Minority interest in subsidiaries (Note 12) 33,758 34,428
Total liabilities 458,289 436,042
Commitments and contingencies (Note 13) - -
Shareholders' Equity
Common stock, Euro .01 par value; authorized: 70,000,000 in 2002 and 2001; issued: 44,565,172 in 2002 and 2001; outstanding: 44,325,744 in 2002 and 41,959,642 in 2001 210 210
Additional paid-in capital 245,916 241,559 Retained earnings 68,064 23,102 Stock held in Trust (Note 14) (12,332) (14,301)Treasury stock, at cost (2,836) (25,279)Accumulated other comprehensive income (loss) (Note 14) (16,875) (13,068)
Total shareholders' equity 282,147 212,223 Total liabilities and shareholders' equity $ 740,436 $ 648,265
The accompanying Notes to Consolidated Financial Statements are an integral part of these financial statements.
38
C B & I 2 0 0 2 A N N U A L R E P O R T
Brought to you by Global Reports
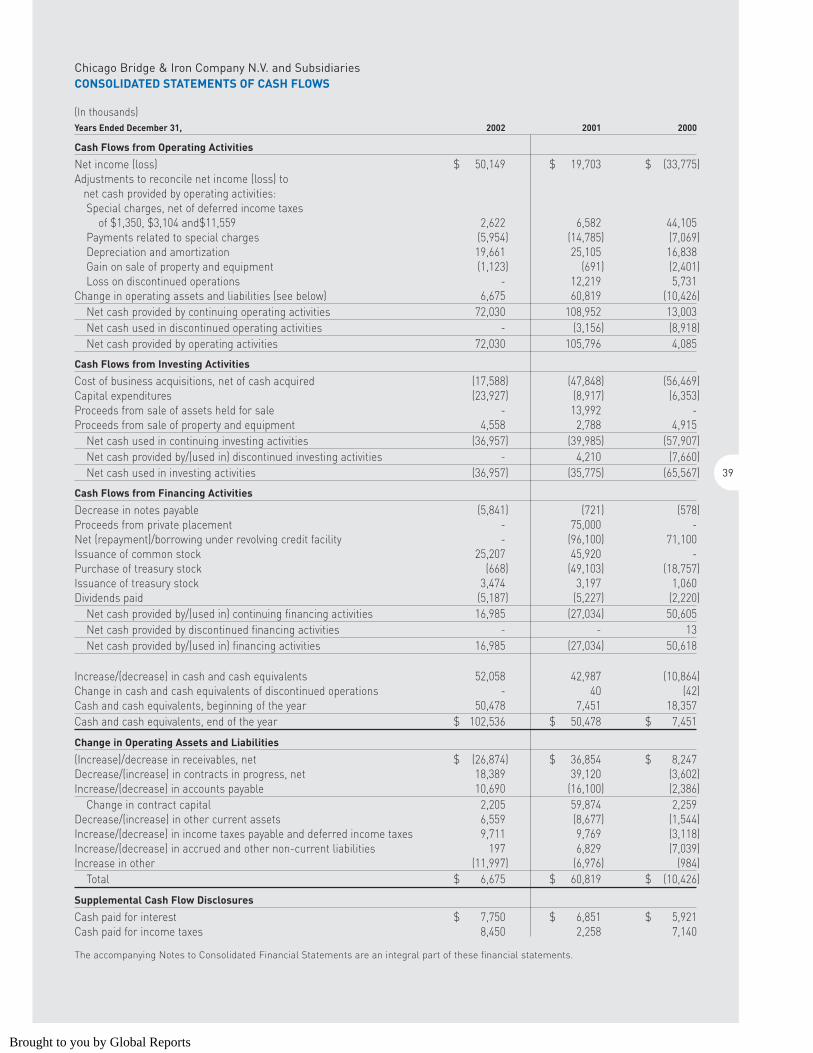
Chicago Bridge & Iron Company N.V. and SubsidiariesCONSOLIDATED STATEMENTS OF CASH FLOWS
(In thousands)Years Ended December 31, 2002 2001 2000
Cash Flows from Operating Activities
Net income (loss) $ 50,149 $ 19,703 $ (33,775)Adjustments to reconcile net income (loss) to
net cash provided by operating activities:Special charges, net of deferred income taxes
of $1,350, $3,104 and$11,559 2,622 6,582 44,105 Payments related to special charges (5,954) (14,785) (7,069)Depreciation and amortization 19,661 25,105 16,838 Gain on sale of property and equipment (1,123) (691) (2,401)Loss on discontinued operations - 12,219 5,731
Change in operating assets and liabilities (see below) 6,675 60,819 (10,426)Net cash provided by continuing operating activities 72,030 108,952 13,003 Net cash used in discontinued operating activities - (3,156) (8,918)Net cash provided by operating activities 72,030 105,796 4,085
Cash Flows from Investing Activities
Cost of business acquisitions, net of cash acquired (17,588) (47,848) (56,469)Capital expenditures (23,927) (8,917) (6,353)Proceeds from sale of assets held for sale - 13,992 - Proceeds from sale of property and equipment 4,558 2,788 4,915
Net cash used in continuing investing activities (36,957) (39,985) (57,907)Net cash provided by/(used in) discontinued investing activities - 4,210 (7,660)Net cash used in investing activities (36,957) (35,775) (65,567)
Cash Flows from Financing Activities
Decrease in notes payable (5,841) (721) (578)Proceeds from private placement - 75,000 - Net (repayment)/borrowing under revolving credit facility - (96,100) 71,100 Issuance of common stock 25,207 45,920 - Purchase of treasury stock (668) (49,103) (18,757)Issuance of treasury stock 3,474 3,197 1,060 Dividends paid (5,187) (5,227) (2,220)
Net cash provided by/(used in) continuing financing activities 16,985 (27,034) 50,605 Net cash provided by discontinued financing activities - - 13 Net cash provided by/(used in) financing activities 16,985 (27,034) 50,618
Increase/(decrease) in cash and cash equivalents 52,058 42,987 (10,864)Change in cash and cash equivalents of discontinued operations - 40 (42)Cash and cash equivalents, beginning of the year 50,478 7,451 18,357 Cash and cash equivalents, end of the year $ 102,536 $ 50,478 $ 7,451
Change in Operating Assets and Liabilities
(Increase)/decrease in receivables, net $ (26,874) $ 36,854 $ 8,247 Decrease/(increase) in contracts in progress, net 18,389 39,120 (3,602)Increase/(decrease) in accounts payable 10,690 (16,100) (2,386)
Change in contract capital 2,205 59,874 2,259 Decrease/(increase) in other current assets 6,559 (8,677) (1,544)Increase/(decrease) in income taxes payable and deferred income taxes 9,711 9,769 (3,118)Increase/(decrease) in accrued and other non-current liabilities 197 6,829 (7,039)Increase in other (11,997) (6,976) (984)
Total $ 6,675 $ 60,819 $ (10,426)
Supplemental Cash Flow Disclosures
Cash paid for interest $ 7,750 $ 6,851 $ 5,921 Cash paid for income taxes 8,450 2,258 7,140
The accompanying Notes to Consolidated Financial Statements are an integral part of these financial statements.
39
Brought to you by Global Reports
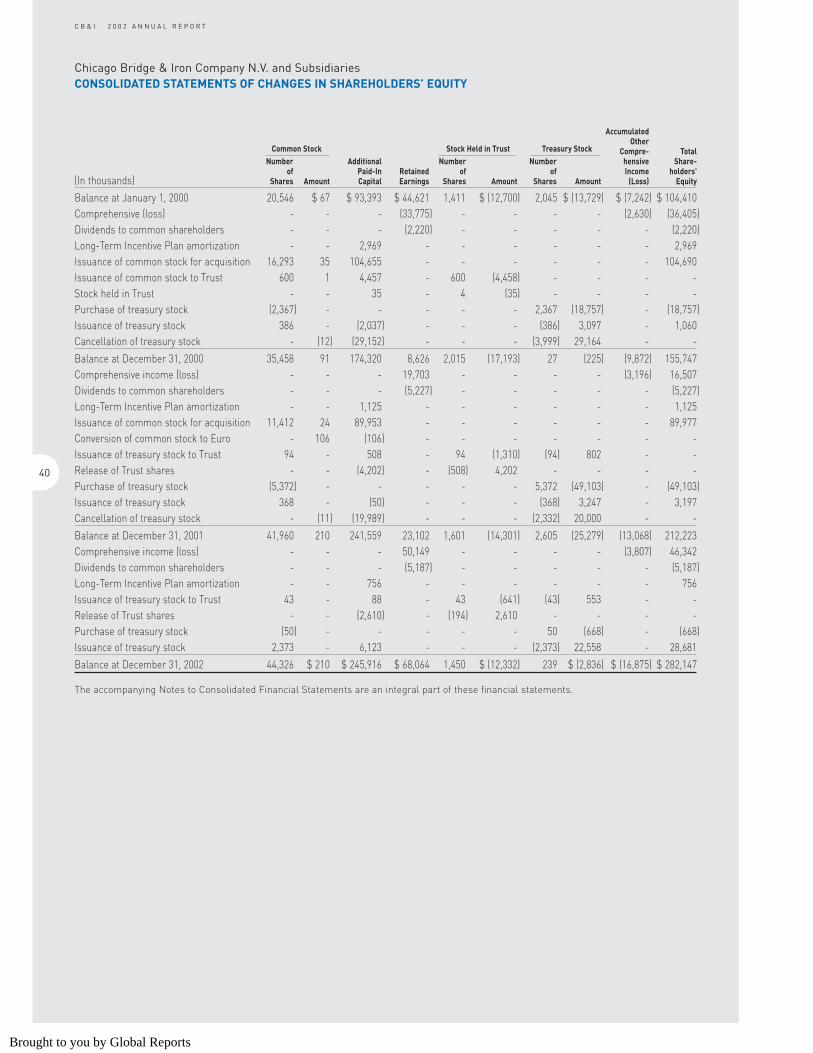
Chicago Bridge & Iron Company N.V. and SubsidiariesCONSOLIDATED STATEMENTS OF CHANGES IN SHAREHOLDERS’ EQUITY
AccumulatedOther
Common Stock Stock Held in Trust Treasury Stock Compre- Total Number Additional Number Number hensive Share-
of Paid-In Retained of of Income holders' (In thousands) Shares Amount Capital Earnings Shares Amount Shares Amount (Loss) Equity
Balance at January 1, 2000 20,546 $ 67 $ 93,393 $ 44,621 1,411 $ (12,700) 2,045 $ (13,729) $ (7,242) $ 104,410 Comprehensive (loss) - - - (33,775) - - - - (2,630) (36,405)Dividends to common shareholders - - - (2,220) - - - - - (2,220)Long-Term Incentive Plan amortization - - 2,969 - - - - - - 2,969 Issuance of common stock for acquisition 16,293 35 104,655 - - - - - - 104,690 Issuance of common stock to Trust 600 1 4,457 - 600 (4,458) - - - -Stock held in Trust - - 35 - 4 (35) - - - - Purchase of treasury stock (2,367) - - - - - 2,367 (18,757) - (18,757)Issuance of treasury stock 386 - (2,037) - - - (386) 3,097 - 1,060 Cancellation of treasury stock - (12) (29,152) - - - (3,999) 29,164 - -
Balance at December 31, 2000 35,458 91 174,320 8,626 2,015 (17,193) 27 (225) (9,872) 155,747 Comprehensive income (loss) - - - 19,703 - - - - (3,196) 16,507 Dividends to common shareholders - - - (5,227) - - - - - (5,227)Long-Term Incentive Plan amortization - - 1,125 - - - - - - 1,125 Issuance of common stock for acquisition 11,412 24 89,953 - - - - - - 89,977 Conversion of common stock to Euro - 106 (106) - - - - - - - Issuance of treasury stock to Trust 94 - 508 - 94 (1,310) (94) 802 - - Release of Trust shares - - (4,202) - (508) 4,202 - - - - Purchase of treasury stock (5,372) - - - - - 5,372 (49,103) - (49,103)Issuance of treasury stock 368 - (50) - - - (368) 3,247 - 3,197 Cancellation of treasury stock - (11) (19,989) - - - (2,332) 20,000 - -
Balance at December 31, 2001 41,960 210 241,559 23,102 1,601 (14,301) 2,605 (25,279) (13,068) 212,223 Comprehensive income (loss) - - - 50,149 - - - - (3,807) 46,342 Dividends to common shareholders - - - (5,187) - - - - - (5,187)Long-Term Incentive Plan amortization - - 756 - - - - - - 756 Issuance of treasury stock to Trust 43 - 88 - 43 (641) (43) 553 - - Release of Trust shares - - (2,610) - (194) 2,610 - - - - Purchase of treasury stock (50) - - - - - 50 (668) - (668)Issuance of treasury stock 2,373 - 6,123 - - - (2,373) 22,558 - 28,681
Balance at December 31, 2002 44,326 $ 210 $ 245,916 $ 68,064 1,450 $ (12,332) 239 $ (2,836) $ (16,875) $ 282,147
The accompanying Notes to Consolidated Financial Statements are an integral part of these financial statements.
40
C B & I 2 0 0 2 A N N U A L R E P O R T
Brought to you by Global Reports
Chicago Bridge & Iron Company N.V. and SubsidiariesNOTES TO CONSOLIDATED FINANCIAL STATEMENTS
(In thousands, except share data)
1. Organization and Nature of Operations
Organization—Chicago Bridge & Iron Company N.V., a corporation organized under the laws of The Netherlands, andSubsidiaries, is a global specialty engineering, procurement and construction company serving customers in several primaryend markets, including hydrocarbon refining, natural gas, water and the energy sector in general. We have been helping cus-tomers store and process the earth’s natural resources for more than 100 years by supplying a comprehensive range ofengineered steel structures and systems. We offer a complete package of design, engineering, fabrication, procurement, con-struction and maintenance services including hydrocarbon processing plants, liquefied natural gas (LNG) terminals and peakshaving plants, bulk liquid terminals, water storage and treatment facilities, and other steel structures and their associatedsystems. We have been continuously engaged in the engineering and construction industry since our founding in 1889. Oursubsidiary Howe-Baker International, L.L.C., acquired in 2000, is a global technology company specializing in the engineeringand construction of hydrocarbon processing plants for customers in the refining, petrochemical and natural gas industries,which was organized and began operations in 1947.
Nature of operations—Projects for the worldwide petroleum and petrochemical industry accounted for a majority of our revenues in 2002, 2001 and 2000. Numerous factors influence capital expenditure decisions in this industry, which are beyondour control. Therefore, no assurance can be given that our business, financial condition and results of operations will not beadversely affected because of reduced activity due to the price of oil or changing taxes, price controls and laws and regula-tions related to the petroleum and petrochemical industry.
2. Significant Accounting Policies
Basis of Accounting and Consolidation—These financial statements are prepared in accordance with accounting principlesgenerally accepted in the United States of America. The consolidated financial statements include all majority owned sub-sidiaries. Significant intercompany balances and transactions are eliminated in consolidation. Investments in non-majorityowned affiliates are accounted for by the equity method. For the years ended 2002 and 2001 we did not have any non-majorityowned affiliates.
Use of Estimates—The preparation of financial statements in conformity with accounting principles generally accepted in the United States of America requires us to make estimates and assumptions that affect the reported amounts of assets andliabilities, the disclosed amounts of contingent assets and liabilities, and the reported amounts of revenues and expenses. Webelieve the most significant estimates and assumptions are associated with revenue recognition on engineering and construc-tion contracts, recoverability tests that must be periodically performed with respect to goodwill and intangible asset balances,valuation of accounts receivable, as well as the determination of liabilities related to self insurance programs . If the underly-ing estimates and assumptions upon which the financial statements are based change in the future, actual amounts maydiffer from those included in the accompanying consolidated financial statements.
Revenue Recognition—Revenues are recognized using the percentage-of-completion method. Contract revenues are accruedbased generally on the percentage that costs-to-date bear to total estimated costs. We follow the guidance of Statement ofPosition 81-1, “Accounting for Performance of Construction-Type and Certain Production-Type Contracts,” for accounting policy relating to our use of the percentage-of-completion method, estimating costs, revenue recognition and claim recogni-tion. The use of estimated cost to complete each contract, while the most widely recognized method used for percentage-of-completion accounting, is a significant variable in the process of determining income earned and is a significant factor inthe accounting for contracts. The cumulative impact of revisions in total cost estimates during the progress of work isreflected in the period in which these changes become known. Due to the various estimates inherent in our contract account-ing, actual results could differ from those estimates.
Contract revenue reflects the original contract price adjusted for agreed upon change orders and estimated minimum recoveries of claims. At December 31, 2002 and 2001, we had net outstanding claims recognized of $5,946 and$5,400, respectively. Losses expected to be incurred on contracts in progress are charged to income as soon as suchlosses are known.
A significant portion of our work is performed on a fixed price or lump sum basis. The balance of projects is primarilyperformed on variations of cost reimbursable and target price approaches. Progress billings in accounts receivable are cur-rently due and exclude retentions until such amounts are due in accordance with contract terms. Cost of revenues includesdirect contract costs such as material and construction labor, and indirect costs which are attributable to contract activity.
41
Brought to you by Global Reports
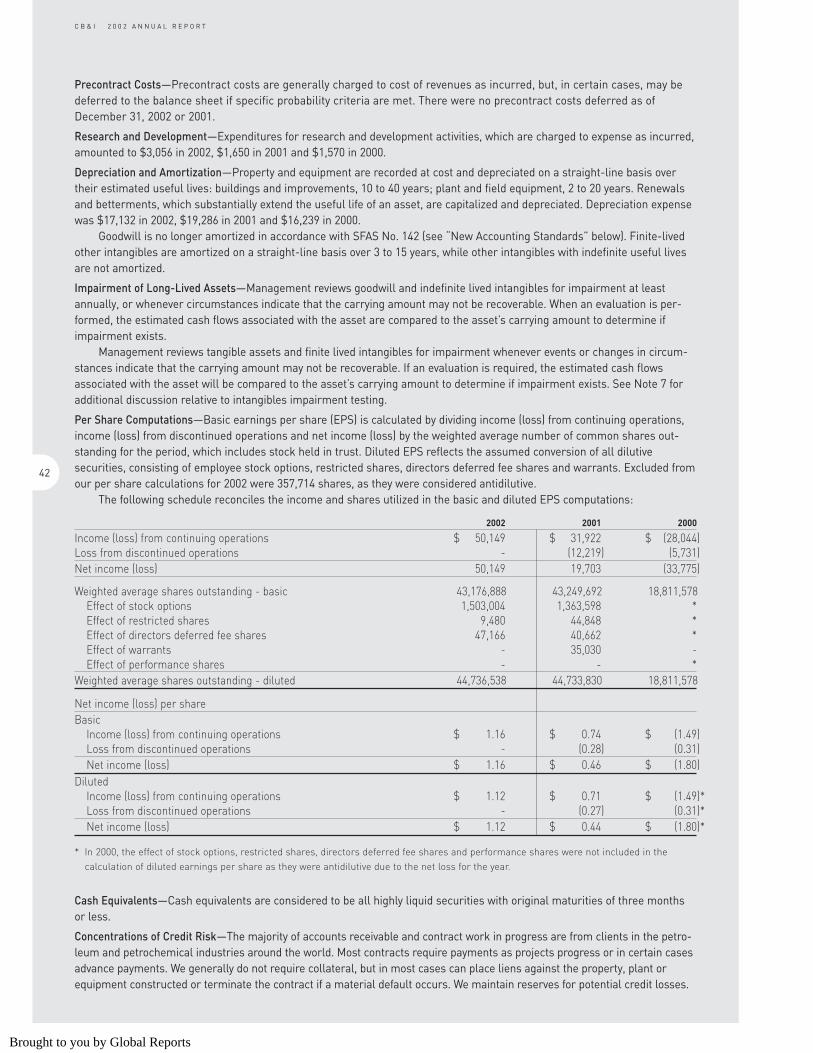
Precontract Costs—Precontract costs are generally charged to cost of revenues as incurred, but, in certain cases, may bedeferred to the balance sheet if specific probability criteria are met. There were no precontract costs deferred as ofDecember 31, 2002 or 2001.
Research and Development—Expenditures for research and development activities, which are charged to expense as incurred,amounted to $3,056 in 2002, $1,650 in 2001 and $1,570 in 2000.
Depreciation and Amortization—Property and equipment are recorded at cost and depreciated on a straight-line basis overtheir estimated useful lives: buildings and improvements, 10 to 40 years; plant and field equipment, 2 to 20 years. Renewalsand betterments, which substantially extend the useful life of an asset, are capitalized and depreciated. Depreciation expensewas $17,132 in 2002, $19,286 in 2001 and $16,239 in 2000.
Goodwill is no longer amortized in accordance with SFAS No. 142 (see “New Accounting Standards” below). Finite-livedother intangibles are amortized on a straight-line basis over 3 to 15 years, while other intangibles with indefinite useful livesare not amortized.
Impairment of Long-Lived Assets—Management reviews goodwill and indefinite lived intangibles for impairment at leastannually, or whenever circumstances indicate that the carrying amount may not be recoverable. When an evaluation is per-formed, the estimated cash flows associated with the asset are compared to the asset’s carrying amount to determine ifimpairment exists.
Management reviews tangible assets and finite lived intangibles for impairment whenever events or changes in circum-stances indicate that the carrying amount may not be recoverable. If an evaluation is required, the estimated cash flowsassociated with the asset will be compared to the asset’s carrying amount to determine if impairment exists. See Note 7 foradditional discussion relative to intangibles impairment testing.
Per Share Computations—Basic earnings per share (EPS) is calculated by dividing income (loss) from continuing operations,income (loss) from discontinued operations and net income (loss) by the weighted average number of common shares out-standing for the period, which includes stock held in trust. Diluted EPS reflects the assumed conversion of all dilutivesecurities, consisting of employee stock options, restricted shares, directors deferred fee shares and warrants. Excluded fromour per share calculations for 2002 were 357,714 shares, as they were considered antidilutive.
The following schedule reconciles the income and shares utilized in the basic and diluted EPS computations:
2002 2001 2000
Income (loss) from continuing operations $ 50,149 $ 31,922 $ (28,044)Loss from discontinued operations - (12,219) (5,731)Net income (loss) 50,149 19,703 (33,775)
Weighted average shares outstanding - basic 43,176,888 43,249,692 18,811,578 Effect of stock options 1,503,004 1,363,598 * Effect of restricted shares 9,480 44,848 * Effect of directors deferred fee shares 47,166 40,662 * Effect of warrants - 35,030 -Effect of performance shares - - *
Weighted average shares outstanding - diluted 44,736,538 44,733,830 18,811,578
Net income (loss) per shareBasic
Income (loss) from continuing operations $ 1.16 $ 0.74 $ (1.49)Loss from discontinued operations - (0.28) (0.31)Net income (loss) $ 1.16 $ 0.46 $ (1.80)
DilutedIncome (loss) from continuing operations $ 1.12 $ 0.71 $ (1.49)*Loss from discontinued operations - (0.27) (0.31)*Net income (loss) $ 1.12 $ 0.44 $ (1.80)*
* In 2000, the effect of stock options, restricted shares, directors deferred fee shares and performance shares were not included in the calculation of diluted earnings per share as they were antidilutive due to the net loss for the year.
Cash Equivalents—Cash equivalents are considered to be all highly liquid securities with original maturities of three monthsor less.
Concentrations of Credit Risk—The majority of accounts receivable and contract work in progress are from clients in the petro-leum and petrochemical industries around the world. Most contracts require payments as projects progress or in certain casesadvance payments. We generally do not require collateral, but in most cases can place liens against the property, plant orequipment constructed or terminate the contract if a material default occurs. We maintain reserves for potential credit losses.
42
C B & I 2 0 0 2 A N N U A L R E P O R T
Brought to you by Global Reports
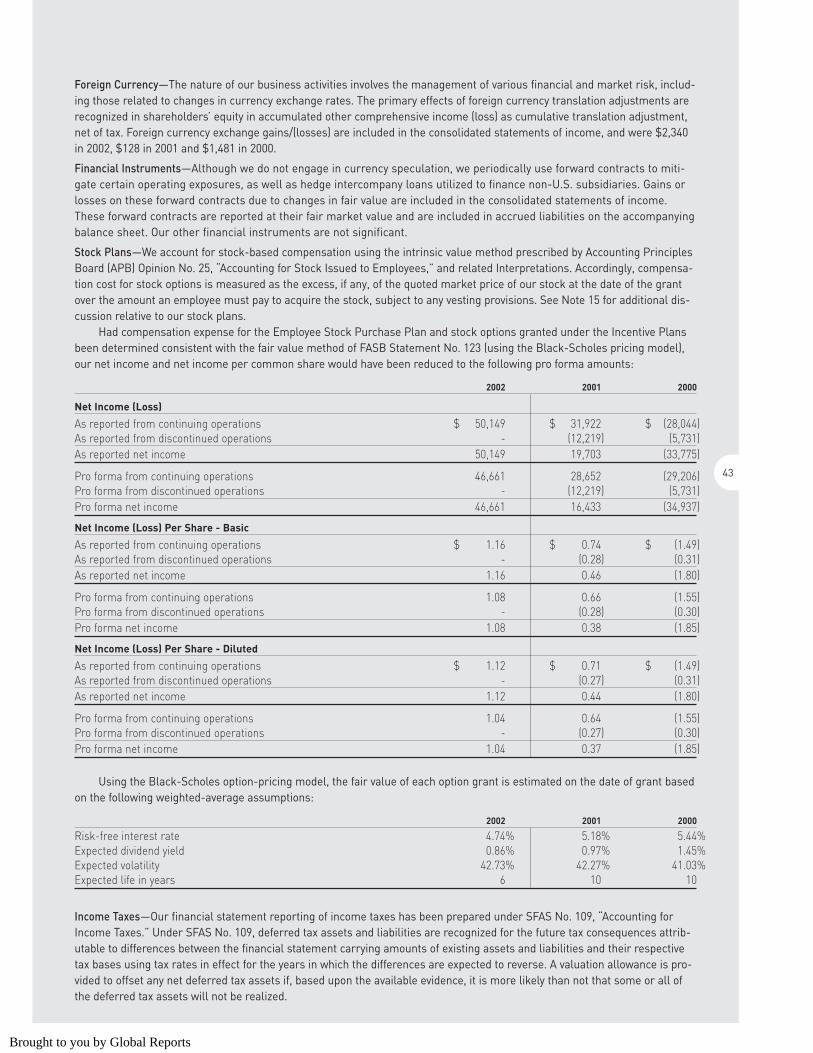
Foreign Currency—The nature of our business activities involves the management of various financial and market risk, includ-ing those related to changes in currency exchange rates. The primary effects of foreign currency translation adjustments arerecognized in shareholders’ equity in accumulated other comprehensive income (loss) as cumulative translation adjustment,net of tax. Foreign currency exchange gains/(losses) are included in the consolidated statements of income, and were $2,340in 2002, $128 in 2001 and $1,481 in 2000.
Financial Instruments—Although we do not engage in currency speculation, we periodically use forward contracts to miti-gate certain operating exposures, as well as hedge intercompany loans utilized to finance non-U.S. subsidiaries. Gains orlosses on these forward contracts due to changes in fair value are included in the consolidated statements of income.These forward contracts are reported at their fair market value and are included in accrued liabilities on the accompanyingbalance sheet. Our other financial instruments are not significant.
Stock Plans—We account for stock-based compensation using the intrinsic value method prescribed by Accounting PrinciplesBoard (APB) Opinion No. 25, “Accounting for Stock Issued to Employees,” and related Interpretations. Accordingly, compensa-tion cost for stock options is measured as the excess, if any, of the quoted market price of our stock at the date of the grantover the amount an employee must pay to acquire the stock, subject to any vesting provisions. See Note 15 for additional dis-cussion relative to our stock plans.
Had compensation expense for the Employee Stock Purchase Plan and stock options granted under the Incentive Plansbeen determined consistent with the fair value method of FASB Statement No. 123 (using the Black-Scholes pricing model),our net income and net income per common share would have been reduced to the following pro forma amounts:
2002 2001 2000
Net Income (Loss)
As reported from continuing operations $ 50,149 $ 31,922 $ (28,044)As reported from discontinued operations - (12,219) (5,731)As reported net income 50,149 19,703 (33,775)
Pro forma from continuing operations 46,661 28,652 (29,206)Pro forma from discontinued operations - (12,219) (5,731)Pro forma net income 46,661 16,433 (34,937)
Net Income (Loss) Per Share - Basic
As reported from continuing operations $ 1.16 $ 0.74 $ (1.49)As reported from discontinued operations - (0.28) (0.31)As reported net income 1.16 0.46 (1.80)
Pro forma from continuing operations 1.08 0.66 (1.55)Pro forma from discontinued operations - (0.28) (0.30)Pro forma net income 1.08 0.38 (1.85)
Net Income (Loss) Per Share - Diluted
As reported from continuing operations $ 1.12 $ 0.71 $ (1.49)As reported from discontinued operations - (0.27) (0.31)As reported net income 1.12 0.44 (1.80)
Pro forma from continuing operations 1.04 0.64 (1.55)Pro forma from discontinued operations - (0.27) (0.30)Pro forma net income 1.04 0.37 (1.85)
Using the Black-Scholes option-pricing model, the fair value of each option grant is estimated on the date of grant basedon the following weighted-average assumptions:
2002 2001 2000
Risk-free interest rate 4.74% 5.18% 5.44%Expected dividend yield 0.86% 0.97% 1.45%Expected volatility 42.73% 42.27% 41.03%Expected life in years 6 10 10
Income Taxes—Our financial statement reporting of income taxes has been prepared under SFAS No. 109, “Accounting forIncome Taxes.” Under SFAS No. 109, deferred tax assets and liabilities are recognized for the future tax consequences attrib-utable to differences between the financial statement carrying amounts of existing assets and liabilities and their respectivetax bases using tax rates in effect for the years in which the differences are expected to reverse. A valuation allowance is pro-vided to offset any net deferred tax assets if, based upon the available evidence, it is more likely than not that some or all ofthe deferred tax assets will not be realized.
43
Brought to you by Global Reports
Reclassification of Prior Year Balances—Certain prior year balances have been reclassified to conform with the current year presentation.
New Accounting Standards—In June 2001, the Financial Accounting Standards Board (“FASB”) issued Statements of FinancialAccounting Standard (“SFAS”) No. 141 “Business Combinations” (“SFAS No. 141”) and SFAS No. 142 “Goodwill and OtherIntangible Assets” (“SFAS No. 142”). These pronouncements changed the accounting for business combinations, goodwill andintangible assets. SFAS No. 141 eliminates the pooling-of-interests method of accounting for business combinations and fur-ther clarifies the criteria to recognize intangible assets separately from goodwill. The requirements of SFAS No. 141 wereeffective for any business combination accounted for by the purchase method that was completed after June 30, 2001. SFASNo. 142 states goodwill and indefinite-lived intangible assets are no longer amortized to earnings, but instead are reviewedfor impairment at least annually. The amortization of existing goodwill and indefinite-lived intangible assets at June 30, 2001has ceased at January 1, 2002. Goodwill on acquisitions completed subsequent to June 30, 2001, is not amortized. Our adop-tion of SFAS No. 142 resulted in no goodwill and indefinite-lived intangibles amortization in 2002 compared with $4,196 in2001 and $587 in 2000. In connection with the adoption of these statements during the first quarter of 2002, we completed our goodwill impairment assessment and concluded that no transitional impairment charge was necessary. Also, as ofSeptember 30, 2002, we completed our annual impairment assessment and concluded that no impairment charge was necessary. See Note 7 for additional discussion relative to our annual impairment assessment.
In August 2001, the FASB issued SFAS No. 143, “Accounting for Asset Retirement Obligations” which addresses thefinancial accounting and reporting for obligations associated with the retirement of tangible long-lived assets and the associated assets’ retirement costs. The new standard was effective January 1, 2003, and is not anticipated to have a signifi-cant impact on our financial condition or results of operations.
In August 2001, the FASB issued SFAS No. 144, “Accounting for the Impairment or Disposal of Long-Lived Assets”. Thisstatement addresses financial accounting and reporting for the impairment and/or disposal of long-lived assets. We adoptedthis statement effective January 1, 2002, and determined that it did not have a significant impact on our financial statementsas of that date.
In April 2002, the FASB issued SFAS No. 145, “Rescission of SFAS Statements No. 4, 44, and 64, Amendment of SFAS No.13, and Technical Corrections.” The purpose of this statement is to update, clarify and simplify existing accounting standards.We adopted this statement effective April 1, 2002, and determined that it did not have a significant impact on our financialstatements.
In July 2002, the FASB issued SFAS No. 146, “Accounting for Costs Associated with Exit or Disposal Activities.” This standard requires companies to recognize costs associated with exit or disposal activities when they are incurred rather thanat the date of a commitment to exit or disposal plan. Examples of costs covered by the standard include lease terminationcosts and certain employee severance costs that are associated with a restructuring, discontinued operation, plant closing, or other exit or disposal activity. Previous accounting guidance was provided by EITF Issue No. 94-3, “Liability Recognition for Certain Employee Termination Benefits and Other Costs to Exit an Activity (including Certain Costs Incurred in aRestructuring).” SFAS No. 146 replaces Issue 94-3. SFAS No. 146 is to be applied prospectively to exit or disposal activities initiated after December 31, 2002. This statement is effective for our fiscal year beginning January 1, 2003.
In December 2002, the FASB issued SFAS No. 148, “Accounting for Stock-Based Compensation – Transition andDisclosure”, which amends SFAS No. 123, “Accounting for Stock-Based Compensation.” This standard permits two additionaltransition methods for entities that adopt the fair-value-based method of accounting for stock-based employee compensationand amends the disclosure requirements in both annual and interim financial statements. We will continue to applyAccounting Principles Board (APB) Opinion No. 25, “Accounting for Stock Issued to Employees,” and related interpretations inaccounting for stock options. The amended disclosure requirements of SFAS No. 148 have been incorporated into Note 15 tothe Consolidated Financial Statements.
In November 2002, the FASB issued Interpretation No. 45, “Guarantor’s Accounting and Disclosure Requirements forGuarantees, Including Indirect Guarantees of Indebtedness of Others”. This interpretation of SFAS No. 5, 57, and 107, andrescission of FASB Interpretation No. 34 elaborates on the disclosures to be made by a guarantor in its interim and annualfinancial statements about its obligations under certain guarantees that it has issued. It also clarifies that a guarantor isrequired to recognize, at the inception of a guarantee, a liability for the fair value of the obligation undertaken in issuing theguarantee. The initial recognition and measurement provisions of this interpretation are applicable on a prospective basis toguarantees issued or modified after December 31, 2002. The disclosure requirements in this interpretation are applicable for financial statements of interim or annual periods ending after December 15, 2002. See Note 13 for the disclosure of guar-antor relationships.
44
C B & I 2 0 0 2 A N N U A L R E P O R T
Brought to you by Global Reports
3. Acquisitions
2002
On February 5, 2002, we purchased the assets and assumed certain liabilities of TPA, Inc. for $4,658. The acquired business isa full-service engineering/procurement/construction company specializing in sulfur removal and recovery technologies for therefining, gas processing and chemical manufacturing industries.
The purchase price was allocated to the net assets acquired based upon their estimated fair market values at the date ofacquisition and the balance of approximately $3,360 and $1,200 was recorded as goodwill and other intangibles, respectively.Financial information has not been disclosed separately as the amounts were not material to our overall financial condition orresults of operations.
The balances included in the Consolidated Balance Sheets related to acquisitions completed in the last year are basedupon preliminary information and are subject to change when additional information concerning final asset and liability valua-tions is obtained. Material changes to the preliminary allocations are not anticipated.
Also during 2002, we increased our purchase consideration by $7,596 related to contingent earnout obligations associ-ated with the Howe-Baker acquisition and $5,334 for final purchase price adjustments related to the PDM Divisionsacquisition discussed below (see also Note 7).
2001
On November 30, 2001, we purchased Morse Construction Group, Inc. (“Morse”) for approximately $3,000. The purchase pricewas allocated to the net assets acquired based upon their estimated fair market values at the date of acquisition and the bal-ance of approximately $1,366 was recorded as goodwill. Morse designs, fabricates and erects steel structures, includingstorage tanks. This acquisition enables us to continue to grow our U.S. water and industrial tank business and provides uswith access to a geographic area where we expect to establish a stronger presence. Financial information has not been dis-closed separately as the amounts were not material to our overall financial condition or results of operations.
On February 7, 2001, we purchased substantially all of the assets (the “Assets”) of the Pitt-Des Moines, Inc. (“PDM”)Divisions. The Divisions have been integrated with our current business units and the assets continue to be used in the samelines of business. Our integrated groups adopted the names previously used by the Divisions. The Engineered ConstructionDivision, headquartered in Houston, engineers, fabricates and constructs storage tanks and systems, process systems, andunique plate structures for the petroleum, petrochemical, cryogenic, liquid natural gas, defense and aerospace industries.The Water Division, headquartered in Pittsburgh, designs, fabricates and constructs water storage tanks including conven-tional styles such as ground storage reservoirs and standpipes, steel elevated tanks and composite elevated tanks as well asunique projects involving one-of-a-kind tanks designed for specific applications.
Under the terms of the transaction, which was negotiated based on our stock prices prevailing during the 45 days beforeclosing, we provided consideration of 5,696,344 shares of our stock (including 565,150 collar shares for price protection, ifrequired) and $40,000 in cash. PDM was obligated to remit to us net proceeds from the disposition of these shares in excessof $44,000. The source of funds for the cash portion of the purchase price was a private placement of 1,675,384 shares of ourstock to Farinvest, Ltd., an affiliate of WEDGE Group Incorporated (“WEDGE”), (for a price of $13,600) and 3,247,692 shares ofour stock plus a warrant to purchase 503,196 shares of our stock at an exercise price of Guilders (“NLG”) .01 per share toFirst Reserve Fund VIII, L.P. (“First Reserve”) (for a total price of $26,400), plus a warrant for 500,000 shares of our stock, sub-ject to decrease depending on the number of shares repurchased from PDM by us prior to June 30, 2001. Shareholderagreements with PDM, WEDGE and First Reserve included standstill provisions, registration rights and restrictions withrespect to voting rights. First Reserve exercised the warrant to purchase 503,196 shares on February 22, 2001. On March 15,2001, we called 1,049,562 shares from PDM priced at $9,000 and a return of the 565,150 collar shares issued for price protec-tion. We sold these 1,614,712 shares at $8.88 (less expenses), based on an agreement entered into on February 23, 2001, to anunaffiliated group of investors for a total price of $14,300. Under a shareholder agreement with PDM entered into concur-rently with the acquisition of the PDM Divisions, PDM had the right to require us to repurchase the remaining 4,081,632shares at $8.58 per share, for a total price of $35,000. We had certain rights to call these shares prior to June 28, 2001. Werepurchased these shares from PDM in June 2001 for $35,000. We funded the purchase in part from the proceeds of the saleand leaseback of our administrative office. This acquisition was accounted for under the purchase method of accounting. Thepurchase price has been allocated to assets acquired and liabilities assumed based on estimated fair values at the date ofacquisition and the balance of approximately $48,345 was recorded as goodwill and $387 as other intangibles. Goodwill wasamortized on a straight-line basis over 40 years through December 31, 2001. The PDM Divisions are included in our results ofoperations effective February 1, 2001. The pro forma results for the year ended December 31, 2001, assuming the acquisitionhad been made at the beginning of the year, would not be materially different from reported results.
45
Brought to you by Global Reports
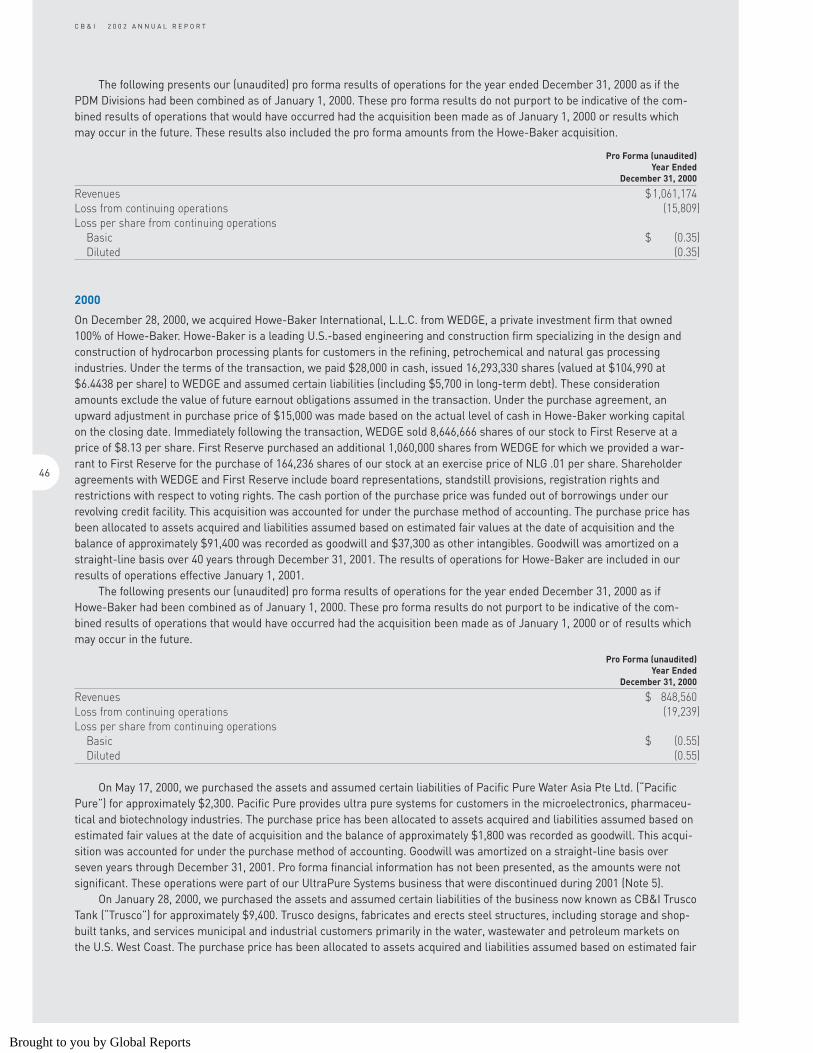
The following presents our (unaudited) pro forma results of operations for the year ended December 31, 2000 as if thePDM Divisions had been combined as of January 1, 2000. These pro forma results do not purport to be indicative of the com-bined results of operations that would have occurred had the acquisition been made as of January 1, 2000 or results whichmay occur in the future. These results also included the pro forma amounts from the Howe-Baker acquisition.
Pro Forma (unaudited)Year Ended
December 31, 2000
Revenues $1,061,174 Loss from continuing operations (15,809)Loss per share from continuing operations
Basic $ (0.35)Diluted (0.35)
2000
On December 28, 2000, we acquired Howe-Baker International, L.L.C. from WEDGE, a private investment firm that owned100% of Howe-Baker. Howe-Baker is a leading U.S.-based engineering and construction firm specializing in the design andconstruction of hydrocarbon processing plants for customers in the refining, petrochemical and natural gas processing industries. Under the terms of the transaction, we paid $28,000 in cash, issued 16,293,330 shares (valued at $104,990 at$6.4438 per share) to WEDGE and assumed certain liabilities (including $5,700 in long-term debt). These considerationamounts exclude the value of future earnout obligations assumed in the transaction. Under the purchase agreement, anupward adjustment in purchase price of $15,000 was made based on the actual level of cash in Howe-Baker working capitalon the closing date. Immediately following the transaction, WEDGE sold 8,646,666 shares of our stock to First Reserve at aprice of $8.13 per share. First Reserve purchased an additional 1,060,000 shares from WEDGE for which we provided a war-rant to First Reserve for the purchase of 164,236 shares of our stock at an exercise price of NLG .01 per share. Shareholderagreements with WEDGE and First Reserve include board representations, standstill provisions, registration rights andrestrictions with respect to voting rights. The cash portion of the purchase price was funded out of borrowings under ourrevolving credit facility. This acquisition was accounted for under the purchase method of accounting. The purchase price hasbeen allocated to assets acquired and liabilities assumed based on estimated fair values at the date of acquisition and thebalance of approximately $91,400 was recorded as goodwill and $37,300 as other intangibles. Goodwill was amortized on astraight-line basis over 40 years through December 31, 2001. The results of operations for Howe-Baker are included in ourresults of operations effective January 1, 2001.
The following presents our (unaudited) pro forma results of operations for the year ended December 31, 2000 as if Howe-Baker had been combined as of January 1, 2000. These pro forma results do not purport to be indicative of the com-bined results of operations that would have occurred had the acquisition been made as of January 1, 2000 or of results whichmay occur in the future.
Pro Forma (unaudited)Year Ended
December 31, 2000
Revenues $ 848,560 Loss from continuing operations (19,239)Loss per share from continuing operations
Basic $ (0.55)Diluted (0.55)
On May 17, 2000, we purchased the assets and assumed certain liabilities of Pacific Pure Water Asia Pte Ltd. (“PacificPure”) for approximately $2,300. Pacific Pure provides ultra pure systems for customers in the microelectronics, pharmaceu-tical and biotechnology industries. The purchase price has been allocated to assets acquired and liabilities assumed based onestimated fair values at the date of acquisition and the balance of approximately $1,800 was recorded as goodwill. This acqui-sition was accounted for under the purchase method of accounting. Goodwill was amortized on a straight-line basis overseven years through December 31, 2001. Pro forma financial information has not been presented, as the amounts were notsignificant. These operations were part of our UltraPure Systems business that were discontinued during 2001 (Note 5).
On January 28, 2000, we purchased the assets and assumed certain liabilities of the business now known as CB&I TruscoTank (“Trusco”) for approximately $9,400. Trusco designs, fabricates and erects steel structures, including storage and shop-built tanks, and services municipal and industrial customers primarily in the water, wastewater and petroleum markets onthe U.S. West Coast. The purchase price has been allocated to assets acquired and liabilities assumed based on estimated fair
46
C B & I 2 0 0 2 A N N U A L R E P O R T
Brought to you by Global Reports
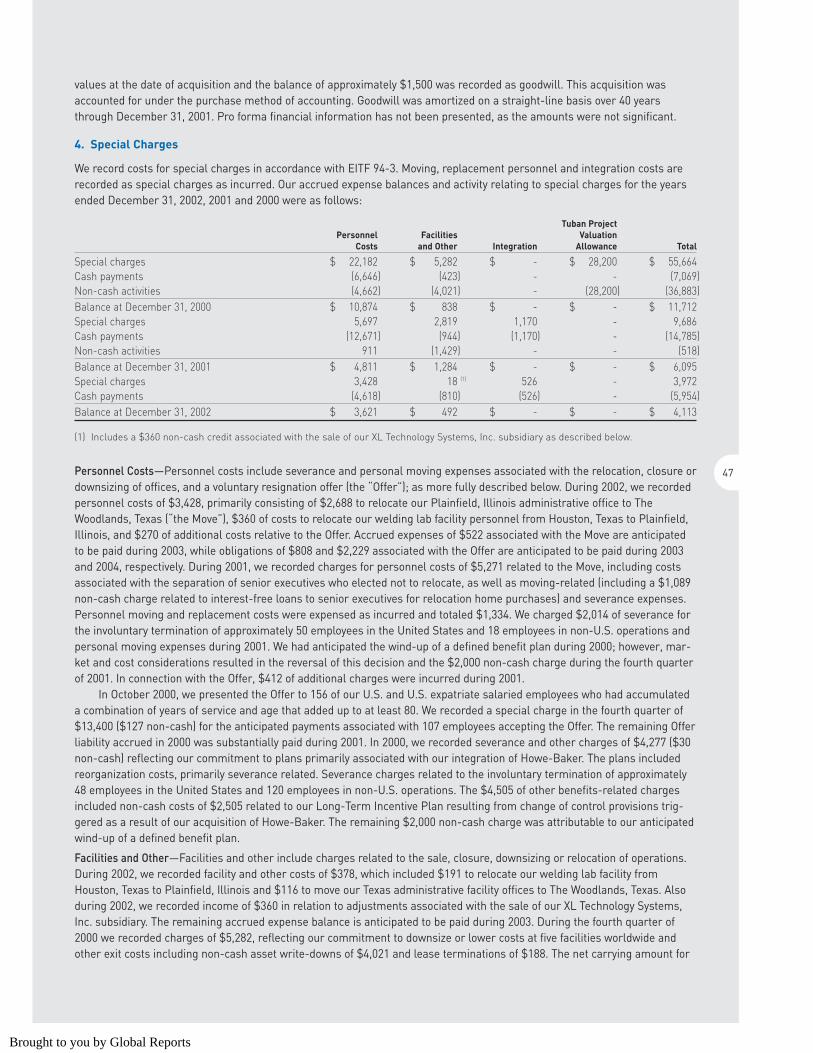
values at the date of acquisition and the balance of approximately $1,500 was recorded as goodwill. This acquisition wasaccounted for under the purchase method of accounting. Goodwill was amortized on a straight-line basis over 40 yearsthrough December 31, 2001. Pro forma financial information has not been presented, as the amounts were not significant.
4. Special Charges
We record costs for special charges in accordance with EITF 94-3. Moving, replacement personnel and integration costs arerecorded as special charges as incurred. Our accrued expense balances and activity relating to special charges for the yearsended December 31, 2002, 2001 and 2000 were as follows:
Tuban ProjectPersonnel Facilities Valuation
Costs and Other Integration Allowance Total
Special charges $ 22,182 $ 5,282 $ - $ 28,200 $ 55,664 Cash payments (6,646) (423) - - (7,069)Non-cash activities (4,662) (4,021) - (28,200) (36,883)Balance at December 31, 2000 $ 10,874 $ 838 $ - $ - $ 11,712 Special charges 5,697 2,819 1,170 - 9,686 Cash payments (12,671) (944) (1,170) - (14,785)Non-cash activities 911 (1,429) - - (518)Balance at December 31, 2001 $ 4,811 $ 1,284 $ - $ - $ 6,095 Special charges 3,428 18)(1) 526 - 3,972 Cash payments (4,618) (810) (526) - (5,954)Balance at December 31, 2002 $ 3,621 $ 492 $ - $ - $ 4,113
(1) Includes a $360 non-cash credit associated with the sale of our XL Technology Systems, Inc. subsidiary as described below.
Personnel Costs—Personnel costs include severance and personal moving expenses associated with the relocation, closure ordownsizing of offices, and a voluntary resignation offer (the “Offer”); as more fully described below. During 2002, we recordedpersonnel costs of $3,428, primarily consisting of $2,688 to relocate our Plainfield, Illinois administrative office to TheWoodlands, Texas (“the Move”), $360 of costs to relocate our welding lab facility personnel from Houston, Texas to Plainfield,Illinois, and $270 of additional costs relative to the Offer. Accrued expenses of $522 associated with the Move are anticipatedto be paid during 2003, while obligations of $808 and $2,229 associated with the Offer are anticipated to be paid during 2003and 2004, respectively. During 2001, we recorded charges for personnel costs of $5,271 related to the Move, including costsassociated with the separation of senior executives who elected not to relocate, as well as moving-related (including a $1,089non-cash charge related to interest-free loans to senior executives for relocation home purchases) and severance expenses.Personnel moving and replacement costs were expensed as incurred and totaled $1,334. We charged $2,014 of severance forthe involuntary termination of approximately 50 employees in the United States and 18 employees in non-U.S. operations andpersonal moving expenses during 2001. We had anticipated the wind-up of a defined benefit plan during 2000; however, mar-ket and cost considerations resulted in the reversal of this decision and the $2,000 non-cash charge during the fourth quarterof 2001. In connection with the Offer, $412 of additional charges were incurred during 2001.
In October 2000, we presented the Offer to 156 of our U.S. and U.S. expatriate salaried employees who had accumulateda combination of years of service and age that added up to at least 80. We recorded a special charge in the fourth quarter of$13,400 ($127 non-cash) for the anticipated payments associated with 107 employees accepting the Offer. The remaining Offerliability accrued in 2000 was substantially paid during 2001. In 2000, we recorded severance and other charges of $4,277 ($30non-cash) reflecting our commitment to plans primarily associated with our integration of Howe-Baker. The plans includedreorganization costs, primarily severance related. Severance charges related to the involuntary termination of approximately48 employees in the United States and 120 employees in non-U.S. operations. The $4,505 of other benefits-related chargesincluded non-cash costs of $2,505 related to our Long-Term Incentive Plan resulting from change of control provisions trig-gered as a result of our acquisition of Howe-Baker. The remaining $2,000 non-cash charge was attributable to our anticipatedwind-up of a defined benefit plan.
Facilities and Other—Facilities and other include charges related to the sale, closure, downsizing or relocation of operations.During 2002, we recorded facility and other costs of $378, which included $191 to relocate our welding lab facility fromHouston, Texas to Plainfield, Illinois and $116 to move our Texas administrative facility offices to The Woodlands, Texas. Alsoduring 2002, we recorded income of $360 in relation to adjustments associated with the sale of our XL Technology Systems,Inc. subsidiary. The remaining accrued expense balance is anticipated to be paid during 2003. During the fourth quarter of2000 we recorded charges of $5,282, reflecting our commitment to downsize or lower costs at five facilities worldwide andother exit costs including non-cash asset write-downs of $4,021 and lease terminations of $188. The net carrying amount for
47
Brought to you by Global Reports
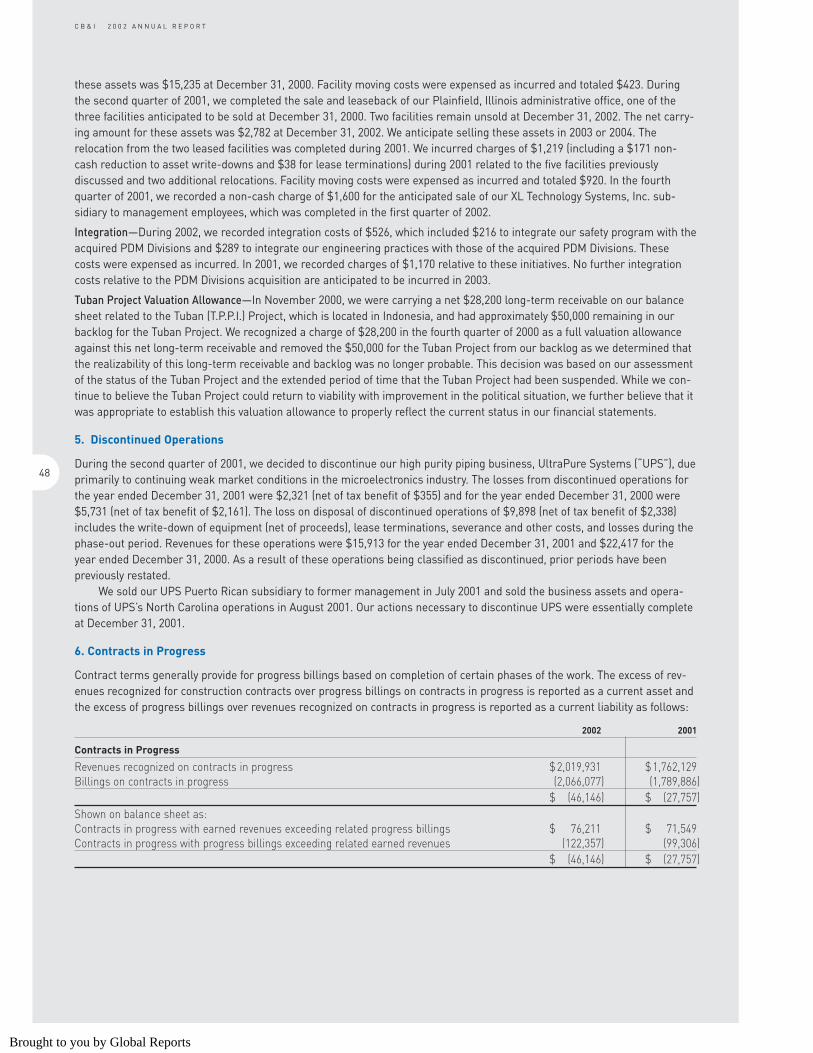
these assets was $15,235 at December 31, 2000. Facility moving costs were expensed as incurred and totaled $423. Duringthe second quarter of 2001, we completed the sale and leaseback of our Plainfield, Illinois administrative office, one of thethree facilities anticipated to be sold at December 31, 2000. Two facilities remain unsold at December 31, 2002. The net carry-ing amount for these assets was $2,782 at December 31, 2002. We anticipate selling these assets in 2003 or 2004. Therelocation from the two leased facilities was completed during 2001. We incurred charges of $1,219 (including a $171 non-cash reduction to asset write-downs and $38 for lease terminations) during 2001 related to the five facilities previouslydiscussed and two additional relocations. Facility moving costs were expensed as incurred and totaled $920. In the fourthquarter of 2001, we recorded a non-cash charge of $1,600 for the anticipated sale of our XL Technology Systems, Inc. sub-sidiary to management employees, which was completed in the first quarter of 2002.
Integration—During 2002, we recorded integration costs of $526, which included $216 to integrate our safety program with theacquired PDM Divisions and $289 to integrate our engineering practices with those of the acquired PDM Divisions. Thesecosts were expensed as incurred. In 2001, we recorded charges of $1,170 relative to these initiatives. No further integrationcosts relative to the PDM Divisions acquisition are anticipated to be incurred in 2003.
Tuban Project Valuation Allowance—In November 2000, we were carrying a net $28,200 long-term receivable on our balancesheet related to the Tuban (T.P.P.I.) Project, which is located in Indonesia, and had approximately $50,000 remaining in ourbacklog for the Tuban Project. We recognized a charge of $28,200 in the fourth quarter of 2000 as a full valuation allowanceagainst this net long-term receivable and removed the $50,000 for the Tuban Project from our backlog as we determined thatthe realizability of this long-term receivable and backlog was no longer probable. This decision was based on our assessmentof the status of the Tuban Project and the extended period of time that the Tuban Project had been suspended. While we con-tinue to believe the Tuban Project could return to viability with improvement in the political situation, we further believe that itwas appropriate to establish this valuation allowance to properly reflect the current status in our financial statements.
5. Discontinued Operations
During the second quarter of 2001, we decided to discontinue our high purity piping business, UltraPure Systems (“UPS”), dueprimarily to continuing weak market conditions in the microelectronics industry. The losses from discontinued operations forthe year ended December 31, 2001 were $2,321 (net of tax benefit of $355) and for the year ended December 31, 2000 were$5,731 (net of tax benefit of $2,161). The loss on disposal of discontinued operations of $9,898 (net of tax benefit of $2,338)includes the write-down of equipment (net of proceeds), lease terminations, severance and other costs, and losses during thephase-out period. Revenues for these operations were $15,913 for the year ended December 31, 2001 and $22,417 for theyear ended December 31, 2000. As a result of these operations being classified as discontinued, prior periods have been previously restated.
We sold our UPS Puerto Rican subsidiary to former management in July 2001 and sold the business assets and opera-tions of UPS’s North Carolina operations in August 2001. Our actions necessary to discontinue UPS were essentially completeat December 31, 2001.
6. Contracts in Progress
Contract terms generally provide for progress billings based on completion of certain phases of the work. The excess of rev-enues recognized for construction contracts over progress billings on contracts in progress is reported as a current asset andthe excess of progress billings over revenues recognized on contracts in progress is reported as a current liability as follows:
2002 2001
Contracts in Progress
Revenues recognized on contracts in progress $2,019,931 $1,762,129 Billings on contracts in progress (2,066,077) (1,789,886)
$ (46,146) $ (27,757)Shown on balance sheet as:Contracts in progress with earned revenues exceeding related progress billings $ 76,211 $ 71,549 Contracts in progress with progress billings exceeding related earned revenues (122,357) (99,306)
$ (46,146) $ (27,757)
48
C B & I 2 0 0 2 A N N U A L R E P O R T
Brought to you by Global Reports
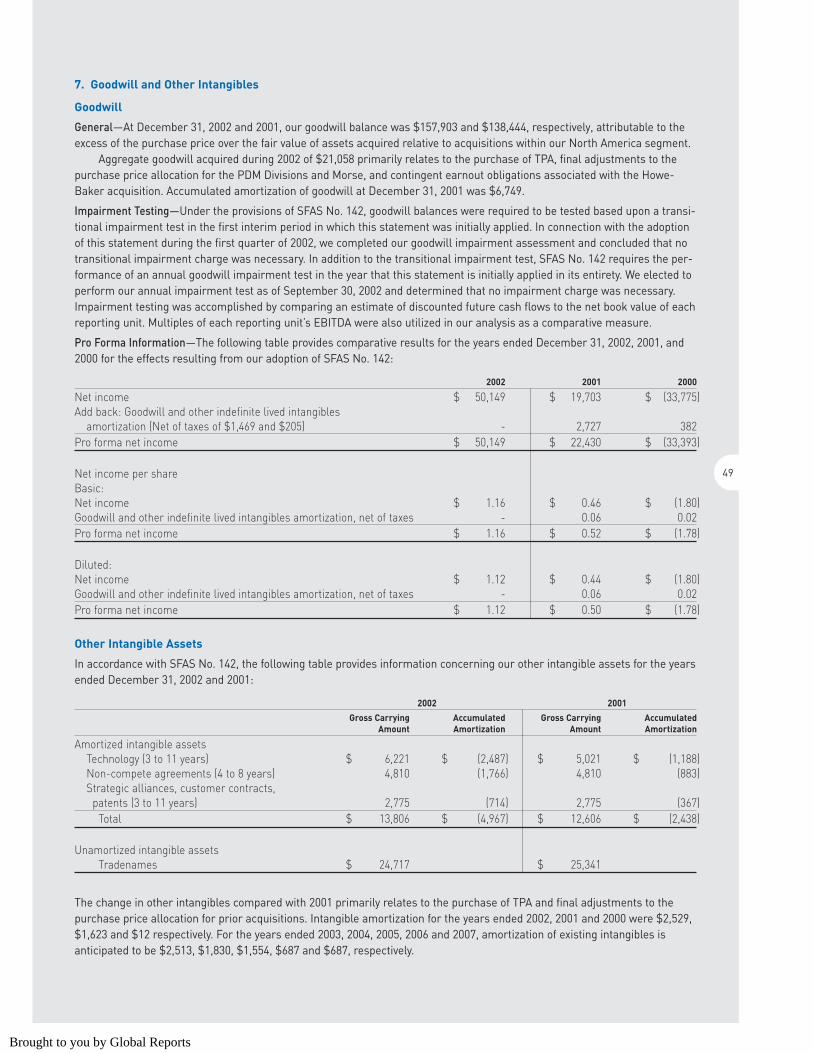
7. Goodwill and Other Intangibles
Goodwill
General—At December 31, 2002 and 2001, our goodwill balance was $157,903 and $138,444, respectively, attributable to theexcess of the purchase price over the fair value of assets acquired relative to acquisitions within our North America segment.
Aggregate goodwill acquired during 2002 of $21,058 primarily relates to the purchase of TPA, final adjustments to thepurchase price allocation for the PDM Divisions and Morse, and contingent earnout obligations associated with the Howe-Baker acquisition. Accumulated amortization of goodwill at December 31, 2001 was $6,749.
Impairment Testing—Under the provisions of SFAS No. 142, goodwill balances were required to be tested based upon a transi-tional impairment test in the first interim period in which this statement was initially applied. In connection with the adoptionof this statement during the first quarter of 2002, we completed our goodwill impairment assessment and concluded that notransitional impairment charge was necessary. In addition to the transitional impairment test, SFAS No. 142 requires the per-formance of an annual goodwill impairment test in the year that this statement is initially applied in its entirety. We elected toperform our annual impairment test as of September 30, 2002 and determined that no impairment charge was necessary.Impairment testing was accomplished by comparing an estimate of discounted future cash flows to the net book value of eachreporting unit. Multiples of each reporting unit’s EBITDA were also utilized in our analysis as a comparative measure.
Pro Forma Information—The following table provides comparative results for the years ended December 31, 2002, 2001, and2000 for the effects resulting from our adoption of SFAS No. 142:
2002 2001 2000
Net income $ 50,149 $ 19,703 $ (33,775)Add back: Goodwill and other indefinite lived intangibles
amortization (Net of taxes of $1,469 and $205) - 2,727 382 Pro forma net income $ 50,149 $ 22,430 $ (33,393)
Net income per shareBasic:Net income $ 1.16 $ 0.46 $ (1.80)Goodwill and other indefinite lived intangibles amortization, net of taxes - 0.06 0.02 Pro forma net income $ 1.16 $ 0.52 $ (1.78)
Diluted:Net income $ 1.12 $ 0.44 $ (1.80)Goodwill and other indefinite lived intangibles amortization, net of taxes - 0.06 0.02 Pro forma net income $ 1.12 $ 0.50 $ (1.78)
Other Intangible Assets
In accordance with SFAS No. 142, the following table provides information concerning our other intangible assets for the yearsended December 31, 2002 and 2001:
2002 2001
Gross Carrying Accumulated Gross Carrying AccumulatedAmount Amortization Amount Amortization
Amortized intangible assetsTechnology (3 to 11 years) $ 6,221 $ (2,487) $ 5,021 $ (1,188)Non-compete agreements (4 to 8 years) 4,810 (1,766) 4,810 (883)Strategic alliances, customer contracts,
patents (3 to 11 years) 2,775 (714) 2,775 (367)Total $ 13,806 $ (4,967) $ 12,606 $ (2,438)
Unamortized intangible assetsTradenames $ 24,717 $ 25,341
The change in other intangibles compared with 2001 primarily relates to the purchase of TPA and final adjustments to thepurchase price allocation for prior acquisitions. Intangible amortization for the years ended 2002, 2001 and 2000 were $2,529,$1,623 and $12 respectively. For the years ended 2003, 2004, 2005, 2006 and 2007, amortization of existing intangibles isanticipated to be $2,513, $1,830, $1,554, $687 and $687, respectively.
49
Brought to you by Global Reports
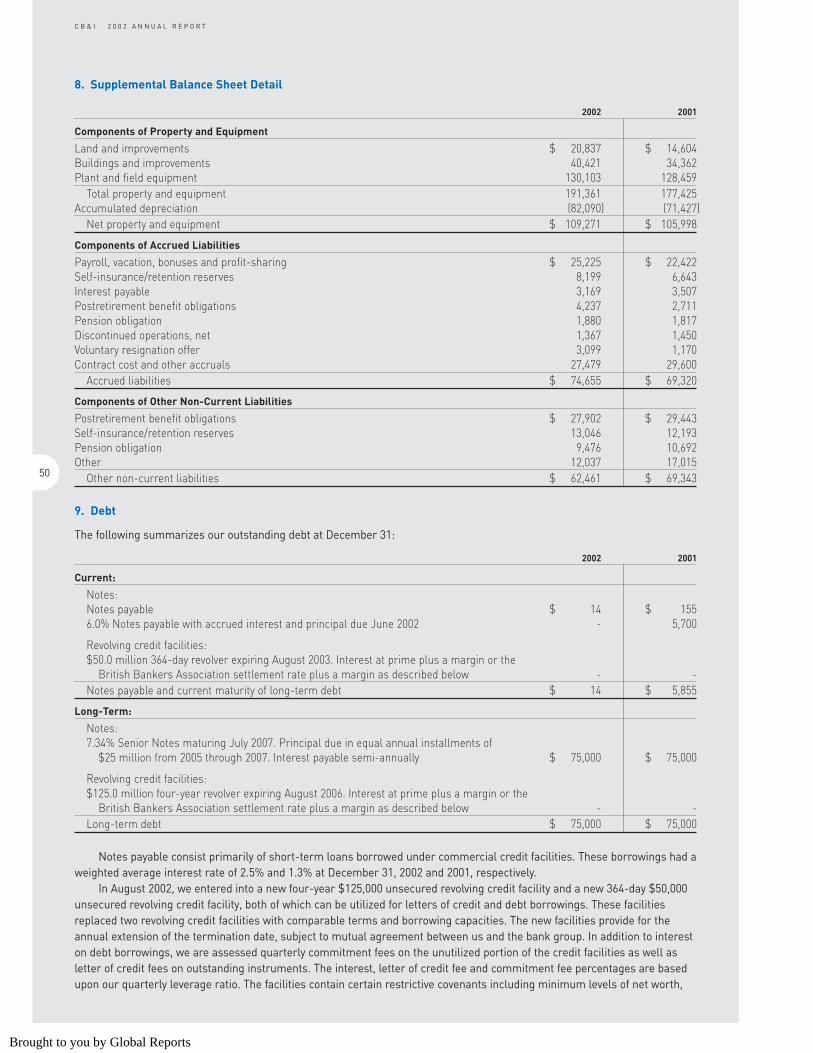
8. Supplemental Balance Sheet Detail
2002 2001
Components of Property and Equipment
Land and improvements $ 20,837 $ 14,604 Buildings and improvements 40,421 34,362 Plant and field equipment 130,103 128,459
Total property and equipment 191,361 177,425 Accumulated depreciation (82,090) (71,427)
Net property and equipment $ 109,271 $ 105,998
Components of Accrued Liabilities
Payroll, vacation, bonuses and profit-sharing $ 25,225 $ 22,422 Self-insurance/retention reserves 8,199 6,643 Interest payable 3,169 3,507 Postretirement benefit obligations 4,237 2,711 Pension obligation 1,880 1,817 Discontinued operations, net 1,367 1,450 Voluntary resignation offer 3,099 1,170 Contract cost and other accruals 27,479 29,600
Accrued liabilities $ 74,655 $ 69,320
Components of Other Non-Current Liabilities
Postretirement benefit obligations $ 27,902 $ 29,443 Self-insurance/retention reserves 13,046 12,193 Pension obligation 9,476 10,692 Other 12,037 17,015
Other non-current liabilities $ 62,461 $ 69,343
9. Debt
The following summarizes our outstanding debt at December 31:
2002 2001
Current:
Notes:Notes payable $ 14 $ 155 6.0% Notes payable with accrued interest and principal due June 2002 - 5,700
Revolving credit facilities:$50.0 million 364-day revolver expiring August 2003. Interest at prime plus a margin or the
British Bankers Association settlement rate plus a margin as described below - - Notes payable and current maturity of long-term debt $ 14 $ 5,855
Long-Term:
Notes:7.34% Senior Notes maturing July 2007. Principal due in equal annual installments of
$25 million from 2005 through 2007. Interest payable semi-annually $ 75,000 $ 75,000
Revolving credit facilities:$125.0 million four-year revolver expiring August 2006. Interest at prime plus a margin or the
British Bankers Association settlement rate plus a margin as described below - - Long-term debt $ 75,000 $ 75,000
Notes payable consist primarily of short-term loans borrowed under commercial credit facilities. These borrowings had aweighted average interest rate of 2.5% and 1.3% at December 31, 2002 and 2001, respectively.
In August 2002, we entered into a new four-year $125,000 unsecured revolving credit facility and a new 364-day $50,000unsecured revolving credit facility, both of which can be utilized for letters of credit and debt borrowings. These facilitiesreplaced two revolving credit facilities with comparable terms and borrowing capacities. The new facilities provide for theannual extension of the termination date, subject to mutual agreement between us and the bank group. In addition to intereston debt borrowings, we are assessed quarterly commitment fees on the unutilized portion of the credit facilities as well asletter of credit fees on outstanding instruments. The interest, letter of credit fee and commitment fee percentages are basedupon our quarterly leverage ratio. The facilities contain certain restrictive covenants including minimum levels of net worth,
50
C B & I 2 0 0 2 A N N U A L R E P O R T
Brought to you by Global Reports
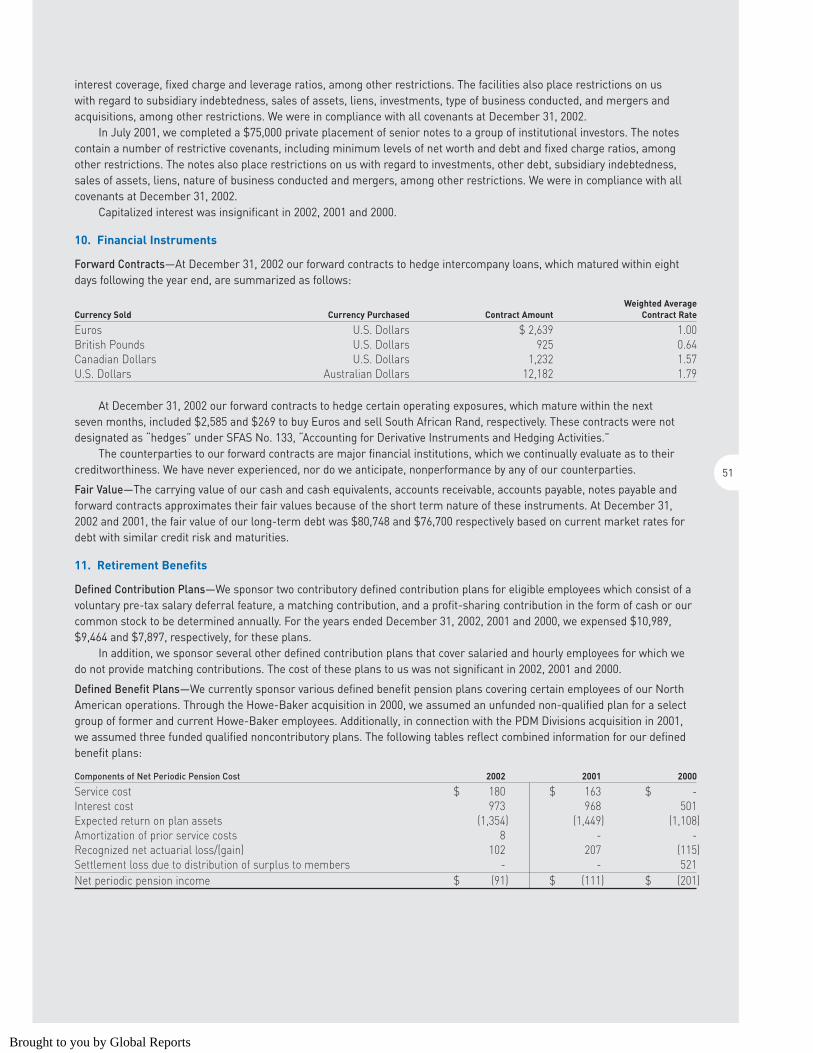
interest coverage, fixed charge and leverage ratios, among other restrictions. The facilities also place restrictions on us with regard to subsidiary indebtedness, sales of assets, liens, investments, type of business conducted, and mergers andacquisitions, among other restrictions. We were in compliance with all covenants at December 31, 2002.
In July 2001, we completed a $75,000 private placement of senior notes to a group of institutional investors. The notescontain a number of restrictive covenants, including minimum levels of net worth and debt and fixed charge ratios, amongother restrictions. The notes also place restrictions on us with regard to investments, other debt, subsidiary indebtedness,sales of assets, liens, nature of business conducted and mergers, among other restrictions. We were in compliance with allcovenants at December 31, 2002.
Capitalized interest was insignificant in 2002, 2001 and 2000.
10. Financial Instruments
Forward Contracts—At December 31, 2002 our forward contracts to hedge intercompany loans, which matured within eightdays following the year end, are summarized as follows:
Weighted AverageCurrency Sold Currency Purchased Contract Amount Contract Rate
Euros U.S. Dollars $ 2,639 1.00 British Pounds U.S. Dollars 925 0.64 Canadian Dollars U.S. Dollars 1,232 1.57 U.S. Dollars Australian Dollars 12,182 1.79
At December 31, 2002 our forward contracts to hedge certain operating exposures, which mature within the next seven months, included $2,585 and $269 to buy Euros and sell South African Rand, respectively. These contracts were notdesignated as “hedges” under SFAS No. 133, “Accounting for Derivative Instruments and Hedging Activities.”
The counterparties to our forward contracts are major financial institutions, which we continually evaluate as to theircreditworthiness. We have never experienced, nor do we anticipate, nonperformance by any of our counterparties.
Fair Value—The carrying value of our cash and cash equivalents, accounts receivable, accounts payable, notes payable andforward contracts approximates their fair values because of the short term nature of these instruments. At December 31,2002 and 2001, the fair value of our long-term debt was $80,748 and $76,700 respectively based on current market rates fordebt with similar credit risk and maturities.
11. Retirement Benefits
Defined Contribution Plans—We sponsor two contributory defined contribution plans for eligible employees which consist of avoluntary pre-tax salary deferral feature, a matching contribution, and a profit-sharing contribution in the form of cash or ourcommon stock to be determined annually. For the years ended December 31, 2002, 2001 and 2000, we expensed $10,989,$9,464 and $7,897, respectively, for these plans.
In addition, we sponsor several other defined contribution plans that cover salaried and hourly employees for which wedo not provide matching contributions. The cost of these plans to us was not significant in 2002, 2001 and 2000.
Defined Benefit Plans—We currently sponsor various defined benefit pension plans covering certain employees of our NorthAmerican operations. Through the Howe-Baker acquisition in 2000, we assumed an unfunded non-qualified plan for a selectgroup of former and current Howe-Baker employees. Additionally, in connection with the PDM Divisions acquisition in 2001,we assumed three funded qualified noncontributory plans. The following tables reflect combined information for our definedbenefit plans:
Components of Net Periodic Pension Cost 2002 2001 2000
Service cost $ 180 $ 163 $ - Interest cost 973 968 501 Expected return on plan assets (1,354) (1,449) (1,108)Amortization of prior service costs 8 - - Recognized net actuarial loss/(gain) 102 207 (115)Settlement loss due to distribution of surplus to members - - 521 Net periodic pension income $ (91) $ (111) $ (201)
51
Brought to you by Global Reports
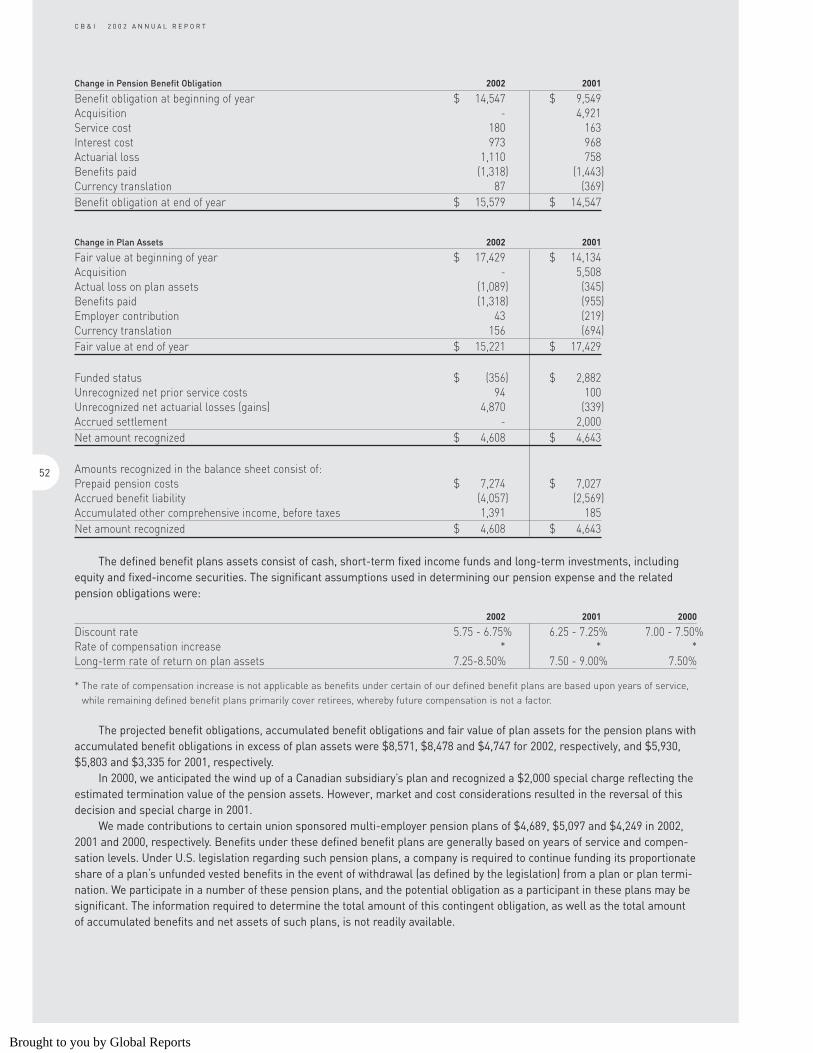
Change in Pension Benefit Obligation 2002 2001
Benefit obligation at beginning of year $ 14,547 $ 9,549Acquisition - 4,921Service cost 180 163Interest cost 973 968Actuarial loss 1,110 758Benefits paid (1,318) (1,443)Currency translation 87 (369)Benefit obligation at end of year $ 15,579 $ 14,547
Change in Plan Assets 2002 2001
Fair value at beginning of year $ 17,429 $ 14,134 Acquisition - 5,508 Actual loss on plan assets (1,089) (345)Benefits paid (1,318) (955)Employer contribution 43 (219)Currency translation 156 (694)Fair value at end of year $ 15,221 $ 17,429
Funded status $ (356) $ 2,882 Unrecognized net prior service costs 94 100 Unrecognized net actuarial losses (gains) 4,870 (339)Accrued settlement - 2,000 Net amount recognized $ 4,608 $ 4,643
Amounts recognized in the balance sheet consist of:Prepaid pension costs $ 7,274 $ 7,027 Accrued benefit liability (4,057) (2,569)Accumulated other comprehensive income, before taxes 1,391 185 Net amount recognized $ 4,608 $ 4,643
The defined benefit plans assets consist of cash, short-term fixed income funds and long-term investments, includingequity and fixed-income securities. The significant assumptions used in determining our pension expense and the relatedpension obligations were:
2002 2001 2000
Discount rate 5.75 - 6.75% 6.25 - 7.25% 7.00 - 7.50%Rate of compensation increase * * *Long-term rate of return on plan assets 7.25-8.50% 7.50 - 9.00% 7.50%
* The rate of compensation increase is not applicable as benefits under certain of our defined benefit plans are based upon years of service,while remaining defined benefit plans primarily cover retirees, whereby future compensation is not a factor.
The projected benefit obligations, accumulated benefit obligations and fair value of plan assets for the pension plans withaccumulated benefit obligations in excess of plan assets were $8,571, $8,478 and $4,747 for 2002, respectively, and $5,930,$5,803 and $3,335 for 2001, respectively.
In 2000, we anticipated the wind up of a Canadian subsidiary’s plan and recognized a $2,000 special charge reflecting theestimated termination value of the pension assets. However, market and cost considerations resulted in the reversal of thisdecision and special charge in 2001.
We made contributions to certain union sponsored multi-employer pension plans of $4,689, $5,097 and $4,249 in 2002,2001 and 2000, respectively. Benefits under these defined benefit plans are generally based on years of service and compen-sation levels. Under U.S. legislation regarding such pension plans, a company is required to continue funding its proportionateshare of a plan‘s unfunded vested benefits in the event of withdrawal (as defined by the legislation) from a plan or plan termi-nation. We participate in a number of these pension plans, and the potential obligation as a participant in these plans may besignificant. The information required to determine the total amount of this contingent obligation, as well as the total amountof accumulated benefits and net assets of such plans, is not readily available.
52
C B & I 2 0 0 2 A N N U A L R E P O R T
Brought to you by Global Reports
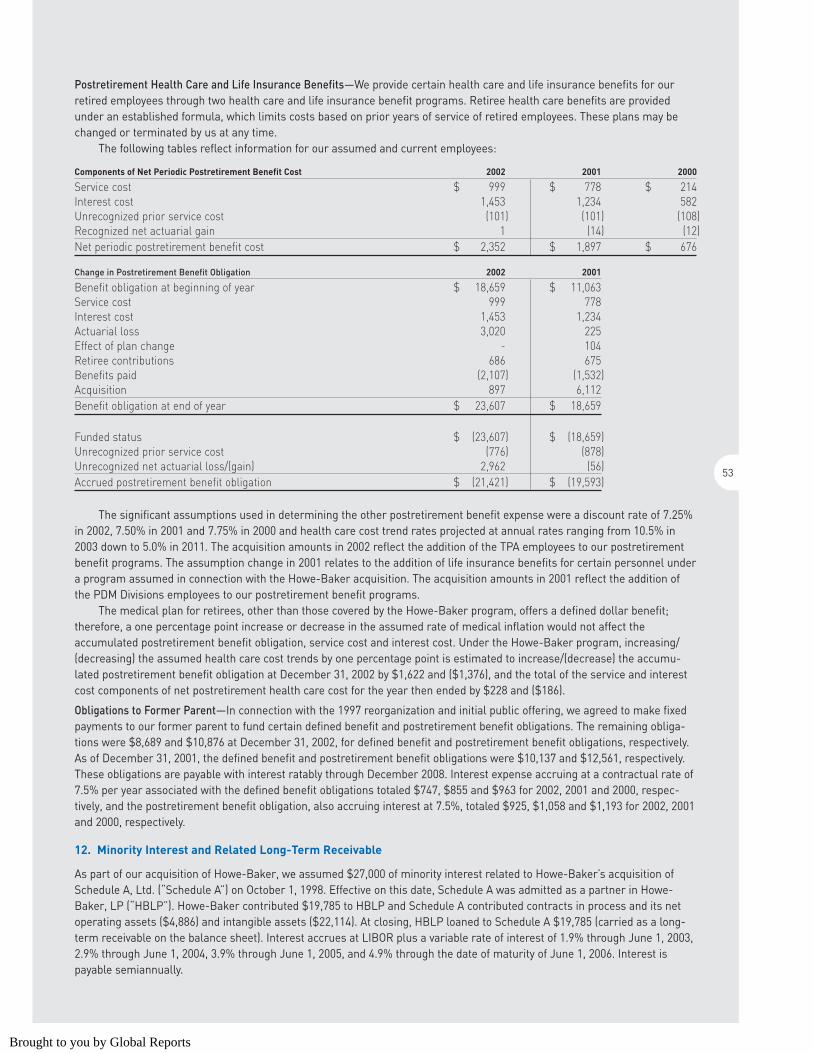
Postretirement Health Care and Life Insurance Benefits—We provide certain health care and life insurance benefits for ourretired employees through two health care and life insurance benefit programs. Retiree health care benefits are providedunder an established formula, which limits costs based on prior years of service of retired employees. These plans may bechanged or terminated by us at any time.
The following tables reflect information for our assumed and current employees:
Components of Net Periodic Postretirement Benefit Cost 2002 2001 2000
Service cost $ 999 $ 778 $ 214 Interest cost 1,453 1,234 582 Unrecognized prior service cost (101) (101) (108)Recognized net actuarial gain 1 (14) (12)Net periodic postretirement benefit cost $ 2,352 $ 1,897 $ 676
Change in Postretirement Benefit Obligation 2002 2001
Benefit obligation at beginning of year $ 18,659 $ 11,063 Service cost 999 778 Interest cost 1,453 1,234 Actuarial loss 3,020 225 Effect of plan change - 104 Retiree contributions 686 675 Benefits paid (2,107) (1,532)Acquisition 897 6,112 Benefit obligation at end of year $ 23,607 $ 18,659
Funded status $ (23,607) $ (18,659)Unrecognized prior service cost (776) (878)Unrecognized net actuarial loss/(gain) 2,962 (56)Accrued postretirement benefit obligation $ (21,421) $ (19,593)
The significant assumptions used in determining the other postretirement benefit expense were a discount rate of 7.25%in 2002, 7.50% in 2001 and 7.75% in 2000 and health care cost trend rates projected at annual rates ranging from 10.5% in2003 down to 5.0% in 2011. The acquisition amounts in 2002 reflect the addition of the TPA employees to our postretirementbenefit programs. The assumption change in 2001 relates to the addition of life insurance benefits for certain personnel undera program assumed in connection with the Howe-Baker acquisition. The acquisition amounts in 2001 reflect the addition ofthe PDM Divisions employees to our postretirement benefit programs.
The medical plan for retirees, other than those covered by the Howe-Baker program, offers a defined dollar benefit;therefore, a one percentage point increase or decrease in the assumed rate of medical inflation would not affect the accumulated postretirement benefit obligation, service cost and interest cost. Under the Howe-Baker program, increasing/(decreasing) the assumed health care cost trends by one percentage point is estimated to increase/(decrease) the accumu-lated postretirement benefit obligation at December 31, 2002 by $1,622 and ($1,376), and the total of the service and interestcost components of net postretirement health care cost for the year then ended by $228 and ($186).
Obligations to Former Parent—In connection with the 1997 reorganization and initial public offering, we agreed to make fixedpayments to our former parent to fund certain defined benefit and postretirement benefit obligations. The remaining obliga-tions were $8,689 and $10,876 at December 31, 2002, for defined benefit and postretirement benefit obligations, respectively.As of December 31, 2001, the defined benefit and postretirement benefit obligations were $10,137 and $12,561, respectively.These obligations are payable with interest ratably through December 2008. Interest expense accruing at a contractual rate of7.5% per year associated with the defined benefit obligations totaled $747, $855 and $963 for 2002, 2001 and 2000, respec-tively, and the postretirement benefit obligation, also accruing interest at 7.5%, totaled $925, $1,058 and $1,193 for 2002, 2001and 2000, respectively.
12. Minority Interest and Related Long-Term Receivable
As part of our acquisition of Howe-Baker, we assumed $27,000 of minority interest related to Howe-Baker’s acquisition ofSchedule A, Ltd. (“Schedule A”) on October 1, 1998. Effective on this date, Schedule A was admitted as a partner in Howe-Baker, LP (“HBLP”). Howe-Baker contributed $19,785 to HBLP and Schedule A contributed contracts in process and its netoperating assets ($4,886) and intangible assets ($22,114). At closing, HBLP loaned to Schedule A $19,785 (carried as a long-term receivable on the balance sheet). Interest accrues at LIBOR plus a variable rate of interest of 1.9% through June 1, 2003,2.9% through June 1, 2004, 3.9% through June 1, 2005, and 4.9% through the date of maturity of June 1, 2006. Interest ispayable semiannually.
53
Brought to you by Global Reports
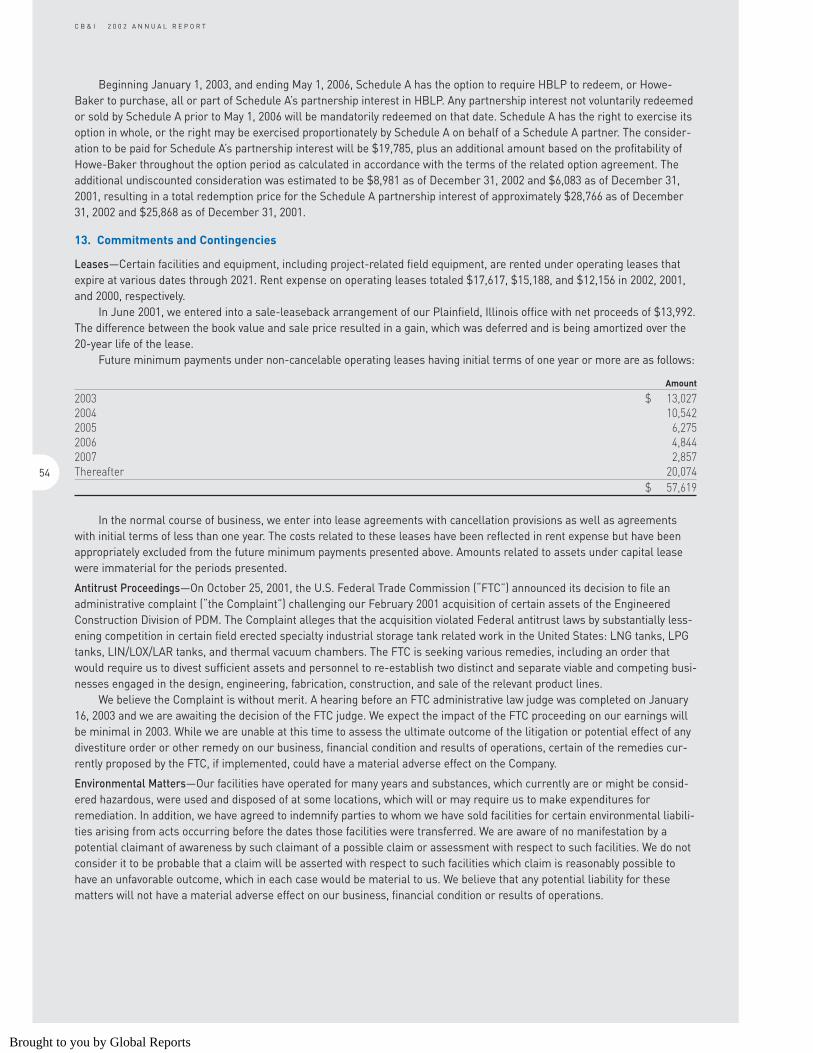
Beginning January 1, 2003, and ending May 1, 2006, Schedule A has the option to require HBLP to redeem, or Howe-Baker to purchase, all or part of Schedule A’s partnership interest in HBLP. Any partnership interest not voluntarily redeemedor sold by Schedule A prior to May 1, 2006 will be mandatorily redeemed on that date. Schedule A has the right to exercise itsoption in whole, or the right may be exercised proportionately by Schedule A on behalf of a Schedule A partner. The consider-ation to be paid for Schedule A’s partnership interest will be $19,785, plus an additional amount based on the profitability ofHowe-Baker throughout the option period as calculated in accordance with the terms of the related option agreement. Theadditional undiscounted consideration was estimated to be $8,981 as of December 31, 2002 and $6,083 as of December 31,2001, resulting in a total redemption price for the Schedule A partnership interest of approximately $28,766 as of December31, 2002 and $25,868 as of December 31, 2001.
13. Commitments and Contingencies
Leases—Certain facilities and equipment, including project-related field equipment, are rented under operating leases thatexpire at various dates through 2021. Rent expense on operating leases totaled $17,617, $15,188, and $12,156 in 2002, 2001,and 2000, respectively.
In June 2001, we entered into a sale-leaseback arrangement of our Plainfield, Illinois office with net proceeds of $13,992.The difference between the book value and sale price resulted in a gain, which was deferred and is being amortized over the20-year life of the lease.
Future minimum payments under non-cancelable operating leases having initial terms of one year or more are as follows:
Amount
2003 $ 13,027 2004 10,542 2005 6,275 2006 4,844 2007 2,857 Thereafter 20,074
$ 57,619
In the normal course of business, we enter into lease agreements with cancellation provisions as well as agreementswith initial terms of less than one year. The costs related to these leases have been reflected in rent expense but have beenappropriately excluded from the future minimum payments presented above. Amounts related to assets under capital leasewere immaterial for the periods presented.
Antitrust Proceedings—On October 25, 2001, the U.S. Federal Trade Commission (“FTC”) announced its decision to file anadministrative complaint (“the Complaint”) challenging our February 2001 acquisition of certain assets of the EngineeredConstruction Division of PDM. The Complaint alleges that the acquisition violated Federal antitrust laws by substantially less-ening competition in certain field erected specialty industrial storage tank related work in the United States: LNG tanks, LPGtanks, LIN/LOX/LAR tanks, and thermal vacuum chambers. The FTC is seeking various remedies, including an order thatwould require us to divest sufficient assets and personnel to re-establish two distinct and separate viable and competing busi-nesses engaged in the design, engineering, fabrication, construction, and sale of the relevant product lines.
We believe the Complaint is without merit. A hearing before an FTC administrative law judge was completed on January16, 2003 and we are awaiting the decision of the FTC judge. We expect the impact of the FTC proceeding on our earnings willbe minimal in 2003. While we are unable at this time to assess the ultimate outcome of the litigation or potential effect of anydivestiture order or other remedy on our business, financial condition and results of operations, certain of the remedies cur-rently proposed by the FTC, if implemented, could have a material adverse effect on the Company.
Environmental Matters—Our facilities have operated for many years and substances, which currently are or might be consid-ered hazardous, were used and disposed of at some locations, which will or may require us to make expenditures forremediation. In addition, we have agreed to indemnify parties to whom we have sold facilities for certain environmental liabili-ties arising from acts occurring before the dates those facilities were transferred. We are aware of no manifestation by apotential claimant of awareness by such claimant of a possible claim or assessment with respect to such facilities. We do notconsider it to be probable that a claim will be asserted with respect to such facilities which claim is reasonably possible tohave an unfavorable outcome, which in each case would be material to us. We believe that any potential liability for thesematters will not have a material adverse effect on our business, financial condition or results of operations.
54
C B & I 2 0 0 2 A N N U A L R E P O R T
Brought to you by Global Reports
We do not anticipate incurring material capital expenditures for environmental controls or for investigation or remediationof environmental conditions during the current or succeeding fiscal year. Nevertheless, we can give no assurance that we, orentities for which we may be responsible, will not incur liability in connection with the investigation and remediation of facilitieswe currently (or formerly) own or operate or other locations in a manner that could materially and adversely affect us.
Other—We are a defendant in a number of other lawsuits arising in the normal course of our business. We believe that anestimate of the possible loss or range of possible loss relating to such matters cannot be made. While it is impossible at thistime to determine with certainty the ultimate outcome of these lawsuits and although no assurance can be given with respectthereto, based on information currently available to us and our belief as to the reasonable likelihood of the outcomes of suchmatters, our management believes that adequate provision has been made for probable losses with respect thereto. Webelieve that the ultimate outcome, after provisions therefore, will not have a material adverse effect, either individually or inthe aggregate, on our business, financial condition or results of operations. The adequacy of reserves applicable to the poten-tial costs of being engaged in litigation and potential liabilities resulting from litigation is reviewed as developments in thelitigation warrant.
Letters of Credit/Bank Guarantees/Surety Bonds
Ordinary Course Commitments—In the ordinary course of business, we may obtain surety bonds and letters of credit, whichwe provide to our customers to secure advance payment, our performance under the contracts or in lieu of retention beingwithheld on our contracts. In the event of our nonperformance under a contract and an advance being made by a bank pur-suant to a draw on a letter of credit, the advance would become a borrowing under a credit facility and thus a direct obligationof the Company. Where a surety incurs such a loss, an indemnity agreement between the parties and the Company mayrequire payment from our excess cash or a borrowing under our revolving credit facilities. When a contract is completed, thecontingent obligation terminates and the bonds or letters of credit returned. At December 31, 2002, we had provided $486,455of surety bonds and letters of credit to support our contracting activities in the ordinary course of business. This amount fluc-tuates based on the mix and level of contracting activity.
Insurance—We have elected to retain portions of losses, if any, through the use of deductibles and self-insured retentions forour exposures related to third-party liability and workers’ compensation. Liabilities in excess of these amounts are theresponsibilities of an insurance carrier. To the extent we are self-insured for these exposures, reserves (Note 8) have beenprovided based on management’s best estimates with input from our legal and insurance advisors. Changes in assumptions,as well as changes in actual experience, could cause these estimates to change in the near term. Our management believesthat the reasonably possible losses, if any, for these matters, to the extent not otherwise disclosed and net of recordedreserves, will not be material to our financial position or results of operations. At December 31, 2002, we had outstandingsurety bonds and letters of credit of $22,268 relating to our insurance program.
14. Shareholders’ Equity
Stock Split—On January 22, 2003, we declared a two-for-one stock split effective in the form of a stock dividend payableFebruary 10, 2003 to stockholders of record at the close of business on February 3, 2003. All share numbers and amountshave been adjusted for the stock split for all periods presented.
Stock Held in Trust—During 1999, we established a Trust to hold 1,411,120 unvested restricted stock units (valued at $9.00 pershare) for two executive officers. The restricted stock units, which vested in March 2000, entitle the participants to receive onecommon share for each stock unit on the earlier of (i) the first business day after April 1, 2004, (ii) the first business day aftertermination of employment, or (iii) a change of control. These shares are considered outstanding for basic and diluted EPScomputations. The total value of the shares placed in the Trust was $12,735.
During 2001, 272,314 restricted stock units were distributed from the Trust in connection with the departure of a formerexecutive.
From time to time, we grant restricted shares to key employees under our Long-Term Incentive Plan. The restrictedshares are transferred to the trust and held until the vesting restrictions lapse, at which time the shares are released fromthe Trust and distributed to the employees.
Treasury Stock—Under Dutch law and our Articles of Association, we may hold no more than 10% of our issued share capital atany time. In order to allow implementation of proposed repurchases of our share capital authorized by the shareholders, whichmight be in excess of 10% (and up to 30%), we must dispose of or cancel shares which have been repurchased. From time totime, we request authority from our shareholders at the Annual General Meeting of Shareholders to cancel up to 20% of thecurrent issued share capital in multiple tranches, with no tranche to exceed 10%. We cancelled shares in 2001 and 2000.
55
Brought to you by Global Reports
Accumulated Other Comprehensive Income (Loss)—The components of accumulated other comprehensive income (loss) are asfollows:
Currency Unrealized Minimum Accumulated OtherTranslation Loss on Debt Pension Liability ComprehensiveAdjustment Securities Adjustment Income (Loss)
Balance at January 1, 2000 $ (7,242) $ - $ - $ (7,242)Change in 2000 (net of tax of $1,416) (2,630) - - (2,630)Balance at December 31, 2000 (9,872) - - (9,872)Change in 2001 (net of tax of $1,402, $254 and $65) (2,603) (473) (120) (3,196)Balance at December 31, 2001 (12,475) (473) (120) (13,068)Change in 2002 (net of tax of $1,507, $56 and $487) (2,798) (105) (904) (3,807)Balance at December 31, 2002 $ (15,273) $ (578) $ (1,024) $ (16,875)
The unrealized loss on debt securities resulted from a mark-to-market loss on a cash flow hedge for the anticipated pri-vate placement debt issuance (Note 9). The minimum pension liability adjustment relates to the acquired PDM Divisionspension plan liabilities (Note 11).
15. Stock Plans
Employee Stock Purchase Plan—During 2001, the shareholders adopted an employee stock purchase plan under which sale of1,000,000 shares of our common stock has been authorized. Employees may purchase shares at a discount on a quarterlybasis through regular payroll deductions of up to 8% of their compensation. The shares are purchased at 85% of the closingprice per share on the first trading day following the end of the calendar quarter. As of December 31, 2002, 794,860 sharesremain available for purchase.
Long-Term Incentive Plans—Under our 1997 and 1999 Long-Term Incentive Plans, as amended (the “Incentive Plans”), we canissue shares in the form of stock options, performance shares or restricted shares. Of the 8,363,510 shares authorized forgrant under the Incentive Plans, 2,264,446 shares remain available for grant at December 31, 2002.
Stock Options—Stock options are generally granted at the fair market value on the date of grant and expire after 10 years.Options granted to executive officers and other key employees typically vest over a three to four year period, while optionsgranted to Supervisory Directors vest over a one-year period. The following table summarizes the changes in stock options forthe years ended December 31, 2002, 2001 and 2000:
Weighted AverageStock Options Exercise Price Per Share Exercise Price Per Share
Outstanding at January 1, 2000 1,711,362 $ 4.60 - $ 9.00 $ 7.92Granted 2,388,498 $ 7.35 - $ 8.35 $ 8.22Forfeited (55,332) $ 6.57 - $ 9.00 $ 8.21Exercised (4,750) $ 6.57 $ 6.57Outstanding at December 31, 2000 4,039,778 $ 4.60 - $ 9.00 $ 8.12Granted 293,580 $ 10.50 - $ 17.05 $ 12.63Forfeited (38,960) $ 8.35 $ 8.35Exercised (365,078) $ 4.60 - $ 9.00 $ 8.17Outstanding at December 31, 2001 3,929,320 $ 4.60 - $ 17.05 $ 8.45Granted 944,672 $ 12.50 - $ 16.07 $ 14.05Forfeited (18,866) $ 6.75 - $ 16.93 $ 11.67Exercised (215,788) $ 6.57 - $ 9.00 $ 8.25Outstanding at December 31, 2002 4,639,338 $ 4.60 - $ 17.05 $ 9.59
The weighted average fair value of options granted during 2002, 2001 and 2000 was $12.40, $13.16 and $8.36, respectively.The number of outstanding fixed stock options exercisable at December 31, 2001 and 2000 was 939,820 and 658,486, respec-tively. These options had a weighted average exercise price of $7.84 and $7.82 at December 31, 2001 and 2000, respectively.
During 2000, the vesting of 331,276 outstanding options was accelerated due to either change of control provisions trig-gered by the Howe-Baker acquisition or the voluntary resignation offer as fully described in Note 4.
56
C B & I 2 0 0 2 A N N U A L R E P O R T
Brought to you by Global Reports
The following summarizes information about stock options outstanding at December 31, 2002:
Options Outstanding Options ExercisableWeighted Average
Range of Number Remaining Weighted Average Number Weighted AverageExercise Prices Outstanding Contractual Life Exercise Price Exercisable Exercise Price
$4.60 - $6.75 543,650 6.0 $ 6.53 469,534 $ 6.52 $7.34 - $11.00 3,004,480 7.0 8.52 1,715,434 8.47 $11.43 - $17.05 1,091,208 9.1 14.04 62,578 14.53
4,639,338 7.4 $ 9.59 2,247,546 $ 8.23
Restricted Shares—Restricted shares generally vest over four years. Total compensation expense of $756, $1,125 and $2,969was recognized in 2002, 2001 and 2000, respectively. Certain performance shares, which were targeted to vest over threeyears, subject to achievement of specific Company goals, were converted to time-vested restricted shares during 2000. Thefollowing table shows the changes in restricted shares:
2002 2001 2000
Shares subject to restriction at beginning of year 476,814 600,336 371,946 Restricted share grants 43,840 110,366 150,410 Restricted share distributions (193,796) (232,128) (108,884)Restricted share forfeitures (840) (1,760) (12,600)Performance shares converted to restricted shares - - 199,464 Shares subject to restriction at end of year 326,018 476,814 600,336
16. Income Taxes
2002 2001 2000
Sources of Income (Loss) Before Income Taxes and Minority InterestU.S. 32,896 3,277 (23,874)Non-U.S. 39,298 44,628 (7,688)
Total 72,194 47,905 (31,562)Income Tax (Expense) BenefitCurrent Income Taxes
U.S. (736) - -Non-U.S. (6,512) (7,438) (4,046)
(7,248) (7,438) (4,046)Deferred Income Taxes
U.S. (11,614) (2,392) 7,285 Non-U.S. (1,371) (3,650) 1,620
(12,985) (6,042) 8,905 Total Income Tax (Expense) Benefit (20,233) (13,480) 4,859
Reconciliation of Income Taxes at the Statutory Rate and Income Tax (Expense) Benefit
Tax (Expense) Benefit at Statutory Rate (25,268) (16,767) 11,047 State Income Taxes (479) (478) -Non-U.S. Statutory Tax Rate Differential 7,782 4,541 (5,408)Other, net (2,268) (776) (780)Income Tax (Expense) Benefit (20,233) (13,480) 4,859 Effective Tax Rate 28.0% 28.1% (15.0%)
57
Brought to you by Global Reports
Our statutory rate was The Netherlands’ rate of 35% in 2002, 2001 and 2000.
The principal temporary differences included in deferred income taxes reported on the December 31, 2002 and 2001 balancesheets were:
2002 2001
Current Deferred Taxes
Tax Benefit of U.S. Operating Losses and Credits 3,585 7,000 Contracts 7,487 5,561 Employee Benefits 1,541 4,937 Voluntary Resignation Offer 918 744 Insurance 83 83 Other 3,491 2,201
17,105 20,526
Non-Current Deferred Taxes
Employee Benefits 6,485 11,629 Non-U.S. Activity 10,106 8,378 Insurance 7,167 3,904 Other (4,895) 7,229
18,863 31,140 Depreciation (10,586) (9,665)Net Deferred Tax Assets 25,382 42,001
As of December 31, 2002, we had U.S. net operating loss carryforwards (“NOL’s”) of approximately $20,285, $18,300 ofwhich are subject to limitation under Internal Revenue Code Section 382. The U.S. NOL’s will expire from 2012 to 2021. We didnot record any Netherlands deferred income taxes on indefinitely reinvested undistributed earnings of our subsidiaries andaffiliates at December 31, 2002. If any such undistributed earnings were distributed, the Netherlands participation exemptionshould become available under current law to significantly reduce or eliminate any resulting Netherlands income tax liability.
17. Segment Information
We manage our operations by four geographic segments: North America; Europe, Africa, Middle East; Asia Pacific; andCentral and South America. Each geographic segment offers similar services.
The Chief Executive Officer evaluates the performance of these four segments based on revenues and income from operations excluding special charges. Each segment’s performance reflects the allocation of corporate costs, which werebased primarily on revenues. No customer accounted for more than 10% of revenues. Intersegment revenues are not material.
The following table presents revenues by geographic segment:
2002 2001 2000
Revenues
North America $ 801,624 $ 726,629 $ 304,520Europe, Africa, Middle East 132,853 124,226 176,542Asia Pacific 95,935 39,917 55,482Central and South America 118,066 191,052 75,147
Total revenues $1,148,478 $1,081,824 $ 611,691
The following table indicates revenues for individual countries in excess of 10% of consolidated revenues during any ofthe three years ended December 31, 2002, based on where we performed the work:
2002 2001 2000
United States $ 750,935 $ 665,217 $ 242,024
58
C B & I 2 0 0 2 A N N U A L R E P O R T
Brought to you by Global Reports
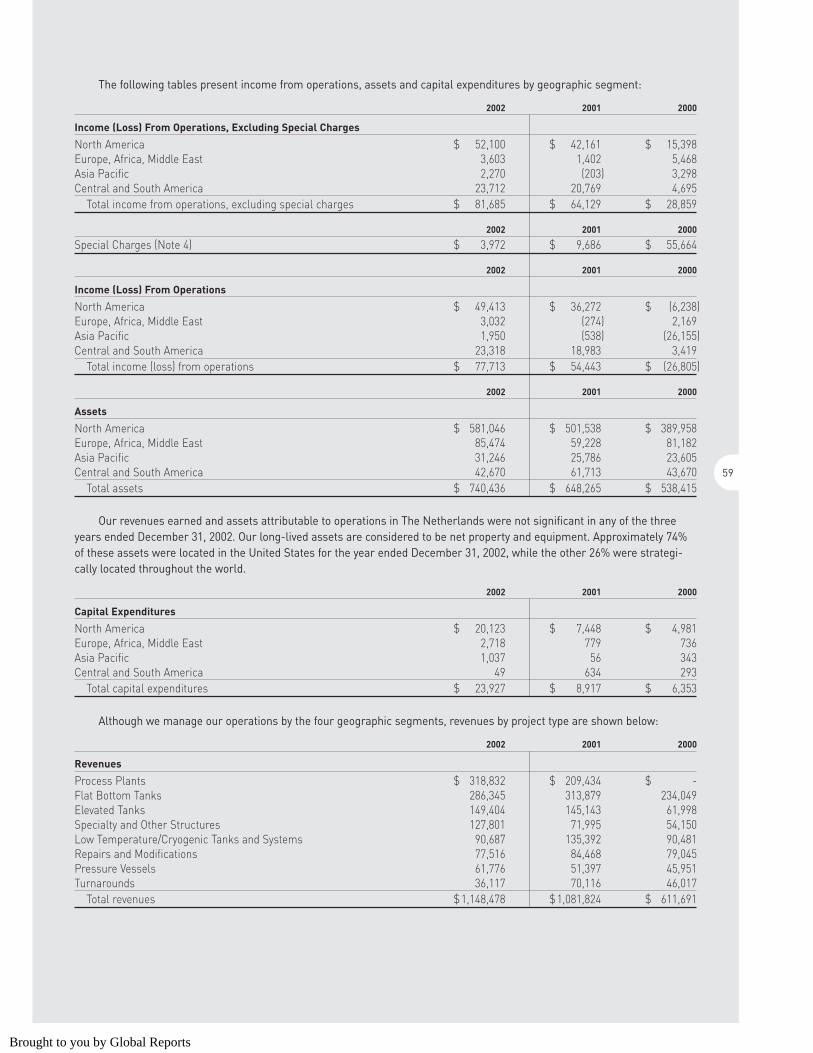
The following tables present income from operations, assets and capital expenditures by geographic segment:
2002 2001 2000
Income (Loss) From Operations, Excluding Special Charges
North America $ 52,100 $ 42,161 $ 15,398 Europe, Africa, Middle East 3,603 1,402 5,468 Asia Pacific 2,270 (203) 3,298 Central and South America 23,712 20,769 4,695
Total income from operations, excluding special charges $ 81,685 $ 64,129 $ 28,859
2002 2001 2000
Special Charges (Note 4) $ 3,972 $ 9,686 $ 55,664
2002 2001 2000
Income (Loss) From Operations
North America $ 49,413 $ 36,272 $ (6,238)Europe, Africa, Middle East 3,032 (274) 2,169 Asia Pacific 1,950 (538) (26,155)Central and South America 23,318 18,983 3,419
Total income (loss) from operations $ 77,713 $ 54,443 $ (26,805)
2002 2001 2000
Assets
North America $ 581,046 $ 501,538 $ 389,958 Europe, Africa, Middle East 85,474 59,228 81,182 Asia Pacific 31,246 25,786 23,605 Central and South America 42,670 61,713 43,670
Total assets $ 740,436 $ 648,265 $ 538,415
Our revenues earned and assets attributable to operations in The Netherlands were not significant in any of the threeyears ended December 31, 2002. Our long-lived assets are considered to be net property and equipment. Approximately 74%of these assets were located in the United States for the year ended December 31, 2002, while the other 26% were strategi-cally located throughout the world.
2002 2001 2000
Capital Expenditures
North America $ 20,123 $ 7,448 $ 4,981 Europe, Africa, Middle East 2,718 779 736 Asia Pacific 1,037 56 343 Central and South America 49 634 293
Total capital expenditures $ 23,927 $ 8,917 $ 6,353
Although we manage our operations by the four geographic segments, revenues by project type are shown below:
2002 2001 2000
Revenues
Process Plants $ 318,832 $ 209,434 $ - Flat Bottom Tanks 286,345 313,879 234,049 Elevated Tanks 149,404 145,143 61,998 Specialty and Other Structures 127,801 71,995 54,150 Low Temperature/Cryogenic Tanks and Systems 90,687 135,392 90,481 Repairs and Modifications 77,516 84,468 79,045 Pressure Vessels 61,776 51,397 45,951 Turnarounds 36,117 70,116 46,017
Total revenues $1,148,478 $1,081,824 $ 611,691
59
Brought to you by Global Reports
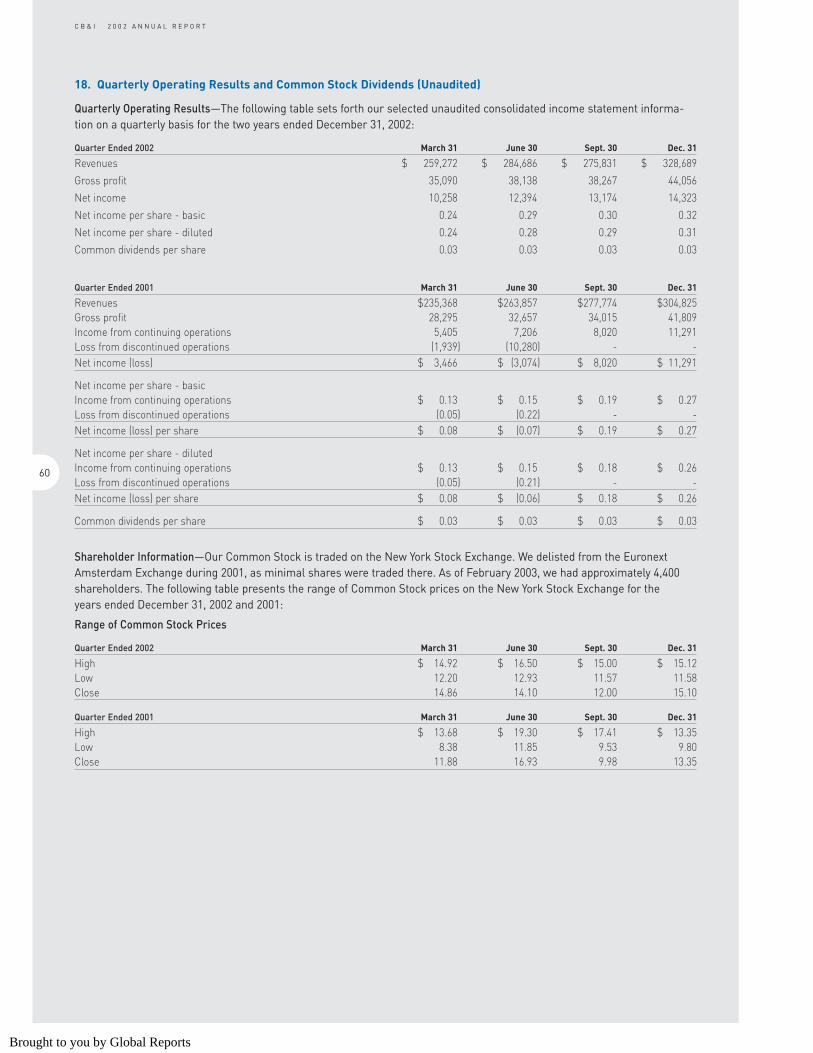
18. Quarterly Operating Results and Common Stock Dividends (Unaudited)
Quarterly Operating Results—The following table sets forth our selected unaudited consolidated income statement informa-tion on a quarterly basis for the two years ended December 31, 2002:
Quarter Ended 2002 March 31 June 30 Sept. 30 Dec. 31
Revenues $ 259,272 $ 284,686 $ 275,831 $ 328,689
Gross profit 35,090 38,138 38,267 44,056
Net income 10,258 12,394 13,174 14,323
Net income per share - basic 0.24 0.29 0.30 0.32
Net income per share - diluted 0.24 0.28 0.29 0.31
Common dividends per share 0.03 0.03 0.03 0.03
Quarter Ended 2001 March 31 June 30 Sept. 30 Dec. 31
Revenues $235,368 $263,857 $277,774 $304,825 Gross profit 28,295 32,657 34,015 41,809 Income from continuing operations 5,405 7,206 8,020 11,291 Loss from discontinued operations (1,939) (10,280) - - Net income (loss) $ 3,466 $ (3,074) $ 8,020 $ 11,291
Net income per share - basicIncome from continuing operations $ 0.13 $ 0.15 $ 0.19 $ 0.27 Loss from discontinued operations (0.05) (0.22) - - Net income (loss) per share $ 0.08 $ (0.07) $ 0.19 $ 0.27
Net income per share - dilutedIncome from continuing operations $ 0.13 $ 0.15 $ 0.18 $ 0.26 Loss from discontinued operations (0.05) (0.21) - - Net income (loss) per share $ 0.08 $ (0.06) $ 0.18 $ 0.26
Common dividends per share $ 0.03 $ 0.03 $ 0.03 $ 0.03
Shareholder Information—Our Common Stock is traded on the New York Stock Exchange. We delisted from the EuronextAmsterdam Exchange during 2001, as minimal shares were traded there. As of February 2003, we had approximately 4,400shareholders. The following table presents the range of Common Stock prices on the New York Stock Exchange for the years ended December 31, 2002 and 2001:
Range of Common Stock Prices
Quarter Ended 2002 March 31 June 30 Sept. 30 Dec. 31
High $ 14.92 $ 16.50 $ 15.00 $ 15.12Low 12.20 12.93 11.57 11.58Close 14.86 14.10 12.00 15.10
Quarter Ended 2001 March 31 June 30 Sept. 30 Dec. 31
High $ 13.68 $ 19.30 $ 17.41 $ 13.35 Low 8.38 11.85 9.53 9.80Close 11.88 16.93 9.98 13.35
60
C B & I 2 0 0 2 A N N U A L R E P O R T
Brought to you by Global Reports
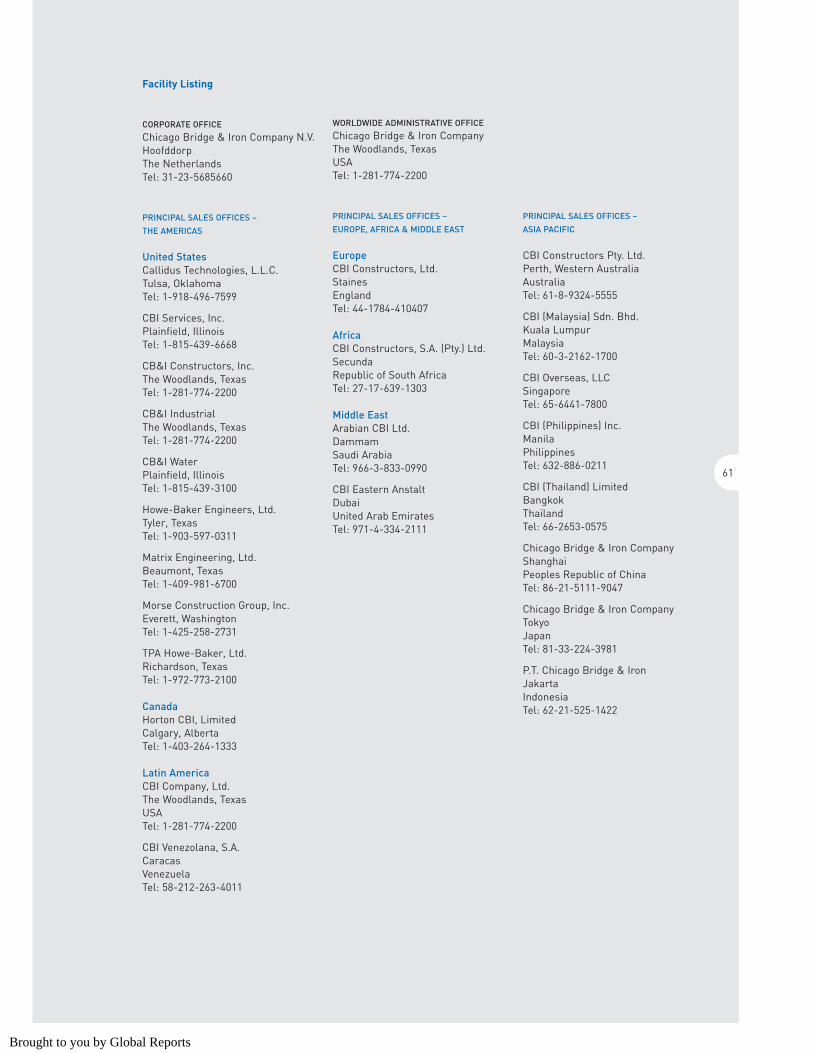
61
Facility Listing
CORPORATE OFFICE
Chicago Bridge & Iron Company N.V.HoofddorpThe NetherlandsTel: 31-23-5685660
PRINCIPAL SALES OFFICES –
THE AMERICAS
United StatesCallidus Technologies, L.L.C.Tulsa, OklahomaTel: 1-918-496-7599
CBI Services, Inc.Plainfield, IllinoisTel: 1-815-439-6668
CB&I Constructors, Inc.The Woodlands, TexasTel: 1-281-774-2200
CB&I IndustrialThe Woodlands, TexasTel: 1-281-774-2200
CB&I WaterPlainfield, IllinoisTel: 1-815-439-3100
Howe-Baker Engineers, Ltd.Tyler, TexasTel: 1-903-597-0311
Matrix Engineering, Ltd.Beaumont, TexasTel: 1-409-981-6700
Morse Construction Group, Inc.Everett, WashingtonTel: 1-425-258-2731
TPA Howe-Baker, Ltd.Richardson, TexasTel: 1-972-773-2100
CanadaHorton CBI, LimitedCalgary, AlbertaTel: 1-403-264-1333
Latin AmericaCBI Company, Ltd.The Woodlands, TexasUSATel: 1-281-774-2200
CBI Venezolana, S.A.CaracasVenezuelaTel: 58-212-263-4011
WORLDWIDE ADMINISTRATIVE OFFICE
Chicago Bridge & Iron CompanyThe Woodlands, TexasUSATel: 1-281-774-2200
PRINCIPAL SALES OFFICES –
EUROPE, AFRICA & MIDDLE EAST
EuropeCBI Constructors, Ltd.StainesEnglandTel: 44-1784-410407
AfricaCBI Constructors, S.A. (Pty.) Ltd.SecundaRepublic of South AfricaTel: 27-17-639-1303
Middle EastArabian CBI Ltd.DammamSaudi ArabiaTel: 966-3-833-0990
CBI Eastern AnstaltDubaiUnited Arab EmiratesTel: 971-4-334-2111
PRINCIPAL SALES OFFICES –
ASIA PACIFIC
CBI Constructors Pty. Ltd.Perth, Western AustraliaAustraliaTel: 61-8-9324-5555
CBI (Malaysia) Sdn. Bhd.Kuala LumpurMalaysiaTel: 60-3-2162-1700
CBI Overseas, LLCSingaporeTel: 65-6441-7800
CBI (Philippines) Inc.ManilaPhilippinesTel: 632-886-0211
CBI (Thailand) LimitedBangkokThailandTel: 66-2653-0575
Chicago Bridge & Iron CompanyShanghaiPeoples Republic of ChinaTel: 86-21-5111-9047
Chicago Bridge & Iron CompanyTokyoJapanTel: 81-33-224-3981
P.T. Chicago Bridge & IronJakartaIndonesiaTel: 62-21-525-1422
Brought to you by Global Reports
62
C B & I 2 0 0 2 A N N U A L R E P O R T
Beth A. BaileyVice President – InformationTechnologyChicago Bridge & Iron Company
William P. BartlettPresidentCallidus Technologies L.L.C.
Alan R. BlackVice President – Area Director ofFinance, Eastern HemisphereChicago Bridge & Iron Company B.V.
Managing DirectorChicago Bridge & Iron Company B.V.
Ronald E. BlumVice President – Sales, Europe, Africa & Middle EastChicago Bridge & Iron Company B.V.
Managing DirectorChicago Bridge & Iron Company B.V.
James E. BollwegPresidentCBI Services, Inc.
James M. BradenPresident – CB&I WaterCB&I Constructors, Inc.
Walter G. BrowningAssistant General Counsel, Western HemisphereChicago Bridge & Iron Company
David J. CochraneVice President – Sales, The AmericasChicago Bridge & Iron Company
Mitch P. DauzatPresident –CB&I Central & South AmericaChicago Bridge & Iron Company
John R. EdmondsGroup Vice President – Eastern Hemisphere OperationsChicago Bridge & Iron Company B.V.
Peter HanVice President – Sales, Asia PacificChicago Bridge & Iron Company B.V.
David L. KingVice President – Sales, Process and TechnologyHowe-Baker International, L.L.C.
Samuel C. LeventryVice President – Technology ServicesChicago Bridge & Iron Company
James R. McAdory IIIPresident and Chief Executive OfficerHowe-Baker International, L.L.C.
Timothy J. MoranVice President and TreasurerChicago Bridge & Iron Company
Piers MorrisSolicitor and Assistant General CounselChicago Bridge & Iron Company B.V.
Edgar C. RayVice President – Global MarketingChicago Bridge & Iron Company
Arthur R. RichardPresidentMatrix Engineering, Ltd.
James R. RhudyVice President – Health, Safety & EnvironmentalChicago Bridge & Iron Company
Luke V. ScorsonePresident – CB&I IndustrialCB&I Constructors, Inc.
Mario R. ValapertaVice President – Area Director ofFinance, Western HemisphereChicago Bridge & Iron Company
Corporate & Investor Information
Operating Executives
Stock ListingChicago Bridge & Iron CompanyN.V. common stock is listed on theNew York Stock Exchange underthe ticker symbol "CBI".
New York Stock Transfer AgentThe Bank of New YorkInvestor RelationsP.O. Box 11258Church Street StationNew York, NY 10286-1258 USATel: 1-888-269-2377 in USTel: 1-610-312-5315 outside USE-mail: [email protected] sites: www.adrbny.com orwww.stock.bankofny.com
Form 10-KA copy of Chicago Bridge & IronCompany N.V.'s Report on Form 10-K,filed with the Securities and ExchangeCommission, will be available in April2003 by written request to:
Investor Relations DepartmentChicago Bridge & Iron Company10200 Grogan's Mill Road,Suite 300The Woodlands, TX 77380 USA
Annual MeetingChicago Bridge & Iron CompanyN.V.'s Annual Meeting ofShareholders will be held at 2 p.m.local time on May 8, 2003, at theAmstel Inter-ContinentalAmsterdam in Amsterdam, The Netherlands.
Independent Public AccountantsDeloitte & ToucheP.O. Box 581101040 HC AmsterdamThe Netherlands
Web SiteInformation about CB&I, includingan archive of new releases, productinformation, and access to SEC fil-ings, is available from theCompany's Web site atwww.chicagobridge.com.
Media InquiriesCorporate CommunicationsTel: 1-832-513-1111
Investor InquiriesInvestor RelationsTel: 1-832-513-1245Email: [email protected]
Brought to you by Global Reports