innovation in bakery and cereals 2010
DESCRIPTION
aetswTRANSCRIPT

1
Innovation in Bakery and Cereals
Emerging markets, key trends and future product innovation Reference Code: BI00012-025
Publication Date: December 2010

2
About the author Business Insights has a team of in-house consumer goods analysts drawn from consulting, R&D and
competitive intelligence backgrounds. Our analysts specialize in providing detailed insight into the future of
the industry and have extensive analytical, forecasting and research experience in the food & drinks,
ingredients and packaging sectors. Our team maintains regular contact with industry executives to track
market developments and base their market models on a wide range of proprietary databases to provide up
to date, accurate strategic insight on the future of the consumer goods market.
Disclaimer Copyright © 2010 Business Insights Ltd
This report is published by Business Insights (the Publisher). This report contains information from reputable
sources and although reasonable efforts have been made to publish accurate information, you assume sole
responsibility for the selection, suitability and use of this report and acknowledge that the Publisher makes
no warranties (either express or implied) as to, nor accepts liability for, the accuracy or fitness for a particular
purpose of the information or advice contained herein. The Publisher wishes to make it clear that any views
or opinions expressed in this report by individual authors or contributors are their personal views and
opinions and do not necessarily reflect the views/opinions of the Publisher.

3
Table of Contents
About the author 2
Disclaimer 2
Executive summary 11
Market drivers and resistors 11 Growth opportunities in bakery and cereals 12 Innovations and NPD in bakery and cereals 13 Key trends and product examples 14
Chapter 1 Introduction 15
What is this report about? 15 The market defined 16 Report structure 19
Chapter 2 Market drivers 20
Summary 20 Introduction 21 Mature markets 22 Competitive pressures 22 Economic recession 22 Raw materials prices 23 Tightening of health regulations 24
Growing sophistication of consumer demand 25 Ethical consumerism 26 Shift to mass customization 28 Requirements for better targeting and credibility 32
Immature markets 33 Socioeconomic drivers 33 Middle class expansion 33 Smaller households 35

4
The increasing proportion of women in the labor force 36
Impact on consumption 38 Emergence of premium bakery and cereals 38 Changes in consumption patterns 39
Chapter 3 Growth opportunities in the bakery and cereals market 40
Summary 40 Introduction 41 Bakery and cereals market overview 41 Value by geography 42 Market value by country 43 Market value by category 45 Value by sub-category 47 The bakery and cereals market in Europe 52 The bakery and cereals market in the Americas 53 The bakery and cereals market in Asia-Pacific 56 Emerging markets for bakery and cereals 58 Russia 58
Mexico 59
Brazil 60
China 60
India 60
Chapter 4 Innovation and NPD in bakery and cereals 61
Summary 61 Introduction 61 Innovation type 62 Regional analysis 63 Europe 65
Asia-Pacific 69
North America 72

5
Category analysis 76 Cookies 78
Breakfast cereals 80
Bread and rolls 82
Cakes and pastries 83
Crackers 86
Cereal bars 88
Morning goods 90
Packaging analysis 93 The changing position of bakery and cereal products 94 Flavor trends 96
Chapter 5 Key trends and product examples 98
Summary 98 Introduction 99 Health and wellness 99 Using healthy ingredients found in other food categories 99 Probiotics 99 Energy bakery and cereal products 100
Targeting niche markets 101 Gluten-free products 101 Alternative-sweetener-based bakery and cereals 102
Wellness ingredients 106 Plant sterols 106 Palm oil – the new alternative to hydrogenated oils 107 Whole grains 108 Use of fruits and superfoods 110
Weight management 112 Portion control 112 Satiety products 113
Private label 115 Sustainability 116

6
Packaging developments 116
Provenance 118
Indulgence 120 Tiers of premiumization 120
Key trends in indulgence 121
Chapter 6 Conclusions 123
Five key trends for the future 123 1 - Alternative natural sweeteners 123
2 - Whole grains and healthier ingredients 123
3 - Indulgence in developed and developing markets 124
4 – Crossover with other product categories 124
5 - Provenance 124

7
Table of figures Figure 1: US wheat prices ($ per metric ton), 2005-2010 23 Figure 2: Premiumization in mature bakery and cereals markets 25 Figure 3: Number of farmers’ markets in the US, 1994-2010 27 Figure 4: The growth of online grocery retail – UK market 29 Figure 5: Mymuesli website 30 Figure 6: Me & Goji custom artisanal cereal website 31 Figure 7: Marketing health – the increased importance of specificity and credibility 32 Figure 8: Trends in global middle class growth 33 Figure 9: Global bakery and cereals market value ($bn), 2009–14 42 Figure 10: Top 10 bakery and cereal markets, by value ($bn), 2009–14 45 Figure 11: Global bakery and cereals market value, by category (%), 2009 and 2014 47 Figure 12: Growth in top 10 bakery and cereals sub-categories, CAGR (%) 2009–14 51 Figure 13: Emerging bakery and cereal markets, by value ($bn), 2009–14 59 Figure 14: Share of new product launches by innovation type (%), 2007–10 63 Figure 15: Share of new product launches by region (%), 2007–10 64 Figure 16: Share of top 10 countries in NPD in Europe (%), 2007–10 65 Figure 17: Share of products launched in Europe, by category (%), 2007–10 67 Figure 18: Food For Life's Ezekiel 4:9 Sprouted 100% Whole Grain Bread 69 Figure 19: Share of products launched in Asia-Pacific (%), by category, 2007–10 70 Figure 20: Sunfeast Marie Light Oats biscuits 71 Figure 21: Share of products launched in North America (%), by category, 2007–10 73 Figure 22: Hot-Kid Organic Toddler Mum-Mum caramel flavored rice biscuits 75 Figure 23: Share of new bakery and cereal launches, by category (%), 2007 and 2010 77 Figure 24: Lotte's Margaret Five Grains Black Cookie 78 Figure 25: Sentir Bem Biscoito Integral 80 Figure 26: Ik Wil Bolletje Brod in de Melk breakfast cereal 81 Figure 27: Woolworths sandwich bread 83 Figure 28: Nestlé's Toll House Ready to Bake Brownie Limited Edition Fudgy Brownies 86 Figure 29: Kashi's Heart to Heart Whole Grain Crackers 88 Figure 30: Mareblu Naturals' Premium Crunch Bar Strawberry Pomegranate Trail Mix 90 Figure 31: Vitalicious' VitaTops Muffin Tops 91

8
Figure 32: Isabella's Healthy Bakery Activate Probiotic Raisin Bran enriched muffins 92 Figure 33: Kellogg's Frosted Flakes space-saving cereal box 94 Figure 34: Attune's All Natural Digestive Health Probiotic Granola Munch 100 Figure 35: Isostar Pulse Easy Power cereal bars 101 Figure 36: Vitalin Racao Humana Quinoa e Amaranto 102 Figure 37: GrandyOats Goji Agave Organic Granola 103 Figure 38: Granix Cereal Free 104 Figure 39: Nickanedit Gluten-free Chocolate Torte a la Cocoa Gourmet Dessert 105 Figure 40: Kashi's Heart to Heart Whole Grain Crackers 107 Figure 41: Coppenrath's Diatgenuss Wiener Sandringe cookies 108 Figure 42: Wasa's Whole Grain Crispbread 109 Figure 43: Carrefour's Musli cu Fructe 110 Figure 44: New England Naturals' Organic Granola – Antioxidant and Gluten-Free variants 111 Figure 45: Doctor in the Kitchen's Flax Seed Crackers, packaging and nutrition information 112 Figure 46: FullBar - 100% Natural Bar - Cinnamon Roll 113 Figure 47: Otsuka Soyjoy Snack Bar – strawberry variant 114 Figure 48: Gardenia's Slim 'n Fit Wheaten Bread 114 Figure 49: Share of private labels in new product launches (%), 2007–10 115 Figure 50: Casino's Sans Gluten Tartines Craquantes Riz et Mais 116 Figure 51: Pure NRG's Fresh Baked Vegan Nutrition Chia Breakfast Bar 117 Figure 52: Immaculate Baking's Dark Chocolate Biscotti Crunch 118 Figure 53: Sustainability and provenance bringing in wider values of health and exclusivity 119 Figure 54: Tiers of premiumization in food and drinks 120 Figure 55: Key trends in indulgence 121

9
Table of tables Table 1: Definition of bakery and cereal categories 16 Table 2: Middle class population size (m) & share of global total (%), 2009-2030 34 Table 3: Average household size by selected countries, (number of people), 1990–2015 36 Table 4: Proportion of labor force which is female (%), 1990-2015 37 Table 5: Global bakery and cereals market value ($bn), 2009–14 41 Table 6: Global bakery and cereals market shares, by geography ($bn), 2009–14 43 Table 7: Top 10 bakery and cereals markets, by value ($bn), 2009–14 44 Table 8: Global bakery and cereals market value, by category (%), 2009 and 2014 46 Table 9: Global bakery and cereals market value, by category and sub-category ($bn), 2009–14
49 Table 10: European bakery and cereals market value ($bn), by category and sub-category,
2009–14 52 Table 11: Americas bakery and cereals market value ($bn), by category and sub-category,
2009–14 54 Table 12: Asia-Pacific bakery and cereals market value ($bn), by category and sub-category,
2009–14 57 Table 13: Share of new product launches (%), by innovation type, 2007–10 62 Table 14: Share of new product launches, by region (%), 2007–10 64 Table 15: Share of products launched in Europe (%), by category, 2007–10 66 Table 16: Top 10 claims made by bakery and cereal products launched in Europe, 2007–10 68 Table 17: Share of products launched in Asia-Pacific (%), by category, 2007–10 69 Table 18: Top 10 claims made by bakery and cereal products launched in Asia-Pacific, 2007–10
71 Table 19: Share of products launched in North America (%), by category, 2007–10 72 Table 20: Top 10 claims made by bakery and cereal products launched in North America, 2007–
10 74 Table 21: Share of new bakery and cereal launches, by category (%), 2007 and 2010 76 Table 22: Top 10 claims for cookies (%), 2007–10 79 Table 23: Share of new breakfast cereals launches by regions (%), 2007 and 2010 81 Table 24: Top 10 claims for breads and rolls (%), 2007–10 82 Table 25: Share of new cakes and pastries launches, by region, 2007 and 2010 84

10
Table 26: Top 20 claims for cakes and pastries (%), 2007–10 85 Table 27: Top 10 claims for crackers (%), 2007–10 87 Table 28: Top 10 flavors for crackers (%), 2007–10 89 Table 29: Share of new morning goods launches (%), by region, 2007 and 2010 90 Table 30: Top 10 pack types for new bakery and cereal launches (%), 2007–10 93 Table 31: Top 20 claims for new bakery and cereals launches (% of products with claims),
2007–10 95 Table 32: Top 20 flavors for new product introductions (% of bakery and cereal product
launches), 2007 and 2010 97

11
Executive summary
Market drivers and resistors Regulatory and consumer awareness campaigns promoting the health benefits of baked goods
and cereals that are largely made from whole grains have increased new product development
(NPD) in healthier products.
Tighter health claims regulation in Europe will restrict the development of functional bakery and
cereals products. However, this will also create opportunity for companies looking to capitalize on
this precarious market niche.
Rising consumer demand for 100% natural and organic foods has increased NPD in bakery and
cereals that are free from artificial additives.
The combination of longer working and commuting hours has increased consumer demand for
convenient yet nutritional meal alternatives, such as ready-to-bake or ready-to-eat cereals and
baked goods.
Emulating the mass customization initiatives of foodservice chains, bakery and cereals
manufacturers are trying harder to involve consumers in choosing the ingredients used in their
products through novel distribution channels, such as the internet.

12
Growth opportunities in bakery and cereals The global bakery and cereals market was worth $358bn in 2009, an increase of 3.2% over 2008.
Business Insights forecast this market to grow at a compound annual growth rate (CAGR) of
3.4% to reach $423bn in 2014.
Europe was the largest market for bakery and cereals in 2009, worth $165bn, and is forecast to
grow at a CAGR of 2.3% to reach $185bn in 2014. As part of the staple diet for European
consumers, bread will continue to drive demand for baked goods in the region.
The top 10 countries together accounted for over 65.6% of the global bakery and cereals market
by value in 2009, with the US being the largest market, worth $60bn.
Bread and rolls is the largest bakery and cereals category, $179bn in 2009 and forecast to grow
at a CAGR of 2.3% to reach $201bn in 2014. This expansion will be primarily driven by increased
demand for products that fall under the artisanal and industrial bread and rolls sub-categories.
India is a low value but high growth country. With more middle class consumers working longer
hours, breakfast cereals provide a convenient option as a breakfast. As a consequence it will be
the fastest growing category in India, although per capita consumption will still be very low.

13
Innovations and NPD in bakery and cereals Among all new product launches during 2007–10, only 0.5% were innovative. Innovations in
formulation accounted for 83.3% of all innovations in bakery and cereals in 2010, an increase of
15.1 percentage points over 2007.
Europe accounted for 43.2% of all new product launches in bakery and cereals in 2010, an
increase of 9.4 percentage points over 2007.
The majority of NPD has taken place in the cookies category over 2007–10, which accounted for
34.5% of new launches globally in 2010.
Packaging innovation has taken a back seat, with little significant development since 2008. Boxes
have been the most commonly used packaging for bakery and cereals products launched over
2007–10.
Chocolate has continued to dominate among all flavors since 2007, with a share of 9.6% in 2010,
but there is a growing trend of dual and fused flavors, such as chocolate vanilla and strawberry
banana.

14
Key trends and product examples Manufacturers’ growing focus on reducing fat, sodium and sugar in bakery and cereals has led to
the development of trans-fat-free products, calorie-counted portion packs and the further
fortification of baked goods and cereals with nutritious ingredients such as whole grains.
Regulatory pressures in developed markets such as Europe, which require bakery and cereals
manufacturers to provide sufficient evidence for functional claims, are driving the use of
ingredients found in rival categories, such as dairy products and soft drinks. By using established
ingredients such as prebiotics, probiotics and guarana, companies are avoiding having to conduct
new and expensive research and development.
Bakery and cereals manufacturers are targeting niche segments such as children, and health-
cautious and ailing consumers by offering healthier alternatives such as low calorie sweeteners,
superfoods and gluten-free products.
Innovations in packaging are being driven by sustainability and the potential of recyclable and
biodegradable materials to help limit environmental impact.
The ‘natural’ tag is increasingly being used for new product launches, to display product
characteristics such as traditional and authentic ingredients.

15
Chapter 1 Introduction
What is this report about? The global bakery and cereals market was worth $358bn in 2009, an increase of 3.2% over 2008. The
market will grow at a CAGR of 3.4% over 2009–14 to reach a value of $423bn in 2014. Emerging markets
such as Mexico, Russia, Brazil, China and India will play a pivotal role in the development of the bakery and
cereals industry, driven by the growing influence of Western culture, a rising demand for staple foods, and a
growing acceptance of alternative forms of bakery and cereals as opposed to traditional meal products. In
Europe and the US, meanwhile, the growing demand for bakery and cereals is primarily being driven by
health conscious and time-constrained consumers.
This report contains a summary of the important and novel bakery and cereal products launched between
June 2006 and May 2010, as reported by Product Launch Analytics, an in-house database of new product
launches in the fast moving consumer goods industry. This allows the analysis of innovation and NPD by
region and category. In addition, market data on the value growth of the bakery and cereals market is
examined and emerging market trends are highlighted, thereby enabling manufacturers to identify key
growth opportunities.

16
The market defined Within this report, the bakery and cereals market is segmented into seven categories:
Table 1: Definition of bakery and cereal categories
Categories Definition
Bread and rolls
Artisanal bread and rolls Bread products produced by small local bakeries. Associated with the fundamentals of the age-old bread-making tradition with greater attention to ingredients and the baking process.
Industrial bread and rolls Pre-packed industrially manufactured bread products generally made at dedicated premises and sold through retail outlets. For example Warburton's, Hovis and Sara Lee.
In-store bakery Bakery products sold through non-specialist stores that have been baked or semi-baked ('finished off') at the point of sale.
Breakfast cereals Hot cereals Breakfast cereal that requires heating before consumption.
Includes traditional products (e.g. porridge oats), instant mixes (e.g. Ready Brek), and ready-to-heat products (e.g. Quaker Instant Oatmeal Express)
Ready-to-eat cereals Breakfast cereal that does not require heating. Includes dry cereals and prepackaged cereal/milk kits (e.g. Kellogg's Cornflakes and Weetabix).
Cakes & pastries Artisanal cakes & pastries Cakes and pastries produced by small local bakeries for sale on
the premises. Excludes morning goods. Industrial cakes & pastries Pre-packed industrially manufactured cakes and pastries generally
made at dedicated premises and sold through retail outlets (e.g. Mr Kipling cakes, Entenmann's cakes). Excludes frozen cakes and pastries, and morning goods.
In-store bakery Cakes and pastries sold through non-specialist stores that have been baked or semi-baked ('finished off') at the point of sale. Excludes morning goods.

17
Categories Definition Cookies (sweet biscuits) American cookies A small, usually flat and crisp biscuit made from sweetened dough
(e.g. Maryland cookies, Chips Ahoy!). Artisanal cookies Cookies produced by small local bakeries for sale on the premises. Assortments Variety boxes usually packaged in metal tins. Examples include
Veno's Danish butter biscuits and Delacre Assorted Biscuits. Butter-based cookies Products that position themselves as butter-based (e.g. Leibniz
Butter) or as shortbread (e.g. Walker's Shortbread). Chocolate cookies Products coated with chocolate on one or both sides, such as
chocolate digestives. Only includes products sold in the cookie section of retail outlets: product lines such as Kit-Kat are excluded.
Cream filled A cream-based filling sandwiched between two cookies and not coated in chocolate (e.g. Custard Creams, Oreos).
In-store bakery Cookies sold through non-specialist stores that have been baked or semi-baked ('finished off') at the point of sale.
Plain cookies Also known as 'semi-sweet.' Slightly sweet crackers made with whole-wheat flour (e.g. McVities' Digestives, Keebler Graham crackers).
Wafer biscuits A light, sweet product slightly thicker than a wafer, with a creamy filling (e.g. Manner).
Other cookies All other sweet biscuit products. Crackers (savory biscuits)
Bread substitutes Dry, thin, crisp biscuits generally used as an alternative to bread, also known as dry wafers (e.g. Ryvita).
Cheese-flavored crackers Cheese-flavored savory biscuits of any kind (e.g. Cheez-It, Cheddars).
Plain crackers Hard, dry savory biscuits, generally hard or crisp. Can be salted, such as Ritz, or unsalted such as Jacobs' Cream Crackers. Does not include cheese flavored crackers.
Other crackers All savory biscuits other than cheese, plain crackers, and bread substitutes.

18
Categories Definition Morning goods Artisanal morning goods Breakfast bakery products created by small local bakeries.
Includes bagels, croissants (plain and flavored), donuts, muffins, and scones. Excludes Danish pastries.
Industrial morning goods Pre-packed industrially manufactured breakfast bakery products generally made at dedicated premises and sold through retail outlets. Includes bagels, croissants (plain and flavored), donuts, muffins, and scones. Excludes frozen products and Danish pastries.
In-store bakery Breakfast bakery products sold through non-specialist stores that have been baked or semi-baked ('finished off') at the point of sale. Includes bagels, croissants (plain and flavored), donuts, muffins, and scones. Excludes frozen products and Danish pastries.
Cereal bars Sports and energy bars Bars made from a mixture of cereals, fruits and active ingredients
for performance enhancement bound together by syrup and designed specifically for active consumers.
Granola/muesli bars Bars made from a mixture of cereals, fruits and nuts bound together by syrup.
Other bars All other cereal bars.
Source: Business Insights BUSINESS INSIGHTS

19
Report structure The chapters of this report are structured as follows:
Introduction – report overview and methodology.
Market drivers – highlighting the factors that are influencing consumer demand and helping to
drive and restrict NPD in the bakery and cereals industry.
Growth opportunities in bakery and cereals – review of market value by region, country and
category, with market projections to 2014 (using 2009 as the base year), including an evaluation
of growth potential.
Innovation and NPD – review of innovation by category, region and type. This chapter also
identifies flavor trends and analyzes the use of key product tags on product packaging.
Key trends – overview of emerging trends within the bakery and cereals market.
Conclusions – summary of key trends and future opportunities within the bakery and cereals
market.

20
Chapter 2 Market drivers
Summary Regulatory and consumer awareness campaigns promoting the health benefits of baked goods
and cereals that are largely made from whole grains have increased new product development
(NPD) in healthier products.
Tighter health claims regulation in Europe will restrict the development of functional bakery and
cereals products. However, this will also create opportunity for companies looking to capitalize on
this precarious market niche.
Rising consumer demand for 100% natural and organic foods has increased NPD in bakery and
cereals that are free from artificial additives.
The combination of longer working and commuting hours has increased consumer demand for
convenient yet nutritional meal alternatives, such as ready-to-bake or ready-to-eat cereals and
baked goods.
Emulating the mass customization initiatives of foodservice chains, bakery and cereals
manufacturers are trying harder to involve consumers in choosing the ingredients used in their
products through novel distribution channels, such as the internet.

21
Introduction Broadly speaking there are two distinct sections of the global bakery and cereals market: mature and
immature markets. With stark differences in their level of development, the driving forces for each can be
quite different. As a staple product, bakery and cereals have reached a level of saturation in many markets.
In these areas manufacturers are under pressure to add value to their products and appeal to the growing
sophistication of consumer demand. In immature markets there are fundamental socio-economic shifts which
serve as the primary influencers of change.
Mature markets
o Competitive pressures
Economic recession
Wheat prices
Tightening of health regulations
o Growing sophistication of consumer demand
Ethical consumerism
Shift to mass customization
Requirements for better targeting and credibility
Immature markets
o Socioeconomic forces
Middle class expansion
Smaller households
Growing female workforce

22
o Impact on consumption
Changing consumption patterns
Emergence of premium bakery and cereals
Mature markets
Competitive pressures
In mature markets, there are a wide range of internal competitive pressures as well as changes in consumer
behavior and lifestyles which are currently influencing the bakery and cereals market. The core pressures
include the recent recession, rising raw material price increases and tightening health regulations.
Economic recession
Given the maturity of Western consumer goods markets, the recent economic downturn represented the key
threat to overall market growth. European and US demand for many products contracted in the immediate
aftermath of the financial crisis towards the end of 2008. However, unlike many consumer areas, the bakery
and cereals market has been relatively well insulated against the impact of the recession. Product categories
classed as ‘essentials’, such as bread, breakfast cereals have proved resilient, helped by a downward
movement in prices from their 2008 peak.
In some cases, where consumers have traded down from foodservice – such as eating out or buying
takeaway food, products that offer a sense of indulgence or luxury have actually benefited: a good example
of this is premium ready meals. At the same time, in some markets artisanal bread or more premium cereals
have also seen growth as consumers cut back on more conspicuous luxuries but indulge on groceries
brought into the home.

23
Raw materials prices
The rising cost of staples such as corn, rice and wheat since June 2010 has raised fears of a global food
crisis, with even the US government warning of “dramatically” lower supplies. The US is the world’s largest
corn grower and its exports make up the majority of global trade in the grain. The USDA had forecast a
record corn crop for 2010 but unfavorable heat and heavy rains forced a re-evaluation of yields. Wheat
prices have soared following poor harvests in several countries, including Russia and Brazil, while heavy rain
in Canada and Europe damaged the production of many grain and oilseed crops through 2010. Commodities
prices are forecast to continue to rise through the next few years, but are not expected to reach 2008 levels.
Nevertheless, combined with the effects of the recession, food manufacturers are under mounting
competitive pressures and this has already brought an impact to food prices on supermarket shelves. In the
bakery and cereals market this leaves companies particularly vulnerable to the threat of private-label.
Figure 1: US wheat prices ($ per metric ton), 2005-2010
100
150
200
250
300
350
400
450
500
Dec
05
Mar
06
Jun
06
Sep
06
Dec
06
Mar
07
Jun
07
Sep
07
Dec
07
Mar
08
Jun
08
Sep
08
Dec
08
Mar
09
Jun
09
Sep
09
Dec
09
Mar
10
Jun
10
Sep
10
Mar
ket p
rice
per t
on ($
)
Average
100
150
200
250
300
350
400
450
500
Dec
05
Mar
06
Jun
06
Sep
06
Dec
06
Mar
07
Jun
07
Sep
07
Dec
07
Mar
08
Jun
08
Sep
08
Dec
08
Mar
09
Jun
09
Sep
09
Dec
09
Mar
10
Jun
10
Sep
10
Mar
ket p
rice
per t
on ($
)
Average
Source: International Monetary Fund BUSINESS INSIGHTS

24
The impact of rising wheat prices in developed markets will be clear: there will be consumer demand for
budget products that help mitigate the impact of rising prices. At the same time, manufacturers will seek to
add value to bakery and cereals products as a way increasing prices and maintaining margins.
Manufacturers with no clear price positioning between budget and premium products will suffer.
Tightening of health regulations
Functional bakery and cereals manufacturers in Europe are awaiting the full impact of impending health
claim legislation. According to the Article 13 of the Nutrition and Health Claims made on Foods Regulation,
the European Food Safety Authority (EFSA) will evaluate all claims other than those referring to “the
reduction of disease risk and to children’s development and health". This article states that all functional
claims made by manufacturers on the label of their products must be supported by appropriate evidence.
This regulation requires companies to provide data to support:
The role of a nutrient or substance and its effects on the functioning of the body;
Possible benefits to psychological and behavioral functions;
Products that claim to increase satiety, reduce weight and offer energy to consumers.
EFSA’s recommendations will be used by the European Commission to form the foundation of necessary
legislative measures, with a ‘positive list’ of permitted claims. Although this overall process has been delayed
due to the large number of claims submitted, the net result will be the same - more stringent health claim
regulation will force food manufacturers to invest in research and development in order to prove new claims.
Tighter regulations may be particularly damaging for private label manufacturers with higher R&D costs
threatening the price point advantage associated with such products. Moreover, the positive list of functional
health claims will restrict manufacturers to using only those claims that have already been approved. This will
lead to a decrease in flavor innovation and a subsequent decline in innovative product introductions in this
market.

25
While it will be difficult for manufacturers to launch foods and beverages with functional claims in Europe,
such product launches will be much more straight-forward in other parts of the world. Although regulations
are present in other developed markets, such as the US and Japan, they are not as stringent as in Europe.
Competition will intensify in the US and Japan with industry leaders trying to increase revenues to
compensate for difficulties in Europe.
Growing sophistication of consumer demand
The growing sophistication of consumers ensures that the demand for greater choice, particularly in value-
added products continues to be a key driver of product innovation.
Figure 2: Premiumization in mature bakery and cereals markets
• Mass customization• Premium ingredients• New flavor combinations
• Organic and artisanal• Focus on ingredients• Simple
• Made with love• Ethical as safe
• New occasions• Competition with confectionery
• Performance management• Weight management• Credible health claims
• With fruit and vegetables• Alternative healthy formats
Indulgence
Ethical & sustainable
Healthy
Convenient
Source: Business Insights BUSINESS INSIGHTS

26
Ethical consumerism
The bakery and cereals market is, inevitably, being influenced by the growing ethical awareness among
consumers. Across a wider range of product categories, consumer interest in the sourcing and
manufacturing process is growing – and not only for more premium products. The pervasive belief that
ethical products are ‘better for you’ is also filtering down into mainstream products and creating opportunities
in natural and organic foods to target health conscious consumers.
Sustainability
Environmental concerns are driving ethical awareness among consumers, with manufacturers taking greater
measures to reduce their environmental footprint. These not only involve reductions in packaging waste, but
also include cutting the resources and energy used in the manufacturing process. One controversial issue
central to the bakery and cereal market is intensive farming, characterized by the high inputs of capital,
labor, or heavy usage of technologies such as pesticides and chemical fertilizers relative to land area.
The sensitivity to such farming techniques was seen recently with the incorporation of palm oil in bakery and
cereals as an alternative to the harmful hydrogenated oils. In 2009, the World Wildlife Fund (WWF) warned
manufacturers about the importance of sustainability after the production of palm oil was found to have had a
huge environmental impact in South Asia, where forests were being cleared to make way for more
plantations. Promoting sustainability has become a key – and in some cases almost mainstream - marketing
tool being used by bakery and cereal manufacturers. Production methods, along with the provenance of
ingredients, are prominently highlighted on product packaging to emphasize the amount of care that has
been taken in overall production process. In December 2009, Unilever, the world's largest user of palm oil for
food, cleansers and cosmetics, canceled its $32.6m supply contract with Sinar Mas after independently
verifying a 2008 Greenpeace report implicating the Indonesian palm oil provider in rainforest destruction.
Moreover, the company also pledged to use only certified sustainable palm oil by 2015 without passing on
any added costs to consumers.

27
Local sourcing
In the wider food and drinks industry there has been an increased focus on the source and supply chain of
food and drinks. The increasing significance of sustainability and local sourcing to consumers can be seen in
the continued growth of farmers’ markets, both in Europe and North America. New markets appear regularly,
and existing markets—some well over a century old—are enjoying somewhat of a revival.
Figure 3: Number of farmers’ markets in the US, 1994-2010
0
1,000
2,000
3,000
4,000
5,000
6,000
7,000
1994 1996 1998 2000 2002 2004 2006 2008 2009 2010
Num
ber o
f far
mer
s’m
arke
ts
+249%4,377 more farmers’ markets
0
1,000
2,000
3,000
4,000
5,000
6,000
7,000
1994 1996 1998 2000 2002 2004 2006 2008 2009 2010
Num
ber o
f far
mer
s’m
arke
ts
+249%4,377 more farmers’ markets
Source: USDA-AMS-Marketing Services Division BUSINESS INSIGHTS
The importance of local sourcing is crucial to the bakery and cereals market, given the growth of the
supermarket and hypermarket retailing as a share of grocery sales in developed markets. Sales of bread
products supermarkets have risen at the expense of local bakers – but across all channels ‘artisanal bread
and rolls’ continue to represent the largest sub-category by value in the global bakery and cereals market.
This is an interesting paradox, because as consumers continue to challenge the ethical credentials of the
products they buy, the “artisanal” nature of supermarket bakeries will come under some scrutiny. Already, in
countries such as France, artisanal bakers are seeking to emphasize the true artisanal nature of their
products. The challenge for major manufacturers and the supermarkets is to introduce more artisanal

28
qualities, and proper artisanal credentials, into the products they sell. One example of this is UK retailer
Waitrose’s agreement with legendary baker Poilâne to sell artisanal sourdough loaves – a move which dates
as far back as 2002. At the same time, several other UK retailers, including market leader Tesco, are
creating “local produce” programs to mitigate concerns that they are not sufficiently sensitive to local
concerns around the survival of small scale food producers.
Shift to mass customization
Another key trend is the shift towards mass customization. Although this is still a minor trend at present,
mass customization is becoming a more mainstream tool for manufacturers to encourage consumer
engagement in their products. In particular, there are two areas in which consumers are being given the
chance to actively select particular products or product features and interact with their food more:
Interactive online product sales;
Cereal kits.
More bakery and cereal manufacturers are using the internet as a platform for consumers to customize their
diet and order products that are delivered directly to their home. The internet has given companies such as
Nature's Path the ability to allow the consumer to customize the meals they receive (to some extent) and at
the same time, provide nutritious, gourmet meals that consumers do not always have time to prepare. This
process is also designed to increase consumer loyalty and encourage repeat purchasing. The figure below
provides a clear example the fast growth of the online grocery channel. In the UK, forecast growth over the
period 2000-2014 is nearly 2000%, and from a tiny base the online market will capture over 5% of total
grocery sales. This familiarization with online grocery shopping, both its convenience and, increasingly,
additional benefits (such as the store remembering your regular purchases) underpins the use of the online
channel for mass customization efforts in food.

29
Figure 4: The growth of online grocery retail – UK market
0%
1,000%
2,000%
Overall grocery Online grocery
62.3%
1,924.9%
0%
1%
2%
3%
4%
5%
6%
2000 2014
0.4%
5.2%
Forecast market growth, 2000-2014Online retail share of grocery market
0%
1,000%
2,000%
Overall grocery Online grocery
62.3%
1,924.9%
0%
1%
2%
3%
4%
5%
6%
2000 2014
0.4%
5.2%
0%
1%
2%
3%
4%
5%
6%
2000 2014
0.4%
5.2%
Forecast market growth, 2000-2014Online retail share of grocery market
Source: Verdict Research BUSINESS INSIGHTS
However, there have been notable failures also: General Mills introduced mycereal.com in 2001 to allow
consumers to mix up their own cereals. This service has since been discontinued. In 2007, Kellogg’s
launched Coco Pops Creations in the UK, a new 'pick n mix' cereal targeted at children, in the UK. The
product came with a choice of four different cereal shapes and sizes (Coco Pops, Crunchers, Coco Rocks
and Mega Munchers), and allowed children to mix and match according to their preference. However, in
February 2010 Kellogg’s announced it would pull Coco Pops creations as part of an exercise to pare back its
ranges. The message is clear: while consumers want customization, customization alone is not enough. At
the moment, the additional costs implied by customization can only support true premium products.
Examples of online, customized retailers include:
Breakfast cereals: MyMuesli; MeAndGoji.com;
Custom energy bars: Element Bars; YouBar.

30
Mymuesli
www.mymuesli.com was the first platform worldwide that allowed consumers the option of choosing the
ingredients that they wanted and then to purchase the final product online. Launched in 2007 in Germany, it
allows consumers to choose from 80 ingredients to create their combinations. The ingredients on offer
include eccentric and exotic ingredients such Tibetan goji berries, cedar nuts and jelly babies. Additionally,
consumers can also name their creation.
Figure 5: Mymuesli website
Source: Mymuesli website BUSINESS INSIGHTS

31
Me & Goji
A similar website was introduced in the US in 2008 called Me & Goji. Targeted at consumers who have strict
dietary requirements, such as athletes, the ingredients are stamped as US Department of Agriculture
(USDA) certified, to reinforce the brand’s health credentials. In addition to naming the cereal, the site also
allows consumers to upload their picture. Moreover, the store also has a range of pre-mixed cereals
available in gluten-free and energy varieties to cater to health conscious consumers.
Figure 6: Me & Goji custom artisanal cereal website
Source: Meandgoji BUSINESS INSIGHTS

32
Requirements for better targeting and credibility
EFSA’s impact manufacturers’ use health claims in Europe will be profound. Elsewhere, however,
manufacturers have also had to reevaluate health claims. For example, Danone has come under scrutiny in
the US for claims made against some of its probiotic products. Even with these changes, some terms – such
as “natural” are used heavily to the point of becoming almost generic. Changing consumer expectations and
a harsher regulatory landscape will drive development on two fronts: specificity and credibility of claims. Of
the two, credibility of health claims will be more important. Soft claims will have to become even softer to the
point of being both vague and generic and in many cases will be rejected by consumers. By contrast, R&D-
supported, more credible health claims will allow manufacturers to mine niches and develop proprietary
positionings, although the specificity of the benefit – will determine how quickly products commoditize.
Figure 7: Marketing health – the increased importance of specificity and credibility
Credibility
Spec
ifici
ty
Lack of credibility: needs further R&D
Credible and specific:Opportunities to mine
niche and develop proprietary positioning
and/or ingredients
Credible, but possibly vulnerable to
commoditization
Generic soft claims, increasingly rejected
as credible
Credibility
Spec
ifici
ty
Lack of credibility: needs further R&D
Credible and specific:Opportunities to mine
niche and develop proprietary positioning
and/or ingredients
Credible, but possibly vulnerable to
commoditization
Generic soft claims, increasingly rejected
as credible
Source: Business Insights BUSINESS INSIGHTS

33
Immature markets The rapid pace of economic development of many countries in Asia and South America will have a massive
impact on consumption patterns. Across these emerging markets, urban populations are rising; more women
are entering the workforce; the emerging middle classes are driving consumption of more sophisticated,
premium products.
Socioeconomic drivers
The single most important factor influencing the development of immature markets is the rise in disposable
incomes and the growth of the middle class.
Middle class expansion
The rise in disposable income in the newer economies is closely allied to the development of the middle
class. As economies have developed and moved from a situation of primarily export-led growth to one in
which industries develop to feed domestic consumer demand, increasing numbers of the population have
been able to move up into the middle classes, with a corresponding rise in income and consumption.
Figure 8: Trends in global middle class growth
Middle class expansion in Asia particularly China and India
Current/futureMiddle class expansion in Asia particularly China and India
Current/futureWorld's middle class concentrated in Europe, North America & Japan
Pre 1970’sWorld's middle class concentrated in Europe, North America & Japan
Pre 1970’s
Rising GDP/disposable income
Rising GDP/disposable income
Convert savings to consumptionConvert savings to consumption
Expanding global middle classExpanding global middle class
Brazil, South Korea, Mexico and Argentina built sizeable middle-class populations
1970’s-1980’sBrazil, South Korea, Mexico and Argentina built sizeable middle-class populations
’sMiddle class expansion in Asia particularly China and India
Current/futureMiddle class expansion in Asia particularly China and India
Current/futureMiddle class expansion in Asia particularly China and India
Current/futureMiddle class expansion in Asia particularly China and India
Current/futureWorld's middle class concentrated in Europe, North America & Japan
Pre 1970’sWorld's middle class concentrated in Europe, North America & Japan
Pre 1970’sWorld's middle class concentrated in Europe, North America & Japan
Pre 1970’sWorld's middle class concentrated in Europe, North America & Japan
Pre 1970’s
Rising GDP/disposable income
Rising GDP/disposable income
Convert savings to consumptionConvert savings to consumption
Expanding global middle classExpanding global middle class
Rising GDP/disposable income
Rising GDP/disposable income
Rising GDP/disposable income
Rising GDP/disposable income
Convert savings to consumptionConvert savings to consumptionConvert savings to consumptionConvert savings to consumption
Expanding global middle classExpanding global middle classExpanding global middle classExpanding global middle class
Brazil, South Korea, Mexico and Argentina built sizeable middle-class populations
1970’s-1980’sBrazil, South Korea, Mexico and Argentina built sizeable middle-class populations
’sBrazil, South Korea, Mexico and Argentina built sizeable middle-class populations
1970’s-1980’sBrazil, South Korea, Mexico and Argentina built sizeable middle-class populations
’s
Source: Business Insights BUSINESS INSIGHTS

34
In China and India middle class expansion is most marked, although in other areas, such as South America,
Russia and East European countries there have also been significant increases in disposable income.
The OECD’s definition of middle class is households with daily expenditure between $10 and $100 per
person in purchasing power parity terms. It estimates that there were 1.8bn people in the global middle class
in 2009. Europe has the highest share of the global middle class population at 36%, with North America on
18% as shown below. In both cases, these account for almost all the entire population of the region. The
largest opportunity is Asia-Pacific, where 28% of the global middle class, lives amounting to 525m people –
or less than a quarter of the region’s total population. Over the next 10 years, the OECD forecasts that 1.2bn
people in the Asia-Pacific region will be born into or move into the global middle class. This represents the
largest single expansion in consumer spending power ever recorded, with the number of global middle class
consumers increasing by 75% between 2009-2020 due to rising incomes in India, China, Indonesia, and
across the region. Although relatively poorer, the number of middle class consumers in Africa is nonetheless
forecast to almost double between 2009–20, representing further opportunities.
Table 2: Middle class population size (m) & share of global total (%), 2009-2030
2009 2020 2030 Actual
(m) Share Actual
(m) Share Actual
(m) Share
North America 338 18% 338 10% 332 7%Europe 664 36% 706 22% 680 14%Central & South America 181 10% 251 8% 313 6%Asia-Pacific 525 28% 1,740 54% 3,228 66%Sub-Saharan Africa 32 2% 57 2% 107 2%Middle East North Africa 105 6% 165 5% 234 5%Overall 1,845 100% 3,257 100% 4,894 100%
Source: OECD Development Centre BUSINESS INSIGHTS

35
In ten years' time, the proportion of the global middle classes living in the traditional western markets of
North America and Europe will have fallen from over half in 2009 to less than one-third, as the proportion
living in Asia-Pacific increases to 54% and onto 66% by 2030.
Smaller households
Another feature of the rising levels of disposable income in emerging markets is the decreasing size of the
average household. Globally, the number of people living alone has increased from 153.5m in 1996 to
202.6m in 2006. The trend to small or single person households reflects economic and cultural standards.
Living alone is more expensive than sharing; there is a direct correlation between wealth and the proportion
of people living alone. Smaller households are more likely to buy more expensive or premium products for
three reasons:
A great likelihood of buying convenience and single serve foods which tend to be premium
priced;
Fewer members of household, invariably children, to support hence a greater discretionary
income;
People are far more likely to buy premium goods for themselves or their partner than children.
Research undertaken in the UK in 2007 found that 81% of shoppers will buy premium products
for themselves, 60% will buy for their partner but only 26% would buy premium products for their
children.
The table below shows the change in the average household size from 1990 to 2015 in a range of significant
economies.

36
Table 3: Average household size by selected countries, (number of people), 1990–2015
1990 2000 2010 2015 est. % change 1990-2015 Brazil 4.04 3.2 2.82 2.74 -32%China 3.87 3.4 2.97 2.82 -27%Germany 2.31 2.19 2.11 2.09 -10%India 5.76 5.49 5.3 5.28 -8%Japan 2.78 2.71 2.71 2.71 -3%Spain 3.2 2.89 2.82 2.82 -12%United Kingdom 2.43 2.39 2.17 2.09 -14%United States 2.61 2.5 2.44 2.44 -6%
Source: Business Insights BUSINESS INSIGHTS
Even in highly westernized societies where this trend has been evident since the 1970s the average
household size continues to fall by around ten percent (the only exception being Japan, estimated to fall by
just 3% over this 25 year period). In many of the developing economies, illustrated here by Brazil and China,
household size is falling rapidly.
The increasing proportion of women in the labor force
The table below shows the percentage of the workforce which is female in a selection emerging markets. In
all countries, except for Russia, China and India, the female proportion of the labor force has increased
significantly since 1990 and continues to increase, most markedly in Brazil (from 32% in 1990 to an
estimated 44% in 2015) and Argentina (28% to 42%). In China and India, it is the equivalent rapid growth in
the number of males in the workforce that has kept the proportion of females unchanged rather than a lack of
growth in the absolute number of women working.

37
Table 4: Proportion of labor force which is female (%), 1990-2015
% 1990 2000 2010 2015 est. Argentina 28.4 38.9 41.9 42.5Brazil 32.1 40.8 44.1 44.7Chile 30.5 33.4 37.1 38.3China 44.8 45.6 45.9 45.8Columbia 37.7 43.8 46.7 47.0India 27.6 27.9 28.6 29.2Mexico 30.0 33.2 37.0 38.8Russia 48.5 48.4 49.9 50.1Saudi Arabia 11.2 12.9 16.0 17.3South Africa 41.9 43.9 45.5 45.8
Source: Business Insights BUSINESS INSIGHTS
The impact of a greater proportion of women working outside the home is well documented. The pressure of
combining work, family life and / or social life means there is less time for cooking and a trend towards
convenience. Women, who continue to be the main grocery shoppers, have been increasingly the source of
the money that they are spending in the supermarket. This and the fact that (until the economic downturn),
there was more money to spend in the supermarket, has led to an increasing comfort with, and desire to
‘trade up’ beyond the products that would have previously been purchased.

38
Impact on consumption
Emergence of premium bakery and cereals
These socioeconomic factors are leading to the emergence of premium bakery and cereals in immature
markets. While the nature of premiumization in western countries post-recession is one of concerned
consumerism, with an interest in health, provenance and even conspicuous altruism, in the developing
countries the more traditional consumer motivations of luxury, indulgence, and conspicuous consumption
dominate.
The effect of the economic and social factors – rising income, smaller households, more women working –
represent the major forces leading to increased demand for more premium products, but other specific
consumer issues have been important:
Continued increase in sophistication of tastes resulting from a higher frequency of eating out; a
greater number of, and variety in, restaurants and takeaways offering food from different cultures,
and increasing foreign travel;
Allied with the above, an increase in food as status; a ‘badge’ to indicate how sophisticated /
refined / knowledgeable one is;
An increased interest in cooking and entertaining. Food has become of much greater interest, as
evidenced by the growth in cooking magazines, cookery books, gastronomy or cooking based
holidays and, more than all else, the rise of the TV chef genre;
Concerns with food safety and production values. In stark contrast to the 1970s and early 1980s
when highly processed foods were embraced for their modernity and time-saving qualities, a
series of concerns has led to a willingness to pay more for food whose quality can be assured.

39
Changes in consumption patterns
While increased wealth and the rising demand for premium products is driving NPD in immature markets,
manufacturers are also being led by the growing influence of Western culture. This has particular
significance in the bakery and cereals market which consists of product categories that are generally
associated with the West. In Asia, the market for bakery and cereals is increasing as consumption patterns
continue to westernize. In India, the popularity of breakfast cereals is expected to continue to increase over
the coming years, with major participants being multinationals such as Kellogg's, Quaker Oats (owned by
PepsiCo), Bagrry's, and Mohan Meakins Limited. China is a good example of the extent of these changes.
In China, although 60% of the population still lives in rural areas, the 40% that reside in its cities (World
Bank, 2008) have embraced many of the consumer behaviour traits seen in Europe and North America.
Harnessing this growth, China hosted Bakery China Expo in 2008, a major exhibition in the country’s
economic hub, Shanghai, which attracted local suppliers and participants along with a growing international
contingent of exhibitors. There are a number of key factors driving the bakery and cereals market in China:
Chinese consumers are starting to eat bread for breakfast instead of traditional rice porridge and meat
buns because they think bread is a better complement to milk and is also a healthy item;
Unpackaged/artisan bread in China is increasingly being sold in hypermarkets and bakery stores;
Western lifestyles and the expanding snacking culture is increasing demand for packaged/industrial
bread in China. Whole-wheat sandwich and white are the two most popular varieties of packaged bread;
most Chinese consumers prefer soft white bread to hard bagels or baguettes. Whole-wheat sandwich
bread is popular among older and young female consumers due to its health benefits;
Green tea and fruit-flavored breads are also growing in popularity. Children and teenagers are the main
consumers of flavored bread.

40
Chapter 3 Growth opportunities in the bakery and cereals market
Summary The global bakery and cereals market was worth $358bn in 2009, an increase of 3.2% over 2008.
Business Insights forecast this market to grow at a compound annual growth rate (CAGR) of
3.4% to reach $423bn in 2014.
Europe was the largest market for bakery and cereals in 2009, worth $165bn, and is forecast to
grow at a CAGR of 2.3% to reach $185bn in 2014. As part of the staple diet for European
consumers, bread will continue to drive demand for baked goods in the region.
The top 10 countries together accounted for over 65.6% of the global bakery and cereals market
by value in 2009, with the US being the largest market, worth $60bn.
Bread and rolls is the largest bakery and cereals category, $179bn in 2009 and forecast to grow
at a CAGR of 2.3% to reach $201bn in 2014. This expansion will be primarily driven by increased
demand for products that fall under the artisanal and industrial bread and rolls sub-categories.
India is a low value but high growth country. With more middle class consumers working longer
hours, breakfast cereals provide a convenient option as a breakfast. As a consequence it will be
the fastest growing category in India, although per capita consumption will still be very low.

41
Introduction This chapter analyzes the value growth projections of the global bakery and cereals market during the period
2010–14. It provides an overview of the major markets for bakery and cereals and analyzes the performance
of the categories and sub-categories within the sector. Additionally, this chapter also highlights the growth
opportunities available to bakery and cereal manufacturers in emerging markets.
Bakery and cereals market overview The global bakery and cereals market was worth $358bn in 2009, an increase of 3.2% over 2008. Business
Insights forecasts the market to grow at a CAGR of 3.4% over 2009–14 to reach $423bn in 2014. Increasing
consumer sophistication in mature markets and socio-economic shifts in emerging markets will drive demand
for bakery and cereals.
Table 5: Global bakery and cereals market value ($bn), 2009–14
2009 2010 2011 2012 2013 2014 CAGR
2009–14Market value ($bn) 358.1 369.9 382.2 395.1 408.6 422.8 Growth rate 3.3% 3.3% 3.4% 3.4% 3.5% 3.4%
Source: Business Insights BUSINESS INSIGHTS

42
Figure 9: Global bakery and cereals market value ($bn), 2009–14
320
340
360
380
400
420
440
2009 2010 2011 2012 2013 2014
Mar
ket s
ize
($bn
)
1%
2%
3%
4%
Gro
wth
rate
(%)
Market Value Growth Rate
Year end December 31, 2009.
320
340
360
380
400
420
440
2009 2010 2011 2012 2013 2014
Mar
ket s
ize
($bn
)
1%
2%
3%
4%
Gro
wth
rate
(%)
Market Value Growth Rate
320
340
360
380
400
420
440
2009 2010 2011 2012 2013 2014
Mar
ket s
ize
($bn
)
1%
2%
3%
4%
Gro
wth
rate
(%)
Market Value Growth Rate
Year end December 31, 2009.
Source: Business Insights BUSINESS INSIGHTS
Value by geography Although Europe and the Americas represent the largest markets in the bakery and cereals industry by
value, Asia-Pacific will have the fastest growth rate, a CAGR of 6.6% during 2009–14. Growth in Asia-Pacific
will be driven by the following factors:
Rising disposable income and middle class expansion;
Increasing exposure to Western culture and dietary habits.

43
In particular, Asia-Pacific’s expanding middle class will create strong demand for premium/gourmet bakery
and cereals. The Middle East and Africa region will have the second highest growth rate, a CAGR of 4.8%,
to reach a market size of $21bn in 2014.
Table 6: Global bakery and cereals market shares, by geography ($bn), 2009–14
Region 2009 2010 2011 2012 2013 2014 CAGR
2009–14Europe 165.0 168.6 172.4 176.4 180.5 184.7 2.3%Americas 118.8 122.2 125.8 129.5 133.3 137.3 2.9%Asia-Pacific 58.0 61.9 66.0 70.3 75.0 80.0 6.6%Middle East and Africa 16.3 17.2 18.0 18.9 19.8 20.7 4.8%Total 358.1 369.9 382.2 395.1 408.6 422.8 3.4%
Source: Business Insights BUSINESS INSIGHTS
Market value by country The top 10 countries together accounted for 65.6% of the global bakery and cereals market value in 2009,
with the US being the largest market, worth $60bn. The US will continue to be the largest market for bakery
and cereals, growing at a CAGR of 2.9% during 2009–14.

44
Table 7: Top 10 bakery and cereals markets, by value ($bn), 2009–14
Country 2009 2010 2011 2012 2013 2014 CAGR
2009–14United States 59.7 61.4 63.1 65.0 66.9 69.0 2.9%China 23.1 25.4 27.9 30.8 33.9 37.3 10.1%Germany 31.5 32.0 32.5 33.1 33.6 34.1 1.6%Russia 27.3 28.3 29.4 30.5 31.8 33.1 3.9%Mexico 15.7 16.3 17.0 17.7 18.3 19.0 3.9%Brazil 20.2 20.8 21.4 22.0 22.6 23.2 2.8%Italy 16.8 17.1 17.4 17.7 18.0 18.3 1.7%United Kingdom 15.6 16.1 16.5 17.0 17.5 18.0 2.9%France 13.3 13.5 13.6 13.7 13.8 14.0 0.9%Japan 13.2 13.3 13.5 13.7 13.8 13.9 1.1%Rest of the world 121.7 125.7 129.8 134.1 138.5 142.9 3.3%Total 358.1 369.9 382.2 395.1 408.6 422.8 3.4%
Source: Business Insights BUSINESS INSIGHTS
China and Japan are the only two Asian countries that make it into the list of the top 10 bakery and cereals
markets. From a market value of $23bn in 2009, China will grow at a CAGR of 10.1% during 2009–14 (the
highest among all of the top 10 countries) to become the second most valuable national market with a value
of $37bn in 2014.

45
Figure 10: Top 10 bakery and cereal markets, by value ($bn), 2009–14
0
10
20
30
40
50
60
70
80
US
Ger
man
y
Rus
sia
Chi
na
Bra
zil
Italy
Mex
ico
UK
Fran
ce
Japa
n
Mar
ket s
ize
($bn
)
0%1%2%3%4%5%6%7%8%9%10%11%
CA
GR
(200
9–14
)
Year end December 2009.
2009 Additional value in 2014 CAGR 2009–14
0
10
20
30
40
50
60
70
80
US
Ger
man
y
Rus
sia
Chi
na
Bra
zil
Italy
Mex
ico
UK
Fran
ce
Japa
n
Mar
ket s
ize
($bn
)
0%1%2%3%4%5%6%7%8%9%10%11%
CA
GR
(200
9–14
)
Year end December 2009.
2009 Additional value in 2014 CAGR 2009–142009 Additional value in 2014 CAGR 2009–14
Source: Business Insights BUSINESS INSIGHTS
Market value by category Bakery and cereals comprises seven different categories: bread and rolls; cakes and pastries; cookies;
breakfast cereals; morning goods; crackers; and cereal bars. Bread and rolls is the largest category, $179bn
in 2009. The category is forecast to reach $201bn in 2014, growing at a CAGR of 2.3% through 2009–14,
with artisanal bread and rolls being the largest sub-category in value terms. Stated below are some of the
factors that will drive demand for bread and roles:
Increasing demand for handmade and fresh bread and rolls led by sophistication in consumer
preference in matured markets;

46
Shift away from traditional breakfasts in Asia-Pacific towards more bread-based breakfasts; and
Smaller households is driving demand for industrial bread and rolls in immature markets.
The cakes and pastries category was worth $65bn in 2009 and will outperform the overall industry growth
rate (with a CAGR of 5.2%, during 2009–14) to reach $84bn in 2014. Countries such as Japan will be one of
the major contributors to this growth, due to high consumption and acceptance of cakes in the region. Cereal
bars, many of which are positioned as healthy and/or convenient, will be the fastest growing category
growing at a CAGR of 5.3% during 2009–14 to reach a market value of $9bn.
Table 8: Global bakery and cereals market value, by category (%), 2009 and 2014
Category 2009 2010 2011 2012 2013 2014 CAGR
2009–14Bread & rolls 178.6 182.6 186.8 191.2 195.7 200.4 2.3%Cakes & pastries 64.9 68.1 71.6 75.4 79.4 83.7 5.2%Cookies 44.9 46.5 48.2 49.9 51.6 53.5 3.6%Breakfast cereals 28.5 29.7 31.0 32.3 33.6 35.0 4.2%Morning goods 17.4 18.0 18.6 19.2 19.9 20.6 3.4%Crackers 16.8 17.5 18.2 18.9 19.6 20.4 3.9%Cereal bars 7.01 7.42 7.83 8.25 8.66 9.08 5.3%Total 358.1 369.9 382.2 395.1 408.6 422.8 3.4%
Source: Business Insights BUSINESS INSIGHTS

47
Figure 11: Global bakery and cereals market value, by category (%), 2009 and 2014
49.9% 47.4%
18.1% 19.8%
12.5% 12.6%8.0% 8.3%4.9% 4.9%4.7% 4.8%2.0% 2.1%
0%
10%
20%
30%
40%
50%
60%
70%
80%
90%
100%
2009 2014
Mar
ket v
alue
by
cate
gory
200
9 &
201
4 (%
)
Bread & rolls Cakes & pastries Cookies Breakfast cereals
Morning goods Crackers Cereal bars
Year end is December 2009.
Note: Legend depicts categories from bottom to top
49.9% 47.4%
18.1% 19.8%
12.5% 12.6%8.0% 8.3%4.9% 4.9%4.7% 4.8%2.0% 2.1%
0%
10%
20%
30%
40%
50%
60%
70%
80%
90%
100%
2009 2014
Mar
ket v
alue
by
cate
gory
200
9 &
201
4 (%
)
Bread & rolls Cakes & pastries Cookies Breakfast cereals
Morning goods Crackers Cereal bars
Year end is December 2009.
Note: Legend depicts categories from bottom to top Source: Business Insights BUSINESS INSIGHTS
Value by sub-category Artisanal bread and rolls is the largest sub-category of the total bakery and cereals market. Worth $98bn in
2009, it is forecast to grow at a CAGR of 2.3% during 2009–14 to reach a value of $105bn. Some of the
main factors driving this sub-category are as follows:
Innovations in new flavors and ingredient combinations;
Locally sourced ingredients and a more ethical, sustainable and authentically artisanal
positioning;

48
Use of particularly nutritional ingredients, such as rye and spelt;
Awareness campaigns by government bodies such as the FDA on the benefits of whole grains.
In-store bread and rolls will see the highest level of growth within the bread and rolls category at a CAGR of
3.8%, to reach a market value of $21bn in 2014. Future demand will be mainly driven by higher consumption
by “grab and go” consumers. With a CAGR of 7.1% during the period 2009–14, artisanal cookies will see the
fastest growth within the bakery and cereals market and will be worth around $1.4bn in 2014. Sports and
energy bars will equal the growth of artisanal cookies and reach a market value of $4bn in 2014.
Increasingly, consumers are snacking on sports and energy bars to:
Get an energy enhancement;
Stave off hunger;
Get a healthier snack and help manage their weight; and
Feel healthier – where they are buying products with functional ingredients.

49
Table 9: Global bakery and cereals market value, by category and sub-category ($bn), 2009–14
Category/subcategory 2009 2010 2011 2012 2013 2014 CAGR
2009–14Bread & rolls 178.6 182.6 186.8 191.2 195.7 200.4 2.3%Artisanal bread & rolls 98.3 99.6 100.9 102.2 103.6 105.0 1.3%Industrial bread and rolls 62.8 64.9 67.1 69.4 71.9 74.4 3.5%In-store bakery 17.5 18.1 18.8 19.5 20.2 21.0 3.8%Cakes & pastries 64.9 68.1 71.6 75.4 79.4 83.7 5.2%Industrial cakes & pastries 30.0 31.7 33.6 35.7 37.9 40.4 6.2%Artisanal cakes & pastries 20.6 21.5 22.3 23.2 24.2 25.1 4.0%In-store bakery 14.3 15.0 15.7 16.5 17.3 18.2 5.0%Cookies 44.9 46.5 48.2 49.9 51.6 53.5 3.6%Plain cookies 7.5 7.9 8.3 8.7 9.1 9.6 4.9%Butter-based cookies 7.3 7.6 7.9 8.3 8.6 9.0 4.3%Chocolate cookies 7.6 7.8 7.9 8.1 8.3 8.4 2.0%Cream filled 5.4 5.6 5.8 6.0 6.2 6.4 3.3%American cookies 4.7 4.9 5.0 5.2 5.4 5.6 3.4%Wafer biscuits 4.5 4.6 4.7 4.9 5.0 5.1 2.7%Assortments 3.4 3.5 3.6 3.8 3.9 4.0 2.9%Other cookies 3.2 3.3 3.4 3.5 3.6 3.7 3.3%Artisanal cookies 1.0 1.1 1.1 1.2 1.3 1.4 7.1%In-store bakery 0.2 0.2 0.3 0.3 0.3 0.3 4.2%Breakfast cereals 28.5 29.7 31.0 32.3 33.6 35.0 4.2%Ready-to-eat cereals 24.9 26.0 27.1 28.2 29.4 30.7 4.3%Hot cereals 3.6 3.7 3.9 4.0 4.2 4.3 3.8%Morning goods 17.4 18.0 18.6 19.2 19.9 20.6 3.4%Industrial morning goods 8.6 8.9 9.3 9.7 10.0 10.5 4.1%Artisanal morning goods 4.8 4.9 5.1 5.3 5.5 5.7 3.6%In-store bakery 4.1 4.1 4.2 4.3 4.4 4.4 1.7%

50
Category/subcategory 2009 2010 2011 2012 2013 2014 CAGR 2009–14
Crackers 16.8 17.5 18.2 18.9 19.6 20.4 3.9%Plain crackers 6.5 6.7 7.0 7.2 7.5 7.8 3.8%Cheese-flavored crackers 5.1 5.3 5.5 5.7 6.0 6.2 4.1%Bread substitutes 2.8 2.9 3.0 3.1 3.2 3.3 3.7%Other crackers 2.5 2.6 2.7 2.8 2.9 3.1 4.2%Cereal bars 7.0 7.4 7.8 8.2 8.7 9.1 5.3%Sports and energy bars 2.5 2.6 2.8 3.1 3.3 3.5 7.1%Other bars 2.5 2.7 2.9 3.0 3.2 3.3 5.5%Granola/muesli bars 2.0 2.1 2.1 2.2 2.2 2.3 2.6%Total 358.1 369.9 382.2 395.1 408.6 422.8 3.4%
Source: Business Insights BUSINESS INSIGHTS

51
Figure 12: Growth in top 10 bakery and cereals sub-categories, CAGR (%) 2009–14
1.3%
3.5%
6.2%
5%
4.1%
2%
4%
4.3%
3.8%
4.9%
0 10 20 30 40 50 60 70 80 90 100
Artisanal bread and rolls
Industrial bread and rolls
Industrial cakes and pastries
Ready-to- eat cereals
Artisanal cakes and pastries
In-store bakery bread and rolls
In-store bakery cakes and pastries
Industrial morning goods
Chocolate cookies
Plain cookies
Market size 2009 ($bn)
0% 1% 2% 3% 4% 5% 6% 7%
CAGR 2009–14 (%)
2009 CAGR 2009–14
Year end December 31, 2009.
1.3%
3.5%
6.2%
5%
4.1%
2%
4%
4.3%
3.8%
4.9%
0 10 20 30 40 50 60 70 80 90 100
Artisanal bread and rolls
Industrial bread and rolls
Industrial cakes and pastries
Ready-to- eat cereals
Artisanal cakes and pastries
In-store bakery bread and rolls
In-store bakery cakes and pastries
Industrial morning goods
Chocolate cookies
Plain cookies
Market size 2009 ($bn)
0% 1% 2% 3% 4% 5% 6% 7%
CAGR 2009–14 (%)
2009 CAGR 2009–14
1.3%
3.5%
6.2%
5%
4.1%
2%
4%
4.3%
3.8%
4.9%
0 10 20 30 40 50 60 70 80 90 100
Artisanal bread and rolls
Industrial bread and rolls
Industrial cakes and pastries
Ready-to- eat cereals
Artisanal cakes and pastries
In-store bakery bread and rolls
In-store bakery cakes and pastries
Industrial morning goods
Chocolate cookies
Plain cookies
Market size 2009 ($bn)
0% 1% 2% 3% 4% 5% 6% 7%
CAGR 2009–14 (%)
2009 CAGR 2009–142009 CAGR 2009–14
Year end December 31, 2009.
Source: Business Insights BUSINESS INSIGHTS

52
The bakery and cereals market in Europe Bread and rolls is the largest category in Europe, with artisanal bread and rolls accounting for the biggest
share within this category. Worth $59bn in 2009, artisanal bread and rolls are forecasted to grow at just 0.6%
CAGR in Europe, to reach $61bn in 2014. Cereal bars consumption in Europe, will have the highest growth
rate of all categories, at a CAGR of 6.9%, to reach a market value of $3.1bn in 2014, up from $2.2bn in
2009. This growth will be powered by consumers switching to healthier and convenient products.
Table 10: European bakery and cereals market value ($bn), by category and sub-category, 2009–14
Category/subcategory 2009 2010 2011 2012 2013 2014 CAGR
2009–14Bread & rolls 105.9 107.7 109.6 111.5 113.6 115.8 1.8%Artisanal bread & rolls 58.9 59.2 59.6 59.9 60.3 60.8 0.6%Industrial bread and rolls 37.3 38.4 39.6 40.8 42.1 43.5 3.1%In-store bakery 9.7 10.0 10.4 10.8 11.2 11.6 3.5%Cookies 19.5 20.1 20.7 21.4 22.0 22.7 3.1%Butter-based cookies 3.8 4.0 4.2 4.3 4.5 4.7 4.0%Chocolate cookies 4.3 4.3 4.4 4.4 4.5 4.6 1.4%Cream filled 2.4 2.5 2.6 2.7 2.8 2.9 3.3%Plain cookies 2.2 2.3 2.4 2.4 2.5 2.6 3.4%Wafer biscuits 1.6 1.7 1.8 1.9 1.9 2.0 4.3%Assortments 1.7 1.8 1.8 1.9 1.9 1.9 2.2%American cookies 1.5 1.6 1.6 1.7 1.8 1.9 4.4%Other cookies 1.3 1.4 1.4 1.4 1.5 1.5 2.8%Artisanal cookies 0.4 0.4 0.4 0.4 0.4 0.4 4.1%In-store bakery 0.1 0.2 0.2 0.2 0.2 0.2 5.1%Cakes & pastries 17.5 18.0 18.5 19.0 19.4 20.0 2.7%Industrial cakes & pastries
7.9 8.1 8.3 8.6 8.8 9.0 2.7%
Artisanal cakes & pastries 7.1 7.2 7.4 7.5 7.7 7.9 2.2%In-store bakery 2.6 2.7 2.8 2.9 3.0 3.1 3.6%

53
Category/subcategory 2009 2010 2011 2012 2013 2014 CAGR 2009–14
Breakfast cereals 8.6 8.9 9.2 9.5 9.9 10.2 3.4%Ready-to-eat cereals 7.6 7.8 8.1 8.4 8.6 8.9 3.4%Hot cereals 1.1 1.1 1.1 1.2 1.2 1.3 3.6%Morning goods 6.8 7.0 7.2 7.3 7.5 7.7 2.5%Industrial morning goods 3.0 3.1 3.2 3.3 3.4 3.5 2.9%Artisanal morning goods 2.9 2.9 3.0 3.1 3.1 3.2 2.1%In-store bakery 0.9 0.9 1.0 1.0 1.0 1.0 2.5%Crackers 4.4 4.5 4.7 4.8 5.0 5.2 3.4%Plain crackers 1.8 1.9 1.9 2.0 2.0 2.1 2.9%Cheese-flavored crackers 1.2 1.3 1.3 1.4 1.4 1.5 3.8%Other crackers 0.7 0.8 0.8 0.8 0.8 0.9 3.0%Bread substitutes 0.6 0.6 0.6 0.7 0.7 0.7 4.4%Cereal bars 2.29 2.46 2.64 2.82 3.01 3.19 6.9%Sports and energy bars 0.94 1.03 1.12 1.21 1.3 1.39 8.1%Other bars 0.85 0.93 1.01 1.08 1.16 1.24 7.8%Granola/muesli bars 0.49 0.51 0.52 0.53 0.54 0.56 2.7%Total 165.0 168.6 172.4 176.4 180.5 184.7 2.3%
Source: Business Insights BUSINESS INSIGHTS
The bakery and cereals market in the Americas As in Europe, bread and rolls is the largest category in the Americas, with a market value of $47bn in 2009.
Sales of bread and rolls will reach $52bn in 2014, a CAGR of 2.1% over the five year period. Although a
mature and highly saturated market, growth in artisanal bread and rolls category will still be almost three
times the rate of that in Europe.

54
Sales of morning goods will rise from $10bn in 2009 to $12bn in 2014, growing at a CAGR of 3.8% during
2009–14. Artisanal morning goods will have the highest growth within this category, recording a CAGR of
5.8% during 2009–14 to reach a market value of $2bn.
Breakfast cereals and cereal bars will be the two fastest growing categories in the Americas, with a forecast
CAGR of 4.3% over 2009–14. Sales of healthier products have been supported by the launch of products
with higher fruit or nut contents. Sports and energy cereal bars will be the fastest growing sub-category in the
Americas, with a CAGR of 6.4% during 2009–14, to reach $1.5bn.
Table 11: Americas bakery and cereals market value ($bn), by category and sub-category, 2009–14
Category/subcategory 2009 2010 2011 2012 2013 2014 CAGR
2009–14Bread & rolls 46.6 47.6 48.6 49.6 50.7 51.8 2.1%Artisanal bread & rolls 28.4 28.8 29.2 29.6 30.0 30.4 1.4%Industrial bread and rolls 14.4 14.8 15.2 15.7 16.2 16.8 3.1%In-store bakery 3.8 4.0 4.1 4.3 4.5 4.6 3.9%Cakes & pastries 18.2 18.8 19.5 20.2 20.8 21.6 3.4%Industrial cakes & pastries
9.4 9.7 10.0 10.4 10.7 11.1 3.4%
In-store bakery 6.5 6.6 6.8 7.0 7.2 7.5 2.9%Artisanal cakes & pastries 2.4 2.5 2.6 2.8 2.9 3.0 4.6%Breakfast cereals 16.6 17.3 18.1 18.9 19.7 20.5 4.3%Ready-to-eat cereals 14.7 15.3 16.0 16.7 17.5 18.2 4.5%Hot cereals 2.0 2.0 2.1 2.1 2.2 2.3 3.1%

55
Category/subcategory 2009 2010 2011 2012 2013 2014 CAGR 2009–14
Cookies 15.6 16.0 16.3 16.7 17.1 17.4 2.2%Plain cookies 3.1 3.2 3.3 3.4 3.5 3.6 2.8%Cream filled 2.2 2.2 2.3 2.3 2.3 2.4 1.9%Butter-based cookies 2.0 2.1 2.1 2.2 2.3 2.3 2.4%Chocolate cookies 2.0 2.1 2.1 2.1 2.2 2.2 1.6%American cookies 1.8 1.8 1.9 1.9 1.9 2.0 1.9%Wafer biscuits 1.7 1.7 1.7 1.8 1.8 1.8 1.6%Other cookies 1.4 1.4 1.5 1.5 1.6 1.6 3.2%Assortments 1.0 1.1 1.1 1.1 1.1 1.2 2.3%Artisanal cookies 0.3 0.3 0.3 0.3 0.3 0.3 1.9%In-store bakery 0.1 0.1 0.1 0.1 0.1 0.1 2.3%Morning goods 9.7 10.0 10.4 10.8 11.2 11.6 3.8%Industrial morning goods 5.0 5.2 5.5 5.7 6.0 6.3 4.5%In-store bakery 3.1 3.1 3.1 3.2 3.2 3.3 1.3%Artisanal morning goods 1.6 1.7 1.8 1.9 2.0 2.1 5.8%Crackers 8.3 8.6 8.8 9.1 9.4 9.7 3.2%Plain crackers 3.4 3.5 3.6 3.7 3.9 4.0 3.6%Cheese-flavored crackers 2.4 2.4 2.5 2.6 2.7 2.7 3.1%Bread substitutes 1.7 1.8 1.8 1.9 2.0 2.0 3.1%Other crackers 0.8 0.9 0.9 0.9 0.9 0.9 2.2%Cereal bars 3.7 3.9 4.1 4.2 4.4 4.6 4.3%Other bars 1.5 1.5 1.6 1.7 1.7 1.8 4.1%Sports and Energy bars 1.1 1.2 1.3 1.4 1.4 1.5 6.4%Granola/muesli bars 1.1 1.2 1.2 1.2 1.2 1.3 2.2%Total 118.8 122.2 125.8 129.5 133.3 137.3 2.9%
Source: Business Insights BUSINESS INSIGHTS

56
The bakery and cereals market in Asia-Pacific The Asia-Pacific bakery and cereals market is growing rapidly. Between 2009 and 2014, it with increase from
$58bn in 2009 to $80bn in 2014, a CAGR of 6.6%. Growth is between two and three times that of Europe
and the Americas.
Cakes and pastries is the largest category in Asia-Pacific. It will grow at a CAGR of 7.8% to reach 42bn in
2014, from $29bn in 2009. The market is dominated China and Japan. In China, especially, many
consumers are moving to more western-based diets and also seeking more convenient products to eat out of
the home. At the same time, manufacturers have sought to introduce more exotic flavors and flavor
combinations while still retaining an essentially Chinese flavor to the products.
Led by rising demand in India, artisanal cookies will see growth of (13.9%), although this will remain a
relatively small sector in terms of total value ($0.6bn in 2014).

57
Table 12: Asia-Pacific bakery and cereals market value ($bn), by category and sub-category, 2009–14
Category/subcategory 2009 2010 2011 2012 2013 2014 CAGR
2009–14Cakes & pastries 28.6 30.7 33.1 35.6 38.4 41.5 7.8%Industrial cakes & pastries 12.6 13.8 15.2 16.6 18.3 20.2 9.8%Artisanal cakes & pastries 10.9 11.4 12.0 12.6 13.2 13.9 5.1%In-store bakery 5.1 5.5 5.9 6.4 6.9 7.5 8.0%Bread & rolls 13.1 13.8 14.4 15.1 15.8 16.5 4.6%Industrial bread and rolls 6.7 7.0 7.4 7.7 8.1 8.4 4.5%Artisanal bread & rolls 4.9 5.1 5.4 5.7 5.9 6.2 4.8%In-store bakery 1.3 1.4 1.5 1.5 1.6 1.7 4.3%Cookies 8.6 9.2 9.7 10.4 11.0 11.7 6.5%Plain cookies 1.7 1.9 2.1 2.3 2.5 2.8 10.4%Butter-based cookies 1.3 1.4 1.5 1.6 1.8 1.9 7.8%American cookies 1.4 1.4 1.5 1.5 1.6 1.7 4.1%Chocolate cookies 1.2 1.3 1.3 1.4 1.4 1.5 4.1%Wafer biscuits 1.1 1.1 1.2 1.2 1.2 1.2 1.9%Cream filled 0.6 0.7 0.7 0.8 0.8 0.9 7.1%Assortments 0.6 0.6 0.7 0.7 0.7 0.8 5.3%Artisanal cookies 0.3 0.4 0.4 0.5 0.5 0.6 13.9%Other cookies 0.3 0.3 0.3 0.3 0.4 0.4 4.1%In-store bakery 0.01 0.01 0.01 0.01 0.01 0.01 5.1%Crackers 3.9 4.1 4.4 4.6 4.9 5.2 5.9%Cheese-flavored crackers 1.4 1.5 1.6 1.7 1.8 1.9 5.9%Plain crackers 1.2 1.3 1.4 1.4 1.5 1.6 5.6%Other crackers 0.9 0.9 1.0 1.1 1.1 1.2 6.7%Bread substitutes 0.4 0.4 0.4 0.4 0.5 0.5 4.7%Breakfast cereals 2.6 2.8 3.0 3.1 3.3 3.5 5.7%Ready-to-eat cereals 2.2 2.3 2.4 2.6 2.7 2.8 5.5%Hot cereals 0.5 0.5 0.5 0.6 0.6 0.6 6.6%

58
Category/subcategory 2009 2010 2011 2012 2013 2014 CAGR 2009–14
Morning goods 0.7 0.8 0.8 0.9 0.9 1.0 6.7%Industrial morning goods 0.4 0.5 0.5 0.5 0.6 0.6 6.6%Artisanal morning goods 0.2 0.2 0.2 0.2 0.3 0.3 7.0%In-store bakery 0.1 0.1 0.1 0.1 0.1 0.1 6.4%Cereal bars 0.7 0.7 0.8 0.8 0.8 0.9 5.1%Other bars 0.3 0.3 0.3 0.3 0.4 0.4 6.5%Sports and Energy bars 0.3 0.3 0.3 0.3 0.3 0.3 4.0%Granola/muesli bars 0.1 0.1 0.2 0.2 0.2 0.2 2.7%Total 58.0 61.9 66.0 70.3 75.0 80.0 6.6%
Source: Business Insights BUSINESS INSIGHTS
Emerging markets for bakery and cereals Figure 13 below shows the top 10 emerging markets for bakery and cereals. Apart from the BRIC nations,
which are potential areas, Mexico and Brazil are expected to have good performance in this industry.
Russia
Worth $27bn in 2009, the Russian bakery market will reach $33bn in 2014, driven by factors such as higher
consumer purchasing power. While local products currently dominate the market, demand for Western
European and US-style upscale products is on the rise. Foreign manufacturers such as Kellogg’s and Fazer
have started to strategically acquire dominant local companies since 2007 in order to penetrate the market

59
Figure 13: Emerging bakery and cereal markets, by value ($bn), 2009–14
China
BrazilMexico
Saudi Arabia
Turkey
PolandArgentina
India
Chile
Russia
0%
2%
4%
6%
8%
10%
12%
0 5 10 15 20 25 30
Market size 2009 ($bn)
CA
GR
200
9–14
(%)
China
BrazilMexico
Saudi Arabia
Turkey
PolandArgentina
India
Chile
Russia
0%
2%
4%
6%
8%
10%
12%
0 5 10 15 20 25 30
Market size 2009 ($bn)
CA
GR
200
9–14
(%)
Source: Business Insights BUSINESS INSIGHTS
Mexico
Mexico is another emerging market for bakery and cereals and is poised to grow at a CAGR of 3.9% to
reach a market value of $19bn in 2014, up from $16bn in 2009. Some of the major reasons for this growth
are:
Higher numbers of women in the workforce, leading to lesser mealtime occasions and more
families eating bread-based products;
Increase in the per capita consumption due to higher disposable income of families; and
Changes in consumption patterns among younger Mexicans with an increased preference for
baked goods.

60
Brazil
The Brazilian bakery and cereals market was worth $20bn in 2009, and is forecast to reach a market value
of $23bn in 2014, at a CAGR of 2.8%. Despite the GDP growth and increasing purchasing power, inflation
and rising raw material prices have driven a number of Brazilian consumers to trade down to lower priced
products, fuelling demand for private label products. The breakfast cereals category will have the highest
growth over 2009–14, with a forecast CAGR of 9.1% and projected sales of $23bn in 2014.
China
The bakery and cereals market in China is undergoing rapid growth, with a forecast CAGR of 10.1% 2009-
14, to grow from $23bn to $37bn in 2014. Although 60% of Chinese consumers still live in rural areas, many
urban consumers have started replacing traditional rice and meat buns for breakfast with breads, which are
regarded as healthier and more readily associated with milk. Additionally, the introduction of traditional-flavor
such as green tea in bread to cater to the younger consumers has contributed to the growth in demand for
the product in China.
India
India is a low value but high growth country. The Indian market stood at $4bn in 2009, but is forecast to have
the highest growth among the emerging markets, at a CAGR of 10.9% during 2009–14, to reach a market
value of $7bn. A large number of innovations have been focused on introducing health and wellness
products. Breakfast cereals are becoming generally accepted, relative to more traditional forms of breakfast.
With more middle class consumers working longer hours, breakfast cereals provide a convenient option as a
breakfast. As a consequence it will be the fastest growing category in India, although per capita consumption
will still be very low. Cereals will reach a market value of $0.4bn in 2014, with a CAGR of 14.3%.

61
Chapter 4 Innovation and NPD in bakery and cereals
Summary Among all new product launches during 2007–10, only 0.5% was innovative. Innovations in
formulation accounted for 83.3% of all innovations in bakery and cereals in 2010, an increase of
15.1 percentage points over 2007.
Europe accounted for 43.2% of all new product launches in bakery and cereals in 2010, an
increase of 9.4 percentage points over 2007.
The majority of NPD has taken place in the cookies category over 2007–10, which accounted for
34.5% of new launches globally in 2010.
Packaging innovation has taken a back seat, with little significant development since 2008. Boxes
have been the most commonly used packaging for bakery and cereals products launched over
2007–10.
Chocolate has continued to dominate among all flavors since 2007, with a share of 9.6% in 2010,
but there is a growing trend of dual and fused flavors, such as chocolate vanilla and strawberry
banana.
Introduction This chapter provides an overview of innovations and NPD in bakery and cereals by product type and region.
It profiles the key innovative bakery and cereal products introduced during 2007–10, while analyzing the new
product launch strategies of manufacturers. Leading product tags and flavors are also evaluated in order to
indicate evolving trends in the market.

62
Innovation type Among all new product launches during 2007–10, only 0.5% truly innovative, of which innovations in
formulation accounted for 83.3% of all innovations overall in bakery and cereals in 2010, an increase of 15.1
percentage points on 2007. However, rising agricultural commodities prices and the economic downturn
have forced manufacturers to limit investment in R&D operations. As a result, formulation-based innovations
declined during 2009–10. Positioning and technology innovations accounted for 12.5% and 4.2%,
respectively, of all innovations in bakery and cereals in 2010, representing an increase in NPD for both
innovation types over 2007.
Table 13: Share of new product launches (%), by innovation type, 2007–10
Innovation type 2007 2008 2009 2010 GrowthFormulation 68.2% 69.6% 92.9% 83.3% ▲Positioning 9.1% 6.5% 7.1% 12.5% ▲Technology 0.0% 4.3% 0.0% 4.2% ▲Merchandising 6.8% 8.7% 0.0% 0.0% ▼Packaging benefit 15.9% 10.9% 0.0% 0.0% ▼ Note: year end May 31, 2010.
Source: Product Launch Analytics BUSINESS INSIGHTS

63
Figure 14: Share of new product launches by innovation type (%), 2007–10
12.5%
83.3%
9.1%
68.2%
4.2%
6.8%
15.9%
0% 20% 40% 60% 80% 100%
Merchandising
Packaging Benefit
Technology
Positioning
Formulation
2007
2010
Share of NPD (%)
Year end May 31, 2010
12.5%
83.3%
9.1%
68.2%
4.2%
6.8%
15.9%
0% 20% 40% 60% 80% 100%
Merchandising
Packaging Benefit
Technology
Positioning
Formulation
2007
2010
12.5%
83.3%
9.1%
68.2%
4.2%
6.8%
15.9%
0% 20% 40% 60% 80% 100%
Merchandising
Packaging Benefit
Technology
Positioning
Formulation
2007
2010
Share of NPD (%)
Year end May 31, 2010
Source: Product Launch Analytics BUSINESS INSIGHTS
Regional analysis During 2007–10, Europe, Latin America, and Middle East and Africa increased their share of NPD in bakery
and cereals. In 2010, share of European NPD was 17.7 percentage points higher than that of Asia-Pacific,
and more than three times that of North America. Latin America and Middle East and Africa also increased
their share of NPD to 10.9% and 4.8%, respectively.

64
Table 14: Share of new product launches, by region (%), 2007–10
Region 2007 2010 GrowthEurope 33.8% 43.2% ▲Asia-Pacific 33.2% 25.5% ▼North America 19.9% 13.3% ▼Latin America 7.0% 10.9% ▲Middle East and Africa 3.7% 4.8% ▲Multi regions* 2.4% 2.3% ▼ Note: year end May 31, 2010. *Multi regions indicate new product launches in two or more regions.
Source: Product Launch Analytics BUSINESS INSIGHTS
Figure 15: Share of new product launches by region (%), 2007–10
Multi regions include countries in Europe, Asia-Pacific, North America, Latin America and Middle East & Africa
2.3%
4.8%
10.9%
13.3%
25.5%
43.2%
2.5%
3.7%
7.0%
19.9%
33.2%
33.8%
0% 10% 20% 30% 40% 50%
Multi regions
Middle East & Africa
Latin America
North America
Asia Pacific
Europe
2007
2010
Share of NPD by region (%)
Year end May 31, 2010
2.3%
4.8%
10.9%
13.3%
25.5%
43.2%
2.5%
3.7%
7.0%
19.9%
33.2%
33.8%
0% 10% 20% 30% 40% 50%
Multi regions
Middle East & Africa
Latin America
North America
Asia Pacific
Europe
2007
2010
2.3%
4.8%
10.9%
13.3%
25.5%
43.2%
2.5%
3.7%
7.0%
19.9%
33.2%
33.8%
0% 10% 20% 30% 40% 50%
Multi regions
Middle East & Africa
Latin America
North America
Asia Pacific
Europe
2007
2010
Share of NPD by region (%)
Year end May 31, 2010
2.3%
4.8%
10.9%
13.3%
25.5%
43.2%
2.5%
3.7%
7.0%
19.9%
33.2%
33.8%
0% 10% 20% 30% 40% 50%
Multi regions
Middle East & Africa
Latin America
North America
Asia Pacific
Europe
2007
2010
Share of NPD by region (%)
Year end May 31, 2010
2.3%
4.8%
10.9%
13.3%
25.5%
43.2%
2.5%
3.7%
7.0%
19.9%
33.2%
33.8%
0% 10% 20% 30% 40% 50%
Multi regions
Middle East & Africa
Latin America
North America
Asia Pacific
Europe
2007
2010
2.3%
4.8%
10.9%
13.3%
25.5%
43.2%
2.5%
3.7%
7.0%
19.9%
33.2%
33.8%
0% 10% 20% 30% 40% 50%
Multi regions
Middle East & Africa
Latin America
North America
Asia Pacific
Europe
2007
2010
Share of NPD by region (%)
Year end May 31, 2010
Source: Business Insights BUSINESS INSIGHTS

65
Europe
Europe accounted for 43.2% of all new product launches in bakery and cereals in 2010, an increase of 9.4
percentage points over 2007. The focus of both regulators and consumers on the health benefits of high fiber
cereal-based food has been driving product development activities in bakery and cereals market. The UK
had the highest share of 20.9% of NPD in bakery and cereals in Europe in 2010.
Figure 16: Share of top 10 countries in NPD in Europe (%), 2007–10
100%
20.9%
12.8%
10.8%
8.0%
7.7%
7.6%
6.2%
2.8%
2.2%
1.9%
19.2%
0% 20% 40% 60% 80% 100%
Europe
UK
France
Italy
Netherlands
Spain
Germany
Hungary
Latvia
Portugal
Sweden
Other Europeancountries
100%
20.9%
12.8%
10.8%
8.0%
7.7%
7.6%
6.2%
2.8%
2.2%
1.9%
19.2%
0% 20% 40% 60% 80% 100%
Europe
UK
France
Italy
Netherlands
Spain
Germany
Hungary
Latvia
Portugal
Sweden
Other Europeancountries
100%
20.9%
12.8%
10.8%
8.0%
7.7%
7.6%
6.2%
2.8%
2.2%
1.9%
19.2%
0% 20% 40% 60% 80% 100%
Europe
UK
France
Italy
Netherlands
Spain
Germany
Hungary
Latvia
Portugal
Sweden
Other Europeancountries
Share in NPD by country in Europe (%), 2010
Year end May 31, 2010.
100%
20.9%
12.8%
10.8%
8.0%
7.7%
7.6%
6.2%
2.8%
2.2%
1.9%
19.2%
0% 20% 40% 60% 80% 100%
Europe
UK
France
Italy
Netherlands
Spain
Germany
Hungary
Latvia
Portugal
Sweden
Other Europeancountries
100%
20.9%
12.8%
10.8%
8.0%
7.7%
7.6%
6.2%
2.8%
2.2%
1.9%
19.2%
0% 20% 40% 60% 80% 100%
Europe
UK
France
Italy
Netherlands
Spain
Germany
Hungary
Latvia
Portugal
Sweden
Other Europeancountries
100%
20.9%
12.8%
10.8%
8.0%
7.7%
7.6%
6.2%
2.8%
2.2%
1.9%
19.2%
0% 20% 40% 60% 80% 100%
Europe
UK
France
Italy
Netherlands
Spain
Germany
Hungary
Latvia
Portugal
Sweden
Other Europeancountries
Share in NPD by country in Europe (%), 2010
Year end May 31, 2010. Source: Business Insights BUSINESS INSIGHTS

66
Cookies had the highest share of 31.8% of NPD in bakery and cereals in 2010 in Europe. Despite a decline
of 1.9 percentage points over 2007, the dominance of the segment is largely due to the following factors:
Healthier, and more natural, cookies;
Cookies with exotic flavors and unconventional ingredient combinations.
Breakfast cereals share in NPD also declined by 1.2 percentage points since 2007, but managed to retain its
position in the ranking order due to the following reasons:
Addition of a wider range of fruits and cereals to create more premium/healthy breakfast cereals;
More science-led nutraceutical breakfast cereals.
Table 15: Share of products launched in Europe (%), by category, 2007–10
Category 2007 2010 GrowthCookies 33.7% 31.8% ▼Breakfast cereals 17.3% 16.1% ▼Cakes and pastries 13.0% 16.0% ▲Bread and rolls 16.3% 15.1% ▼Crackers 6.9% 9.1% ▲Cereal bars 9.8% 8.0% ▼Morning goods 3.0% 3.9% ▲ Note: year end May 31, 2010.
Source: Product Launch Analytics BUSINESS INSIGHTS

67
Figure 17: Share of products launched in Europe, by category (%), 2007–10 Sh
are
of p
rodu
cts
laun
ched
by
cate
gory
in E
urop
e (%
), 20
07–1
0
33.7% 31.8%
17.3% 16.1%
13.0% 16.0%
16.3% 15.1%
6.9% 9.1%
9.8% 8.0%3.0% 3.9%
0%
10%
20%
30%
40%
50%
60%
70%
80%
90%
100%
2007 2010Cookies Breakfast cereals Cakes and pastries Bread and rolls
Crackers Cereal bars Morning goods
Year end May 31, 2010.
Note: Legend depicts categories from bottom to top
Shar
e of
pro
duct
s la
unch
ed b
y ca
tego
ryin
Eur
ope
(%),
2007
–10
33.7% 31.8%
17.3% 16.1%
13.0% 16.0%
16.3% 15.1%
6.9% 9.1%
9.8% 8.0%3.0% 3.9%
0%
10%
20%
30%
40%
50%
60%
70%
80%
90%
100%
2007 2010Cookies Breakfast cereals Cakes and pastries Bread and rolls
Crackers Cereal bars Morning goods
Year end May 31, 2010.
Note: Legend depicts categories from bottom to top Source: Business Insights BUSINESS INSIGHTS
Private label accounted for 20.1% of all new product launches made in Europe in 2010, a significant increase
of 17.2 percentage points since 2007.Lower price points and the emergence of health proposition
comparable to branded products has resulted in consumers switching to private label bakery and cereals.

68
Table 16: Top 10 claims made by bakery and cereal products launched in Europe, 2007–10
Claims 2007 2008 2009 2010 GrowthPrivate label 3.0% 5.3% 13.9% 20.1% ▲Organic 5.8% 7.9% 9.3% 8.7% ▲High fiber 9.8% 9.1% 8.0% 6.4% ▼High vitamins 6.6% 7.4% 5.2% 3.7% ▼No preservatives 4.3% 4.2% 4.6% 5.3% ▲No gluten 3.5% 4.8% 4.2% 5.6% ▲Vegetarian 5.1% 2.9% 3.9% 3.4% ▼No artificial color 2.4% 3.0% 3.8% 4.5% ▲Kids 4.6% 3.7% 3.6% 2.9% ▼Low fat 5.1% 4.4% 3.4% 2.0% ▼ Note: year end May 31, 2010.
Source: Product Launch Analytics BUSINESS INSIGHTS
The top 10 claims also shows the growth of organic products, which accounted for 8.7% of all claims in 2010.
A good examples is the Food for Life Baking Company, a producer of private label bakery and cereals, which
launched its Ezekiel 4:9 Sprouted 100% Whole Grain Bread in the UK in 2010. In addition to being
organically produced, the product is free from preservatives which reduce consumers' concerns over artificial
additives. The product has a low glycemic index level, making it suitable for consumers on a diet or trying to
manage their weight. It also contains proteins made from the combination of wheat, barley, beans, lentils,
millet and spelt, with sprouted legumes that fulfill the daily dietary requirements.

69
Figure 18: Food For Life's Ezekiel 4:9 Sprouted 100% Whole Grain Bread
Source: Product Launch Analytics BUSINESS INSIGHTS
Asia-Pacific
Asia-Pacific accounted for 25.5% of all new bakery and cereals launched in 2010, a decline of 7.7
percentage points over 2007. Among all new products launched in Asia-Pacific, cookies accounted for 38.4%
in 2010, more than 2.5 times that of the bread and rolls category.
Table 17: Share of products launched in Asia-Pacific (%), by category, 2007–10
Category 2007 2010 GrowthCookies 38.9% 38.4% ▼Bread and rolls 13.6% 14.7% ▲Cakes and pastries 16.2% 14.5% ▼Breakfast cereals 10.9% 12.1% ▲Crackers 13.0% 11.7% ▼Cereal bars 4.6% 7.0% ▲Morning goods 2.8% 1.6% ▼ Note: year end May 31, 2010.
Source: Product Launch Analytics BUSINESS INSIGHTS

70
Figure 19: Share of products launched in Asia-Pacific (%), by category, 2007–10
38.9% 38.4%
13.6% 14.7%
16.2% 14.5%
10.9% 12.1%
13.0% 11.7%
4.6% 7.0%2.8% 1.6%
0%
10%
20%
30%
40%
50%
60%
70%
80%
90%
100%
2007 2010
Sha
re o
f pro
duct
s la
unch
ed b
y ca
tego
ry
in A
sia-
Pac
ific(
%),
2007
–10
Cookies Bread and rolls Cakes and pastries Breakfast cereals
Crackers Cereal bars Morning goods
Year end May 31, 2010. Note: Legend depicts categories from bottom to top
38.9% 38.4%
13.6% 14.7%
16.2% 14.5%
10.9% 12.1%
13.0% 11.7%
4.6% 7.0%2.8% 1.6%
0%
10%
20%
30%
40%
50%
60%
70%
80%
90%
100%
2007 2010
Sha
re o
f pro
duct
s la
unch
ed b
y ca
tego
ry
in A
sia-
Pac
ific(
%),
2007
–10
Cookies Bread and rolls Cakes and pastries Breakfast cereals
Crackers Cereal bars Morning goods
Year end May 31, 2010.
38.9% 38.4%
13.6% 14.7%
16.2% 14.5%
10.9% 12.1%
13.0% 11.7%
4.6% 7.0%2.8% 1.6%
0%
10%
20%
30%
40%
50%
60%
70%
80%
90%
100%
2007 2010
Sha
re o
f pro
duct
s la
unch
ed b
y ca
tego
ry
in A
sia-
Pac
ific(
%),
2007
–10
Cookies Bread and rolls Cakes and pastries Breakfast cereals
Crackers Cereal bars Morning goods
Year end May 31, 2010. Note: Legend depicts categories from bottom to top
Source: Business Insights BUSINESS INSIGHTS
Japan, China and India together accounted for 57.8% share of all new bakery and cereals launched in Asia-
Pacific during 2007–10. At 8.4%, the 'vegetarian' claim accounted for the highest share among all claims
used for NPD in bakery and cereals in Asia-Pacific in 2010. 85.7% of all ‘vegetarian’ products during 2007–
10 were launched in the Indian market, where more than 30% of the population is vegetarian. Similarly, as in
Europe, more natural, healthier healthy products continue to drive innovations, with the 'high fiber' and 'free
from artificial color' products dominating NPD in Asia-Pacific.

71
Table 18: Top 10 claims made by bakery and cereal products launched in Asia-Pacific, 2007–10
Claims 2007 2008 2009 2010 GrowthVegetarian 7.4% 6.6% 10.5% 8.4% ▲High fiber 7.3% 9.0% 8.0% 8.1% ▲No artificial color 2.6% 4.1% 4.8% 7.1% ▲High vitamins 8.0% 5.4% 6.9% 5.5% ▼No artificial flavor 1.9% 2.7% 2.6% 5.4% ▲No preservatives 2.2% 3.2% 4.5% 5.1% ▲Low fat 3.2% 3.5% 3.3% 4.1% ▲High calcium 5.5% 3.6% 4.0% 3.3% ▼Kids 5.7% 4.0% 2.5% 2.1% ▼Single serving 13.5% 9.1% 3.5% 2.0% ▼ Note: year end May 31, 2010.
Source: Product Launch Analytics BUSINESS INSIGHTS
ITC launched its naturally healthy Sunfeast Marie Light Oats biscuits in India in 2010. The product is made
from high fiber ingredients such as wheat and oats, and is primarily targeted at health conscious consumers
looking for natural products that are free from cholesterol or trans-fats.
Figure 20: Sunfeast Marie Light Oats biscuits
Source: Product Launch Analytics BUSINESS INSIGHTS

72
North America
North America holds 13.3% share of all NPD in bakery and cereals in 2010, a decline of 6.6 percentage
points over 2007. As in Europe and Asia-Pacific, cookies accounted for the highest share (26.5%) among all
new product introductions in North America in 2010.
Table 19: Share of products launched in North America (%), by category, 2007–10
Category 2007 2010 GrowthCookies 27.7% 26.5% ▼Bread and rolls 16.0% 16.9% ▲Cereal bars 13.4% 16.4% ▲Breakfast cereals 15.7% 14.6% ▼Cakes and pastries 11.8% 10.1% ▼Crackers 10.7% 9.7% ▼Morning goods 4.7% 5.7% ▲ Note: year end May 31, 2010.
Source: Product Launch Analytics BUSINESS INSIGHTS

73
Figure 21: Share of products launched in North America (%), by category, 2007–10 S
hare
of p
rodu
cts
laun
ched
by
cate
gory
in
Nor
th A
mer
ica
(%),
2007
–10
27.7% 26.5%
16.0% 16.9%
13.4% 16.4%
15.7% 14.6%
11.8% 10.1%
10.7% 9.7%
4.7% 5.7%
0%
10%
20%
30%
40%
50%
60%
70%
80%
90%
100%
2007 2010Cookies Bread and rolls Cereal bars Breakfast cereals
Cakes and pastries Crackers Morning goods
Year end May 31, 2010.
Note: Legend depicts categories from bottom to top
Sha
re o
f pro
duct
s la
unch
ed b
y ca
tego
ry in
N
orth
Am
eric
a (%
), 20
07–1
0
27.7% 26.5%
16.0% 16.9%
13.4% 16.4%
15.7% 14.6%
11.8% 10.1%
10.7% 9.7%
4.7% 5.7%
0%
10%
20%
30%
40%
50%
60%
70%
80%
90%
100%
2007 2010Cookies Bread and rolls Cereal bars Breakfast cereals
Cakes and pastries Crackers Morning goods
Year end May 31, 2010.
Note: Legend depicts categories from bottom to top
Source: Business Insights BUSINESS INSIGHTS
'Natural' was the leading claim in North America, accounting for a share of 8.5% in 2010, a 1.5 percentage
point increase since 2007. As in other markets, concerns relating to the adverse health effects of artificial
additives, particularly on children, have also driven demand for natural products in North America. Launches
of upscale bakery and cereal products saw a decline of 3.4% over 2009 due to the effects of recession. At
the same time, adoption of private label products increased.

74
Table 20: Top 10 claims made by bakery and cereal products launched in North America, 2007–10
Claim 2007 2010 GrowthNatural 7.0% 8.5% ▲Single serving 6.4% 6.5% ▲Upscale 7.7% 5.6% ▼No trans fat 7.1% 4.7% ▼High fiber 4.4% 4.7% ▲No preservatives 3.4% 4.2% ▲Private label 2.8% 3.7% ▲Organic 3.8% 3.3% ▼No artificial flavor 2.2% 2.9% ▲High vitamins 2.7% 1.9% ▼ Note: year end May 31, 2010.
Source: Product Launch Analytics BUSINESS INSIGHTS
There has been a steady growth in the sophistication and premiumization of products aimed at children,
caused, in part, by slowing or low birth rates in many developed countries. Want Want Group, a Taiwan-
based foods and beverages manufacturer, launched Hot-Kid Organic Toddler Mum-Mum caramel flavored
rice biscuits in Canada in 2010. The product is meant for toddlers and is made from USDA-approved organic
rice and has no added flavors or colors to prevent health hazards from additives. Further, the biscuit contains
less than 1 gram of sugar per serving (2 biscuits) and does not contain trans fat. The Hazard Analysis Critical
Control Point (HACCP) certification also does away worries related to product safety among parents. In
addition, the biscuits have been shaped and sized such that it can be gripped by toddlers.

75
Figure 22: Hot-Kid Organic Toddler Mum-Mum caramel flavored rice biscuits
Source: Product Launch Analytics BUSINESS INSIGHTS

76
Category analysis The majority of NPD during 2007–10 took place in the cookies category. Cookies accounted for 34.5%
among all new launches made globally in 2010. At 14.8%, breakfast cereals' share was less than half that of
the cookies category in 2010. Besides these two categories, cakes and pastries and morning goods were the
only other categories to record a growth in share of new product launches.
Table 21: Share of new bakery and cereal launches, by category (%), 2007 and 2010
Category 2007 2010 GrowthCookies 34.3% 34.5% ▲Breakfast cereals 14.7% 14.8% ▲Bread and rolls 14.8% 14.6% ▼Cakes and pastries 13.9% 14.3% ▲Crackers 10.1% 9.9% ▼Cereal bars 9.2% 8.7% ▼Morning goods 3.0% 3.1% ▲ Note: year end May 31, 2010.
Source: Product Launch Analytics BUSINESS INSIGHTS

77
Figure 23: Share of new bakery and cereal launches, by category (%), 2007 and 2010
34.3%
14.8%
13.9%
10.1%
9.2%
3.0%
14.6%
14.3%
9.9%
8.7%
3.1%
14.7%
14.8%
34.5%
0% 5% 10% 15% 20% 25% 30% 35% 40%
Cookies
Breakfast cereals
Bread and rolls
Cakes and pastries
Crackers
Cereal bars
Morning goods
Share of new snack launches by category (%)
2007 2010
Year end May 31, 2010.
34.3%
14.8%
13.9%
10.1%
9.2%
3.0%
14.6%
14.3%
9.9%
8.7%
3.1%
14.7%
14.8%
34.5%
0% 5% 10% 15% 20% 25% 30% 35% 40%
Cookies
Breakfast cereals
Bread and rolls
Cakes and pastries
Crackers
Cereal bars
Morning goods
34.3%
14.8%
13.9%
10.1%
9.2%
3.0%
14.6%
14.3%
9.9%
8.7%
3.1%
14.7%
14.8%
34.5%
0% 5% 10% 15% 20% 25% 30% 35% 40%
Cookies
Breakfast cereals
Bread and rolls
Cakes and pastries
Crackers
Cereal bars
Morning goods
Share of new snack launches by category (%)
2007 2010
Year end May 31, 2010.
2007 20102007 2010
Year end May 31, 2010.
Source: Business Insights BUSINESS INSIGHTS

78
Cookies
New product introductions in this category had a marginal increase of 0.2 percentage points during 2007–10.
A typical example of innovation in ethnic flavors includes Lotte's Margaret Five Grains Black Cookie,
launched in South Korea in 2010. This cookie has been made from ingredients that are typical to the Korean
diet and culture, such as black soybean, black rice, barley, brown rice, and black sesame seeds.
Figure 24: Lotte's Margaret Five Grains Black Cookie
Source: Product Launch Analytics BUSINESS INSIGHTS
Private label topped all the product tags with a share of 10.9% in 2010, more than three times the share in
2007. Consumers have increasingly opted for private labels, as they seek both to cut grocery budgets and
also conspicuously not spend.

79
Table 22: Top 10 claims for cookies (%), 2007–10
Claim 2007 2008 2009 2010 GrowthPrivate label 3.3% 4.1% 9.8% 10.9% ▲No trans fat 4.0% 4.4% 5.8% 5.8% ▲Organic 3.7% 4.3% 6.0% 5.0% ▲No preservatives 3.7% 4.2% 3.8% 5.0% ▲Natural 4.7% 4.9% 3.6% 4.7% –Vegetarian 3.9% 3.3% 5.3% 4.6% ▲No artificial color 2.6% 3.6% 4.2% 4.5% ▲No gluten 2.0% 2.5% 2.5% 4.4% ▲Upscale 6.4% 8.3% 5.6% 3.9% ▼Kids 7.0% 4.5% 4.6% 3.8% ▼ Note: year end May 31, 2010.
Source: Product Launch Analytics BUSINESS INSIGHTS
In 2010, Petit Sable launched its private label whole grain biscuits, Sentir Bem Biscoito Integral, in Brazil, in
three varieties (banana and cinnamon, chocolate and caramel, and guava). The product is free-from trans
fat, lactose and cholesterol, and is rich in fiber. Whole grains enhance the nutrition quotient of the product by
improving insulin sensitivity, which in turn reduces the risk of diabetes. Additionally, the biscuits are made
from wheat flour enriched with iron and folic acid, providing consumers with vitamin B.

80
Figure 25: Sentir Bem Biscoito Integral
Source: Product Launch Analytics BUSINESS INSIGHTS
Breakfast cereals
Breakfast cereals accounted for 14.8% of global new product launches in bakery and cereals in 2010, a
change of 0.1 percentage point since 2007. Europe is the largest market for breakfast cereals, and its share
of NPD is growing – accounting for almost half of launches in 2010. In contrast Asia-Pacific and North
America actually declined in share of product launches over the same period. Although emerging markets,
especially in Asia, are becoming more receptive to breakfast cereals, expenditure per capita remains low.

81
Table 23: Share of new breakfast cereals launches by regions (%), 2007 and 2010
Region 2007 2010 GrowthEurope 39.8% 46.8% ▲Asia-Pacific 24.8% 20.8% ▼North America 21.2% 13.1% ▼Latin America 8.1% 9.7% ▲Middle East and Africa 3.6% 7.5% ▲Multi regions 2.6% 2.2% ▼
Note: year end May 31, 2010.
Source: Product Launch Analytics BUSINESS INSIGHTS
In 2009, Bolletje launched Ik Wil Bolletje Brod in de Melk, a breakfast cereal for consumers in the
Netherlands. The cereal, name of which translates into "I want bread in my milk", comprises baked wheat
pieces in the shape of mini bread rolls and freeze-dried raspberries and strawberries. The fruits are designed
to regain their original freshness and flavor when milk is added and the cereal is said to retain its crunchy
texture, even after thirty minutes in milk.
Figure 26: Ik Wil Bolletje Brod in de Melk breakfast cereal
Source: Product Launch Analytics BUSINESS INSIGHTS

82
Bread and rolls
The bread and rolls category has seen its share of NPD in the bakery and cereals market decline slightly,
with a 14.6% share in 2010. Private labels accounted for 14% of products launched in 2010. The majority of
claims for bread and rolls reflected an affinity for natural, organic and additive-free products.
Table 24: Top 10 claims for breads and rolls (%), 2007–10
Claim 2007 2008 2009 2010 GrowthPrivate label 5.2% 4.6% 9.4% 14.0% ▲High fiber 9.9% 8.6% 9.4% 8.8% ▼No preservatives 5.6% 6.0% 5.8% 7.2% ▲No trans fat 7.0% 5.5% 5.9% 5.4% ▼Natural 4.8% 5.7% 4.7% 4.7% ▼No artificial color 2.1% 2.4% 2.5% 4.3% ▲Organic 2.9% 3.3% 3.4% 3.8% ▲No artificial flavor 1.5% 2.4% 1.9% 3.7% ▲No gluten 1.4% 2.7% 1.9% 3.5% ▲Low fat 3.1% 3.2% 2.5% 3.3% ▲ Note: year end May 31, 2010.
Source: Product Launch Analytics BUSINESS INSIGHTS
A good example of the move towards a healthier positioning, even for mainstream products is Woolworths'
sandwich bread, which was launched in Australia in 2010 to cater to the needs of health conscious
consumers, and is available in four different varieties: Grains+, Hi Fibre, White and Wholemeal. Each of the
varieties has been fortified with fiber to aid digestion.

83
Figure 27: Woolworths sandwich bread
Source: Product Launch Analytics BUSINESS INSIGHTS
Cakes and pastries
Share of cakes and pastries in NPD activities increased by just 0.4 percentage points since 2007, to reach
14.3% in 2010. Almost half of this new product development was in Europe. The value of the global cakes
and pastries market is forecast to grow at a CAGR of 5.2% over 2019–14, and one of the key outputs in
innovation will be the adaptation of European and US-style cakes and pastries for Asian palates..

84
Table 25: Share of new cakes and pastries launches, by region, 2007 and 2010
Region 2007 2010 GrowthEurope 31.7% 48.3% ▲Asia-Pacific 38.8% 25.9% ▼North America 16.9% 9.4% ▼Latin America 5.4% 8.8% ▲Middle East and Africa 4.3% 4.3% –Multi regions 2.9% 3.2% ▲ Note: year end May 31, 2010.
Source: Product Launch Analytics BUSINESS INSIGHTS
The increasing prevalence of private label cakes and pastries is perhaps unsurprising given the economic
downturn, with consumers looking for quality products at lower price points. Private label more than tripled its
share of claims for new product launches to reach 20.6% in 2010, with Europe accounting for the highest
share of all regions. Single servings had the highest decline among all claims, with a 13.4 percentage point
slump since 2007, holding a share of 5.4% among all new product launches in 2010.

85
Table 26: Top 20 claims for cakes and pastries (%), 2007–10
Claims 2007 2010 GrowthPrivate label 5.6% 20.6% ▲No artificial color 2.7% 5.7% ▲No preservatives 3.8% 5.7% ▲Single serving 18.8% 5.4% ▼No artificial flavor 2.3% 4.8% ▲No gluten 1.5% 4.4% ▲Upscale 6.3% 3.9% ▼No trans fat 3.2% 3.8% ▲Natural 4.2% 3.6% ▼Organic 1.4% 3.1% ▲Vegetarian 2.1% 2.8% ▲Microwaveable 2.2% 2.5% ▲Fresh 3.6% 2.3% ▼Kids 3.1% 2.3% ▼Low calories 1.5% 2.0% ▲Quick 1.8% 2.0% ▲Double trademark 1.5% 1.7% ▲Real 2.4% 1.7% ▼High vitamins 1.4% 1.6% ▲No wheat 0.9% 1.6% ▲ Note: year end May 31, 2010.
Source: Product Launch Analytics BUSINESS INSIGHTS
Innovations in this category were largely focused on developing new and more exotic flavor combinations. As
a result, manufacturers are experimenting with superfruits such as raspberries and goji berries. They are
also moving away from using additives, trans fat and gluten to mine niches among highly health conscious
consumers. Nestlé's Toll House Ready to Bake Brownies Limited Edition Fudgy Brownies with Raspberry

86
Filling was launched in the US in 2009. This product differentiates itself from the traditional flavor of brownies
by incorporating a raspberry filling. Additionally, the trans-fat-free product has been fortified with vitamins A,
B1 and B3, to add nutritional value.
Figure 28: Nestlé's Toll House Ready to Bake Brownie Limited Edition Fudgy Brownies
Source: Product Launch Analytics BUSINESS INSIGHTS
Crackers
The cracker category’s share of NPD across the bakery and cereals market has dipped marginally by 0.2
percentage points since 2007, to have a 9.9% share in 2010. As in other bakery and cereal categories,
convenience and health have been driving product development in this category over 2007–10. The impact
of private label has also been evident across the crackers category, with a share increase of 7.1 percentage
points during 2007–10 to reach 9.1% in 2010. The rising consumer focus on natural and organic ingredients
has led to manufacturers producing new products that are free from dairy, nuts, gluten and allergens.

87
Table 27: Top 10 claims for crackers (%), 2007–10
Claims 2007 2010 GrowthPrivate label 2.0% 9.1% ▲No trans fat 7.2% 7.6% ▲Natural 6.1% 6.8% ▲Organic 4.7% 5.9% ▲No gluten 2.9% 5.7% ▲High fiber 8.6% 5.4% ▼No preservatives 3.3% 5.3% ▲No artificial color 2.2% 4.7% ▲No artificial flavor 2.0% 4.0% ▲No cholesterol 4.8% 3.7% ▼ Note: year end May 31, 2010.
Source: Product Launch Analytics BUSINESS INSIGHTS
The 'free-from' tag, comprising claims such as 'no trans fat' and 'no preservatives', constituted 31.1% of all
new product launch claims in 2010, an increase of 8.9 percentage points since 2007. As consumers become
more aware of specific connections between health and poor diet, 'natural' and 'free-from' claims will play a
pivotal role in making purchase decisions. The addition of whole grains will help products reach consumers
who are choosing less calorie-dense and more fiber-rich foods. While enhancing the nutrition quotient of the
product, whole grains will also help deliver a distinct taste and provide differentiation from mainstream
products.
In 2010, Kashi launched its Heart to Heart Whole Grain Crackers in Original and Roasted Garlic. This
product is a wholewheat cracker that contains plant sterols, whole grains and antioxidants, and is low in
sodium. Plant sterols reduce cholesterol with their low sodium content, making it suitable for heart patients.
Moreover, the product contains green tea, white tea and grape seed extracts, vitamins E and C and beta

88
carotene, and is free from trans-fat and saturated fat. The green tea and white tea extracts are rich in
antioxidants that help lower cholesterol, further reinforcing the product's position among patients with heart
problems.
Figure 29: Kashi's Heart to Heart Whole Grain Crackers
Source: Product Launch Analytics BUSINESS INSIGHTS
Cereal bars
Cereal bars’ share of new product launches in 2010 remains at 2007 levels. Although small, this category is
actually highly dynamic because manufacturers are able to use a wide range of ingredients and to position
cereal bars along the spectrum from competing with snacks and confectionery to being a much healthier
delivery mechanism for functional benefits, such as heart health or sports nutrition. The category is still
relatively small in terms of value because it is yet to penetrate consumer segments such as the elderly and
children.

89
Table 28: Top 10 flavors for crackers (%), 2007–10
Flavor 2007 2010 GrowthChocolate 7.0% 7.5% ▲Almond 3.8% 3.8% ▲Apple 5.1% 3.4% ▼Strawberry 3.5% 3.1% ▼Apricot 2.0% 2.5% ▲Cranberry 2.5% 2.5% ▲Banana 2.2% 2.4% ▲Cereal 1.5% 2.4% ▲Blueberry 1.3% 2.3% ▲Coconut 1.8% 2.0% ▲
Source: Product Launch Analytics BUSINESS INSIGHTS
In an effort to drive demand and compete more effectively against confectionery products as a healthier
alternative, cereal bar manufacturers have also looked towards flavor innovation. Chocolate was the leading
flavor among all new launches over 2007–10, accounting for 7.5% in 2010. Fruit and nut flavors gained
grounds in the cereal bars category, with 90% of the top 10 flavors portraying this trend.
In line with this trend, Mareblu Naturals launched its Premium Crunch Bar in the US in 2010. This product is
high in fiber and antioxidants as it contains almonds and pomegranates. It also helps in weight management
by promoting the feeling of satiety for a longer period of time. Moreover, the product is natural and free from
gluten, trans-fat and peanuts, allowing Mareblu Naturals to target vegans.

90
Figure 30: Mareblu Naturals' Premium Crunch Bar Strawberry Pomegranate Trail Mix
Source: Product Launch Analytics BUSINESS INSIGHTS
Morning goods
Morning goods accounted for just 3.1% of NPD in the bakery and cereals market in 2010, most of which is in
Europe, where consumption of morning goods is highest. Morning goods are still far less common in Asian
countries, where more traditional breakfasts, such as mántou (steamed breads) in China, predominate.
Table 29: Share of new morning goods launches (%), by region, 2007 and 2010
Region 2007 2010 GrowthEurope 32.9% 54.0% ▲North America 30.9% 24.7% ▼Asia-Pacific 30.3% 13.5% ▼Latin America 4.6% 4.2% ▼Middle East and Africa 0.7% 1.9% ▲Multi regions 0.7% 1.9% ▲ Note: year end May 31, 2010.
Source: Product Launch Analytics BUSINESS INSIGHTS

91
Manufacturers are incorporating a wider range of healthy ingredients such as açai berries, plant sterols and
pomegranates in morning goods to reposition what was previously a butter-rich, traditional product as both
more exotic and in some cases, healthier. This trend was reflected by the 2007 launch of Vitalicious'
VitaTops Muffin Tops in Dark Chocolate Pomegranate and Fudgy Peanut Butter Chip variants in the US. The
product contains plant sterols, an ingredient that is clinically proven to reduce cholesterol, enabling
Vitalicious to position it as a heart-healthy product. Both varieties are naturally sourced and contain no
preservatives. In addition, the pomegranate variety serves as a source of antioxidants, while wholewheat
enhances the fiber content. The product also targets consumers interested in weight management, with each
serving providing just 100 calories. Furthermore, it meets the regulatory requirement of low sodium content,
and is fortified with 15 vitamins and minerals, thus enhancing its nutritional value.
Figure 31: Vitalicious' VitaTops Muffin Tops
Source: Product Launch Analytics BUSINESS INSIGHTS
The acceptance of probiotic dairy products has also encouraged bakers to emulate this success in their
products. In 2009, Isabella's Healthy Bakery launched a line of enriched muffins in the US in the following
varieties: Activate Probiotic Raisin Bran; and Revitalize Peanut Butter and Chocolate Chip. The Activate
muffins are fortified with GanedenBC30 probiotic which helps strengthen the immune system, while the
peanut butter and chocolate chip variety is formulated with vitamins B6 and B12, for health conscious
consumers.

92
Figure 32: Isabella's Healthy Bakery Activate Probiotic Raisin Bran enriched muffins
Source: Product Launch Analytics BUSINESS INSIGHTS

93
Packaging analysis Packaging innovation has taken a back seat to product innovation, with little change in packaging type in the
past two or three years. Boxes were the most commonly used packaging type over 2007–10, accounting for
30.9% of all new bakery and cereal launches in 2010. After boxes, wrappers were the most common type of
packaging, with a 24.3% share in 2010. Plastic was the most commonly used material for packaging bakery
and cereals over 2007–10, driven by its cost competitiveness and its flexibility.
Table 30: Top 10 pack types for new bakery and cereal launches (%), 2007–10
Package types
2007 2008 2009 2010 Growth
Box 33.4% 34.1% 33.4% 30.9% ▼Wrapper 20.1% 21.7% 22.2% 24.3% ▲Bag 15.0% 15.1% 17.2% 17.1% ▲Packet 7.3% 6.1% 6.0% 5.5% ▼Tray 4.1% 4.3% 4.5% 5.0% ▲Pillow bag 7.1% 5.8% 4.0% 3.3% ▼Stand up bag 2.3% 2.8% 2.8% 3.6% ▲Resealable 2.4% 1.9% 1.9% 2.3% ▼Pouch 0.8% 1.0% 0.7% 0.5% ▼Bag-in-box 1.1% 1.0% 0.7% 0.5% ▼ Note: year end May 31, 2010.
Source: Product Launch Analytics BUSINESS INSIGHTS
In an illustration of how the issue of sustainability represents the dominant influence on the development of
new packaging, Kellogg launched its Frosted Flakes brand of cereal in a space saving box in the US in 2009.
The box is designed to make more efficient use of shelf space, aid stacking and open up more
merchandising options.

94
Figure 33: Kellogg's Frosted Flakes space-saving cereal box
Source: Product Launch Analytics BUSINESS INSIGHTS
The changing position of bakery and cereal products Private label was a dominant product tag among new product introductions over 2007–10. Private lable than
tripled its share of new product launches over the last four years, to reach a 9.5% share in 2010. In contrast,
upscale product launches saw a decline of 1.9 percentage points through 2007–10, indicating the impact that
the recession on consumer preferences. While price has been the primary motivator for the switch from
branded to private labels, particularly during challenging economic environment, what is concerning for
branded manufacturers is degree to which consumers may see the switch as permanent, i.e. that the
price/quality compromise is acceptable.
Consumer demand for healthier products has spurred the growth for additive-free, pure and minimally
processed bakery and cereals. A key link is that of good health and natural ingredients: other claims, such as
'no preservatives', 'no artificial color', 'no artificial flavor' and 'organic' also make it into the top 20 claims list.
'High fiber' also accounts for a 6.4% share of all claims for new launches in 2010.

95
Table 31: Top 20 claims for new bakery and cereals launches (% of products with claims), 2007–10
Claims 2007 2008 2009 2010 GrowthPrivate label 3.0% 3.5% 7.0% 9.5% ▲High fiber 6.7% 6.9% 6.5% 6.4% ▼Natural 4.7% 4.8% 4.3% 5.3% ▲No preservatives 3.5% 3.8% 3.6% 4.6% ▲Organic 3.4% 4.1% 5.0% 4.5% ▲No artificial color 2.3% 2.9% 3.0% 4.0% ▲No gluten 1.8% 2.5% 2.4% 4.0% ▲No trans-fat 4.2% 3.9% 4.4% 4.0% ▼High vitamins 5.3% 5.3% 5.4% 3.9% ▼Single serving 6.1% 5.0% 3.9% 3.6% ▼No artificial flavor 1.9% 2.2% 2.1% 3.3% ▲Vegetarian 2.8% 2.1% 3.0% 2.9% ▲Kids 3.8% 3.2% 3.0% 2.4% ▼Low fat 3.3% 3.2% 2.9% 2.3% ▼Upscale 4.2% 5.1% 4.0% 2.3% ▼High minerals 2.2% 2.6% 2.6% 1.9% ▼No cholesterol 2.3% 2.0% 2.5% 1.8% ▼Low calories 2.1% 2.1% 2.4% 1.8% ▼No wheat 1.1% 1.2% 0.8% 1.8% ▲High calcium 2.8% 2.3% 2.3% 1.6% ▼ Note: year end May 31, 2010.
Source: Product Launch Analytics BUSINESS INSIGHTS

96
Flavor trends Table 32 below outlines the top 20 flavors used in the bakery and cereals market. However, these flavors
account for only 41.2% of all flavors used in new product launches in 2010, which is indicative of the diverse
range of new flavors being introduced onto the market.
Chocolate continues to be the most commonly used flavor: 9.6% of NPD in the bakery and cereals market in
2010 was chocolate flavored, a marginal increase of 0.5 percentage points since 2007. Fruit flavors have
also risen in importance, having 11.3% of the top 20 claims for new launches in 2010. Ongoing regulatory
campaigns that encourage consumers to include fruit and vegetables in their daily diet have, in part,
triggered innovations in fruit flavors. These are being led by strawberry, which was the second most common
flavor among all launches in 2010.
The market has also seen the growth of flavor combinations such as chocolate vanilla and strawberry
banana. Flavor blends will continue to growth, as manufacturers develop more variations on traditional single
flavors, such as oatmeal and honey, or vanilla and honey.

97
Table 32: Top 20 flavors for new product introductions (% of bakery and cereal product launches), 2007 and 2010
Flavor 2007 2010 GrowthChocolate 9.1% 9.6% ▲Strawberry 3.1% 2.9% ▼Vanilla 2.5% 2.4% ▼Oat 2.5% 2.3% ▼Almond 1.8% 2.1% ▲Apple 2.6% 1.9% ▼Honey 2.0% 1.9% ▼Wheat 2.7% 1.7% ▼Cookie 0.6% 1.6% ▲Hazelnut 1.3% 1.6% ▲Cream 1.7% 1.5% ▼Raisin 1.5% 1.5% ▼Cocoa 1.1% 1.4% ▲Coconut 1.6% 1.4% ▼Cinnamon 1.5% 1.3% ▼Orange 1.4% 1.3% ▼Milk chocolate 1.3% 1.3% –Cheese 1.2% 1.3% ▲Lemon 1.4% 1.2% ▼Banana 1.1% 1.2% ▲ Note: year end May 31, 2010.
Source: Product Launch Analytics BUSINESS INSIGHTS

98
Chapter 5 Key trends and product examples
Summary Manufacturers’ growing focus on reducing fat, sodium and sugar in bakery and cereals has led to
the development of trans-fat-free products, calorie-counted portion packs and the further
fortification of baked goods and cereals with nutritious ingredients such as whole grains.
Regulatory pressures in developed markets such as Europe, which require bakery and cereals
manufacturers to provide sufficient evidence for functional claims, are driving the use of
ingredients found in rival categories, such as dairy products and soft drinks. By using established
ingredients such as prebiotics, probiotics and guarana, companies are avoiding having to conduct
new and expensive research and development.
Bakery and cereals manufacturers are targeting niche segments such as children, and health-
cautious and ailing consumers by offering healthier alternatives such as low calorie sweeteners,
superfoods and gluten-free products.
Innovations in packaging are being driven by sustainability and the potential of recyclable and
biodegradable materials to help limit environmental impact.
The ‘natural’ tag is increasingly being used for new product launches, to display product
characteristics such as traditional and authentic ingredients.

99
Introduction The four major prevailing trends in the bakery and cereals market are health and wellness, private label,
sustainability, and indulgence.
Health and wellness The industry-wide trend to reduce fat, sodium and sugar in bakery and cereals has led to the development of
trans-fat-free products and calorie-counted portion packs, as well as the increasing use of nutritious
ingredients such as whole grains. The impact of this trend on different product ranges, including functional
bakery and cereal goods, sports and energy products, and natural bakery and cereal produce, are analyzed
in this section. This section also highlights how key players in the traditional bakery and cereals market have
reformulated their product lines in order to meet consumer and regulatory demand for healthier foods. The
main sub-trends are detailed below.
Using healthy ingredients found in other food categories
In an effort to replicate success in new product development, bakery and cereal manufacturers have used
ingredients more commonly associated with other food and drinks categories. This has been particularly
evident in the area of health and wellness. By adding functional benefits that have already been proven
elsewhere, bakery and cereal products are able to target a wider consumer base, and specific niches at an
age and lifestyle level.
Probiotics
Probiotics are a reasonably mature concept in dairy products. They have been shown to aid digestion, a
common problem globally, and have now found their way into certain baked goods. Although the concept is
currently at a nascent stage, with probiotic bakery and cereal products constituting only 0.2% of all new
launches made during 2007–10, the use of these ingredients will help new products gain a wider audience.
However, incorporating probiotics into baked goods poses several challenges as they are sensitive to heat,

100
moisture and oxygen. This limits the application of probiotics to dairy or chocolate-based fillings, grain
toppings and icing.
Probiotic products are common in developed countries such as the US and the UK. Attune's All Natural
Digestive Health Probiotic Granola Munch, launched in the US in 2010, exemplifies this trend. Available in
three different flavors, this granola product has been made with whole grains to provide consumers with
fiber. Each serving of the Apple Cinnamon with Yogurt Chips variety has been infused with one billion
colony-forming units (CFU) of probiotics, as well as prebiotic yoghurt chips, which are suggested to help
good bacteria balance the system of the body.
Figure 34: Attune's All Natural Digestive Health Probiotic Granola Munch
Source: Product Launch Analytics BUSINESS INSIGHTS
Energy bakery and cereal products
Manufacturers are also incorporating ingredients that are usually found in energy drinks, such as ginseng
and guarana, to target active consumer segments, such as gym and sports enthusiasts as well as more
mainstream active and busy consumers. Increasingly, the shift is from harder, sports-oriented positioning to
a softer lifestyle one. Some of ginseng's claimed medicinal benefits include treating depression, fatigue,
nervousness and stress. Similarly, guarana reduces mental fatigue and can help improve mood and mental
alertness.

101
Isostar's Pulse Easy Power cereal bars were launched in Germany in 2010 and represent an attempt to
capitalize on the growing demand for energy products. The product range includes coconut, chocolate and
guarana; chocolate and guarana; and chocolate, hazelnut and guarana variants. The combination of
chocolate with cereals and guarana also helps position the bars as indulgence products. Additionally, they
have 50% less fat than conventional chocolate bars, thus allowing consumers to indulge and stay healthy.
Graphics on the packaging indicate that the product is targeted at consumers who are involved in sports and
other physical activities.
Figure 35: Isostar Pulse Easy Power cereal bars
Source: Product Launch Analytics BUSINESS INSIGHTS
Targeting niche markets
Certain innovations in the bakery and cereals market have targeted niche consumers segments. Key areas
include gluten-free products and alternative-sweetener-based bakery and cereals.
Gluten-free products
Driven by a growing perception among consumers of gluten intolerance the gluten-free foods market is
expanding. Consumers who do not have gluten intolerance are also purchasing gluten-free products for
digestive health, weight management and nutritional reasons. An example of a new product in this market is
Racao Humana Quinoa e Amaranto, launched in Brazil in 2010 by Vitalin Alimentos Saudaveis. The product
is labeled as gluten-free, due to the absence of wheat. Additionally, it has been made from ingredients such

102
as quinoa, amaranth and flax flour, which are claimed to help in weight management and strengthen hair,
nails and skin.
Figure 36: Vitalin Racao Humana Quinoa e Amaranto
Source: Product Launch Analytics BUSINESS INSIGHTS
However, removing gluten poses a technological challenge, particularly in bakery and cereals goods,
because it possesses unique properties that are often necessary for the retention of gas during fermentation
and the preservation of moisture levels in dough. This, in itself will limit the appeal of gluten-free ingredients
for both consumers and manufacturers alike.
Alternative-sweetener-based bakery and cereals
Through the use of natural sweeteners, the bakery and cereals industry is following soft drinks. High fructose
corn syrup (HFCS), which is commonly used to sweeten bakery and cereal products, has come under severe
criticism as it has a high glycemic index rating and can raise blood glucose levels, in which increases the risk
of type 2 diabetes. Manufacturers are therefore substituting HFCS with natural sweeteners to reduce health
concerns and accommodate the growing effort to combat obesity. These sweeteners could even help to
purge the negative image of sweet baked goods. Some of the commonly used sugar substitutes are agave
nectar, stevia/sucralose, and maple syrup.

103
Agave nectar
Agave nectar is extracted from the agave plant, and is approximately 25% sweeter than sugar. Agave nectar
primarily consists of fructose and glucose, and has a lower glycemic index than table sugar. An example of a
bakery product sweetened with agave nectar is GrandyOats' Goji Agave Organic Granola, launched in the
US in 2010. The juice of antioxidant-rich blueberries is combined with agave nectar to impart a sweet taste to
the granola. While the agave nectar helps in weight management, the fruit contained in the product, including
goji berries, cranberries and raisins, further enhance the nutritional quotient of the product. In addition, the
ingredients have been organically farmed, putting any consumer fears of contamination to rest. Furthermore,
the product is packaged in an environment friendly non-Bisphenol-A recyclable plastic cup, enhancing its
sustainability credentials. The product can be combined with milk, yogurt and ice cream, as well simply being
eaten by the handful. The low preparation time for the product makes it a convenient yet healthy option for
time-constrained consumers on a diet.
Figure 37: GrandyOats Goji Agave Organic Granola
Source: Product Launch Analytics BUSINESS INSIGHTS
Stevia
Stevia is another sweetening option that manufacturers are leveraging to reduce the sugar content in baked
goods. While commonly used in carbonated beverages, its thermal and pH stability allows for a number of
bakery applications in different baking and storage conditions. Granix Cereal Free from Alimentos Granix,
launched in 2010 in the Argentinean market, is sweetened using stevia. The cereal is also free from trans fat

104
and cholesterol, and is low in sodium, making it ideal for diabetic, hypertensive and obese consumers. The
product is also fortified with fiber, further enhancing its nutritional credentials.
Figure 38: Granix Cereal Free
Source: Product Launch Analytics BUSINESS INSIGHTS
Maple syrup
Made from the sap of sugar maple, red maple or black maple trees, maple syrup has emerged as another
glycemic-index-friendly sweetening alternative. Although this sweet syrup has a distinct flavor of its own, it
complements other common bakery ingredients such as butter, brown sugar, oats and whole grains, fruit and
nuts. The Gluten-free Chocolate Torte a la Cocoa Gourmet Dessert, manufactured by Nickanedit in 2009 for
the US market, is made using maple syrup and honey. The sweetener combination helps keep the glycemic
index low, while targeting consumers with blood sugar problems. The handmade chocolate used in the
dessert is indicative of the care that has been taken in the manufacturing process. Apart from chocolate, the
product also contains nuts such as almonds and cashews, making it suitable for consumers allergic to
gluten, as well as those on vegan diet.

105
Figure 39: Nickanedit Gluten-free Chocolate Torte a la Cocoa Gourmet Dessert
Source: Product Launch Analytics BUSINESS INSIGHTS
Other sweeteners that are still at an early stage of development in the bakery and cereals market include
grain and starch-based natural sweeteners, such as rice syrup, and lactitol, a crystalline structure that acts
as sugar but is only 40% as sweet.

106
Wellness ingredients
This trend is mainly driven by health-conscious consumers, who want to eat healthier food compared to
traditional offerings available in the market. Wellness ingredients include:
Plant sterols;
Palm oil, the new alternative to hydrogenated oils;
Whole grains;
Vegetable and fruit-based bakery and cereal products;
Superfoods.
Plant sterols
One form of fortification that is still at a nascent stage is the addition of plant sterols to bakery and cereal
products, to help position them at health conscious consumers. Plant sterols help to reduce cholesterol
levels by reducing its absorption in the intestines. In the US, the FDA recommends a daily total intake of at
least 0.8 gram of plant sterols as part of a diet low in saturated fat and cholesterol, as it may help reduce the
risk of heart disease. One example of a product that includes plant sterols is Heart to Heart Whole Grain
Crackers in Original and Roasted Garlic variants, manufactured by Kashi Company for the US in 2010.
These crackers contain wholewheat to provide consumers with fiber and are fortified with plant sterols to
reduce cholesterol. Additionally, they contain antioxidant properties derived from extracts of green and white
tea, to position the product as suitable for health conscious consumers. Furthermore, the product contains
vitamins E and C, beta carotene, which enhances the product’s heart health credentials, and is free from
trans-fat and saturated fat.

107
Figure 40: Kashi's Heart to Heart Whole Grain Crackers
Source: Product Launch Analytics BUSINESS INSIGHTS
Palm oil – the new alternative to hydrogenated oils
The introduction of palm oil as an alternative to hydrogenated oils, which have been identified as a key
element in contributing to the rising levels of obesity, is helping to spur innovation in bakery and cereals
products. Palm oil is trans-fat free, odorless and tasteless, rich in antioxidants, promotes cardiovascular
health, and also provides longer shelf stability.
When palm oil is melted and cooled rapidly, it separates into an upper liquid component and a solids fraction
below. The upper fraction is preferred by manufacturers because it contains more unsaturated fatty acids,
including polyunsaturated fatty acid, which is good for the heart. Additionally, it allows manufacturers to
position their products as functional products, aimed at patients that are suffering from specific diseases, as
well as health conscious consumers. During 2007–10, 7% of all new product launches were made using
palm oil. Diatgenuss Wiener Sandringe cookies, manufactured by Coppenrath Feingeback in 2010 for the
Saudi Arabian market, are one example. Because it uses palm oil and contains maltitol, a sugar alcohol that
has almost the same amount of sweetness as sugar but fewer calories, the product is marketed towards
diabetic patients.

108
Figure 41: Coppenrath's Diatgenuss Wiener Sandringe cookies
Source: Product Launch Analytics BUSINESS INSIGHTS
However, the use of palm oil has also attracted controversy as manufacturers of the oil usually clear large
sections of rainforests for their plantations, causing environmental disruption. In 2009, the World Wildlife
Fund (WWF) issued a warning to all manufacturers to adopt sustainable practices after a number of forests
were cleared to make way for more palm plantations in South Asia.
Whole grains
Whole grains were used in 3.6% of all new product launches across the bakery and cereals market during
2007–10. Wasa's Whole Grain Crispbread, launched in the US in 2010, is made with only natural
ingredients, indicating that the product is free from preservatives and additives. Rye whole grains offer
various nutrients including dietary fiber, protein and vitamin B1 and are a rich source of antioxidants. Wasa's
product is also low in calories and sodium, and contains no fat, making it a suitable option for weight
watchers as well.

109
Figure 42: Wasa's Whole Grain Crispbread
Source: Product Launch Analytics BUSINESS INSIGHTS
Increasingly, flour mills are going beyond their traditional wholewheat offerings to create flours for a range of
specialty products and markets. For example, ConAgra Mills in Nebraska is now producing Yoshon flour for
the Jewish community. Yoshon is a Hebrew term for 'old', and refers to a grain that has taken root before the
second day of Passover. Another development is the introduction of whole-wheat and premium flours. In
addition to acting as a substitute for white flour in baked products, wholewheat flours provide the consumer
with the health benefits of whole grains. At the same time, renewed interest in artisanal bakery is driving
demand for different types of flours, and particularly small scale, sustainable bakery ingredients.

110
Use of fruits and superfoods
Fruits and nuts have always had a role in cereals such as muesli products. The key change occurring at the
moment is the range of fruits being used, the volume of fruits used in some breakfast cereals and the way in
which superfoods are being integrated into bakery and cereals. As an indication, the private label product
Carrefour's Musli cu Fructe, manufactured by SC Rommac Trade and launched in Romania in 2010,
contains nine fruits, which are labeled as comprising 40% of the product. While muesli has nutritional
benefits such as fiber and proteins, the addition of fruits to the product enhances its nutrition quotient.
Figure 43: Carrefour's Musli cu Fructe
Source: Product Launch Analytics BUSINESS INSIGHTS
Foods that are high in phytonutrients that impart specific health benefits are known as 'superfoods'. Although
this term has only recently emerged, the interest in superfoods will grow because they are rich in
antioxidants. New England Naturals' Organic Granola, available in Antioxidant, Gluten-Free and Omega
Hemp and Flax variants, was launched in the US in 2010. The product is sold in re-sealable pouches
designed to aid convenience and to maintain freshness. In addition to using all organic ingredients, the
Antioxidant variety has been infused with cranberries, goji berries and blueberries, which are all sources of
nutritious ingredients such as fiber.

111
Figure 44: New England Naturals' Organic Granola – Antioxidant and Gluten-Free variants
Source: Product launch Analytics BUSINESS INSIGHTS
Since 2008, flaxseeds have increasingly been used in bakery and cereal products, as they contain alpha
linolenic acid, which helps to lower cholesterol, blood triglycerides and blood pressure. Flaxseeds also serve
as a good source of fiber and antioxidants.
An example of the use of flaxseeds in bakery products is Doctor in the Kitchen's Flackers Flax Seed
Crackers, available in Dill, Rosemary and Savory variants, launched in the US in 2010. Made from organic
flaxseeds, the product is high in Omega-3 fatty acid, which helps to reduce the risk of heart disease and
cholesterol. Additionally, the product is gluten free, making it suitable for consumption by consumers allergic
to gluten, as well as vegans and vegetarians. Moreover, the product has a low glycemic index level and is
low in sodium, thus reducing the chance of obesity and hypertension.

112
Figure 45: Doctor in the Kitchen's Flax Seed Crackers, packaging and nutrition information
Source: Product Launch Analytics BUSINESS INSIGHTS
Weight management
Manufacturers have responded to consumers wanting more options to slim down or maintain their weight
with a range of weight management products, which address issues such as portion control and satiety.
Portion control
Portion control not only allows manufacturers to target consumers that are interested in weight management,
but also children, whose choices are often closely monitored by parents. FullBar diet bars are specially
designed for consumers that wish to manage their weight. These all-natural ingredient products offer
individual serving sizes that help consumers track their calorie intake. The product also trades on the fact
that it was created by a weight-loss surgeon.

113
Figure 46: FullBar - 100% Natural Bar - Cinnamon Roll
Source: Product Launch Analytics BUSINESS INSIGHTS
Satiety products
This trend is relatively new to the bakery and cereals market, and continues to make an impact. This is
because most existing satiety products aim to stop consumers from indulging in bakery and cereal items
between meals, rather than encouraging their consumption. Satiety products ensure a sustained release of
carbohydrates into the blood, thereby prolonging the feeling of fullness.
Additionally, low glycemic products lead to small fluctuations in blood glucose and insulin levels, resulting in
a reduction in the risk of heart disease and diabetes, while at the same time enabling weight loss. One
example of such a product is the Otsuka Soyjoy Snack Bar. This product, launched by Otsuka
Pharmaceutical Company in 2010 for consumers in China and Japan, is made from powdered whole
soybeans and real dried fruit. Containing a low glycemic index level, the product has been positioned as one
that releases glucose more steadily and slowly into the system, thus helping in weight management.

114
Figure 47: Otsuka Soyjoy Snack Bar – strawberry variant
Source: Product Launch Analytics BUSINESS INSIGHTS
Appetite suppressants are also being used in bakery and cereals products to assist with weight
management. Slim 'n Fit Wheaten Bread, manufactured by Gardenia Bakeries and launched in the
Philippines in 2010, contains L-Carnitine, an ingredient which is said to reduce fat mass, increase muscle
mass and reduce fatigue, thus helping weight watchers maintain their fitness regimes. In addition, the
product is also free from cholesterol and trans fat, and includes high levels of fiber, iron and vitamins B1, B2
and B3, to enhance its positioning as a weight management product.
Figure 48: Gardenia's Slim 'n Fit Wheaten Bread
Source: Product Launch Analytics BUSINESS INSIGHTS

115
Private label Private label product launches grew significantly over 2007–10, to account for 43.9% of all new product
launches in 2010 in the bakery and cereals market, compared to 11% in 2007. This growth can be attributed
to two main factors:
A lower price point driving sales in a challenging economic environment; and
The emergence of a more effective value proposition.
The economic downturn has made many consumers switch to private label products. At the same time
private label manufacturers are using higher quality ingredients and better product packaging - and in some
cases are innovating before branded manufacturers. Claims made on private label bakery and cereal
products in 2010 were consistent with the health, natural and sustainability trends. These trends will continue
to grow, with manufacturers seeking to include exotic ingredients and develop new flavor combinations.
Figure 49: Share of private labels in new product launches (%), 2007–10
11.0%
15.5%
29.6%
43.9%
0%
5%
10%
15%
20%
25%
30%
35%
40%
45%
50%
2007 2008 2009 2010
Sha
re o
f priv
ate
labe
ls in
new
pro
duct
laun
ches
20
07–1
0 (%
)
Year end December 31, 2009.
11.0%
15.5%
29.6%
43.9%
0%
5%
10%
15%
20%
25%
30%
35%
40%
45%
50%
2007 2008 2009 2010
Sha
re o
f priv
ate
labe
ls in
new
pro
duct
laun
ches
20
07–1
0 (%
)
11.0%
15.5%
29.6%
43.9%
0%
5%
10%
15%
20%
25%
30%
35%
40%
45%
50%
2007 2008 2009 2010
Sha
re o
f priv
ate
labe
ls in
new
pro
duct
laun
ches
20
07–1
0 (%
)
Year end December 31, 2009. Source: Business Insights BUSINESS INSIGHTS

116
One good example of a health and wellness private label product is the Sans Gluten Tartines Craquantes
Riz et Mais (rice and corn crispbreads) launched in France in 2010, manufactured by Casino in association
with the French Association of Gluten Intolerance (AFDIAG; l'Association Française des Intolérants au
Gluten). The product is marked as gluten-free, identifiable by the "ear of wheat” logo on the package.
Figure 50: Casino's Sans Gluten Tartines Craquantes Riz et Mais
Source: Business Insights BUSINESS INSIGHTS
Sustainability Although ‘green issues’ are not always the defining factor in a purchase decision, consumers are
increasingly concerned with a company’s approach towards sustainability. Two sub-trends in this category
are packaging developments – making product packaging greener - and provenance – being more
transparent about the product’s journey from field to store.
Packaging developments
In addition to reducing waste, environmental friendly packaging is being used as a marketing tool to make
consumers feel better about what they buy. This has increased investment in the development of
biodegradable plastic packages, either made from botanicals or from recyclable/recycled materials. Stringent
environmental and recycling regulations imposed by governments are also influencing such packaging
developments.

117
Flax4Life's Chocolate Chip Granola, launched in the Canadian and US markets in 2010, is contained in a
biodegradable package made from recycled material and lined with polylactic acid, a corn-based
compostable product. Another such product is Pure NRG's Fresh Baked Vegan Nutrition Chia Breakfast Bar,
manufactured in 2010 by Pure NRG for consumers in the US. This nutrition bar is free from preservatives,
dairy, gluten, chemicals and animal products. Additionally, the product is made from 100% recycled paper,
using soy-based ink and a water-based coating, which makes it biodegradable, thus catering to the
sustainability trend. One of the main trends is green credentials are migrating over from niche, ethical brands
to mainstream brands.
Figure 51: Pure NRG's Fresh Baked Vegan Nutrition Chia Breakfast Bar
Source: Product Launch Analytics BUSINESS INSIGHTS
Packaging developments are not restricted to the materials used. For instance, Immaculate Baking's Dark
Chocolate Biscotti Crunch with Cinnamon and Almond, launched in the US in 2010, uses eco-friendly ink on
the packaging to address ethical considerations. In addition, the cookies are available in stand-up bags or a
reusable tin, to cater to the convenience demands of consumers.

118
Figure 52: Immaculate Baking's Dark Chocolate Biscotti Crunch
Source: product Launch Analytics BUSINESS INSIGHTS
Provenance
Contamination scares – especially in Asia Pacific – are a key reason for consumers seeking products that
are made from ingredients procured from particular regions. Contamination issues led the FDA to restrict the
importation of Chinese food and other products from entering into the US market in 2007. Such regulatory
actions are increasing the level of interest in the origin of particular products and ingredients. Manufacturers
are beginning to use the issue of provenance as a way to differentiate products, particularly from cheaper
private label options.
A defining factor, however, is the way in which sustainability and provenance are being used as indicators of
product quality. Sustainability, by itself, is less an inherent feature than a complementary one:
It enhances health or premium credentials.
But many consumers are unwilling to specifically pay a price premium;
And lack of sustainability is increasingly a corporate liability.

119
In essence, sustainability and provenance are becoming part of a larger ecosystem, whereby being able to
show a product’s ethical credentials and lifecycle bring in wider ideas about how healthy the product is and
how exclusive it is.
Figure 53: Sustainability and provenance bringing in wider values of health and exclusivity
Local Natural/organic
Authentic Transparent / certified
Biodegradable/recyclable
FairFresh
TastyExclusive
Good for you
Made with care
Guilt-freeLocal Natural/organic
Authentic Transparent / certified
Biodegradable/recyclable
FairFresh
TastyExclusive
Good for you
Made with care
Guilt-freeLocal Natural/organic
Authentic Transparent / certified
Biodegradable/recyclable
FairFresh FairFresh
TastyExclusive
Good for you
Made with care
Guilt-free
Source: Business Insights BUSINESS INSIGHTS

120
Indulgence
Tiers of premiumization
The primary effects of the recession on indulgent products have been a pronounced shift towards tiering
among premium products and consumers choosing to trade down to what they consider to be everyday
indulgences, as opposed to eating out or conspicuous consumption. A secondary, related, effect has been
that consumers have reevaluated what they consider worth paying a premium for. However, in many
countries, especially in Asia Pacific, where the impact of the recession has been negligible, indulgence is still
a massive driver of growth. The emerging middle classes are not only choosing to buy more indulgent
products, but they are also using those products as a way of denoting their economic status.
Figure 54: Tiers of premiumization in food and drinks
Super premium Super or ultra premium is not present in all categories. Denoted by low volumes, highest price point and highly specific product claims.
PremiumConsists of smaller brands but may be made by a large manufacturer. Denoted by a high price point and the product image and quality contribute to the premium status.
Masstige Consists of premium private labels, premium variants of mainstream brands and brands with “accessible premium" posit ioning.
Mainstream Includes standard quality private label brands. Examples include historical brand/product leaders.
Budget Basic private label and budget brands.
Source: Business Insights BUSINESS INSIGHTS
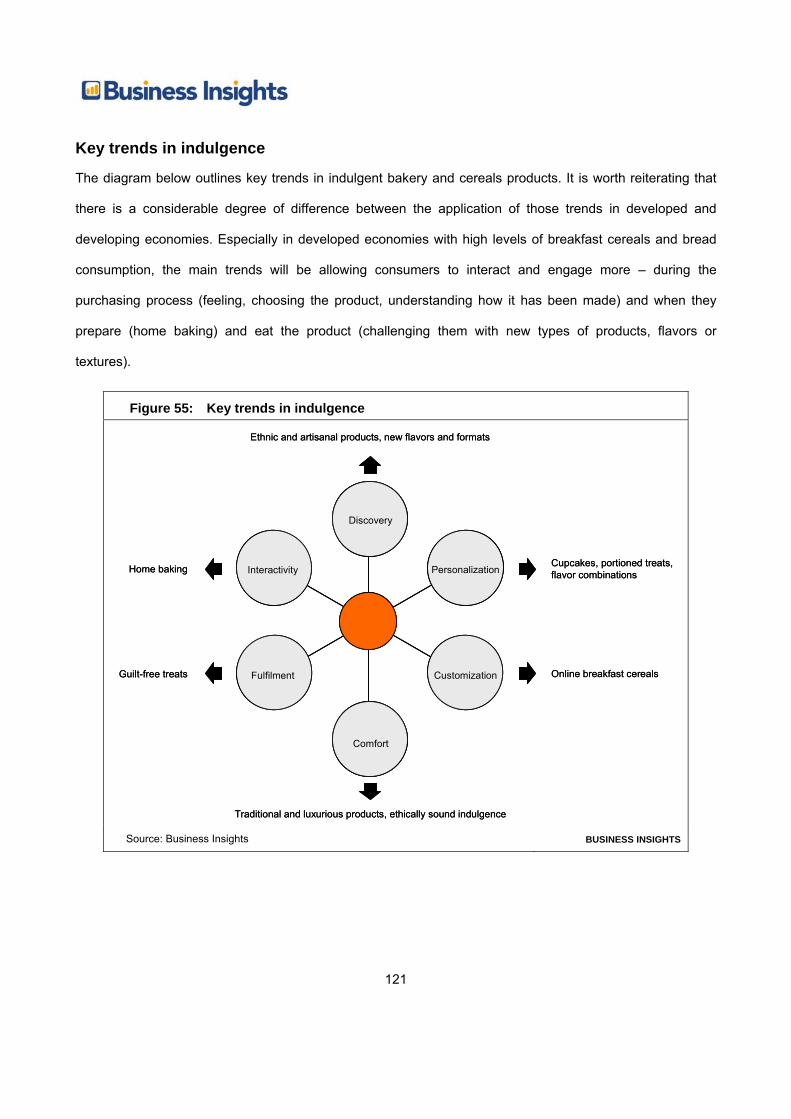
121
Key trends in indulgence
The diagram below outlines key trends in indulgent bakery and cereals products. It is worth reiterating that
there is a considerable degree of difference between the application of those trends in developed and
developing economies. Especially in developed economies with high levels of breakfast cereals and bread
consumption, the main trends will be allowing consumers to interact and engage more – during the
purchasing process (feeling, choosing the product, understanding how it has been made) and when they
prepare (home baking) and eat the product (challenging them with new types of products, flavors or
textures).
Figure 55: Key trends in indulgence
Discovery
Personalization
Customization
Comfort
Fulfilment
InteractivityCupcakes, portioned treats, flavor combinations
Online breakfast cereals
Ethnic and artisanal products, new flavors and formats
Traditional and luxurious products, ethically sound indulgence
Guilt-free treats
Home baking
Discovery
Personalization
Customization
Comfort
Fulfilment
Interactivity
Discovery
Personalization
Customization
Comfort
Fulfilment
InteractivityCupcakes, portioned treats, flavor combinations
Online breakfast cereals
Ethnic and artisanal products, new flavors and formats
Traditional and luxurious products, ethically sound indulgence
Guilt-free treats
Home baking
Source: Business Insights BUSINESS INSIGHTS

122
Underlying more indulgent bakery and cereal products are two broad positionings:
• Pure indulgent – the product is positioned as a luxury or a treat;
• Less guilty indulgent – the product is still a luxury, but its ingredients or manufacture make it
healthier and/or more sustainable and may even enhance how exclusive it is.
The idea of not only managing “guilt” when consumers are indulging, but refocusing it as a positive feature is
a key feature of the bakery and cereals market:
Weight issues > portioned products, and every day indulgence.
Health concerns > promoting the flavors of ingredients such as spelt and whole grains in bakery,
and exotic fruits and nuts in cereals.
Concerns about the environment > local, sustainable, artisanal products with a low carbon
footprint that are made with care.
Insecurity > retreating to the comfort of known, traditional, or childlike products.
Wanting to engage > home baking, making your own cereal.
At the same time, especially in less developed markets, indulgent bakery and cereal products are heading in
a different direction:
Conspicuous consumption > upscale, more luxurious products being used to indicate status, and
used as gifts.
Changing consumption patterns > consumers shifting to a more European/US type diet, driving
growth of cakes and pastries and breakfast cereals.
Innovation in flavors > Products are taking traditional forms in many cases, but with
unconventional, and often local, flavors.

123
Chapter 6 Conclusions
Five key trends for the future This chapter presents the key trends that are likely to drive growth in the global bakery and cereals market
over the next five years.
1 - Alternative natural sweeteners
With consumers looking to manage their weight by cutting sugar from their diets, manufacturers are
emphasizing the use of alternatives to sugar and high-fructose corn syrup in their sweet baked goods. While
artificial sweeteners have come under a great deal of criticism, led by their adverse health effects, the
emergence of low glycemic natural sweeteners such as stevia has led bakers to increasingly incorporate
them in their products.
Although they are still a nascent concept in the bakery and cereals market compared to other categories
such as soft drinks, the trend toward alternative natural sweeteners will gain momentum, as manufacturers
look to respond to growing consumer demand. Moreover, the pH stability of these natural sweeteners and
their ability to perform well in extreme temperatures further facilitates their incorporation into bakery and
cereal products.
2 - Whole grains and healthier ingredients
Government initiatives educating consumers about the health benefits of whole grains and ‘traditional’
wheats such as spelt have raised awareness and demand for whole grain-based products. Whole grain
blends will also see greater traction as ingredients for bakery and cereals products because they help to
create distinct flavor and texture profiles, while also enhancing the nutritional profile of the product.
The key development is positioning healthier wheat-based products away from being just about health to
promoting the flavor, texture and in some cases the heritage of new ingredients.

124
3 - Indulgence in developed and developing markets
There is a clear division in terms of how the trend for indulgent bakery and cereals products is happening in
developed and developing markets. In many developed markets, there is a noticeable swing towards
managing guilt – products that make some health claims and/or are positioned as sustainable. In developing
markets, the trend for indulgent products has been much more about conspicuous consumption, and gifting
is much more important.
4 – Crossover with other product categories
Taking cues from other categories such as soft drinks and dairy products, manufacturers have started using
a wider range of functional ingredients in bakery and cereal products. Largely used in the dairy market and
known to impart digestive health benefits, probiotics and omega-3 are increasingly being incorporated in new
bakery and cereals products. It is also clear that in areas such as cereal bars that manufacturers are
positioning brands more directly as a healthier alternative to confectionery.
5 - Provenance
Contamination fears and consumer trust in supplies from particular regions are driving the trend for
provenance. This trend is growing stronger, with consumers increasingly seeking natural and healthy food
products, particularly in developed countries. Manufacturers are responding to this trend by procuring
ingredients from trusted regions. This trend will increasingly support the growth of artisanal bakeries and
private label products, as they procure ingredients from local sources, enabling traceability, while also
enhancing consumer confidence.