innovation funding incentive annual report 2010/11 · ifi 0701 - ena ifi projects ... recognised...
TRANSCRIPT

Innovation Funding Incentive Annual Report
2010/11


IFI Annual Report 2010/11
Page 1 of 85 SP Power Systems Limited Registered Office: 1 Atlantic Quay Glasgow G2 8SP
Registered in Scotland No. 215841 Vat No. GB 659 3720 08
Foreword Welcome to the SP Energy Networks’ Innovation Funding Incentive (IFI) Annual Report for 2010/11. Last year alongside our IFI work we started our journey on the Low Carbon Network Fund (LCNF). The two incentives have emphasised the key role innovation plays in delivering sustainable networks that are fit for the future. With the increased dynamics of the network and new types of generation and demand such as photovoltaic and heat pumps our networks need to be smarter in accommodating new technologies. The electricity network will be an integral part of delivering the UK future energy requirements and environmental targets. It is important that our industry collectively grasps the opportunity presented by IFI and LCNF to prepare for, and indeed shape, the energy requirements of the future. It has been encouraging to see many of our IFI projects culminating to LCNF projects hence ensuring technologies are progressed into early adoption. Our IFI projects on HV and LV monitoring are now deployed into our smart grid developments in Glasgow and Liverpool areas. We are integrating our dynamic thermal rating work into our operational systems and we will continue to integrate our IFI projects into large scale LCNF deployment. Our work with academia has progressed significantly and now our ScottishPower Advanced Research Centre (SPARC) IFI initiative is delivering analysis tools to engineers in the business. We have also announced to sponsor a chair in smart grids at the University of Strathclyde to direct our SPARC activities and drive forward future research and development in the areas of smart grids for both the distribution and transmission systems. It has also been tremendously rewarding to see one of our IFI projects being recognised by the UK industry as one of the best innovative projects. Our work into thermal modelling and active network management (IFI 0513) collected the IET innovation award for 2010 in the category of Power and Energy. We embarked into this technology and its potential in 2005 and it took three years to develop a prototype product with our partners Alstom Grid, Astrium, Durham University and Parsons Brinkerhoff. Following the success of the IFI trial we are now further developing this to cover a larger part of our network and deploy into our operations. This is but one example of our focussed and directed effort into innovation. It is an exciting time to be involved in the energy industry and it is particularly pleasing to see the network companies engaging collaboratively through innovation to address the challenges of the future. Frank Mitchell CEO, SP Energy Networks

IFI Annual Report 2010/11
Page 2 of 85 SP Power Systems Limited Registered Office: 1 Atlantic Quay Glasgow G2 8SP
Registered in Scotland No. 215841 Vat No. GB 659 3720 08
Contents
FOREWORD ........................................................................................................................... 1
1. INTRODUCTION & BACKGROUND .................................................................................... 4
1.1 Context ...................................................................................................................... 4
1.2 Innovation Funding Incentive (IFI) .............................................................................. 4
2. SP ENERGY NETWORKS STRUCTURE ................................................................................ 5
3. OVERVIEW ..................................................................................................................... 6
3.1 IFI Overview .............................................................................................................. 6
4. SUMMARY TABLES ......................................................................................................... 7
5. ACHIEVEMENTS FOR 2010/11 ......................................................................................... 8
5.1 Development of Partnerships ..................................................................................... 8
5.2 Power Networks Demonstration Centre ..................................................................... 8
6. HIGHLIGHTS FROM 10/11 ............................................................................................. 10
6.1 Development of Distance to Fault and Impedance Mapping ...................................... 10
6.2 LV Automation and LR1 Smart Grid .......................................................................... 11
6.3 PMU Utilisation for WAMPAC .................................................................................. 12
6.4 Climate Risk Assessment .......................................................................................... 13
7. ULTRA LOW CARBON VEHICLE DEMONSTRATION PROGRAM (ULCVD) ........................... 15
APPENDIX A – EXPENDITURE BREAKDOWN OF PROJECTS BETWEEN LICENCES ....................... 16 Summary Table Notes ........................................................................................................................... 17 Cost Breakdown .................................................................................................................................... 17 Programme Management Costs ........................................................................................................... 17 Net Present Value (NPV) source ........................................................................................................... 17 Project Progress Curves ........................................................................................................................ 18
APPENDIX B – PROJECT REPORTS IFI PROJECTS ..................................................................... 20 IFI 0406 - Overhead Line Fault Passage Indicators................................................................................ 21 IFI 0409 - LV Fault Location Devices ...................................................................................................... 22 IFI 0507 - Sensor Networks (Smart Dust) – Phase 2 .............................................................................. 24 IFI 0509 - Superconducting Fault Current Limiter ................................................................................. 26 IFI 0511 - Voltage Control ACTIV (EATL) ................................................................................................ 28 IFI 0513 - Thermal Modelling and Active Network Management ......................................................... 30 IFI 0515 - Power Network Demonstration Centre (PNDC) .................................................................... 32 IFI 0526 - PD Monitoring of Cables (11 & 33kV) ................................................................................... 34 IFI 0532 - AURA-NMS ............................................................................................................................ 36 IFI 0607 - LV Network Automation ....................................................................................................... 38
IFI Annual Report 2010/11
Page 3 of 85 SP Power Systems Limited Registered Office: 1 Atlantic Quay Glasgow G2 8SP
Registered in Scotland No. 215841 Vat No. GB 659 3720 08
IFI 0615 - ScottishPower Advanced Research Centre (SPARC) ............................................................. 40 IFI 0618 - Supergen 1 – FlexNet ............................................................................................................ 43 IFI 0621 – 1 Monitoring Solution for Overhead Networks.................................................................... 45 IFI 0621 – 2 Surenet – LV Sure .............................................................................................................. 47 IFI 0621 - 3 Live Alert – Energised Alert ................................................................................................ 49 IFI 0625 - Vegetation Management - ADAS .......................................................................................... 50 IFI 0701 - ENA IFI Projects ..................................................................................................................... 52 IFI 0711 - 3
rd Party ROEP Risk Assessment ............................................................................................ 54
IFI 0712 - BT 21st
Century Protection Solutions (BT21CN) .................................................................... 56 IFI 0713 - Wide Area Monitoring, Protection & Control (WAMPAC) .................................................... 58 IFI 0801 - IEC 61850 Application in SP - Transmission .......................................................................... 60 IFI 1001 – Offline Planning Tool for Dynamic Thermal Rating .............................................................. 62 IFI 1002 - Supergen HiDEF ..................................................................................................................... 64 IFI 1003 - Strategic Asset Lifecycle Value Optimisation "SALVO" ......................................................... 66 IFI 1005 - GIS Impedence Mapping - zMap ........................................................................................... 68 IFI 1007 – Outram Fault Level Monitor ................................................................................................. 70 IFI 0401 – STP 2 Overhead Lines ........................................................................................................... 72 IFI 0401 – STP 3 Cable Networks ........................................................................................................... 75 IFI 0401 – STP 4 Substations ................................................................................................................. 78 IFI 0401 – STP 5 Networks for Distributed Energy Resources............................................................... 82

IFI Annual Report 2010/11
Page 4 of 85 SP Power Systems Limited Registered Office: 1 Atlantic Quay Glasgow G2 8SP
Registered in Scotland No. 215841 Vat No. GB 659 3720 08
1. Introduction & Background 1.1 Context As part of the most recent Distribution and Transmission Price Control Reviews (DPCR/TPCR), Ofgem introduced the Innovation Funding Incentive (IFI) as a mechanism to promote and encourage network related Research & Development (R&D). In addition to the development focus of the IFI, a second incentive the Registered Power Zone (RPZ) was introduced for Distribution Licensees to promote the use of novel techniques in the connection of Distributed Generation to the network. The primary aim of the two incentives is to encourage the electricity network operators to apply innovation in the way they pursue the technical development of their networks. Ofgem recognised that innovation has a different risk/reward balance compared with a network operators’ core business. The incentives provided by the IFI and RPZ mechanisms are designed to create a risk/reward balance that is consistent with research, development and innovation. The two main business drivers for providing these incentives at this time are the growing need to efficiently manage the renewal of network assets and to provide connections for an increasing capacity of renewable generation at all voltage levels. These are significant challenges that will both benefit from innovation. 1.2 Innovation Funding Incentive (IFI) The IFI is intended to provide funding for projects focused on the technical development of distribution and transmission networks, to deliver value (i.e. financial, supply quality, environmental, safety) to end consumers. IFI projects can embrace any aspect of the distribution / transmission system asset management from design through to construction, commissioning, operation, maintenance and decommissioning. The detail of the DNO IFI mechanism is set out in the Special Licence Condition C3, Standard Licence Condition 51 (for the Distribution Licences), the Electricity Transmission Licensees’ IFI mechanism is set out in the special licence condition J5 Part 3 or special licence condition D5 part 2, and standard licence condition B16 Part C.
With the extension of IFI to the transmission licences, agreement at the ENA R&D Working Group was given to the creation of a common Good Practice Guide (GPG) considering IFI for electricity distribution, transmission and gas transmission networks; Version 2 of Engineering Recommendation G85 issued in December 07.

IFI Annual Report 2010/11
Page 5 of 85 SP Power Systems Limited Registered Office: 1 Atlantic Quay Glasgow G2 8SP
Registered in Scotland No. 215841 Vat No. GB 659 3720 08
2. SP Energy Networks Structure SP Energy Networks (SPEN) is the part of ScottishPower UK Ltd, which owns and operates the electricity transmission and distribution network of southern Scotland and the electricity distribution network of Merseyside and North Wales. Day-to-day operation of our network, approaching 112,000 km, is conducted by SP Energy Networks, a wholly owned subsidiary of ScottishPower Ltd. Since April 2007 ScottishPower has been part of the Iberdrola Group. Our transmission and distribution licence assets come under three wholly owned subsidiaries:
SP Distribution: The electricity network of 33kV and below in southern Scotland
SP Manweb: The electricity network of 132kV and below in Merseyside and North Wales
SP Transmission: The electricity network of 132kV and above in southern Scotland IFI activity is co-ordinated centrally on behalf of these licences, this report relates to R&D activity undertaken on:
SP Distribution Ltd, referred to as SP-D in this report
SP Manweb plc, referred to as SP-M in this report
SP Transmission Ltd, referred to as SP-T in this report
(a) (b)
Figure 1: UK Map showing the territory of (a) SP Distribution & SP Transmission and (b) SP Manweb

IFI Annual Report 2010/11
Page 6 of 85 SP Power Systems Limited Registered Office: 1 Atlantic Quay Glasgow G2 8SP
Registered in Scotland No. 215841 Vat No. GB 659 3720 08
3. Overview 3.1 IFI Overview A total of 27 IFI projects are being reported by SP Energy Networks on behalf of the three ScottishPower Network licence areas for the period 1st April 10 – 31st March 11. At time of writing SPEN has a total of £5.7m authorised IFI projects, representing a levered portfolio of over £33m. The projects cover a breadth of R&D providers from academia, to consultants, to manufacturers with projects ranging in investment from £15k to £250k IFI input, and development timescales of between 6 months and 4 years. Our R&D activity has increased significantly since the introduction of the IFI. We have continued to focus on leveraging our programme through collaboration with funding bodies, other network operators or external suppliers / manufacturers. In 2010/11 every £1 of SP IFI money invested in a project was levered by c.£4 from other sources:
R&D growth in SPEN (SP-D, SP-M and SP-T) since the introduction of the IFI
SP-D, SP-M and SP-T Expenditure (Internal + External)
No. Of Reported Projects
Yearly Programme
Leverage 2004/05 (Early Start) £223k 12 c. £1.5m 2005/06 £546k 36 c. £3m 2006/07 £1,282k 41 c. £5m 2007/08 £1,793k 50 c. £7m 2008/09 £1,978k 38 c. £9m 2009/10 £1,462k 35 c. £7m 2010/11 £1,621k 27 c. £8m
Figure 2 R&D expenditure growth SPEN (SP-D, SP-M and SP-T) since the introduction of the IFI
1.5
3
5
7
9
7
8
0
2
4
6
8
10
12
2004/05 (EarlyStart)
2005/06 2006/07 2007/08 2008/09 2009/10 2010/11
Exp
end
itu
re £
Ms
IFI Year
IFI Leverage
IFI Spend

IFI Annual Report 2010/11
Page 7 of 85 SP Power Systems Limited Registered Office: 1 Atlantic Quay Glasgow G2 8SP
Registered in Scotland No. 215841 Vat No. GB 659 3720 08
4. Summary Tables The following tables have been adapted from the Regulatory Instructions and Guidance documents (RIGs).
IFI Summary - SP Distribution Ltd Licence Area 10/11
SP Distribution Ltd Network Revenue £391,780,000
IFI Allowance £1,958,900
Unused IFI Carry Forward to 2011/12 £1,094,110
Number of Active IFI Projects 22
Summary of benefits anticipated from IFI projects 2010/11 1
External expenditure [2010/11] on IFI projects £683,001
Internal expenditure [2010/11] on IFI projects £181,789
Total expenditure [2010/11] on IFI projects £864,790
IFI Summary - SP Manweb plc Licence Area 10/11
SP Manweb plc Distribution Network Revenue £262,410,000
IFI Allowance £1,312,050
Unused IFI Carry Forward to 2011/12 £702,796
Number of Active IFI Projects 21
Summary of benefits anticipated from IFI projects 2010/11 1
External expenditure [2010/11] on IFI projects £475,850
Internal expenditure [2010/11] on IFI projects £133,404
Total expenditure [2010/11] on IFI projects £609,254
IFI Summary - SP Transmission Ltd Licence Area 10/11
SP Transmission Ltd Distribution Network Revenue £200,540,000
IFI Allowance £1,002,700
Unused IFI Carry Forward to 2011/12 £855,318
Number of Active IFI Projects 10
Summary of benefits anticipated from IFI projects 2010/11 1
External expenditure [2010/11] on IFI projects £108,346
Internal expenditure [2010/11] on IFI projects £39,036
Total expenditure [2010/11] on IFI projects £147,382 Further detail on these tables is provided in Appendix A of this report.
1 Summary of benefits are available in Section 6 “Highlights from 10/11”

IFI Annual Report 2010/11
Page 8 of 85 SP Power Systems Limited Registered Office: 1 Atlantic Quay Glasgow G2 8SP
Registered in Scotland No. 215841 Vat No. GB 659 3720 08
5. Achievements for 2010/11 At the end of 2010/11 the highlights from the SPEN IFI portfolio included:
Every IFI project undertaken by SP is taken before a panel of senior experts from across the business. Through this process we have:
o 31 live projects o 5 new projects were authorised during the 2010/11 o Of the 31 projects, 4 are now complete and either awaiting adoption or formal
closure
Over £8m of leverage obtained
14 projects achieving Technology Readiness Level (TRL) 7 (network integration) or above with further trials scheduled
5.1 Development of Partnerships The current programme consists of the following collaborative projects:
Engineering & Physical Science Research Council (EPSRC) strategic partnership: AuRA-NMS.
EPSRC – 2x industry roles in Supergen programmes: Supergen 1 - Flexnet; HiDef.
Technology Strategy Board (TSB) technology programme projects: Thermal State Estimation - TP/4/EET/6/I/22088.
DNO specific – 20 collaborative projects with some / all UK DNOs via EA Technology, ENA or through direct collaboration (see Appendix B for details).
Direct university partnership – 1x ScottishPower Advanced Research Centre (SPARC) with the University of Strathclyde.
Capenhurst Energy Innovation Centre – A non-profit trust that over sees the management of the centre in collaboration with ScottishPower, Electricity North West, CE Electric, Scottish & Southern Energy and the North West Development Agency.
Working with a Glasgow based consortium on the Ultra Low Carbon Vehicle Demonstration Program (ULCVD). This programme was set up by the Technology Strategy Board and will run trials in various locations in the UK. The Glasgow trial will roll out around 40 Electric Vehicles including a charging infrastructure to assess consumer behaviour and practicality of running EV. Although this is not an IFI programme it is expected this trial will initiate further R&D projects to look at the impact of EV.
5.2 Power Networks Demonstration Centre This project initially proposed and led by SPEN, was to develop the first of its kind, in the UK, a full scale 11kV and LV prototyping network as a test-bed for active network management techniques and other ‘high risk’ technologies. Whilst not a technological development in itself, this project is a fundamental enabler of technology, with significant potential to accelerate adoption of significant / radical developments across a range of IFI projects. The centre can be used to investigate the impact of intermittent generation and penetration of EV technologies on the LV network as well as testing of new tools and training. Since late 2008, SPEN have been working with collaborative partners (University of Strathclyde, Scottish & Southern Energy and Scottish Enterprise) to develop the design. It is aimed to start building the centre in Q3 of 2011 and to be ready by Q2 2012.

IFI Annual Report 2010/11
Page 9 of 85 SP Power Systems Limited Registered Office: 1 Atlantic Quay Glasgow G2 8SP
Registered in Scotland No. 215841 Vat No. GB 659 3720 08
Figure 3 Artists Impression of the Demonstration Facility

IFI Annual Report 2010/11
Page 10 of 85 SP Power Systems Limited Registered Office: 1 Atlantic Quay Glasgow G2 8SP
Registered in Scotland No. 215841 Vat No. GB 659 3720 08
6. Highlights from 10/11 Whilst not all benefits have a direct monitory value, we have indicated the benefits brought to SPEN in improvements to customer service, reductions to capital cost of equipment and the reduction in energy usage/carbon emissions. 6.1 Development of Distance to Fault and Impedance Mapping Fault Impedance Disturbance monitors at 33/11kV substations provide a substantial amount of data that can be used to help make better decisions on managing the network. Such recorders capture transient events that occur from time to time such as distributer faults.
Figure 4 - Measured Values During Fault
Figure 5 - Snapshot of Fault
These events are classified using expert systems and a downstream fault can be recognised by a drop in line voltage and a simultaneous rise in current. If the voltage and current are known then for phase to phase and three phase faults the fault impedance can be calculated with reasonable accuracy. The fault impedance is an electrical measurement of how far the fault is down the circuit.
Asset Fault: Battery Voltage 52.968 V System 325
Class Transient fault
Trigger Analogue under, 3:T1 Vbr
Event priority 1
Fault type R-B
Fault level 4141.4 A
Fault resistance 0.607 R
Ambient temperature 25.7 C
Fault Impedance
T1
(kV) T1 Vry T1 Vyb T1 Vbr
Figure 6 - GIS Circuit Selection

IFI Annual Report 2010/11
Page 11 of 85 SP Power Systems Limited Registered Office: 1 Atlantic Quay Glasgow G2 8SP
Registered in Scotland No. 215841 Vat No. GB 659 3720 08
Impedance Mapping This has to be translated into a physical distance. The circuit is first modelled in a spreadsheet with each section of cable/overhead line (length and cross sectional area) from the source added in turn and using node points for tee offs and remote ends. Look up tables allow each section to be converted into an impedance based on the Ω/km for the cross sectional area of a particular conductor and the various sections
are cumulated to give an impedance at most points down the circuit. The value from the Monitor can be matched to one or more points on the circuit. This works but is not a practical solution as construction of an impedance map is a laborious process and prone to inaccuracies. Digital System The GIS system holds all the companies cable and overhead line records with lengths and cross sectional areas. It also has the connectivity model and a circuit tracing capability. On this basis the development of a module that could be bolted on to the GIS system was commissioned. The criteria was to select a source circuit breaker, plug in the fault impedance from the monitor then to work out and down the circuit calculating the impedance during the trace. At the various
points where the measured fault impedance matched a calculated point on the circuit this would be flagged. This results in a system where we have an impedance map for every primary substation that is updated every time new plant is added or removed. There are of course limitations such as unknown cross sectional areas or conductor material but these have to be assumed using default values and an attempt to update records as these become known. As the intention at present is to get between switching points the accuracy of the existing system is generally reliable and is ready to roll out. 6.2 LV Automation and LR1 Smart Grid With the expected increase in micro-generation and embedded generation coupled with an increase in the use of electrical powered vehicles, the current low voltage network will face significant infrastructure challenges to allow for the increased demands these future requirements will place on it.
Figure 8 - GIS Mapping Showing Tracing
Figure 7 - View of Circuit Selection

IFI Annual Report 2010/11
Page 12 of 85 SP Power Systems Limited Registered Office: 1 Atlantic Quay Glasgow G2 8SP
Registered in Scotland No. 215841 Vat No. GB 659 3720 08
There is likely to be a requirement to have a much greater dynamic load control on the low voltage network and to also provide early warning of power quality issues. Furthermore there will be an even greater demand to ensure that the carbon foot print of any network (the system losses) should be better managed and of course reduced. The recent succesful trial of the Radius LVA071 prototype has proven the concept of controlling a miniture low voltage vacuum switch/interupter across the low voltage network using Power Line Carrier signalling. The goal with the LVA Switch/Interupter is to design a single phase unit that is capable of being fitted to a new style LV pillar as well as the possibility to fit to existing pillars and take-off chambers, should space allow. The unit will contain a vacuum bottle, a J-type fuse, a magnetic actuator, a current transformer and voltage connection points acorss the bottle/fuse for the purposes of monitoring and PLC injection. This unit will then have a cable connection to a electronic control unit. Due to the size and weight of the unit, additional securing, above the normally bus-bar clamp is likely to be required. 6.3 PMU Utilisation for WAMPAC The development of Wide Area Monitoring Protection and Control (WAMPAC) provides a new dimension to system monitoring and control by enhancing the visibility of system oscillatory modes and stability limits. These are key performance indicators for a future power system with rapidly varying power flows from large volumes of intermittent wind generation. This technology also provides enhanced visibility of synchronous zones, measurement of system impedance and network model validation. Our Transmission business is leading the industry in this field and currently most of our transmission sites has Phasor Measurement Units (PMU) providing a wealth of information on systems capability and capacity. Calibrating, collating and validating the PMU data is vital in establishing a WAMPAC system that could potentially in the future assist in maximising the utilisation of the transmission system between Scotland and England. We have built on our existing WAMPAC project to introduce new testing and synchronisation technologies to ensure the data is collated and utilised in an accurate and efficient manner hence facilitating future developments such as HVDC and series compensation.
Figure 9 - Early LVA Prototype
Figure 10 - LVA Pillar

IFI Annual Report 2010/11
Page 13 of 85 SP Power Systems Limited Registered Office: 1 Atlantic Quay Glasgow G2 8SP
Registered in Scotland No. 215841 Vat No. GB 659 3720 08
Figure 11 - Psymetrix PMU Monitoring System
6.4 Climate Risk Assessment The UK electricity distribution and transmission networks are affected by faults caused by weather such as lightning, snow and high winds. The objective of this project is to investigate the networks' current sensitivity to weather and how this may change in the future as a result of climate change. The key results of this climate change risk assessment are provided in these web pages. For each type of weather-related fault the results are split into the following three categories:
Figure 12 - Climate Risk Assessment Website
Hazard: the frequency of weather-related faults.
Vulnerability: the magnitude of impact on the network.

IFI Annual Report 2010/11
Page 14 of 85 SP Power Systems Limited Registered Office: 1 Atlantic Quay Glasgow G2 8SP
Registered in Scotland No. 215841 Vat No. GB 659 3720 08
Risk: the combined impact of hazard and vulnerability. To understand how the network is currently sensitive to weather, baseline information has been derived using historical weather and fault records. Future sensitivities have been estimated using climate projections from UKCP09. The climate change risk assessment has been completed for both the UK distribution and transmission networks. A full description of the study is provided in the company specific Baseline and Future Climate Change Risk Assessment Reports.

IFI Annual Report 2010/11
Page 15 of 85 SP Power Systems Limited Registered Office: 1 Atlantic Quay Glasgow G2 8SP
Registered in Scotland No. 215841 Vat No. GB 659 3720 08
7. Ultra Low Carbon Vehicle Demonstration Program (ULCVD) ScottishPower have been working as part of a Glasgow based consortium, to fund the rapid development, build and deployment of a fleet of ultra low carbon vehicles. As part of this work, 40 Peugeot electric vehicles has been deployed in Glasgow during 2011. The vehicles will be monitored using both on-vehicle GPS systems and data logging at selected charging infrastructure points installed as part of the trial. ScottishPower has taken delivery of 4 new electric vehicles. The vehicles will be used across Energy Networks, Energy Wholesale, Energy Retail and Renewables, supporting our involvement with several organisations looking at the deployment of low carbon vehicles.
Figure 13 - Trial Electric Vehicle at Whitelee Wind Farm
A Transport Scotland led consortium (Plugged in Places) piloting an electric vehicle charging network across Scotland was established last year and ScottishPower were appointed as the single energy company to provide expertise. As part of this consortium, ScottishPower will work closely with the partners to develop an electricity network capable of hosting up to 375 charging points across Scotland to support the rollout of electric vehicles. Although these initiatives are not part of any IFI project, it is proposed that a power quality monitoring and smart charging project will develop within the next year to build on our expertise on the area of EV.

IFI Annual Report 2010/11
Page 16 of 85 SP Power Systems Limited Registered Office: 1 Atlantic Quay Glasgow G2 8SP
Registered in Scotland No. 215841 Vat No. GB 659 3720 08
Appendix A – Expenditure Breakdown of Projects between Licences

IFI Annual Report 2010/11
Page 17 of 85 SP Power Systems Limited Registered Office: 1 Atlantic Quay Glasgow G2 8SP
Registered in Scotland No. 215841 Vat No. GB 659 3720 08
Summary Table Notes
During the collation of the 05/06 report we revised our methodology for NPV assessments for IFI projects. It is noted that the figures described in the tables should be interpreted with caution, as the figures quoted in the NPVs will only be realised upon completion of the project, and once fully adopted into the business. Cost Breakdown
As SP Energy Networks operate distribution and transmission licenses for the SP-D, SP-M and SP-T areas, successful developments relating to distribution and/or transmission assets undertaken in one part of the business will equally apply to the other. In line with this, costs have been split against each licence based on the turnover and hence size of each network area.
Cost Breakdown between Licence Areas
Licence Area Annual Turnover (10/11) Percentage Split
Distribution Percentage Split
Transmission SP-Distribution £391.78 million ~60% NA SP-Manweb £262.41 million ~40% ~15% SP-Transmission £200.54 million NA ~85% Projects identified as only applying to one licence, or ones that apply in favour of one, two or all three licences have been scaled accordingly (See Table B1). This is defined when the project inception document is developed. Programme Management Costs
Internal costs for projects detailed in Appendix B are based on SP’s input to a project through meetings, correspondence, trials, etc scaled by the appropriate hourly rate for an individual’s grade. Net Present Value (NPV) source
It is noted that IFI projects address a range of issues, and the benefits achieved, and those accounted for in the NPV can be categorised into the following areas:
Avoided cost – A successful development may negate the need to spend money on network components. As an example the development of a high capacity circuit, would avoid the need for duplicate traditional circuits for a given network application.
Direct savings – Successful development could result in a direct financial benefit, e.g. through reductions in operating costs, reduced exposure to Regulatory penalties, etc.
Managing risk – A successful development would assist in reducing the risk profile of the company, either through greater understanding of causes / effects of actions on, or as a result of, network operation (equipment failure, etc.)
Strategic – These projects impact on the longevity of the network, either through external influences such as changes in load / generation patterns, the impact of climate change or even skills / resources.
NB. Whilst an NPV calculation if possible for any project, and across any of these areas, it is recognised that as the assessment looks further to the future (as is the case for strategic projects), the benefits are more susceptible to risk, more uncertain, and consequently less robust.

IFI Annual Report 2010/11
Page 18 of 85 SP Power Systems Limited Registered Office: 1 Atlantic Quay Glasgow G2 8SP
Registered in Scotland No. 215841 Vat No. GB 659 3720 08
As of 31st March 2011 the status of the 31 projects reported as well as those that have stopped is detailed below.
IFI Project Status No. Phase Definition External Cost
2 Proposals in development
Agreeing scope / objectives, setting up contracts, etc.
None Direct (small external £ associated with management cost)
27 Live projects Projects in progress Yes (if milestones have been met)
4 Completed projects Projects which have completed their trial phase
Yes
This breakdown accounts for reasons why not all projects have significant external spend. Project Progress Curves
Expenditure profiles are described below to give an appreciation of costs that will be required prior to a project realising a stated benefit through the development cycle. Figure B1 shows a hypothetical expenditure profile for a development project. Expenditure is defined as:
External – Money paid to 3rd parties for work (consultancy, purchase of equipment, monitoring, etc)
Internal – SP Energy Networks’ staff time on eligible IFI development work multiplied by the appropriate hourly rate. The success of a project is highly dependent on the levels of internal support a project is given.
Overall investment - The total cost of a project (predominantly external cost) of which the company is accessing through collaborative or external funding leverage. This is the combined investment from SP Energy Networks and other collaborative partners.
In line with sound project management, all IFI projects have been staged into milestones, i.e. the R&D provider will only receive payment upon successful completion of a defined stage.
Figure A1: Example Expenditure Profile for an IFI Project
Expenditure £
Time Year 1 Year 2 Year 3 Year 4 Year 5
External
Internal
Overall Investment
Adoption End of IFI
Field Testing Advanced Development
Research & Development
Project Conception

IFI Annual Report 2010/11
Page 19 of 85 SP Power Systems Limited Registered Office: 1 Atlantic Quay Glasgow G2 8SP
Registered in Scotland No. 215841 Vat No. GB 659 3720 08
Table A1 is ordered chronologically.
Table A1: Overview of 10/11 projects showing application between licences
SPD SPM SPT External Internal External Internal External Internal
IFI 0401 - Strategic Tech Prog 55% 35% 10% £ 108,459 £ 21,744 £ 69,019 £ 13,837 £ 19,720 £ 3,953
IFI 0406 - Fault Passage Indication 60% 40% 0% £ 5,125 £ 3,655 £ 3,416 £ 2,437 £ - £ -
IFI 0409 - LV Fault Location devices 60% 40% 0% £ 11,820 £ 7,563 £ 7,880 £ 5,042 £ - £ -
IFI 0507 - Sensor Networks 60% 40% 0% £ 28,740 £ 11,585 £ 19,160 £ 7,723 £ - £ -
IFI 0509 - Superconducting Fault Current Limiter 60% 40% 0% £ 92,300 £ 6,000 £ 61,533 £ 4,000 £ - £ -
IFI 0511 - ACTIV Voltage Control 0% 100% 0% £ - £ - £ 4,300 £ 8,046 £ - £ -
IFI 0513 - Thermal State Estimation 55% 35% 10% £ 33,324 £ 3,351 £ 21,206 £ 2,132 £ 6,059 £ 609
IFI 0515 - Power Network Demo Centre 60% 40% 0% £ 25,161 £ 6,000 £ 16,774 £ 4,000 £ - £ -
IFI 0526 - PD MONITORING 60% 40% 0% £ 2,370 £ 4,561 £ 1,580 £ 3,041 £ - £ -
IFI 0532 - AURA - NMS 60% 40% 0% £ 18,245 £ 3,655 £ 12,163 £ 2,437 £ - £ -
IFI 0607 - LV Automation 60% 40% 0% £ 23,098 £ 44,228 £ 15,399 £ 29,485 £ - £ -
IFI 0615 - SP Advanced Research Centre 55% 35% 10% £ 88,346 £ 6,216 £ 56,220 £ 3,956 £ 16,063 £ 1,130
IFI 0618 - Supergen 1 - Flex Net 60% 40% 0% £ 13,020 £ 4,435 £ 8,680 £ 2,957 £ - £ -
IFI 0621-1 FMCTech 60% 40% 0% £ 14,424 £ 1,109 £ 9,616 £ 739 £ - £ -
IFI 0621-2 LV Sure 60% 40% 0% £ 4,382 £ 1,109 £ 2,921 £ 739 £ - £ -
IFI 0621-3 Live Alert 60% 40% 0% £ 255 £ 1,109 £ 170 £ 739 £ - £ -
IFI 0625 - Vegetation Management Project 55% 35% 10% £ 33,568 £ 4,938 £ 21,362 £ 3,142 £ 6,103 £ 898
IFI 0701 - ENA De-minimis Rapper 55% 35% 10% £ 28,717 £ 3,351 £ 18,275 £ 2,132 £ 5,221 £ 609
IFI 0711 - 3rd Party ROEP Risk Assessment 35% 35% 30% £ 18,095 £ 4,578 £ 18,095 £ 4,578 £ 15,510 £ 3,924
IFI 0712 - BT21 CN Solutions 50% 50% 0% £ 50,449 £ 8,430 £ 50,449 £ 8,430 £ - £ -
IFI 0713 - WAMPAC 0% 0% 100% £ - £ - £ - £ - £ 1,700 £ 12,560
IFI 0801 - IEC 61850 Applications in SPT 0% 0% 100% £ - £ - £ - £ - £ 27,938 £ 9,348
IFI 1001 - DTR DURHAM 0% 20% 80% £ - £ - £ 2,340 £ 1,218 £ 9,360 £ 4,874
IFI 1002 - SUPERGEN HIDEF 60% 40% 0% £ 9,228 £ 3,655 £ 6,152 £ 2,437 £ - £ -
IFI 1003 - SALVO 55% 35% 10% £ 3,685 £ 6,216 £ 2,345 £ 3,956 £ 670 £ 1,130
IFI 1005 - zMap - GIS Imp 60% 40% 0% £ 10,647 £ 23,191 £ 7,098 £ 15,461 £ - £ -
IFI 1007 - Outram Fault Level Monitor 60% 40% 0% £ 59,541 £ 1,109 £ 39,694 £ 739 £ - £ -
External Internal External Internal External Internal
683,001£ 181,789£ 475,850£ 133,404£ 108,346£ 39,036£
Ratios 79% 21% 78% 22% 74% 26%
Project Description
SPD SPM SPT
Totals
SPD SPM SPTPercentage split
£ split

IFI Annual Report 2010/11
Page 20 of 85 SP Power Systems Limited Registered Office: 1 Atlantic Quay Glasgow G2 8SP
Registered in Scotland No. 215841 Vat No. GB 659 3720 08
Appendix B – Project Reports IFI Projects
April 10 – March 11
IFI Annual Report 2010/11
Page 21 of 85 SP Power Systems Limited Registered Office: 1 Atlantic Quay Glasgow G2 8SP
Registered in Scotland No. 215841 Vat No. GB 659 3720 08
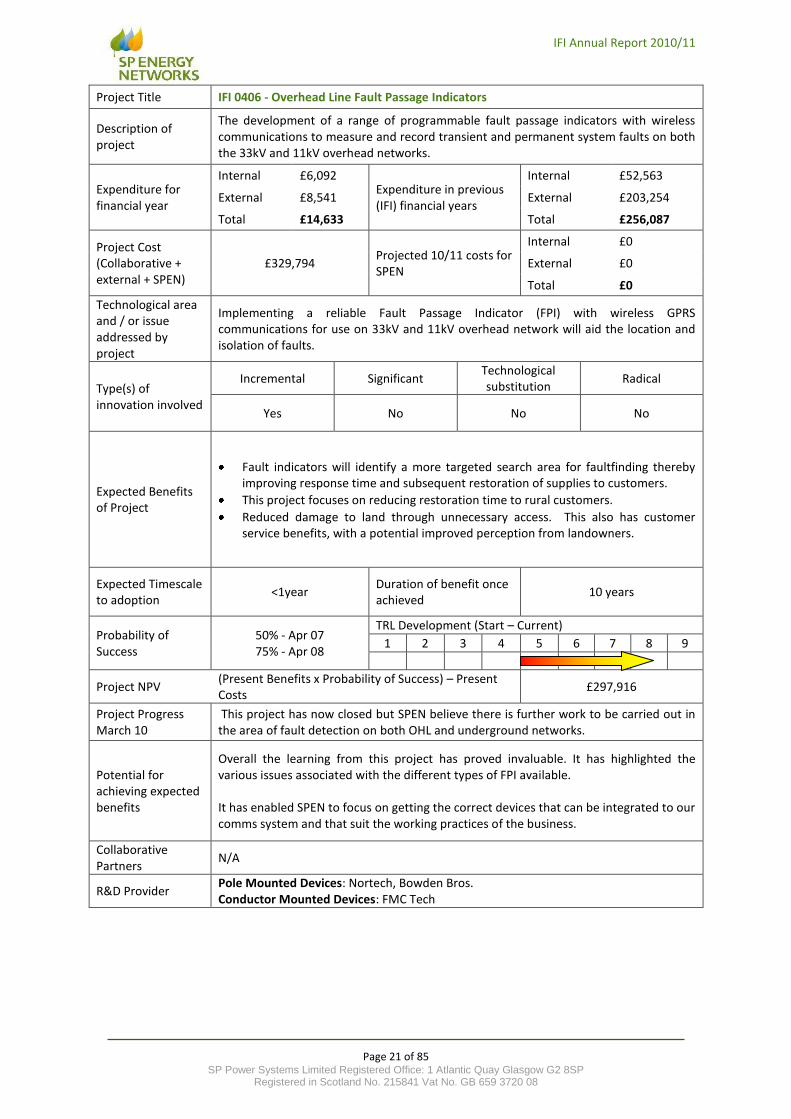
Project Title IFI 0406 - Overhead Line Fault Passage Indicators
Description of project
The development of a range of programmable fault passage indicators with wireless communications to measure and record transient and permanent system faults on both the 33kV and 11kV overhead networks.
Expenditure for financial year
Internal £6,092 Expenditure in previous (IFI) financial years
Internal £52,563
External £8,541 External £203,254
Total £14,633 Total £256,087
Project Cost (Collaborative + external + SPEN)
£329,794 Projected 10/11 costs for SPEN
Internal £0
External £0
Total £0
Technological area and / or issue addressed by project
Implementing a reliable Fault Passage Indicator (FPI) with wireless GPRS communications for use on 33kV and 11kV overhead network will aid the location and isolation of faults.
Type(s) of innovation involved
Incremental Significant Technological substitution
Radical
Yes No No No
Expected Benefits of Project
Fault indicators will identify a more targeted search area for faultfinding thereby improving response time and subsequent restoration of supplies to customers.
This project focuses on reducing restoration time to rural customers.
Reduced damage to land through unnecessary access. This also has customer service benefits, with a potential improved perception from landowners.
Expected Timescale to adoption
<1year Duration of benefit once achieved
10 years
Probability of Success
50% - Apr 07 75% - Apr 08
TRL Development (Start – Current)
1 2 3 4 5 6 7 8 9
Project NPV (Present Benefits x Probability of Success) – Present Costs
£297,916
Project Progress March 10
This project has now closed but SPEN believe there is further work to be carried out in the area of fault detection on both OHL and underground networks.
Potential for achieving expected benefits
Overall the learning from this project has proved invaluable. It has highlighted the various issues associated with the different types of FPI available. It has enabled SPEN to focus on getting the correct devices that can be integrated to our comms system and that suit the working practices of the business.
Collaborative Partners
N/A
R&D Provider Pole Mounted Devices: Nortech, Bowden Bros. Conductor Mounted Devices: FMC Tech

IFI Annual Report 2010/11
Page 22 of 85 SP Power Systems Limited Registered Office: 1 Atlantic Quay Glasgow G2 8SP
Registered in Scotland No. 215841 Vat No. GB 659 3720 08
Project Title IFI 0409 - LV Fault Location Devices
Description of project
Phase 1 - A device for use on the Low Voltage networks to capture transient fault information and correlate to an associated fault location. Phase 2 (2010) – Through the combination of private and IFI funding. It has proved to be a very successful instrument within Scottish Power, and other DNOs, and has located many intermittent and transitory faults thereby reducing the costs and inconvenience of the multiple excavations required with traditional ‘cut and test’ methods. Numerous faults have been located and/or removed from the network hence preventing unnecessary supply interruptions and/or continued degradation of PQ associated with ‘flickering lights’. Further work is being carried out into the following
Incorporate appropriate T-P22 enhancements into existing T-V22 software
Re-design of T-V22 hardware
Expenditure for financial year
Internal £ 12,604 Expenditure in previous (IFI) financial years
Internal £41,125
External £ 19,700 External £81,739
Total £ 32,305 Total £122,863
Project Cost (Collaborative + external + SP-EN)
£184,800 Projected 10/11 costs for SP-EN
Internal £5,000
External £25,000
Total £30,000
Technological area and / or issue addressed by project
Low voltage cable faults present a greater technical challenge to a DNO than HV cable fault
Permanent faults require urgent action to restore supplies which can be avoided by locating them at the intermittent stage.
Reducing the number of intermittent faults helps to maintain supplies.
Transitory faults degrade PQ and are a major cause of flickering lights – often as precursors to developing into Intermittent, Persistent or Permanent faults
Transitory fault phenomena provide early warning of pending problems to prevent customer interruptions and PQ complaints
Type(s) of innovation involved
Incremental Significant Technological substitution
Radical
Yes No No No
Expected Benefits of Project
Preliminary use of the device for fault location on persistent LV faults is expected to:
Reduce the number of repeated fuse replacements
Minimise the number of joint holes
Remove the fault from the system in a shorter timescale than traditional ‘cut-and-test’ methods
Expected Timescale to adoption
1 Year Duration of benefit once achieved
Typically 8-10 years depending on technology
development
Probability of Success
50%
TRL Development (Start – Current)
1 2 3 4 5 6 7 8 9
Project NPV (Present Benefits x Probability of Success) – Present Costs £349,240

IFI Annual Report 2010/11
Page 23 of 85 SP Power Systems Limited Registered Office: 1 Atlantic Quay Glasgow G2 8SP
Registered in Scotland No. 215841 Vat No. GB 659 3720 08
Project Progress March 10
The proposal to develop automatic interpretation of TDR waveforms has proved more complicated than initially assumed due to the ever-increasing use of 'low-energy' lighting (particularly by large commercial lighting loads) which has been found to cause the TDR waveforms to vary during the course of a cycle of the mains voltage making selection of an appropriate 'non-faulty' reference waveform critical. Work has started on the development of automatic interpretation (alignment) of TRS waveforms but even from the small number of example datasets obtained so far it is apparent that some faults do not breakdown 'cleanly' (i.e. there is often sufficient 'noise' produced prior to the breakdown to cause the TRS hardware to trigger pre-maturely).
Potential for achieving expected benefits
It is hoped that the unfinished activities will be completed by the end of September and, if not completed, to be in a position to state whether the objective(s) appear achievable (with further time/work) or to be impractical with the currently available equipment, information and working practices.
Collaborative Partners
Uk PowerNetworks, Electricity North West
R&D Providers Kehui (UK) Ltd, Nortech
IFI Annual Report 2010/11
Page 24 of 85 SP Power Systems Limited Registered Office: 1 Atlantic Quay Glasgow G2 8SP
Registered in Scotland No. 215841 Vat No. GB 659 3720 08
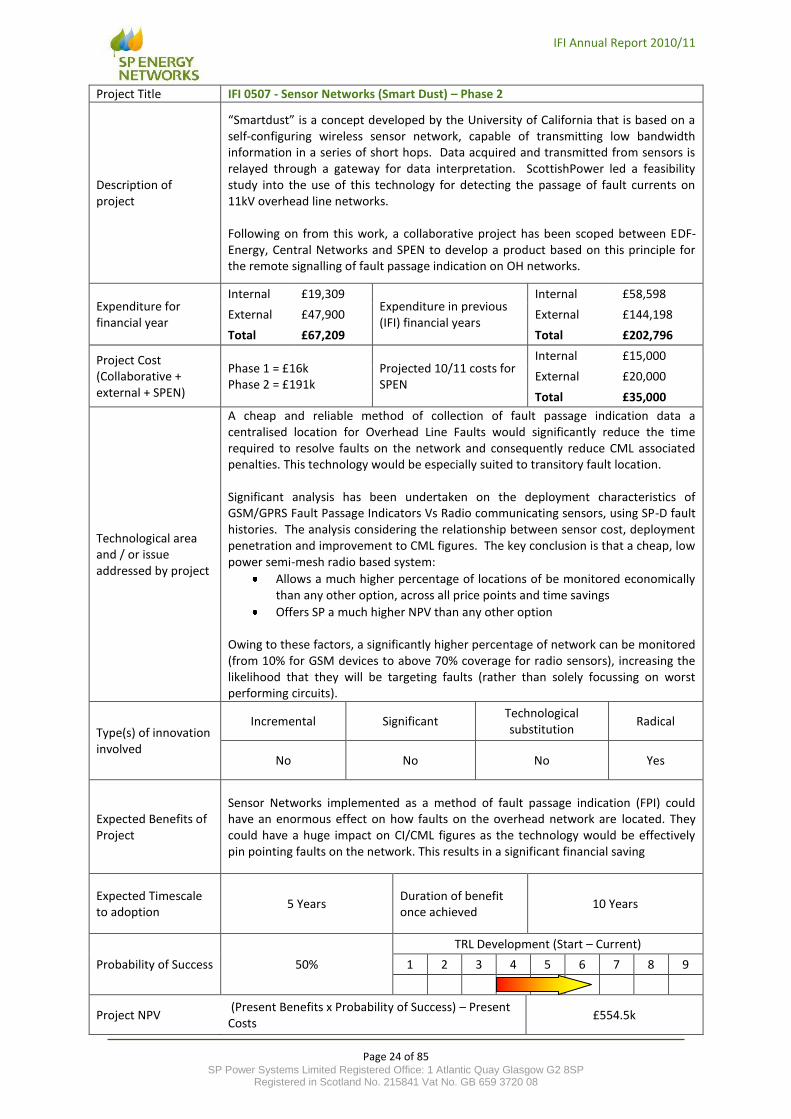
Project Title IFI 0507 - Sensor Networks (Smart Dust) – Phase 2
Description of project
“Smartdust” is a concept developed by the University of California that is based on a self-configuring wireless sensor network, capable of transmitting low bandwidth information in a series of short hops. Data acquired and transmitted from sensors is relayed through a gateway for data interpretation. ScottishPower led a feasibility study into the use of this technology for detecting the passage of fault currents on 11kV overhead line networks. Following on from this work, a collaborative project has been scoped between EDF-Energy, Central Networks and SPEN to develop a product based on this principle for the remote signalling of fault passage indication on OH networks.
Expenditure for financial year
Internal £19,309 Expenditure in previous (IFI) financial years
Internal £58,598
External £47,900 External £144,198
Total £67,209 Total £202,796
Project Cost (Collaborative + external + SPEN)
Phase 1 = £16k Phase 2 = £191k
Projected 10/11 costs for SPEN
Internal £15,000
External £20,000
Total £35,000
Technological area and / or issue addressed by project
A cheap and reliable method of collection of fault passage indication data a centralised location for Overhead Line Faults would significantly reduce the time required to resolve faults on the network and consequently reduce CML associated penalties. This technology would be especially suited to transitory fault location. Significant analysis has been undertaken on the deployment characteristics of GSM/GPRS Fault Passage Indicators Vs Radio communicating sensors, using SP-D fault histories. The analysis considering the relationship between sensor cost, deployment penetration and improvement to CML figures. The key conclusion is that a cheap, low power semi-mesh radio based system:
Allows a much higher percentage of locations of be monitored economically than any other option, across all price points and time savings
Offers SP a much higher NPV than any other option Owing to these factors, a significantly higher percentage of network can be monitored (from 10% for GSM devices to above 70% coverage for radio sensors), increasing the likelihood that they will be targeting faults (rather than solely focussing on worst performing circuits).
Type(s) of innovation involved
Incremental Significant Technological substitution
Radical
No No No Yes
Expected Benefits of Project
Sensor Networks implemented as a method of fault passage indication (FPI) could have an enormous effect on how faults on the overhead network are located. They could have a huge impact on CI/CML figures as the technology would be effectively pin pointing faults on the network. This results in a significant financial saving
Expected Timescale to adoption
5 Years Duration of benefit once achieved
10 Years
Probability of Success 50%
TRL Development (Start – Current)
1 2 3 4 5 6 7 8 9
Project NPV (Present Benefits x Probability of Success) – Present Costs
£554.5k

IFI Annual Report 2010/11
Page 25 of 85 SP Power Systems Limited Registered Office: 1 Atlantic Quay Glasgow G2 8SP
Registered in Scotland No. 215841 Vat No. GB 659 3720 08
Project Progress March 10
Progress in 2010/2011: Gateway hardware design and prototype completed ready for stage B. Gateway software completed ready for stage B Implementation of integration with iHost over GSM completed Enhancements made to the wireless communication strategy wFPI hardware design and prototype completed ready for stage B wFPI software completed ready for stage B PC Application enhanced: the application allows the remote programming of
wFPIs and remote access to the gateway. This will save time and reduce risk when configuring and maintaining the wFPI system in operation.
PC Application hardware design and prototype almost complete PC application software completed ready for stage B Factory Acceptance Test (FAT) specification written and agreed. Production of 8 wFPI prototypes for FAT. Steering group meetings were held in July 2010, November 2010 to update
the DNOs on progress. Successfully passed Factory Acceptance Testing in November 2010 (subject
to successful radio range test, scheduled for April 2011)
Potential for achieving expected benefits
This new approach will allow control engineer’s to identify the location of a fault more quickly than is presently possible and hence rapidly deduce the best supply restoration strategy. It will also allow linesmen to be sent directly to the source of the fault to identify and fix the problem. Whilst the overall effect should be a reduction in Customer-Minutes-Lost for permanent faults, it will more importantly be able to capture the source of transient fault activity that can cause multiple supply interruptions. In the longer term, this system can become duplex, allowing control commands to be sent to specific wFPI locations.
Collaborative Partners
Central Networks
R&D Providers Willow, E.ON Power Technology

IFI Annual Report 2010/11
Page 26 of 85 SP Power Systems Limited Registered Office: 1 Atlantic Quay Glasgow G2 8SP
Registered in Scotland No. 215841 Vat No. GB 659 3720 08
Project Title IFI 0509 - Superconducting Fault Current Limiter
Description of project This project aims to design, develop and trial three 12kV Superconducting Fault Current Limiting (SFCL) devices on three different UK networks.
Expenditure for financial year
Internal £9,999 Expenditure in previous (IFI) financial years
Internal £31,700
External £153,833 External £234,860
Total £163,832 Total £266,563
Project Cost (Collaborative + external + SPEN)
£2,345,967 Projected 10/11 costs for SPEN
Internal £25,000
External £150,000
Total £175,000
Technological area and / or issue addressed by project
The development of a non-linear ‘high-temperature’ superconducting ceramic in series with a circuit breaker for the clamping and clearance of fault energy. When the material is operated at below its critical temperature it loses all electrical resistance, thereby allowing load current to flow with negligible losses. Either the increased current density caused by fault current, or the loss of cooling medium (liquid nitrogen) causes the temperature of the superconducting material to rise and it reverts to a normal resistive state. Being a solid state device, the SFCL has been proven to operate in a few milliseconds, after which the impedance remains high until the fault is cleared by conventional means (protection operated circuit breakers, fuses, etc.). The SFCL’s operation is sufficiently fast to ensure that the first peak of the fault current is limited. The subsequent limited current can be set to suit a specific application. Three devices (one per DNO) will be constructed and installed covering a range of applications: transformer tails, bus section, interconnected network connection. The successful completion of this project is likely to pave the way for higher voltage devices.
Type(s) of innovation involved
Incremental Significant Technological substitution
Radical
No Yes No No
Expected Benefits of Project
To develop, understand and address the issues associated with the connection of an 11kV fault current limiting device to the network. Successful trials will result in the development of commercially available devices that are capable of clamping fault levels to within network design limits. Once proven, this will open up another option for tackling network fault level, potentially providing an alternative to network reinforcement.
Expected Timescale to Adoption
3 years Duration of benefit once achieved
20 years
Probability of Success 25%
TRL Development (Start – Current)
1 2 3 4 5 6 7 8 9
Project NPV (Present Benefits x Probability of Success) – Present Costs
£-267,191 Project NPV is negative due to the
low TRL / high costs upon commencement

IFI Annual Report 2010/11
Page 27 of 85 SP Power Systems Limited Registered Office: 1 Atlantic Quay Glasgow G2 8SP
Registered in Scotland No. 215841 Vat No. GB 659 3720 08
Project Progress March 10
Pilot 2 (SPEN) has undergone type testing and is awaiting final load testing prior to installation at Ainsworth Lane. Work is being carried out at Ainsworth Lane to prepare the site prior to delivery with installation looking to be in October 2011
Pilot 3 (CE) design has also been completed, this pilot based on a pre-saturated core technology (still based on superconducting materials) installed in a transformer tail rather than a bus section, and build is ongoing. After Type Testing this will be installed in the CE network at the end of late 2011.
Potential for achieving expected benefits
Work progresses on pilots 2 and 3 with installations in 2011.
The project is managed against milestones and future milestones include the assembly and type testing at an independent test house prior to installation and commissioning of all units.
Collaborative Partners
Electricity North West, CE Electric UK, Applied Superconductor Ltd
R&D Providers Applied Superconductor Ltd

IFI Annual Report 2010/11
Page 28 of 85 SP Power Systems Limited Registered Office: 1 Atlantic Quay Glasgow G2 8SP
Registered in Scotland No. 215841 Vat No. GB 659 3720 08
Project Title IFI 0511 - Voltage Control ACTIV (EATL)
Description of project
This project is to investigate active voltage control to increase the efficiency of the network and facilitate the connection of distributed generation. More specifically it is to undertake field trials of the Fundamentals SuperTAPP n+ automatic voltage control (AVC) relay and develop associated modelling criteria for network planners.
Expenditure for financial year
Internal £8,046 Expenditure in previous (IFI) financial years
Internal £32,023
External £4,300 External £93,644
Total £12,346 Total £125,667
Project Cost (Collaborative + external + SPEN)
£254,206 Projected 10/11 costs for SPEN
Internal £0
External £0
Total £0
Technological area and / or issue addressed by project
It is proposed that this relay could provide a viable alternative for voltage control across SP-M / SP-D in areas where the ratios of generation to load is high.
Type(s) of innovation involved
Incremental Significant Technological substitution
Radical
Yes No No No
Expected Benefits of Project
Enabling the connection of distributed generation using a simple solution which requires minimal network modification;
Improving the voltage profile of supply;
Reducing the requirement for network extensions or reinforcement and increasing the capacity for the connection of distributed generation; and
Reducing the risk of voltage being outside statutory limits and thus damaging equipment and injuring personnel.
Expected Timescale to adoption
<2 Years Duration of benefit once achieved
10 Years
Probability of Success 75%
TRL Development (Start – Current)
1 2 3 4 5 6 7 8 9
Project NPV (Present Benefits x Probability of Success) – Present Costs
£67,445
Project Progress March 11
The main body of the ACTIV project was completed and a final report submitted in the Summer of 2010. This progress report only provides information on the supplementary trial SPEN carried out with the SuperTAPP n+ at Waen Fawr. Over the last 12 months SPEN has trialled the SuperTAPP n+ at Waen Fawr primary substation. This was in order to ascertain if it could release additional voltage headroom that would allow an existing 11kV DG scheme to maintain a 750kW output where a 450kW scheme was deemed to be the maximum possible without causing over voltage conditions. As of July 2011 the supplementary project was complete, with only remedial activities to remove the monitoring and SuperTAPP n+ required. As with SPENs experience in the main body of the ACTIV project the SuperTAPP n+ again was limited in its success. In this instance the accuracy of ‘Generation Estimation’ function of the relay varied due to seasonal load variation. The function performed well when the ratio of the loads on the primary substation 11kV feeders

IFI Annual Report 2010/11
Page 29 of 85 SP Power Systems Limited Registered Office: 1 Atlantic Quay Glasgow G2 8SP
Registered in Scotland No. 215841 Vat No. GB 659 3720 08
remained fairly static. In this instance due to the prominence of domestic storage heating on several of the 11kV feeders the ratio fluctuates significantly from Summer to Winter, as such the function only produced reasonable results for the ratio it was initially configured for. The simulated results from the SuperTAPP n+ were sufficient enough to defer a live trial of this function. After discussions with Fundamental SPEN agreed to trial an ‘Enhanced LDC’ function within the SuperTAPP n+. This function worked as per typical LDC schemes in AVC relays but applied voltage compensation by taking into consideration contribution that downstream DG has on the primary transformer load used to apply LDC voltage boost. Based on simulated results SPEN decided to proceed with a live trial of the function. However the results from the live trial demonstrated that in this instance the function only introduced marginal voltage changes that did not eradicate over voltage conditions and did not prevent isolated under voltage conditions occurring. During the 12 month trial there were two instances of the SuperTAPP n+ malfunctioning to a state that required on site attention. The causes of both malfunctions are currently being investigated; however these malfunctions indicate that further work is required on the relay to obtain the necessary reliability to be considered by DNOs as an AVC relay.
Potential for achieving expected benefits
In the main body of the ACTIV project it was demonstrated that the ‘Generation Estimation’ function of the SuperTAPP n+ could release additional voltage headroom for DG at 3 of the 4 trial sites by acting upon accurate estimates of the output of DG without remote monitoring. However, the supplementary project at Waen Fawr indicated as with the fourth trial site that the relay is not suitable for all network scenarios. In particular the device is not yet ready for interconnected networks or those with an erratic load ratio on their feeders.
Collaborative Partners
Central Networks, Scottish & Southern Energy, Electricity North West
R&D Providers EATL, Fundamentals

IFI Annual Report 2010/11
Page 30 of 85 SP Power Systems Limited Registered Office: 1 Atlantic Quay Glasgow G2 8SP
Registered in Scotland No. 215841 Vat No. GB 659 3720 08
Project Title IFI 0513 - Thermal Modelling and Active Network Management
Description of project A part funded project through the Technology Strategy Board (TSB) Technology Programme (TP/4/EET/6/I/22088) that aims to optimise network design, operation and control by exploitation of dynamic circuit ratings.
Expenditure for financial year
Internal £6,092
Expenditure in previous (IFI) financial years
Internal £30,801
External £60,589 External £64,272
Total £66,682 Total £95,073
Project Cost (Collaborative + external + SP-EN)
£903,000 Projected 10/11 costs for SP-EN
Internal £15,000
External £71,000
Total £86,000
Technological area and / or issue addressed by project
The ratings given to circuits are a function of the temperature by which they operate. The thermal status of a power system component is determined by factors such as: current flow, meteorological conditions and component heat transfer characteristics.
This project seeks to explore the potential benefits arising from: o Improved utilisation of power system assets through the use of real time
knowledge of the thermal status of the power system. o Development of an active controller to facilitate this exploitation and to
balance those issues requiring action by operational staff and those that can be dealt with by machine intelligence.
The result of this work will be a prototype active controller, using novel thermal state estimation and control techniques, installed on the network.
Type(s) of innovation involved
Incremental Significant Technological substitution
Radical
No Yes No No
Expected Benefits of Project
Active network management and exploitation of equipment latent thermal ratings may be a way of accommodating increased levels of renewable generation in distribution networks cost effectively.
Improved utilisation of distribution assets resulting in deferral and/or avoidance of reinforcement investments in distribution systems.
Expected Timescale to adoption
2 Years Duration of benefit once achieved
10 Years
Probability of Success 25%
TRL Development (Start – Current)
1 2 3 4 5 6 7 8 9
Project NPV (Present Benefits x Probability of Success) – Present Costs £301,867
Project Progress March 11
This project was a winner of a coveted IET Innovation Award in the category of “Energy and Power” and is now being incorporated into an LCNF T1 project.

IFI Annual Report 2010/11
Page 31 of 85 SP Power Systems Limited Registered Office: 1 Atlantic Quay Glasgow G2 8SP
Registered in Scotland No. 215841 Vat No. GB 659 3720 08
Potential for achieving expected benefits
The learning from this project is now being used in the Tier 1 Low Carbon Network Fund North Wales Dynamic Thermal Rating project.
Collaborative Partners
TSB (via Technology Programme), Durham University, Imass, Areva T&D, PB
R&D Providers PB (project manager), as above

IFI Annual Report 2010/11
Page 32 of 85 SP Power Systems Limited Registered Office: 1 Atlantic Quay Glasgow G2 8SP
Registered in Scotland No. 215841 Vat No. GB 659 3720 08
Project Title IFI 0515 - Power Network Demonstration Centre (PNDC)
Description of project
Development of a full scale 11kV and LV prototyping network as a test-bed / proving ground for active network management techniques and other ‘high risk’ technologies. Whilst not a technological development in itself, this project is a fundamental enabler of technology, with significant potential to accelerate adoption of significant / radical developments across a range of IFI projects.
Expenditure for financial year
Internal £9,999 Expenditure in previous (IFI) financial years
Internal £34,190
External £41,935 External £57,724
Total £51,934 Total £91,914
Project Cost (Collaborative + external + SPEN)
£7,200,000 Projected 10/11 costs for SPEN
Internal £20,000
External £250,000
Total £225,000
Technological area and / or issue addressed by project
In partnership with collaborators, this project aims to:
Provide a demonstration network to allow the testing of new technologies on a ‘real’ network
Offer a real network that will incorporate 11kV and low voltage equipment, containing real loads, real generation and test real technologies
Create a facility which will be open to Academia, R&D Establishments, Manufacturers, and Network Operators
The vision is to create a physical scale model that can represent different urban, suburban and rural electrical networks. The proposed system will incorporate real network components: cables, overhead lines, switchgear, transformers, protection and control equipment, in order to ensure it is both representative and credible to the real thing. Real Time Digital Simulators (RTDSs) will be used in parallel to model an underlying, more comprehensive network, effectively expanding the scale of the system. Technologies coming more prominently into play over the next 15 years, e.g. micro-generation, storage, fault current limiters, etc., will be included on the test network so as to test their effect, and vice-versa, on both marine and distribution systems.
Type(s) of innovation involved
Incremental Significant Technological substitution
Radical
Yes Yes Yes Yes
Expected Benefits of Project
Benefits to DNOs from such a facility include: Safety – A test network with dedicated staff will offer a facility to train staff in the operation of a more complicated network. Specific what-if scenario courses can be run through repeatable simulation, in the same manner as flight simulators are used to train pilots. Risk mitigation – A real time simulator, with likely penetrations of high volume DG and microGen will indicate the technologies that will need to be developed in order to manage the increased risk this might pose to the network and/or our customers. Acceleration of trials / increased adoption rate – The ability to operate the whole network through a vast range of loading conditions in a short period of time, will lead to the end of long duration (12-24mth) network trials of new technologies.
Expected Timescale to adoption
1 Years Duration of benefit once achieved
20 Years
Probability of Success
25%
TRL Development (Start – Current)
1 2 3 4 5 6 7 8 9

IFI Annual Report 2010/11
Page 33 of 85 SP Power Systems Limited Registered Office: 1 Atlantic Quay Glasgow G2 8SP
Registered in Scotland No. 215841 Vat No. GB 659 3720 08
Project NPV (Present Benefits x Probability of Success) – Present Costs £709,171
Project Progress March 10
Activity Apr 2010 - March 2011
Power network functional design completed. SPEN and SSE have commented on and accepted initial design.
Detailed network design tender issued.
Building design tendered issued and awarded.
Building design underway.
Draft Research Agenda complete. SPEN and SSE have commented on this.
Draft website completed. SPEN and SSE to comment.
Refinements to business plan completed in light of developments during this time period.
Tender for the construction of building and electrical infrastructure has been issued
Ground clearance work has started at the Cumbernauld site
Timescales for completion
Construction work to begin September 2011 with final completion May 2012.
Potential for achieving expected benefits
Facility – Operation and SP role Overall governance will be carried run by the PNDC Directors, Operational and Research (UoS staff).
The Core Research Programme, will be planned and approved by the PNDC board which comprises of the PNDC directors, UoS finance director and Tier 1 members.
There are three classes of membership: Founder Tier 1, Tier 1 and Tier 2, each having different voting rights on the PNDC board.
For SPEN to get maximum value out of the PNDC we will be seeking to use our place on the PNDC board to our maximum advantage in guiding the PNDC core programme to benefit our IFI programme.
We also anticipate that SPEN will have various projects that will require the use of the centre to reduce their time to adoption within SP.
Collaborative Partners
Scottish & Southern Energy, Scottish Enterprise and University of Strathclyde
R&D Providers See Collaborative Partners

IFI Annual Report 2010/11
Page 34 of 85 SP Power Systems Limited Registered Office: 1 Atlantic Quay Glasgow G2 8SP
Registered in Scotland No. 215841 Vat No. GB 659 3720 08
Project Title IFI 0526 - PD Monitoring of Cables (11 & 33kV)
Description of project
Partial discharge (PD) monitoring technology is a tool often used for identifying HV cable sections that are at risk of failing in the near future. There are two distinct methods of testing for PD:
Long term monitoring to identify the degradation of the cable which signals the increase in risk of failure; and
PD mapping which pinpoints the location of any discharge along the route of the cable.
Developing the technology to apply these methods gives a network operator the evidence required to assist in targeting investment / cable replacement, with a net improvement in network performance. This project will develop a portable PD monitoring product that can be moved around the network, as tool in the prioritisation in cable replacement.
Expenditure for financial year
Internal £7,602
Expenditure in previous (IFI) financial years
Internal £12,842
External £3,950 External £68,282
Total £11,552 Total £81,124
Project Cost (Collaborative + external + SPEN)
£160,000 Projected 08/09 costs for SPEN
Internal £5,000
External £42,650
Total £47,650
Technological area and / or issue addressed by project
This project will develop partial discharge monitoring hardware which will initially be tested on the SP 11kV network with the following aims:
To develop a suitable portable monitoring solution with the ability to identify any cable sections which are emitting a level of discharge, which could lead to faults in the short term. The portable monitor will allow SP to test for a period of a few minutes to many weeks.
Following initial testing in 10 primary substations, partial discharge mapping of those cable sections, which are registering the highest level of discharge, will be undertaken.
Based on the PD maps obtained, any areas of concentrated PD activity, which are identified as critical, will be subject to review and selected cable sections will be replaced. The cable/joints removed will then be tested to validate PD test results.
It is planned that the test results will be collated in a database, which, in conjunction with results from the testing carried out by other UK DNOs, will allow for advancements in the knowledge rules for future PD testing technology.
Type(s) of innovation involved
Incremental Significant Technological substitution
Radical
No Yes No No
Expected Benefits of Project
Developing PD monitoring techniques and understanding of PD activity with respect to cable degradation will assist with cable replacement decision-making. It will also aid justification and prioritising of capital spend.
Anticipated key benefits will be in the area of CML and CI improvements and cost savings through targeted cable section replacement programmes.
Expected Timescale to adoption
1-2 Years Duration of benefit once achieved
5 Years
Probability of Success
50%
TRL Development (Start – Current)
1 2 3 4 5 6 7 8 9

IFI Annual Report 2010/11
Page 35 of 85 SP Power Systems Limited Registered Office: 1 Atlantic Quay Glasgow G2 8SP
Registered in Scotland No. 215841 Vat No. GB 659 3720 08
Project NPV (Present Benefits x Probability of Success) – Present Costs
£108,661
Project Progress March 11
Work is been carried out to analyse the top 20 worst performing circuits in SPM and SPD for faulted cable section so that a more targeted application of cable monitoring can be carried out.
Potential for achieving expected benefits
Having correctly verified sources of PD in cable and identified cables with PD in the area of concern, the next stage is to monitor the top 20 most problematic circuits in both SPM and SPD. If these cable sections are found to have high levels of PD it is planned to identify location of PD section, expose cable section and replace with healthy cable.
Collaborative Partners
N/A
R&D Providers HVPD (Formally IPEC HV)

IFI Annual Report 2010/11
Page 36 of 85 SP Power Systems Limited Registered Office: 1 Atlantic Quay Glasgow G2 8SP
Registered in Scotland No. 215841 Vat No. GB 659 3720 08
Project Title IFI 0532 - AURA-NMS
Description of project
This project aims to produce a control structure and set of control algorithms that realise the notion of an active distribution network and enhance the service a network operator provides to load and generation customers, improving network performance (asset use, etc.).
Expenditure for financial year
Internal £6,092 Expenditure in previous (IFI) financial years
Internal £78,583
External £30,408 External £650,129
Total £36,500 Total £728,712
Project Cost (Collaborative + external + SPEN)
£5,962,636 Projected 10/11 costs for SPEN
Internal £0
External £0
Total £0
Technological area and / or issue addressed by project
In general the scoping and development will consider the following major areas.
Distributed Generation and demand side management to facilitate the connection of DG to the network;
Develop a controller that will monitor electricity networks, isolate faults quickly and allow distributed generation to remain connected and operating.
The SP portion of this work is to focus on constraint management techniques for use on new / existing generation connections, focussing on the 33kV and 132kV networks. Although relevant to both SP-D and SP-M networks, the principle focus in case studies will be to overcome existing limitations in SP-M, with a focus on:
Overcoming complexity of existing hard-wired intertripping schemes
Determining a solution for managing multiple generation connections in a given locality
Developing and implementing a system that can work in harmony with existing SCADA infrastructure
Assessing communication requirements and technologies for delivering an active and autonomous system.
Type(s) of innovation involved
Incremental Significant Technological substitution
Radical
No No No Yes
Expected Benefits of Project
Benefits are expected to include:
Development of a constraint management solution with relevant experts
Implement solution and prove concept
Maximisation of the contribution of DG to the electricity network;
Reduction in carbon emissions and help towards the UK governments climate change targets;
Reduction in network losses by having the source of generation close to the load;
Improvement in quality and security of supply;
Improvement in network resilience; and
Reducing the current market failures to increase network capacity for DG.
Expected Timescale to adoption
7 Years Duration of benefit once achieved
20 Years
Probability of Success 25%
TRL Development (Start – Current)
1 2 3 4 5 6 7 8 9
Project NPV (Present Benefits x Probability of Success) – Present Costs
£-364,068 The figure is negative as this is a costly project
starting from a low TRL

IFI Annual Report 2010/11
Page 37 of 85 SP Power Systems Limited Registered Office: 1 Atlantic Quay Glasgow G2 8SP
Registered in Scotland No. 215841 Vat No. GB 659 3720 08
Project Progress March 11
This project is now closed
Potential for achieving expected benefits
The project has delivered significant academic output in terms of algorithms development and simulation analysis. Knowledge within the industry with regard to implementation of active management / constraint management has been greatly enhanced due to this project.
Academic Work of AuRA-NMS benefits case suggests that the benefits of Active Management System deployment are greatest on network which is likely to undergo significant development.
Although simulation studies showed encouraging results, further development and validation work is required in order to implement the algorithms/control systems on actual networks. There are also some integration and commercial issues to overcome in order to apply to legacy connections. SP is currently applying knowledge gained though the project while issuing new connections and connection agreements.
The algorithms can be utilised in open loop format to aid control rooms as decision support tools, this area is being further developed, and was not a benefit foreseen at the start of the project.
The output from Aura-NMS will feed into other initiatives to further develop the potential of this technology in a real environment.
Collaborative Partners
EDF-Energy, EPSRC Strategic Partnership, ABB
R&D Providers ABB, Universities: Imperial College London (lead), Strathclyde, Durham, Edinburgh, Loughborough, Bath, Manchester (Cardiff)

IFI Annual Report 2010/11
Page 38 of 85 SP Power Systems Limited Registered Office: 1 Atlantic Quay Glasgow G2 8SP
Registered in Scotland No. 215841 Vat No. GB 659 3720 08
Project Title IFI 0607 - LV Network Automation
Description of project
The aim of a Low Voltage Automation (LVA) project is to provide a trial system on Scottish Power Energy Networks (SPEN’s) LV network, which will prove the benefits of implementing a larger scale LVA system across the LV networks. The trial system will consist of one LVA CCU (modified old CCU) and one phase LVA switch. It is two major parts that will be validated in the project. The first one is the communication from the control point to the LVA switch. The communication technique will be the Power Line Communication (PLC). The second part is the mechanical behaviour and the control of the Magnetic vacuum Switch from EPS.
Expenditure for financial year
Internal £73,713
Expenditure in previous (IFI) financial years
Internal £79,645
External £38,496 External £167,454
Total £112,210 Total £247,098
Project Cost (Collaborative + external + SP-EN)
£257,775 Projected 10/11 costs for SP-EN
Internal £0
External £0
Total £0
Technological area and / or issue addressed by project
The Low Voltage networks contribute ~11% CI and ~15.5% CML between the SP-D / SP-M networks (taken from 2003/04 NaFIRs report).
Both proposals aim to produce, install and test prototype systems on a trial network, providing a proof of concept and evaluating performance of the installation on the LV distribution network.
Application will be to focus on high customer density, worst performing LV circuits.
Type(s) of innovation involved
Incremental Significant Technological substitution
Radical
No Yes No No
Expected Benefits of Project
Application of the technology should provide the following benefits:
Reduction of CMLs on the LV network
Increased asset life of circuit elements by the reduction of both fault currents and stresses during fault location
Reduced cost and time of fault location through rapid identification of faults location
Elimination of repeated intermittent faults
Expected Timescale to adoption
3 Years Duration of benefit once achieved
10 Years
Probability of Success
50%
TRL Development (Start – Current)
1 2 3 4 5 6 7 8 9
Project NPV (Present Benefits x Probability of Success) – Present Costs
£526,7k

IFI Annual Report 2010/11
Page 39 of 85 SP Power Systems Limited Registered Office: 1 Atlantic Quay Glasgow G2 8SP
Registered in Scotland No. 215841 Vat No. GB 659 3720 08
Project Progress March 11
With the expected increase in micro-generation and embedded generation coupled with an increase in the use of electrical powered vehicles, the current low voltage network will face significant infrastructure challenges to allow for the increased demands these future requirements will place on it. There is likely to be a requirment to have a much greater dynamic load control on the low voltage network and to also provide early warning of power quality issues. Furthermore there will be an even greater demand to ensure that the carbon foot print of any network (the system losses) should be better managed and of course reduced. The recent succesful trial of the Radius LVA071 prototype has proven the concept of controlling a miniture low voltage vacuum switch/interupter across the low voltage network using Power Line Carrier signalling. The next phase of the project is to bring to market a final product that meets the demands of SPEN.
Potential for achieving expected benefits
Having proved the LVA could perform in this environment, coupled with the control and network behaviour data capability, we have now embarked on a continuation IFI project to further develop this prototype into a final product that will enable the Smart Grid concept.
Collaborative Partners
None
R&D Providers RADIUS

IFI Annual Report 2010/11
Page 40 of 85 SP Power Systems Limited Registered Office: 1 Atlantic Quay Glasgow G2 8SP
Registered in Scotland No. 215841 Vat No. GB 659 3720 08
Project Title IFI 0615 - ScottishPower Advanced Research Centre (SPARC)
Description of project
Three workstreams have been proposed:
Asset Engineering: Field based activities, concentrating on the technologies used to gather and interpret data then control and manage individual assets.
Asset Strategy: Office, desktop, PC based analytical activities including the analysis of data, concentrating on underlying trends of asset populations (from asset ageing to network performance).
System Development: Forward looking network design activities considering the connectivity between the assets. It should consider both the medium term (5 years) and longer-term trends (>10 years), which will affect the design of the network (e.g. load, generation, standards, regulations, Ofgem incentives/penalties).
A number of related projects will be developed within each workstream.
Expenditure for financial year
Internal £11,302 Expenditure in previous (IFI) financial years
Internal £19,381
External £160,630 External £320,437
Total £171,932 Total £339,818
Project Cost (Collaborative + external + SP-EN)
£460,083 Projected 10/11 costs for SP-EN
Internal £10,000
External £160,000
Total £170,000
Technological area and / or issue addressed by project
Asset Engineering research stream focuses on methods and technologies that enable better use of individual assets.
Asset Strategy research stream focuses on methods and tools that enable better management of populations of assets.
System Development research stream focuses on analytical techniques that provide SP with better capability to plan and design the power system.
Type(s) of innovation involved
Significant
Project Benefits Rating
Project Residual Risk
Overall Project Score
18 1 17
Expected Benefits of Project
Research activities will seek to realise business benefits across a range of areas including system performance, OPEX and CAPEX. Key areas have been identified in the SPARC proposal, which are being used to form the basis of a more comprehensive programme of deliverable projects.
Expected Timescale to adoption
3 Years Duration of benefit once achieved
10 Years
Probability of Success
Varies per project
TRL Development (Start – Current)
1 2 3 4 5 6 7 8 9
Project NPV (Present Benefits x Probability of Success) – Present Costs
TBC In development for the core projects in each
workstream

IFI Annual Report 2010/11
Page 41 of 85 SP Power Systems Limited Registered Office: 1 Atlantic Quay Glasgow G2 8SP
Registered in Scotland No. 215841 Vat No. GB 659 3720 08
Project Progress March 10
‘Asset Strategy’ Theme: Automated analysis of SCADA data and digital fault records for analysis of power system protection performance Develop, implement and test a prototype Post-Fault Analysis Suite: Test case identified: The high volume of SCADA alarms generated by incidents on 24th - 25th February and 30th March will provide suitable case studies for the testing and validation of the developed prototype. Carry out manual analysis on the test case data: Using fault data from the 24
th -25
th February (where all SCADA data is available) 10
network events were identified as being of particular interested and the manual analysis presented and validated by protection engineers at SP. System Development’ Theme: Optimal Distribution Network Architectures Development of a software interface between the loss minimisation algorithm and Power Factory. This has the capability of reading network data that is written in Power Factory format and also of initialising and executing a load flow in Power Factory and reading its results back from Power Factory in order to test the results of the loss minimisation algorithm. Development of a model of part of the North Wales distribution network. This gives the opportunity for a different kind of test case, having a different topology and the presence of distributed generation. With the base data being in IPSA format, the choice had to be made either to convert it to PowerFactory or develop a new software interface between the loss minimisation algorithm and IPSA. In view of the future intention to use a prototype IPSA reliability calculation engine and the possibility of also using its fault level calculation capability, the latter was chosen and has been done, mirroring the capability already developed for the interface with Power Factory. ‘Asset Engineering’ Theme: PD Diagnostics in MV Cables A method for time synchronization of two similar hardware using GPS was developed. Hardware inherited from previous research was modified to implement GPS time stamping. New firmware based on the time synchronization method was developed. A user interface was also developed for the client and server PCs. This system will be ready for laboratory testing by the end of December, making it ready for the capture of on-site measurements early in the new year. The performance of this approach in the capture of PD signals was tested at Haggs road substation and it registered signs of PD activity in the cable.

IFI Annual Report 2010/11
Page 42 of 85 SP Power Systems Limited Registered Office: 1 Atlantic Quay Glasgow G2 8SP
Registered in Scotland No. 215841 Vat No. GB 659 3720 08
Potential for achieving expected benefits
The PhD project of the Asset Strategy theme is expected to deliver significant enhancements to the PEDA system developed from previous research conducted by the University of Strathclyde in collaboration with SPEN protection engineers. Following discussions with SPEN and Iberdrola, the focus of this work changed from that originally defined to ensure that the proposed system leverages the network and protection scheme information now available from the newly developed ‘Protection Database’. The use of accurate representations of network and scheme connectivity will significantly improve the reliability and accuracy of the protection assessment output delivered and offer valuable decision support to protection engineers.
The PhD project of the System Development theme is expected to deliver a method of minimising network losses by actively managing power flow through network reconfiguration within operational, planning and design timescales. The research will search for an optimal solution that respects multiple objectives, i.e. the need to minimise losses without compromising reliability, while respecting network constraints, e.g. fault levels. This will allow SPEN to implement operationally ‘smarter’ and more cost effective solutions to minimise active power losses as an alternative to costly network reinforcement.
The PhD project of the Asset Engineering theme is expected to deliver a cost effective method of detecting partial discharge present in medium voltage cables. This phenomenon is responsible for the degradation of cable insulation and ultimately failure. Using existing protection CTs to also perform a secondary function as PD cable sensors affords asset managers with an unprecedented level of cable PD monitoring capability across the network, without the need to develop or install dedicated PD cable sensors. It is expected that this PhD will prove this concept while further work will be required to assess the robustness and commercialisation prospects of this approach.
Key SPEN personnel are engaged at technical and strategic levels though regular project meetings and SPARC strategy meetings to ensure that research is progresses along the TRL development scale towards deployment within the organisation. In addition, a key function of these strategy meetings (involving all SPARC personnel, and held bi-annually) is to ensure that the pipeline of prospective research projects is maintained and that they remain relevant to the strategic objectives of SPEN.
Collaborative Partners
N/A
R&D Providers University of Strathclyde
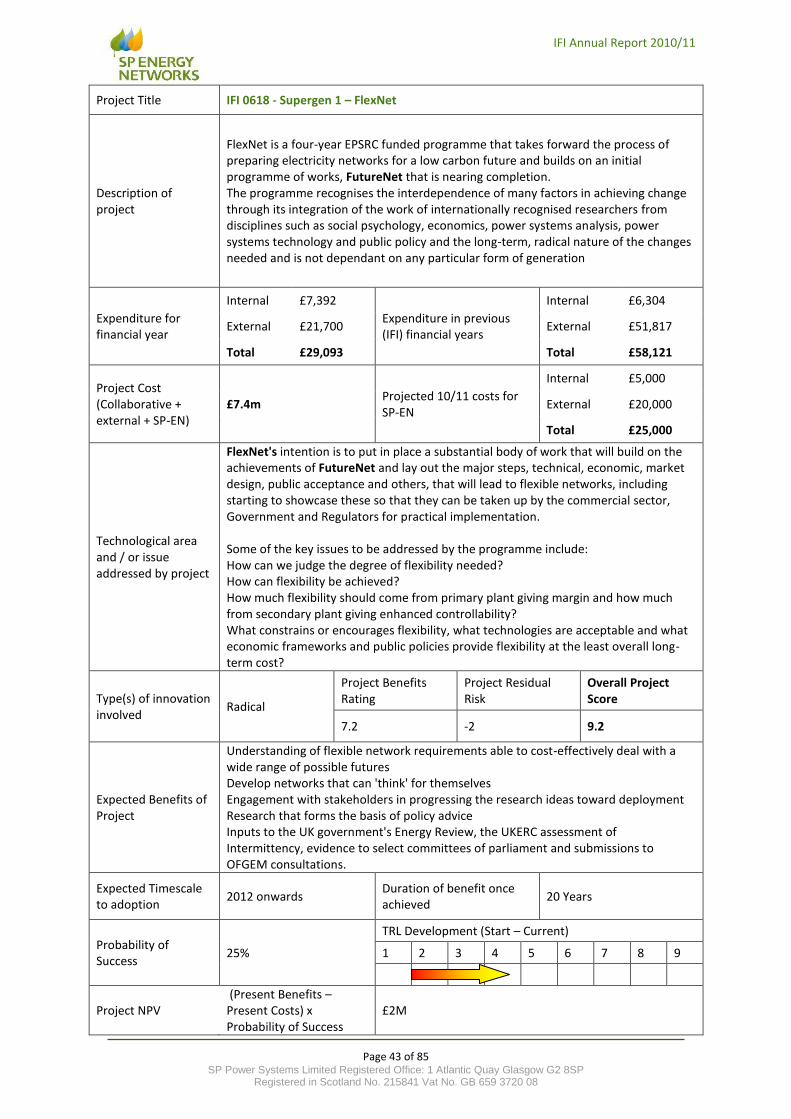
IFI Annual Report 2010/11
Page 43 of 85 SP Power Systems Limited Registered Office: 1 Atlantic Quay Glasgow G2 8SP
Registered in Scotland No. 215841 Vat No. GB 659 3720 08
Project Title IFI 0618 - Supergen 1 – FlexNet
Description of project
FlexNet is a four-year EPSRC funded programme that takes forward the process of preparing electricity networks for a low carbon future and builds on an initial programme of works, FutureNet that is nearing completion. The programme recognises the interdependence of many factors in achieving change through its integration of the work of internationally recognised researchers from disciplines such as social psychology, economics, power systems analysis, power systems technology and public policy and the long-term, radical nature of the changes needed and is not dependant on any particular form of generation
Expenditure for financial year
Internal £7,392
Expenditure in previous (IFI) financial years
Internal £6,304
External £21,700 External £51,817
Total £29,093 Total £58,121
Project Cost (Collaborative + external + SP-EN)
£7.4m Projected 10/11 costs for SP-EN
Internal £5,000
External £20,000
Total £25,000
Technological area and / or issue addressed by project
FlexNet's intention is to put in place a substantial body of work that will build on the achievements of FutureNet and lay out the major steps, technical, economic, market design, public acceptance and others, that will lead to flexible networks, including starting to showcase these so that they can be taken up by the commercial sector, Government and Regulators for practical implementation. Some of the key issues to be addressed by the programme include: How can we judge the degree of flexibility needed? How can flexibility be achieved? How much flexibility should come from primary plant giving margin and how much from secondary plant giving enhanced controllability? What constrains or encourages flexibility, what technologies are acceptable and what economic frameworks and public policies provide flexibility at the least overall long-term cost?
Type(s) of innovation involved
Radical
Project Benefits Rating
Project Residual Risk
Overall Project Score
7.2 -2 9.2
Expected Benefits of Project
Understanding of flexible network requirements able to cost-effectively deal with a wide range of possible futures Develop networks that can 'think' for themselves Engagement with stakeholders in progressing the research ideas toward deployment Research that forms the basis of policy advice Inputs to the UK government's Energy Review, the UKERC assessment of Intermittency, evidence to select committees of parliament and submissions to OFGEM consultations.
Expected Timescale to adoption
2012 onwards Duration of benefit once achieved
20 Years
Probability of Success
25%
TRL Development (Start – Current)
1 2 3 4 5 6 7 8 9
Project NPV (Present Benefits – Present Costs) x Probability of Success
£2M

IFI Annual Report 2010/11
Page 44 of 85 SP Power Systems Limited Registered Office: 1 Atlantic Quay Glasgow G2 8SP
Registered in Scotland No. 215841 Vat No. GB 659 3720 08
Project Progress March 10
The project has completed 3.5 years of its 4 year programme and most work has reached the stage of producing conclusions on the basis of its simulation models and experimental tests. The training programme is also nearly complete with a series of discipline crossing training courses and industrial placements undertaken for researchers. The progress reported here concentrates on task completed in the last 12 months. • Intermittency – New techniques and algorithms have been used to assess the ability of demand side flexibility and interconnections to (i) “firm up” intermittent renewables, hence increasing the capacity value of intermittent generation and reduce backup requirements; and (ii) to reduce the need for operating reserves and flexible generation, enhancing the operating efficiency of the system and the ability of the system to absorb intermittent generation. An approach to bidding wind power in a competitive market has been produced. • System Operation – a WAMS demonstration platform has been completed and proposals made for the use of corrective control options. The operation of a system with series compensation and HVDC bootstraps has been modelled and the provision of damping in such as system investigated. An adaptive auto-recloser scheme has been demonstrated. • Multi-Terminal HVDC Systems – Laboratory demonstration of multi-terminal operation has been achieved. Detailed control schemes have been established for multi-module power converters and tools produced for assessing the power loss of these structures. Some specific proposals have been made for control and operation through AC- and DC-side faults. • Customer Participation – Demonstrations have been completed on frequency responsive home appliances and of building energy management systems that respond to local network conditions and energy prices. A study of deliberative engagement taking an example at Nailsea on the reinforcement route from Hinckley Point has led to conclusions on how a community perceives the information present on route options. • More Electric Future – The linkages between electricity and heat distribution systems have been explored using a case study in Ebbw Vale. • Active Distribution Networks – Experimental evidence has now been provided that the hybrid tap changer extends contact life into millions of operations and a fast switch actuator has been prototyped. The soft-open-point has been assessed in simulations of 12 example networks and the control system is also being tested in a laboratory example. Fault current analysis of inverter DG has been experimentally verified and a procedure for calculating such fault currents established. Existing protection policies have been tested against a large number of DG scenarios to establish where and when such policies may need revision. Proposals have been made for adaptive protection regimes. A demonstration of a control room display incorporating active management schemes has been completed.
Potential for achieving expected benefits
FlexNet will produce a number of PhD graduates who will be familiar with issues associated with distribution and transmission networks. The new concepts, techniques, prototypes and demonstrations will inform network operators of the options that could become available in the next few years.
Collaborative Partners
EPSRC, National Grid, Scottish and Southern Energy, Central Networks, EDF Energy Networks, SP Energy Networks and CE Electric UK
R&D Providers University of Bath, University of Birmingham, University of Cambridge, Cardiff University, University of Durham, University of Edinburgh, University of Exeter, University of Manchester, University of Strathclyde and Imperial College London.

IFI Annual Report 2010/11
Page 45 of 85 SP Power Systems Limited Registered Office: 1 Atlantic Quay Glasgow G2 8SP
Registered in Scotland No. 215841 Vat No. GB 659 3720 08
Project Title IFI 0621 – 1 Monitoring Solution for Overhead Networks
Description of project
FMC-Tech has developed a new system for on line measurement of conductor temperature and load, using a modified conductor mounted Fault Passage Indicator (FPI) together with a software system running a thermal model of the overhead line asset. As a result this system enables both dynamic line rating and the location of faults in a single device.
Expenditure for financial year
Internal £1,849 External £24,040 Total £25,889
Expenditure in previous (IFI) financial years
Internal £17.348 External £35,671 Total £53,019
Project Cost £273k Projected 2012 costs for SPEN
Internal £10,000 External £10,000 Total £20,000
Technological area and / or issue addressed by project
The technological areas are twofold, firstly the conductor mounted FPI:
Detects the passage of fault current on distribution networks, recording accurate current waveform data
The dynamic rating monitoring solution can be applied:
In the management of heavily loaded circuits
Delivering potential connection solutions for DG, particularly wind where increased wind speed results in higher export, but also greater cooling of the overhead line and therefore providing an increased conductor rating.
Type(s) of innovation involved
Significant
Project Benefits Rating
Project Residual Risk Overall Project
Score
22 -1 23
Expected Benefits of Project
Successful completion of the project will result in:
A new data source platform, that is a fundamental base for strategic and operational activity to improve network efficiency.
Load information available to utility personnel on line conditions prior to system maintenance.
System will reduce the duration of power outages and allow for distributed generation from renewable energy sources i.e. wind farms.
Will meet the increasingly stricter outage criteria from the regulator (i.e. future proof the networks, leading to reduction in regulator penalties and power outages.
Expected Timescale to adoption
1 years Duration of benefit
once achieved 5 years (per unit)
Probability of Success 75% Project NPV = (PV
Benefits – PV Costs) x Probability of Success
£429k

IFI Annual Report 2010/11
Page 46 of 85 SP Power Systems Limited Registered Office: 1 Atlantic Quay Glasgow G2 8SP
Registered in Scotland No. 215841 Vat No. GB 659 3720 08
Potential for achieving expected benefits
This project has suffered significant delays during the period through financial stability issues faced by the SME leading the project (FMC Tech), and a protracted due diligence process of the sale of the company to General Electric. GE formally took ownership of the company at the beginning of July. FMC Tech have confirmed that GE are 100% committed to supporting the project and are already building up plans for the commercial manufacture of the final design from the project. Given that the GE takeover has only just taken place, timing on the remaining work on the project is unclear at this point in time but should be clarified very shortly. There is a high confidence level that the project will deliver the operational benefits it
Project Progress to March 2011
A revised mechanical design of temperature sensor mounting has been completed and prototype tooling made/modified to enable samples to be produced
Extensive independent testing completed, to understand the accuracy of line surface temperature measurements by the unit in controlled test rig conditions. Initial analysis suggests there may be some further work to improve the sensor mounting arrangement to improve accuracy. The results are currently being analysed to understand if further design changes should be made
Given the issues facing the company the delivery plan for prototypes has been revised, such that the first samples for field testing will be received in Q3 2011, and that these will be the more advanced Mk III version rather than the interim MkII design
Collaborative Partners
ENW, Scottish Power, SSE, FMC Tech, Energy Innovation Centre
R&D Providers FMC Tech

IFI Annual Report 2010/11
Page 47 of 85 SP Power Systems Limited Registered Office: 1 Atlantic Quay Glasgow G2 8SP
Registered in Scotland No. 215841 Vat No. GB 659 3720 08
Project Title IFI 0621 – 2 Surenet – LV Sure
Description of project
The development of LV Sure will take the SignalSure concept of circuit restoration and consider whether it could be applied to low voltage distribution networks. The project’s objectives are to:
Produce functional specification, detailed product development project plan & test plan for the LVSure system
Production of a prototype LVSure System and laboratory testing of the system
Installation and testing of prototype on a representative test circuit
Monitoring, evaluation and reporting of the performance of the trial system against functional specification
Installation and demonstration of a number of prototypes on a selection of LV Networks
Expenditure for financial year
Internal £1,849 External £7,303 Total £9,152
Expenditure in previous (IFI) financial years
Internal £11,398 External £80,504 Total £91,902
Project Cost £65,856 Projected 2012 costs for SPEN
Internal £0 External £0 Total £0
Technological area and / or issue addressed by project
The LVSure system comprises a source breaker, the Intelligent Fuse Unit (IFU); plus a number of mechanical isolating switches, or Intelligent Link Units (ILUs) installed at strategic positions along the LV circuit. Isolation of the faulted section and restoration of supply to un-faulted sections of the circuit is fully automated and does not require communication between the devices which comprise the LVSure system. When a fault occurs on the LV network the IFU disconnects supply to the entire circuit. The ILUs along the route, sense no voltage and automatically open, in effect sectioning the circuit. Both the IFU and the ILU incorporate sensing circuitry which tests for the presence of a fault on the electrical section downstream of each Unit. The IFU would commence the restoration process by testing downstream and if healthy would restore supply to the first section. Each ILU in turn would initially sense it has an incoming voltage, then test downstream and again, if healthy, restore supply. This would continue until the faulted section was reached when testing would inhibit the ILU from closure. Circuits with an alternative supply from a remote end could complete the restoration process until all sections had supply restored except the faulted section.
Type(s) of innovation involved
Tech Transfer
Project Benefits Rating
Project Residual Risk Overall Project
Score
16 -1 17

IFI Annual Report 2010/11
Page 48 of 85 SP Power Systems Limited Registered Office: 1 Atlantic Quay Glasgow G2 8SP
Registered in Scotland No. 215841 Vat No. GB 659 3720 08
Expected Benefits of Project
Successful completion of the project will result in:
Knowledge of how to reconfigure and redesign LV networks to obtain optimum performance will be developed and transferred to the DNO.
Avoid potential hazard of operator installing a replacement fuse of a live LV board with a faulted circuit.
Assuming installation on worst performing (Rogue) LV circuits avoiding CML and CI associated with up to 5 transient interruptions per year per LV circuit would substantially and sustainably improve network performance for worst served customers.
Reduction in potential risks from loss of traffic controls, street lighting, general lighting in public areas etc.
Expected Timescale to adoption
1 years Duration of benefit
once achieved 15 years
Probability of Success 10% Project NPV = (PV
Benefits – PV Costs) x Probability of Success
£245,517
Potential for achieving expected benefits
The project has delivered successful functional results but issues of thermal dissipation due to the use of power electronic switching components in a very small device envelope represent an additional design challenge.
Project Progress to March 11
Prototype mechanical design complete
Design and software for prototypes complete
Prototype bench testing completed end March 201
First phase of high voltage & high current testing completed
Collaborative Partners Scottish Power, SSE, Surenet Technology Ltd, Energy Innovation Centre
R&D Providers Surenet Technology Ltd

IFI Annual Report 2010/11
Page 49 of 85 SP Power Systems Limited Registered Office: 1 Atlantic Quay Glasgow G2 8SP
Registered in Scotland No. 215841 Vat No. GB 659 3720 08
Project Title IFI 0621 - 3 Live Alert – Energised Alert
Description of project
The Energised Alert is a high voltage detection device, currently capable of detecting voltages of above 2kV. The project’s objectives are to:
To extend the voltage sensing range downwards from 2000 Volts
To undertake a full market appraisal
To undertake full evaluation of technology whilst in operation
This project aims to take the Energised Alert from TRL 4 to 8.
Expenditure for financial year
Internal £1,849 External £425 Total £2,274
Expenditure in previous IFI financial years
Internal £6,691 External £16,957 Total £23,648
Project Cost £65,856 Projected 11/12 costs for SPEN
Internal £0 External £0 Total £0
Technological area and / or issue addressed by project
The Energised Alert senses any increase in electrical potential, above a predetermined threshold, of devices to which it is attached. Once triggered it is linked to an audible alarm, allowing the recognition and management of this potentially deadly hazard in a controlled manner. Its use will, therefore protect the operator, other employees and any members of the public in the vicinity from casual, but more importantly, avoidable electrocution.
Type(s) of innovation involved
Significant
Project Benefits Rating
Project Residual Risk Overall Project
Score
14 -5 19
Expected Benefits of Project
Successful development of the Energised Alert would:
Help prevent electrocution accidents and fatalities
Ensure ‘live line’ maintenance can be carried out in a safe manner
Allow operators to proactively respond to incidents on their network
Expected Timescale to adoption
1 year Duration of benefit
once achieved 25 years
Probability of Success 50% Project NPV = (PV
Benefits – PV Costs) x Probability of Success
£227,017
Potential for achieving expected benefits
The project is on target to achieve the expected benefits.
Project Progress to March 2011
Stage One of the project, to design and develop the sensing system was completed successfully and met the deliverable set at the start of the project.
Stage Two, to design and develop a refined prototype is underway and there are no indications that this Stage won’t be completed successfully.
Collaborative Partners CE Electric, Electricity North West, Scottish Power, SSE, Energy Innovation Centre, Live Alert
R&D Providers Live Alert

IFI Annual Report 2010/11
Page 50 of 85 SP Power Systems Limited Registered Office: 1 Atlantic Quay Glasgow G2 8SP
Registered in Scotland No. 215841 Vat No. GB 659 3720 08
Project Title IFI 0625 - Vegetation Management - ADAS
Description of project
Vegetation management in the vicinity of overhead lines represents a significant maintenance requirement and associated budget spend. While there is an on-going commitment to this issue, it is recognised that a better understanding of vegetation growth rates would greatly assist in vegetation management strategies and decision making; helping direct the focus of activity. The project will seek to develop a software model that will analyse the relationships between key environmental variables (including the potential impact of climate change) and vegetation growth rate, for different vegetation types. The model will be used to consider the costs and benefits of undertaking vegetation management to different specifications. Following tree cutting at selected sites the model will be validated against the first year of growth data, which will be determined by laser measurement. The model will subsequently be optimised based on annual growth rates determined over a further three-year period.
Expenditure for financial year
Internal £9,978 Expenditure in previous (IFI) financial years
Internal £11,398
External £61,033 External £290,504
Total £70,012 Total £301,902
Project Cost (Collaborative + external + SPEN)
£1,744,000 Projected 10/11 costs for SPEN
Internal £8,000
External £41,000
Total £49,000
Technological area and / or issue addressed by project
This project is a UK wide study into the differing growth rates experienced in the 26 “bio-climatic” zones that are found across the country.
It will involve cuts made to 2000 sample areas across the identified zones to a common specification, followed by monitoring to confirm growth.
The output is expected to lead to modelling software that can portray different cut cycles.
The common UK project should provide further evidence / justification in future Price Control Reviews.
Type(s) of innovation involved
Incremental Significant Technological substitution
Radical
No Yes No No
Expected Benefits of Project
The model developed will identify areas that will require more frequent tree cutting to maintain safe clearance distances and meet legal requirements.
Evidence-based decisions on the frequency and location of tree cutting will enhance network resilience and therefore improve security of supply and associated regulatory performance (CI and CML savings).
Improved targeting of OPEX may be realised through proactive cutting and extending the cutting cycle in high and low growth areas respectively.
Expected Timescale to adoption
2 Years Duration of benefit once achieved
20 Years
Probability of Success 75%
TRL Development (Start – Current)
1 2 3 4 5 6 7 8 9
Project NPV (Present Benefits x Probability of Success) – Present Costs
£681.3k
Potential for achieving expected benefits
Measurement delays due to adverse weather this year have hindered the production of final reports by approximately 4-6 weeks and the project is now estimated to be complete no later than May 2011. The project is therefore in its final stage which will consist of data analysis, production of a final report and dissemination of results in the form of a national database of vegetation growth that will be shared with the project partners. Our aim is to assist the partners with integration of this database into their vegetation management systems and to thereby promote an efficient, spatially and climatically sensitive management of vegetation.

IFI Annual Report 2010/11
Page 51 of 85 SP Power Systems Limited Registered Office: 1 Atlantic Quay Glasgow G2 8SP
Registered in Scotland No. 215841 Vat No. GB 659 3720 08
Project Progress March 10
A comparison of growth rates in the first and second years after a cut showed a significant difference with values of 1.08m (±0.06 s.e.) in year 1 and 0.42 (±0.04 s.e.) in year 2. This suggests that significantly higher growth rates may be associated with more frequent cutting but the length of the project is not sufficient to allow us to assess the longer term trajectory of growth post cutting. Forecast climate data for 2020 and 2050 from the United Kingdom Climate Impact Program (UKCIP 2009) has been used to extrapolate current vegetation growth patterns captured in this project to predict future growth in these years. Initial findings indicate a potentially strong relationship between climate and vegetation growth rates and show a substantial (up to 30%) increase in growth rates by 2020 in some areas of the South and East.
Collaborative Partners
Electricity North West, Scottish and Southern Energy, Central Networks and National Grid.
R&D Providers ADAS

IFI Annual Report 2010/11
Page 52 of 85 SP Power Systems Limited Registered Office: 1 Atlantic Quay Glasgow G2 8SP
Registered in Scotland No. 215841 Vat No. GB 659 3720 08
Project Title IFI 0701 - ENA IFI Projects
Description of project
Several small value projects are under development with a number of external parties, managed on behalf of the Network Operators through the Energy Networks Association (ENA)
Expenditure for financial year
Internal £6,092 Expenditure in previous (IFI) financial years
Internal £10,424
External £52,213 External £10,396
Total £58,306 Total £20,820
Project Cost c£30,000 Projected 2011/12 costs for SP-EN
Internal £1,500
External £2,000
Total £3,500
Technological area and / or issue addressed by project
The projects listed below address real issues which have been identified by the ENA Working Groups as significant requiring technical investigation and development:
- Earthing Project - The aim is to develop new techniques to assess the impact of lower voltage earth electrodes on higher voltage ‘hot zones’ and to measure the resistance of distribution substation earth systems.
- Climate Change and Network Resilience Project - The objective of this project is to
investigate whether the electricity (both transmission and distribution) networks’ risk to weather-related faults may change in the future as a result of climate change
- Smart metering studies - ENA commissioned Engage Consulting Limited to
undertake a comprehensive analysis of Networks‟ requirements for a smart metering system for electricity and gas.
Type(s) of innovation involved
Incremental Significant Technological substitution
Radical
Yes Yes No No
Expected Benefits of Project
Earthing Project: High. The results from tests and simulations can be used to propose a recommended procedure for measuring transfer potential between HV and LV systems, suitable for inclusion in a DNO policy document. Climate Change and Network Resilience Project: The result of this project and subsequent benefits will inform Licensee's strategy with regard to IIP performance incentives which impact on Price Controls, system planning studies and operational preparedness for extreme weather events. Smart metering studies: Analysis work by Imperial College into the expectation of demand increases due to the penetration of Electric Vehicles and Heat Pumps and impact on the network and the benefits of a smart grid.
Expected Timescale to adoption
1 - 10 Years Duration of benefit once achieved
10 – 40 Years
Probability of Success
25 - 75%
TRL Development (Start – Current)
1 2 3 4 5 6 7 8 9
Project NPV (Present Benefits x Probability of Success) – Present Costs
£255,876 Note – Project costs include implementation and
have been calculated by the ENA assuming a typical distribution license area.

IFI Annual Report 2010/11
Page 53 of 85 SP Power Systems Limited Registered Office: 1 Atlantic Quay Glasgow G2 8SP
Registered in Scotland No. 215841 Vat No. GB 659 3720 08
Project Progress March 10
Earthing Project:
Further stages have been proposed into 2011 and these are currently being delivered by Strategy and Solutions Climate risk assessment on future network resilience:
The final project report and website have been produced and work is underway to use the learning from the project within the business. Smart metering studies
The outcomes from the study were used in the DNO’s (via the ENA) response to DECC on the DNO’s smart meter requirements.
Potential for achieving expected benefits
SG14 Earthing Project - High. The results from tests and simulations can be used to propose a recommended procedure for measuring transfer potential between HV and LV systems, suitable for inclusion in a DNO policy document.
Collaborative Partners
National Grid, SP Energy Networks, Scottish and Southern Energy, Electricity North West, Western Power Distribution, Central Networks, CE Electric UK and EDF Energy Networks.
R&D Providers TNEI, Engage Consulting limited, Imperial College London, Met office, EATL, Earthing Solutions, SEDG

IFI Annual Report 2010/11
Page 54 of 85 SP Power Systems Limited Registered Office: 1 Atlantic Quay Glasgow G2 8SP
Registered in Scotland No. 215841 Vat No. GB 659 3720 08
Project Title IFI 0711 - 3rd
Party ROEP Risk Assessment
Description of project
The development of the so-called ‘Stage I’ for risk assessment of earthing systems, using a new concept of safety limit curves, where standard fault clearance times are used, was achieved under National Grid research project NSETS180 in collaboration with Scottish Power, and was completed in Autumn 2006. The Stage I risk assessment enables broad classification of substations into low/high risk categories for Rise of Earth Potential (ROEP). The theoretical studies to develop a Stage II probabilistic-based risk assessment, which includes the use of historical operational clearance times, are now under development at Cardiff University. In this project, it is proposed to conduct pilot studies, which allow initial implementation of the developed ‘Stage I’ technique at identified key National Grid substations (4 to 5 sites). This will allow a refined quantification of risk in relation to the ALARP levels. In addition, a user-friendly procedure will be developed to allow easy and quick assessment of sites. The ultimate purpose of the research is to provide better information to engineers making decisions on investment for earthing reinforcement schemes.
Expenditure for financial year
Internal £ 13,079 Expenditure in previous (IFI) financial years
Internal £ 16,939
External £ 51,700 External £ 37,190
Total £ 64,780 Total £ 54,129
Total Project Costs £100,000 Projected 2011/12 costs for SPEN
Internal £ 0
External £ 0
Total £ 0
Technological area and / or issue addressed by project
This software package will allow SPEN to assess current sites to determine whether or not there is a touch/step issues within the substation and a danger of third party exposure to ROEP.
Type(s) of innovation involved
Incremental
Project Benefits Rating
Project Residual Risk
Overall Project Score
7 -3 10
Expected Benefits of Project
There are many sites in Scotland and Manweb where the existing sites do not have earthing that has been installed to the current standard. System fault levels have been increasing due to the significant amounts of renewable generation that has been connected (with bigger schemes in the construction and planning stages). If current system fault levels are applied to these sites there is a potential that the touch/step voltage levels will be too high to allow work to commence without further costly mitigation measure being implemented. This tool would allow an assessment to be made of what the probability would be of a life-threatening fault appearing at the substation so that the appropriate corrective action can be taken. The user friendly interface package will allow SPEN staff to carry out assessments of earthing systems using statistical fault levels and clearance times values as opposed to worst case. By being better equipped to assess the potential risk posed by existing substation earthing arrangements appropriate steps can be taken, which could be the avoidance of unnecessary expenditure on inappropriate mitigation measures. The software analysis will help to justify Third party mitigation measures.

IFI Annual Report 2010/11
Page 55 of 85 SP Power Systems Limited Registered Office: 1 Atlantic Quay Glasgow G2 8SP
Registered in Scotland No. 215841 Vat No. GB 659 3720 08
Expected Timescale to adoption
1 Year Duration of benefit once
achieved 4 Years
Probability of Success
75% Project NPV = (PV
Benefits – PV Costs) x Probability of Success
£ 15,562
Potential for achieving expected benefits
Potential – The project is progressing to a next stage where the following items will incorporated into the software:
Set up of fault clearance time database
Calculate variation in fault current magnitude and its effect on prediction of individual risk
Apply extended computer procedure to several case
Project Progress March 2011
This project is now complete with the software being used by our design engineers for Transmission Substation design.
Collaborative Partners
National Grid
R&D Provider Cardiff University High Voltage Energy Systems research group (Manu Haddad & Huw Griffith).

IFI Annual Report 2010/11
Page 56 of 85 SP Power Systems Limited Registered Office: 1 Atlantic Quay Glasgow G2 8SP
Registered in Scotland No. 215841 Vat No. GB 659 3720 08
Project Title IFI 0712 - BT 21st
Century Protection Solutions (BT21CN)
Description of project
The change of BT’s network to an IP based system (BT21CN) is posing some significant risks to the performance reliability of the SP-M and SP-D electricity networks. In particular SP-M relies heavily on 3
rd Party leased services from BT as the communications for the 33kV
network protection in rural areas. The strategy to mitigate the problem has been developed based on the utilisation of a range of communications solutions (fibre, radio, power line carrier in addition to technically/commercially suitable BT services) in a coordinated manner. Whilst this strategy has been agreed in principle, there are several technical challenges associated with several of the solutions. This project aims to provide the detailed and engineered communications channels that underpin the toolbox of solutions to mitigate the problems associated with BT21CN.
Expenditure for financial year
Internal £16,860 Expenditure in previous (IFI) financial years
Internal £ 49,394
External £100,898 External £ 96,826
Total £ 117,758 Total £ 146,220
Total Project Costs £114,000 Projected 2011/12 costs for SPEN
Internal £ 5,000
External £ 20,000
Total £ 25,000
Technological area and / or issue addressed by project
This project aims to access the feasibility of using alternative communications solutions to mitigate the problems associated with BT21CN. Scope currently under consideration includes:
Power Line Carrier deployment at 33kV combining protection and SCADA signalling
Small development works to facilitate intra-substation communications
IP based protection signalling mediums and associated security implications
Options for alternative communication channels for shared services
Implications for the network in no cost effective solutions are realised
Type(s) of innovation involved
Significant / Technology Transfer
Project Benefits Rating
Project Residual Risk Overall Project Score
21 2 19

IFI Annual Report 2010/11
Page 57 of 85 SP Power Systems Limited Registered Office: 1 Atlantic Quay Glasgow G2 8SP
Registered in Scotland No. 215841 Vat No. GB 659 3720 08
Expected Benefits of Project
There are many sites in SP-M where there is no Line-of-Site for radio communications and fibre installations are extremely expensive due to excessive circuit lengths. In such sites Power Line Carrier (PLC) or Leased services are the only feasible communication mediums for protection signalling. PLC is typically deployed at higher voltage levels, additionally some development work facilitated in a trial would be required to accommodate protection and SCADA data on the same link however this could deliver a more cost effective alternative to fibre or BT SDH leased services. Power Line Carrier although a viable solution has some limitations, which restrict its use on the network, mainly mid-circuit transitions (OHL – Cable), which cause the signals to reflect. Where PLC cannot be deployed alternative will require consideration. Leased services (or no communications at all) are the only alternatives to expensive infrastructure at some sites. SDH services can be expensive in terms or both CAPEX and OPEX. BT are likely to offer IP based products in the future (products not currently used with protection). If development is carried out to facilitate the use of IP based products for signalling purposes factoring in security considerations then it may be possible to leases services at significantly reduced CAPEX and OPEX costs.
Expected Timescale to adoption
1.5 Year Duration of benefit once achieved
15 Years
Probability of Success
50%
TRL Development (Start – Current)
1 2 3 4 5 6 7 8 9
Project NPV (Present Benefits x Probability of Success) – Present Costs £951,763
Potential for achieving expected benefits
In areas of the network where protection signalling cannot be delivered via channels currently considered for use with protection devices without significant expense, leased communications are the only option. Should a suitable leased or alternative communication bearer be unavailable then significant investments in fibre optic installation will be required.
Project Progress March 2011
In accordance with the output from the Desktop and Line-of-Sight Surveys, Airwave has provided the Teleprotection circuit between substation sites located at Kilbirnie and Stewarton. The circuits have been provided by dedicated multiplexed channels offering a bandwidth of 64Kbps. The circuit has been designed such that the expected latency should be not greater than 30 milliseconds. At each end of the circuit, a radio link will be provided over narrow band 1.4GHz radio links from the SPEN’s premises to the most suitable Airwave Base Station, and thenceforth across the Airwave network to the other substation site.
Collaborative Partners
N/A
R&D Provider RFL / C & W / Radius / Tait / others TBC, AIRWAVE

IFI Annual Report 2010/11
Page 58 of 85 SP Power Systems Limited Registered Office: 1 Atlantic Quay Glasgow G2 8SP
Registered in Scotland No. 215841 Vat No. GB 659 3720 08
Project Title IFI 0713 - Wide Area Monitoring, Protection & Control (WAMPAC)
Description of project
Market driven grid management has increased the number of renewable/distributed generation sources, introduced complexities to address reactive support and progressively stress transmission networks. This has increased the complexity of operation, monitoring, control and protection of large interconnected electric power systems considerably. The penetration of renewable generation is increasing and there are targets set for connection of future renewable sources. At the same time the Transmission Owner (TO) is faced with an increasing need for construction outages to deliver network reinforcement and existing asset replacement which will result in reduced circuit availability. These factors will lead to much less predictable operating scenarios and therefore greater dependence on real-time support tools to observe and manage the condition of the network. The increase in this uncertainty could result in transmission instability in the near future, however Wide Area Measurement Systems (WAMS) employing SynchroPhasor Measurement Units (PMUs) are becoming increasingly deployed world wide as a cost effective commercially available technology. A trial using the Psymetrix Phasorpoint Monitoring System will be installed to gather data from up to 15 sites with PMU capability. This will involve the installation of Psymetrix software on a server that will connect to the PMU's and recover in real time phasor data. This data will be stored for post transient evaluation so that system performance can be analysed and determine the frequency modes present in the network. A WEB interface will be installed at the Operational Control Centre (OCC), Cambuslang and Bellshill to evaluate the real time delivery of the data and visualise the system performance in real time and post event.
Expenditure for financial year
Internal £ 12,560 Expenditure in previous (IFI) financial years
Internal £ 3,977
External £ 1,700 External £ 3,360
Total £ 14,260 Total £ 7,337
Total Project Costs
£ 59,715 Projected 2011/12 costs for SPEN
Internal £8,000
External £ 75,000
Total £ 83,000
Technological area and / or issue addressed by project
SPT is obliged under its licence and the Electricity Act to develop an efficient, co-ordinated and economic system of electricity supply. Power-grid congestion issues and disturbances worldwide have emphasized the need to enhance power grids with smart applications (SmartGrids, Flexnet, and Intelligrid), providing decision support to operators and automation to ensure optimum use of assets, whilst maintaining system security and plant and circuit thermal limits. This work will support the development of next generation data and communications infrastructures for smart applications.
Type(s) of innovation involved
Incremental
Project Benefits Rating
Project Residual Risk Overall Project Score
13 -9 22

IFI Annual Report 2010/11
Page 59 of 85 SP Power Systems Limited Registered Office: 1 Atlantic Quay Glasgow G2 8SP
Registered in Scotland No. 215841 Vat No. GB 659 3720 08
Expected Benefits of Project
As a safety net for the management in future uncertainties in system stability particularly on the England-Scotland interface. This is achieved by better understanding of the current capability and stability of the GB and Irish transmission networks, considering constraints, intermittent generation and changing generation and demand patterns.
Knowledge of the current network conditions will allow future development of smart protection, control and automation applications and will ensure the network is ready and able to accommodate new generation in line with SmartGrid and Intelligrid initiatives.
The successful application of Wide Area Monitoring is seen to be a major factor in managing the risks and opportunities and to facilitate the connection of renewable and intermittent generation.
A better understanding of system conditions and margins will enable better use of available network capacity and constraints and ensure that plant operates safely within its capability and design limits
This project has the potential to create a cost effective method of predicting and identifying a very high impact, low probability event and contributes to better informed asset management.
The project will support the system reinforcement programme, ensure better use of existing assets and provide an alternative to Operational Tripping and Remedial Action schemes, which are required to manage thermal and stability constraints.
Expected Timescale to adoption
4 Years Duration of benefit once achieved
10 Years
Probability of Success
75%
TRL Development (Start – Current)
1 2 3 4 5 6 7 8 9
Project NPV (Present Benefits x Probability of Success) – Present Costs
No NPV calculated for this limited trial
Project Progress March 2011
The trial using the Psymetrix Phasorpoint Monitoring System has started and has been installed to gather data from up to 15 sites with PMU capability. This involved the installation of Psymetrix software on a server that connects to the PMU's and recovers real time phasor data. This data is being stored for post transient evaluation so that system performance can be analysed to determine the frequency modes present in the network. A WEB interface has also been installed at the Operational Control Centre (OCC), Cambuslang and Bellshill with a view to evaluate the real time delivery of the data and to visualise the system performance in real time and post event. We have built on our existing WAMPAC project to introduce new testing and synchronisation technologies to ensure the data is collated and utilised in an accurate and efficient manner hence facilitating future developments such as HVDC and series compensation.
Potential for achieving expected benefits
While existing network development and management is well developed, increasing operating uncertainties due to increasing renewable penetration will lead to a greater dependence on real-time support tools.
Collaborative Partners
National Grid, Scottish Power, Scottish and Southern Electricity, Northern Ireland Electricity and ESBI (Ireland).
R&D Provider University of Manchester Areva, Siemens and ABB who will supply and install the phasor measurement units.

IFI Annual Report 2010/11
Page 60 of 85 SP Power Systems Limited Registered Office: 1 Atlantic Quay Glasgow G2 8SP
Registered in Scotland No. 215841 Vat No. GB 659 3720 08
Project Title IFI 0801 - IEC 61850 Application in SP - Transmission
Description of project
The key objective of this project is to maximise economic and effective utilisation of the transmission asset and network. The deployment of the technology advocated for this IFI project will allow ongoing substation secondary equipment retrofitting (refurbishment) projects to proceed whilst limiting the duration and frequency of circuit outages, required to facilitate the work.
Expenditure for financial year
Internal £9,348 Expenditure in previous (IFI)
financial years
Internal £15,589
External £27,938 External £37,333
Total £37,287 Total £52,922
Total Project Costs £455,000 Projected 2011/12
costs for SPEN
Internal £15,000
External £80,000
Total £95,000
Technological area and / or issue addressed by project
Project 1 (IFI 0801-1) – Microsol This proposal is twofold, to develop, test and commission the IEC Protocol on the Microsol RTU to allow us to trial interfacing to two specific devices at two specific locations, namely: a) Busby 275kV Hathaway Fault Recorder. b) Strathaven 400kV Operational Intertripping Relay. At Busby 275kV we propose to recover all the Analogue information from the fault recorder, this will allow us not only to present more information to the Control Engineers in real time, it will eliminate any issues with faulty transducers, faulty resistor scaling and faulty wiring. Project 2 (IFI 0801-2) - University of Manchester and NGC This IFI application aims to investigate, quantify and optimise the level of security, dependability and speed in secondary schemes using IEC 61850. This project is strategically aligned with Iberdrola Networks and will provide procurement benefits. Project3 (IFI 081-3) – “Hardfibre” Process Bus Field Trial & RTDS Testing GE Multilin are first to market with IEC61850-9-2 products and the proposal is to undertake a field trial at the new Inverarnan 275kV substation and to perform RTDS testing of the scheme. This will achieve the following objectives: Proof that the protection performance of a process bus system is at least equal to conventional schemes To gain experience of the installation, configuration and operation of a process bus system. To measure the time and cost benefits of process bus.
Type(s) of innovation involved
e.g. Incremental Tech Transfer Significant Radical
Project Benefits Rating
Project Residual Risk
Overall Project Score
17 -7 24

IFI Annual Report 2010/11
Page 61 of 85 SP Power Systems Limited Registered Office: 1 Atlantic Quay Glasgow G2 8SP
Registered in Scotland No. 215841 Vat No. GB 659 3720 08
Expected Benefits of Project
In summary, if this protocol is developed, implemented and tested and commissioned successfully on our Microsol RTU then it gives us some real flexibility for the future and will fundamentally influence decisions regarding substation design and choice of relay manufacturer, and will have the added advantage of allowing us to cease the highly expensive option of flood wiring with multi-core copper cables within the substation environment and adopting a LAN approach to comms and data capture. However, IEC61850 also offers benefits in the protection realm. The use of GOOSE services has been demonstrated (in the West Coast operational Intertrip scheme) to provide significant performance benefits over hard-wiring and significantly reduced installation and testing times as much of the scheme functionality can be factory tested. Additionally, part 9-2 permits the use of a process bus which can, in addition to reduced wiring, provide additional reliability and the future promise of outage-free protection replacement.
Expected Timescale to adoption
1 Year Duration of benefit once
achieved 10 Years
Probability of Success
75%
TRL Development (Start – Current)
1 2 3 4 5 6 7 8 9
Project NPV (Present Benefits x Probability of Success) – Present Costs
No NPV calculated for this limited trial
Potential for achieving expected benefits
This project is on track
Project Progress March 2011
Project 1 and 3 are now closed and have proven to be successful. There is still some work to be carried out to fully integrate within SPENs networks
Collaborative Partners
Project 1 and 3 none, Project 2 Manchester University, SSE, NGC
R&D Provider Manchester University

IFI Annual Report 2010/11
Page 62 of 85 SP Power Systems Limited Registered Office: 1 Atlantic Quay Glasgow G2 8SP
Registered in Scotland No. 215841 Vat No. GB 659 3720 08
Project Title IFI 1001 – Offline Planning Tool for Dynamic Thermal Rating
Description of project
The dynamic thermal rating (DTR) concept is based on the observation that the first limit for the current carrying capacity of a circuit is its temperature, influenced by its ability to dissipate to the environment the heat produced by the joule effect, and by external conditions such as ambient temperature, or wind speed, which are constantly varying. Even though the mechanisms of heat exchange involved are well understood, determination of the correct value of the circuit temperature is non-trivial. For this reason, static ratings based on the worst case scenario are often used.
Expenditure for financial year
Internal £6,092 Expenditure in previous (IFI) financial years
Internal £-
External £11,700 External £-
Total £17,793 Total £-
Project Cost £121,500 Projected 11/12 costs for SPEN
Internal £3,000
External £10,000
Total £13,000
Technological area and / or issue addressed by project
The implementation of a DTR system in an electrical network could potentially increases its average rating whilst also reducing, the risk of component thermal overload. However, successful implementation requires a number of challenges to be overcome. Not least the measurement, estimation and communication of real time component temperatures and prevailing weather conditions over a wide geographical area containing a significant number of power system components distributed around a complex terrain. A successful DTR system could be used as a decision support tool for Distribution Network Operators (DNO). This tool could be used both at the planning stage and in real time within potential future active network management philosophies in order to safely increase the utilization of power systems and facilitate distributed generation (DG).
Type(s) of innovation involved
Incremental Significant Technological substitution
Radical
No No Yes No
Expected Benefits of Project
Durham University are already working with Scottish Power and Astrium on a TSB project to investigate the use of DTRs for electrical distribution networks in order to accommodate increased levels of DG safely and cost effectively. The aim of this phase of the work is to carry out further research and development work to build upon the achievements so far, ensure continuity and to avoid the loss of vital knowledge gained by the PhD researchers. The primary deliverable will be an offline tool to: 1. Allow SP planning engineers to evaluate the likely headroom which could be
exploited through the adoption of DTR systems over a wide range of existing SP
distribution networks.
2. Make use of historical power flow and meteorological data as well as terrain and
vegetation information.
3. Estimate the ratings of overhead lines, underground cables and transformers over
a wide area of distribution network and present these estimates in the form of a
probability distribution function. (In this document ‘Distribution Network’ refers
to networks with voltages up to and including 132kV)
4. Carry out thermal estimates for a wide range of types and configurations of
overhead lines, underground cables and power transformers.
5. Allow calculations to be made regarding the potential additional energy that
could be accommodated by the power system when dynamic ratings are
adopted.

IFI Annual Report 2010/11
Page 63 of 85 SP Power Systems Limited Registered Office: 1 Atlantic Quay Glasgow G2 8SP
Registered in Scotland No. 215841 Vat No. GB 659 3720 08
Expected Timescale to adoption
4 Years Duration of benefit once achieved
10 Years
Probability of Success Projects with various
probabilities of success will be considered
TRL Development (Start – Current)
1 2 3 4 5 6 7 8 9
Project NPV (Present Benefits x Probability of Success) – Present Costs
£58,587
Project Progress March 11
Significant work has been carried out on modelling weather patterns and terrain topology. Preliminary results demonstrate some of the effects terrain features have on wind flow, such as flow reversals and acceleration, which are not considered by the simple interpolation methods used in existing Real Time Rating schemes.
Potential for achieving expected benefits
Having an offline planning tool for analysing the dynamic ratings of circuits will enhance our ability in understanding the impact of utilising these technique in real time and power flow analysis. The tool will assist in the analyses and management of constraints in the network and also support design engineers to make informed decisions with regards to enhanced dynamic rating for circuits and their impact on the network, power flow and constrains on embedded generation.
Collaborative Partners
Astrium, Durham University
R&D Providers Durham University

IFI Annual Report 2010/11
Page 64 of 85 SP Power Systems Limited Registered Office: 1 Atlantic Quay Glasgow G2 8SP
Registered in Scotland No. 215841 Vat No. GB 659 3720 08
Project Title IFI 1002 - Supergen HiDEF
Description of project
The Highly Distributed Power Systems Consortium have developed plans for renewal that will demonstrate a radical vision of a highly distributed energy future that enables all end users to participate in system operation and real time energy markets and thereby more fully exploits the potential of distributed generation and active load resources to deliver a more sustainable and resilient provision of energy for the future
Expenditure for financial year
Internal £6,092 Expenditure in previous (IFI) financial years
Internal £-
External £15,380 External £-
Total £21,472 Total £-
Project Cost £4,492,000 Projected 11/12 costs for SPEN
Internal £3,000
External £20,000
Total £23,000
Technological area and / or issue addressed by project
This Highly Distributed Energy Future (HiDEF) programme researches the essential elements of a decentralised system that could be implemented over the period 2025 & 2050, but at the same time has been structured to support the evidence base relating to key questions of current concern within the stakeholder community and in this way its relevance extends beyond the limits of its decentralised system vision. In concept, the research vision is one of decentralised resources, control and market participation extending to include end users at system extremities.
Type(s) of innovation involved
Incremental Significant Technological substitution
Radical
Yes No No No
Expected Benefits of Project
The project has a strong academic and industrial representation and will strengthen SPEN’s engagement into the future of network systems and the influences of developments across the supply chain. In general the benefits will entail:
The engagement with academia and industry into the understanding of the impact of a future decentralised system.
The impact of a decentralised system on networks infrastructure, operation and control.
The impact of a decentralised system on regulatory and commercial frameworks.
Expected Timescale to Adoption
9 years Duration of benefit once achieved
7 years
Probability of Success 25%
TRL Development (Start – Current)
1 2 3 4 5 6 7 8 9
Project NPV (Present Benefits x Probability of Success) – Present Costs
£78,648
Project Progress March 2011
PV Penetration study – a study and working tool has been developed to enable planners to quickly assess the impact of connecting small scale PV in housing estates in the Manweb area.

IFI Annual Report 2010/11
Page 65 of 85 SP Power Systems Limited Registered Office: 1 Atlantic Quay Glasgow G2 8SP
Registered in Scotland No. 215841 Vat No. GB 659 3720 08
Potential for achieving expected benefits
SP Distribution and SP Manweb networks, and to some extent SP Transmission will benefit from the insight into a power network well into the future and the challenges that it might bring. It is envisaged that this applied research project will be useful for future Price Control discussions, particularly in the areas of smart applications, regulatory and commercial structures. The project is academic in nature but at the same time taking into consideration current developments in areas such as smart meters, demand side management and micro generation among many others. Project Addition To understand the impact of PV better, Strathclyde University have agreed to carry out LV studies using a PV site on Anglesey, North Wales. Part of this project will involve the purchase of power quality monitoring devices that will be installed on site to give SPEN and UoS a better picture of the local network.
Collaborative Partners
EDF, Areva, Rolls Royce and many other SMEs
R&D Providers University of Strathclyde (Lead), Imperial College, Oxford University, Cardiff University, University of Bath

IFI Annual Report 2010/11
Page 66 of 85 SP Power Systems Limited Registered Office: 1 Atlantic Quay Glasgow G2 8SP
Registered in Scotland No. 215841 Vat No. GB 659 3720 08
Project Title IFI 1003 - Strategic Asset Lifecycle Value Optimisation "SALVO"
Description of project
It is estimated that there is £200bn of identified investment requirements in UK core infrastructure during the next 10-20 years and that evidence suggests up to 30% of total asset life cycle costs could be avoided by better decision making. SALVO aims to develop simple, flexible and practical guidance and tools for determining what to spend and when. A consortium of "Core Participants" is currently being set up to progress the project which will have workstreams in the "start of life", "utilisation and maintenance" and "managing aging assets" phases of the asset life cycle. SP EnergyNetworks is joining the project as an "Associate". This will allow SP EnergyNetworks early sight of the outputs of the project and an opportunity to influence them. The cost of this project membership is £5k. It is anticipated that the project will provide spin off to SP EnergyNetworks in improving the optimisation of spend and managing the lifecycle of the assets through the tools developed by the project consortium. The project duration is 3 years.
Expenditure for financial year
Internal £11,302 Expenditure in previous (IFI) financial years
Internal £-
External £6,700 External £-
Total £18,002 Total £-
Project Cost (Collaborative + external + SPEN)
£960,000 Projected 11/12 costs for SPEN
Internal £20,000
External £0
Total £20,000
Technological area and / or issue addressed by project
The project aims to provide integrated solutions to determining what is worth spending and when according to optimal whole life cycle criteria:- - asset population health/ criticality definitions and diagnosis - specific asset's degradation and risk characteristics - individual intervention justifications (inspection, maintenance, modification,
renewal) - collectively optimised, total system performance and work programme budgets
and resources The project will particularly aim at providing integrated solutions across the asset life cycle and will provide a particular focus in the management of aging assets area.
Type(s) of innovation involved
Incremental Significant Technological substitution
Radical
No Yes No No
Expected Benefits of Project
Collate existing best practice processes and available tools
Identify the realistic range of scenarios, options, decision types, data, information and assumption requirements, cost/risk/benefit evaluations and calculations, results interpretation, decision making and conclusions and implementation processes
Develop a series of decision templates
Update and integrate suitable decision support tools for the cost/benefit/risk quantification and optimisation steps, including generic interface design for different data sources and facilities for export of results into work planning and management systems
Develop and publish a series of worked case studies of the application of these processes and tools

IFI Annual Report 2010/11
Page 67 of 85 SP Power Systems Limited Registered Office: 1 Atlantic Quay Glasgow G2 8SP
Registered in Scotland No. 215841 Vat No. GB 659 3720 08
Expected Timescale to Adoption
3 years Duration of benefit once achieved
7 years
Probability of Success 75%
TRL Development (Start – Current)
1 2 3 4 5 6 7 8 9
Project NPV (Present Benefits x Probability of Success) – Present Costs
Difficult to determine at this stage of the project
Project Progress March 10
SPEN is joining the project as an associate member and hence will have access to new techniques and improved methodologies for asset management. However, access to emerging tools and licences for developed software is likely to require further expenditure in the future if SPEN requires to implement these tools. This will be subject to appraisal at a later date when tools become available.
Potential for achieving expected benefits
Improvement in the management of asset base is likely to lead to a reduction in risks of plant and equipment failure and increase safety for staff and members of the public.
Collaborative Partners
Core Sponsors: National Grid, ScottishWater, London Underground, Cambridge University Associates: SASOL, Forbo Nairn, Gatwick Airport
R&D Providers The Woodhouse Partnership and Decision Support Tools

IFI Annual Report 2010/11
Page 68 of 85 SP Power Systems Limited Registered Office: 1 Atlantic Quay Glasgow G2 8SP
Registered in Scotland No. 215841 Vat No. GB 659 3720 08
Project Title IFI 1005 - GIS Impedance Mapping - zMap
Description of project
Carrying on from the work that was completed in IFI project – IFI 0709 Network Monitor using Web Systems, it is proposed to utilise the voltage and current values obtained from sub.net and PQR during faults and feed them into GeoField, SPEN's GIS mapping software.
Expenditure for financial year
Internal £11,302 Expenditure in previous (IFI) financial years
Internal £-
External £6,700 External £-
Total £18,002 Total £-
Project Cost £130,520 Projected 2011/12 costs for SPEN
Internal £10,000
External £29,870
Total £39,870
Technological area and / or issue addressed by project
The laborious process of tracing a circuit length will be obsolete with the GIS platform that we currently use able to trace via impedance based on a table of impedance values per cable type. Currently SP have roughly 200 PQR that are able to record faults, but these units are only polled once a day or on an ad hoc basis. This project will enable fault information to be emailed to a user or iHost which can then deduce and impedance value. As the new ENMAC is currently some time away its imperative that a frontend for new IFI projects and current IFI projects is developed to ease the transition into SPENs SCADA network.
Type(s) of innovation involved
Incremental Significant Technological substitution
Radical
No Yes No No
Expected Benefits of Project
The existing GeoField Network Map Viewer tracing engine will be configured to allow tracing from a start point to a specified accumulated impedance value. This will behave in an identical fashion to the existing length-based trace.
Integration to implement a scheme for SP Power Systems to allow PQRs to trigger autocomms for retrieval of fault records using email. This is required because SP current IT policies do not allow modems to answer incoming calls and the only way to retrieve data from recorders is to use autopoll, automatic or manual.
Expected Timescale to Adoption
2 years Duration of benefit once achieved
10 years
Probability of Success 50%
TRL Development (Start – Current)
1 2 3 4 5 6 7 8 9
Project NPV (Present Benefits x Probability of Success) – Present Costs
£151,554
Project Progress March 2011
This project is developing well and already faults are being accurately traced and located in real-time. There is some work remaining to full integrate the developed software into the control system, but once this has been achieved it is predicted that the

IFI Annual Report 2010/11
Page 69 of 85 SP Power Systems Limited Registered Office: 1 Atlantic Quay Glasgow G2 8SP
Registered in Scotland No. 215841 Vat No. GB 659 3720 08
Potential for achieving expected benefits
Scottish Power own and operate 30 substation disturbance recorders from Embedded Monitoring Systems (EMS) known as a sub.net device. Currently information can be retrieved from the sub.net device either by using an inbuilt web interface, or by receiving e-mails sent by the device in response to events occurring on its monitored inputs. By using the data from the 30 disturbance monitors we will be able to get a good idea of the potential.
Collaborative Partners
None
R&D Providers Sigma7

IFI Annual Report 2010/11
Page 70 of 85 SP Power Systems Limited Registered Office: 1 Atlantic Quay Glasgow G2 8SP
Registered in Scotland No. 215841 Vat No. GB 659 3720 08
Project Title IFI 1007 – Outram Fault Level Monitor
Description of project
The aim of this project is to development of a portable instrument that can successfully measure fault level on a distribution network with repeatability and reliability. The developed instruments will be deployed in at various locations where there is uncertainty in fault level in Low Voltage, 11kV, 33kV and 132kV groups on the network.
Expenditure for financial year
Internal £1,849 Expenditure in previous (IFI) financial years
Internal £0
External £99,235 External £0
Total £101,084 Total £0
Project Cost £121,196 Projected 2011/12 costs for SPEN
Internal £7,500
External £15,000
Total £22,500
Technological area and / or issue addressed by project
It is proposed that the instrument could provide a viable alternative for fault level assessment to extensive modelling or at locations where upstream and downstream fault level can vary drastically over a period of time making traditional fault level analysis complex.
Type(s) of innovation involved
Incremental Significant Technological substitution
Radical
Yes No No No
Expected Benefits of Project
Accurate fault level profiles for 132kV, 33kV and 11kV distribution sites, showing both downstream and upstream contributions.
The identification and remedy of fault level conditions previously unidentified.
The release of network capacity previously unavailable due to perceived the fault level.
The deferment of investment on healthy equipment / network based on perceived fault level issues.
Validation and improvement of existing network models.
Expected Timescale to adoption
<2 Years Duration of benefit once achieved
10 Years
Probability of Success 75%
TRL Development (Start – Current)
1 2 3 4 5 6 7 8 9
Project NPV (Present Benefits x Probability of Success) – Present Costs
£188,953

IFI Annual Report 2010/11
Page 71 of 85 SP Power Systems Limited Registered Office: 1 Atlantic Quay Glasgow G2 8SP
Registered in Scotland No. 215841 Vat No. GB 659 3720 08
Project Progress March 2011
Outram Researched Ltd has provided SPEN with a test bed demonstration of a single phase fault level monitor (FLM) based on the PM7000 power quality monitor platform.
Subsequently a 3-phase version has been developed by Outram incorporating additional requirements / features requested by SPEN based on DNO requirements.
SPEN are currently trialling x6 FLM units on the network to refine the FLM algorithm and firmware and assess the instruments capabilities.
The preliminary results from site are very encouraging and indicate that the FLM is capable of producing results that are close to those generated by trusted network models.
Over the next 12 months it is expected that the FLM firmware will go through several rounds of refinement, a user guide and intuitive front end will be developed and the instrument performance will be certified by a recognised test facility.
Potential for achieving expected benefits
As indicated above the FLM is showing early promise of delivering accurate measurements based upon network disturbances as desired. As the device approaches maturity attention must be placed on identifying how the device should be utilised to deliver the desired benefits.
Collaborative Partners
Outram Research Ltd
R&D Providers Outram Research Ltd

IFI Annual Report 2010/11
Page 72 of 85 SP Power Systems Limited Registered Office: 1 Atlantic Quay Glasgow G2 8SP
Registered in Scotland No. 215841 Vat No. GB 659 3720 08
Project Title IFI 0401 – STP 2 Overhead Lines
Description of project
A DNO research & development collaboration hosted by EA Technology
Expenditure for financial year
Internal £9,884 Expenditure in previous
(IFI) financial years
Internal £33,294
External £47,425 External £227,603
Total £57,309 Total £260,897
Project Cost £329,000 Projected 10/11 costs for
SPEN
Internal £10,000
External £48,410
Total £58,410
Technological area and / or issue addressed by project
The Module 2 programme for budget year 2010/11 aimed to optimise overhead network design, improve operational performance, maximise potential benefits, improve financial performance, and minimise risk associated with overhead networks, whilst having due regard for the environment and energy efficiency. The programme also aimed to deliver continuous improvement in terms of safety and environmental performance of the overhead network to meet the individual business requirements of Member Companies. Several of the projects contribute to the industry’s knowledge of variation in climate change. Projects Funded in 2010/2011: Completed at the end of March 2011:- S2164_1: Development of a probabilistic wind and ice map for UK – Project strategy & related interfaces (10/11); S2168_1: A spreadsheet to calculate conductor temperature (OHTEMP) (10/11). Projects Funded in 2010/2011: In Progress at the end of March 11:- S2126_6: Monitoring conductor temperature – Stage 6: Monitoring two-current rig at Q'ferry (10/11); S2160_2: Impedance testing of new and old poles – Test 9 more new poles (10/11); S2160_2AF: Impedance Tests on Wood Poles: Additional funding for penetration tests (10/11); S2160_2AF2: Impedance Tests on Wood Poles: Penetration tests Further additional funding for additional work(10/11); S2160_3: Impedance testing of new and old poles – Risk Assessment (10/11); S2161_2: Site testing of load-lock anchors – Testing Members' installations (10/11); S2162_1: Measure residual strength of ageing wood poles – 1st batch of 30 poles (10/11); S2164_2: A probabilistic wind and ice map for UK – Analyse model performances and develop procedures (10/11); S2169_1: Downwind effects of wind turbine at wood-pole height (10/11); S2171_1: Wedge clamps comparative tests (10/11); S2172_1: Evaluating Winter 2009/10 icing events at Deadwater Fell (10/11).
Type(s) of innovation involved
e.g. Incremental, Tech Transfer, Significant, Radical
Project Benefits Rating
Project Residual Risk Overall Project Score
16 9 25

IFI Annual Report 2010/11
Page 73 of 85 SP Power Systems Limited Registered Office: 1 Atlantic Quay Glasgow G2 8SP
Registered in Scotland No. 215841 Vat No. GB 659 3720 08
Expected Benefits of Project
Projects in this Module will significantly increase the performance and reliability of the network. In certain cases the asset life may also be extended. If these projects are technically successful and the findings and recommendations from the projects are implemented, then the projects will potentially enable each Member DNO to gain benefits including: Improvements in network reliability by identifying root causes of faults and developing solutions; Safe early detection of potential defects that can then be repaired in a planned and timely fashion; Cost effective and early identification of damaged insulators and discharging components, which if not addressed would result in faults; Development of tools, technology and techniques to reduce risk or cost, or to increase speed of capital deployment of Member Company programme delivery; A better understanding how overhead line assets perform in service which can be used to determine the overall asset management policy ; Reduce levels of premature failure of assets; Avoid redesign, reconstruction or refurbishment of overhead lines where this is driven by a perceived need to increase ratings or strengthen lines, and is required to conform with existing standards but which may be unnecessary; Co-operation between European countries in the development of forecasting methods of atmospheric icing and for the exchange of forecasting tools; Comparison of new covered conductor with known performance of older types; Increasing scientific understanding of processes and climatic conditions leading to icing; Extend the service life of poles and reduce potential levels of failures; Reduce lifetime costs by the appropriate use of alternative materials; Improved methodology for determining conductor ratings will provide greater confidence; Positive impact on environmental performance and many have positive impacts on safety; Give Members a better understanding of novel conductors for new-build or re-conductoring lines that gives lower capital cost, minimum visual impact, and environmental acceptance.
Expected Timescale to adoption
Range 1-5 years - dependent on project
Duration of benefit once achieved
Range 3-5 years -dependent on project
Probability of Success
Range 49-95% - dependent on project
Project NPV = (PV Benefits – PV Costs) x Probability of Success
£42,652
Potential for achieving expected benefits
There are a huge variety of projects within the 2010/11 work programme for Module 2. A number of these projects are scientific based and will require further research and development to achieve improvements in operational performance and integration into the Network Operators business environment. Projects in these areas are mainly stages of much larger multi-stage projects and require further work to optimise network design, financial and operational performance from which the customer and stakeholders will benefit Other projects were looking at better ways of improving the operational performance, management and reliability of Overhead Networks, by minimising the impact on the environment and the safety of both the operators and the public, in a manner that could be implemented straight away. Collectively, the 10/11 work programme demonstrates the development of innovative products, processes and techniques that improve the management of Overhead Networks; in terms of safety, design, environment, reliability, security and power quality. STP has also delivered a number of notable innovations since its inception.

IFI Annual Report 2010/11
Page 74 of 85 SP Power Systems Limited Registered Office: 1 Atlantic Quay Glasgow G2 8SP
Registered in Scotland No. 215841 Vat No. GB 659 3720 08
Project Progress to March 11
Only a small number of projects or project stages, started in the Module during 10/11, have been completed, this is mainly due to the fact that the majority of projects are connected to the Pole Impedance project; others require a significant amount of testing, and data capturing which span more than one year. However, the outputs of the single stage projects that have already identified potential benefits and opportunities for further innovative technical development work. A small selection of these are provided below: S2168_1: OHTEMP is a spreadsheet tool that calculates conductor temperature for a conductor that is carrying a specified current under specified ambient conditions; OHTEMP is completely deterministic: it simply calculates conductor temperature for a given current. Thus there is no need to invoke any probabilistic conversion factors to translate calculated current at design conditions into exceedence-based ratings S2164_1; The final outcome of this work is to develop new wind/ice loads which are expected to be less onerous than those predicted by BS 8100 and further can be used to update BS EN 50341 and BS EN 50423 standards.
Project Progress to March 11
Only a small number of projects or project stages started in the Module during 10/11 have been completed, since the majority are multi-stage projects that span more than one year.
Collaborative Partners
Other DNOs
R&D Providers EA Technology

IFI Annual Report 2010/11
Page 75 of 85 SP Power Systems Limited Registered Office: 1 Atlantic Quay Glasgow G2 8SP
Registered in Scotland No. 215841 Vat No. GB 659 3720 08
Project Title IFI 0401 – STP 3 Cable Networks
Description of project A DNO research & development collaboration hosted by EA Technology
Expenditure for financial year
Internal £9,884 Expenditure in previous (IFI) financial years
Internal £36,031
External £57,375 External £284,667
Total £67,259 Total £320,698
Project Cost
£329,794 Projected 10/11 costs for SPEN
Internal £10,000
External £58,659
Total £68,659
Technological area and / or issue addressed by project
The STP Cable Networks programme for budget year 2010/11 aimed to optimise underground cable network design, improve operational performance, maximise potential benefits, improve financial performance and minimise risk associated with underground cable networks, whilst having due regard for the environment and energy efficiency. The programme also aimed to prevent cable failure modes and to deliver continuous improvement in terms of safety and environmental performance of all aspects of the underground cable network to meet the individual business requirements of Member Companies. Several of the projects contribute to the industry’s knowledge of variation in climate change. Projects Funded in 2010/2011: Completed at the end of March 2011:- S3144_3; Comparison of Processes for the Treatment of Redundant Fluid Filled Cables: Analysis of Cable Samples (10/11); S3173_1: (REVISED) Implications of Climate Change for Cable Systems: Effects on Cable Ratings (10/11); S3202_2: Performance Evaluation of Plastic Smoothed Walled and Corrugated Ducting Installed In Trefoil Formation: Evaluation of Results (10/11); S3223_1: Implementation of Security Method Developed to Protect CRATER Spreadsheets (10/11); Projects Funded in 2010/2011: In Progress at the end of March 11:- S3161_2; Decision Making Tool for the Assessment of long MV and HV Cable Circuits – Create Decision Making Tool (10/11); S3165_2: Performance ageing tests on polymeric terminations: Partial Discharge Measurements and U/V Camera Analysis (10/11); S3176_2: (REVISED) Mechanical Integrity of Joints – Stage 2: Testing of Joints (10/11); S3187_2: Polymeric Sealants for Cable Ducts: Triplexed Cables (10/11); S3190_1: Flushing of Fluid-Filled Cable Circuits (10/11) (Fluid-Filled Cable Project); S3191_1; Pressure-Volume Curves for Oil Tanks (10/11) (Fluid-Filled Cable Project); S3192_1: Impregnation Coefficients for Fluid-Filled Cables. (10/11) (Fluid-Filled Cable Project); S3193_1: Reducing Pressure in Fluid-Filled Cable Circuits (10/11) (Fluid-Filled Cable Project); S3195_1: Researching Alternative PU Resins for Jointing (10/11); S3199_2: (REVISED): Developing an Automatic Update System for a Database of Fluid filled Cables (10/11); (Fluid-Filled Cable Project). Updated information can be found at :- https://www.stp.uk.net
Type(s) of innovation involved
e.g. Incremental, Tech Transfer, Significant, Radical
Project Benefits Rating
Project Residual Risk Overall Project Score
14 8 22

IFI Annual Report 2010/11
Page 76 of 85 SP Power Systems Limited Registered Office: 1 Atlantic Quay Glasgow G2 8SP
Registered in Scotland No. 215841 Vat No. GB 659 3720 08
Expected Benefits of Project
Projects in this Module will significantly increase the performance and reliability of the cable network. In many cases the cable assets life may also be extended. If the projects are technically successful and the findings and recommendations from the projects are implemented, then the projects will potentially enable each DNO Member of the programme to gain the following benefits, including: Use of an effective tool to improve the leak management of fluid filled cable circuits. Reducing the risk of potential costly failures; Successful and practical methods for sealing ducts containing triplexed cable; A test that truly measures the mechanical robustness of a joint with an understanding of the performance between “green” resin filled joints and conventional PU filled joints. This could result in significant cost benefit; Alternatives to current design and installation practices which offer benefits in lower lifetime cost, higher performance (e.g. increased ratings); Reduce risk in environmentally sensitive areas; A reduction in the number of accidents / incidents so increasing safety of staff and the public; Reduce excavation required in locating leaks from fluid-filled cables, reduce the times and costs of leak location, and also reducing outage times; A reduction in digging, causing less disruption to the public, reducing impact on the environment and avoiding disposal of soil to landfill; Offset future increases in CAPEX and OPEX; CI/CML savings per connected customer; Reduce cable purchase costs; Enforce Network resilience; Implement strategies for reducing cable failures, resulting from excessive forces; Reduction in number of cable faults; Reduce design costs.
Expected Timescale to adoption
Range 1-2 years - dependent on project
Duration of benefit once achieved
Range 3-5 years -dependent on project
Probability of Success Range 45-100% - dependent on project
Project NPV = (PV Benefits – PV Costs) x Probability of Success
£42,013
Potential for achieving expected benefits
There are a huge variety of projects within the 2010/11 work programme for Module 3. A significant number of these projects are interlinked developing a scientific Fluid Filled Cable software tool to improve the leak management of fluid filled cable assets. Reducing the risk of potential costly failures. This technical development consists of numerous single projects, but collectively form part of much larger suite of projects over more than one financial year which require further research and development in order to optimise the financial, operational performance and management of fluid filled cable assets from which the customer and stakeholders will benefit. Other projects were looking at better ways of improving the operational performance, management and reliability of Cable Networks, by minimising the impact on the environment and the safety of both the operators and the public, in a manner that could be implemented straight away. Collectively, the 10/11 work programme demonstrates the development of innovative products, processes and techniques that improve the management of Cable Networks; in terms of safety, design, environment, reliability, security and power quality. STP has also delivered a number of notable innovations since its inception.

IFI Annual Report 2010/11
Page 77 of 85 SP Power Systems Limited Registered Office: 1 Atlantic Quay Glasgow G2 8SP
Registered in Scotland No. 215841 Vat No. GB 659 3720 08
Project Progress to March 11
Only a small number of projects or project stages started in the Module during 10/11 have been completed, this is mainly due to the fact that the majority of projects are interlinked with the Fluid Filled Cable Tool, which span more than one year and delivery is expected in 2011/12. However, the outputs of the single stage projects that have already identified potential benefits and opportunities for further innovative technical development work. A small selection of these are provided below: S3173_1: The effects of climate change driven by high emissions on cable ratings and losses are modest, but significant: Changes in temperature may have the effect of reducing summertime in-soil ratings by 1.5 to 5% in the 2050s and 2.5 to 8.5% in the 2080s. The highest figures are associated with factors such as large cable size, high dielectric loss, low maximum conductor temperature and soil drying out (noting that the percentages calculated for soil drying out are based on the assumption that soil drying out occurs both today and in the future, i.e. that the soil drying out is driven more by high circuit loading than by changing soil conditions). In-air summertime ratings may have to be reduced by 2.5 to 4.5% in the 2050s and 4 to 7.5% in the 2080s. Increases in losses (of buried cables) arising from rise in temperature and soil thermal resistivity may typically be about 1.5% by the 2080s – assuming no change of load. At some time during the 21
st century the assumed normal summertime air
temperature may reasonably be increased from 25 °C to 30 °C; if adopted, this will align it with the value commonly used at present in central and southern Europe. For critical circuits, and in particular for those which are likely to take heavy loads for prolonged periods in summer, ratings ought to take into account drying out of soil; the conditions of 20 °C and soil thermal resistivity of 1.2 K.m/W may reasonably be adopted. The dry zone thermal resistivity may reasonably be taken to be 2.5 K.m/W for circuits up to and including 33 kV and 2.7 K.m/W for circuits at greater than 33 kV. Under tarmac, circuits may reasonably be rated at an assumed soil temperature of 25 °C in summertime. Where circuits are buried shallow, i.e. less than 450 mm, the soil temperature may reasonably be assumed to be 35 °C in summertime; the steady rating equation can be used unmodified.
Project Progress to March 11 (Continued)
S3202_1 &2: The results show that both types of duct perform satisfactorily in trefoil formation and support the conclusions of S3155. There is no compelling evidence for changing from the black corrugated duct (HDPE) to the red smooth wall duct (uPVC); There is broad agreement between the experimental results and the analytical CRATER model. This work indicates that numerical modelling provides a complementary technique which improves understanding and visualisation of the phenomena involved. STP Members should consider the development of a more advanced numerical model that can be applied to support CRATER and improve predictions of the performance of buried ducting. S3144_3: Once the majority of the oil is recovered from the cable being cleaned there is no need to have extended cleaning times, since they result in very little additional oil removal from the insulating papers. The use of either nitrogen or compressed air on its own is considered to be of limited use.
Collaborative Partners Other DNOs
R&D Providers EA Technology

IFI Annual Report 2010/11
Page 78 of 85 SP Power Systems Limited Registered Office: 1 Atlantic Quay Glasgow G2 8SP
Registered in Scotland No. 215841 Vat No. GB 659 3720 08
Project Title IFI 0401 – STP 4 Substations
Description of project A DNO research & development collaboration hosted by EA Technology
Expenditure for financial year
Internal £9,884 Expenditure in previous (IFI) financial years
Internal £33,512
External £42,037 External £213,475
Total £51,921 Total £246,987
Project Cost
£332,896 Projected 10/11 costs for SPEN
Internal £10,000
External £42,860
Total £52,860
Technological area and / or issue addressed by project
The STP Substations programme for the budget year 2010/11 aimed to improve operational performance, maximise potential benefits; improve financial performance and minimise risk associated with substation assets, whilst having due regard for the environment and energy efficiency. The projects aimed to provide cost effective solutions to increase reliability and deliver continuous improvement in terms of safety and environmental performance of existing and future substation assets, to meet the individual business requirements of Member Companies. Projects Funded in 2010/2011: Completed at the end of March 2011:- S4248_2: Protection Testing and Maintenance Practices: Incorporating NIE & MEA: Additional Research (10/11): S4255_1: Research and Development of a Test Procedure to Cost Effectively Determine the Mechanical Strength of Transformer Paper Insulation (10/11); S4259_2: Non Intrusive Volatile Gas Analysis of Oil Filled Switchgear (10/11); S4267_1: Evaluation of Fire Mitigation Techniques in Secondary Distribution Substations, rated at 11kV and below (10/11); S4270_1: Arc Suppression Coils: Research and Evaluation Study (10/11); S4271_1: Technical Evaluation of Common Industry Approach to Battery Charger Installations (10/11); S4272_1: Applied Research to Develop Performance Capacity Criteria for Lead Acid and NiCad Batteries (10/11). Projects Funded in 2010/2011: In Progress at the end of March 11:- S4164_10: On-Load Tap Changer Monitor: Technical Evaluation and Data Analysis of Acoustic Emissions: Implications of Tap Position and Impact of Fault Simulation (10/11); S4181_5: (REVISED) Ongoing Programme of Transformer Post Mortems (10/11); S4181_6: Ongoing Programme of Transformer Post Mortems: Technical Evaluation Summary of Post Mortems to date (10/11); S4185_7 Developing Strategic Asset Management Processes Through Technical Liaisons with European Utilities 10/11; S4221_3: Out of Phase Modelling: Additional Research (10/11); S4241_2: Study of Circuit Breaker Timing Measurements & Methods: Consolidation of Kelman Profiles for Statistical Analysis to Establish Benchmark times for Circuit Breaker Operation (10/11); S4244_2: Substation Pressure Rise Modelling Tool (10/11); S4247_1: Identifying tests to determine the Continuous Rating of CT’s in Service: (10/11); S4265_1: Analysis and Evaluation of Polymer Degradation issues in Electrical Plant and Equipment (10/11); S4266_1: (REVISED) Analysis and Statistical Review of SF6 Gas Condition within 11kV and 33kV Circuit Breakers in order to prolong Life (10/11); S4269_1: (REVISED-UPDATED) Operational and Environmental Evaluation of SIPP Node Intelligent Bund Pump Technology (10/11); S4275_1: Secondary Distribution Network Automation Evaluation Techniques: Methodology and Philosophy (10/11).

IFI Annual Report 2010/11
Page 79 of 85 SP Power Systems Limited Registered Office: 1 Atlantic Quay Glasgow G2 8SP
Registered in Scotland No. 215841 Vat No. GB 659 3720 08
Type(s) of innovation involved
e.g. Incremental, Tech Transfer, Significant, Radical
Project Benefits Rating
Project Residual Risk Overall Project Score
16.5 9.5 26.0
Expected Benefits of Project
Projects within this Module have been cost effective and help improve reliability and safety of substations in distribution networks in line with government policy. If the projects are technically successful and the findings and recommendations from the projects are implemented, then the projects will potentially enable each DNO Member of the programme to gain the following benefits, including: Increased reliability and continuous improvement in terms of safety and environmental performance of existing and future substation assets; Collaborative evaluation of battery installations and operational practice to ensure a safer and more reliable network; CI/CML savings per connected customer; Optimising safety and environmental requirements for management of insulating oils and SF6; Technical liaison with International Utilities to share new technology and failure modes; Offset future increases in CAPEX and OPEX; Development of condition based assessments, or tests, to determine asset condition; Preventing failures of oil-filled equipment, tap changers, earth switches will improve safety and avoid unnecessary scrapping of serviceable components, which will alleviate environmental impact; Extend serviceable life of switchgear and transformers; Further develop technical understanding of protection system maintenance requirements; Understand the degradation and failure processes of substation plant and equipment, and quantify the risks associated with those processes; Further develop technical understanding of operational staff in complex electrical issues; Mitigate risk to environment; Increased safety of staff and public by reducing risk of fire and the number of accidents / incidents. Reduce lifetime costs and improve functionality by the appropriate use of new technology;
Expected Timescale to adoption
Range 1-4 years - dependent on project
Duration of benefit once achieved
Range 1-6 years -dependent on project
Probability of Success Range 30-95% - dependent on project
Project NPV = (PV Benefits – PV Costs) x Probability of Success
£32,721

IFI Annual Report 2010/11
Page 80 of 85 SP Power Systems Limited Registered Office: 1 Atlantic Quay Glasgow G2 8SP
Registered in Scotland No. 215841 Vat No. GB 659 3720 08
Potential for achieving expected benefits
There are a huge variety of projects within the 2010/11 work programme for Module 4. A significant number of these projects are scientific based, researching technical developments in degradation and understanding the failure processes of substation plant and equipment, whilst quantifying the risks associated with those processes. Projects in these areas are mainly single stages of much larger multi-stage projects which require further research and development of condition based assessments, and/or tests, asset management tools, systems and methodologies in order to optimise the financial, operational performance and design of Substation plant from which the customer and stakeholders will benefit. Other projects were looking at better ways of improving working, the performance and reliability of Substation plant, maintenance regimes, minimising the impact on the environment and the safety of both the operators and the public for Asset Managers, in a manner that could be implemented straight away. Collectively, the 10/11 work programme demonstrates the development of innovative products, processes and techniques that improve the management of Substation assets; in terms of safety, design, environment, reliability, security and power quality. STP has also delivered a number of notable innovations since its inception.
Project Progress to March 11
A number of projects or project stages started in the Module during 10/11 have been completed, but some projects span more than one year. The outputs of individual stages which form part of larger multi-stage projects have provided some notable conclusions and recommendations. A small selection of these are provided below: S4248_2: A remote timed trip test provides a cost effective means of regularly confirming the availability of the circuit breaker and tripping supplies; A trip test using secondary injection, as opposed to a functional trip by mechanical intervention on the relay, is considered best practice for in-attendance trip testing; Wiring IR testing of AC circuits only and use of a 500V Megger is considered to be able to uncover the majority of issues with minimum risk of damage to other components; S4255_1: The study has identified Tear Index (tear strength divided by paper grammage) offers an alternative to the use of degree of polymerisation values that is a cost effective and reliable method of identifying the transformer paper condition.

IFI Annual Report 2010/11
Page 81 of 85 SP Power Systems Limited Registered Office: 1 Atlantic Quay Glasgow G2 8SP
Registered in Scotland No. 215841 Vat No. GB 659 3720 08
Project Progress to March 11 (Continued)
There are also number of single stage projects that have already identified potential benefits and opportunities for further innovative technical development work. A small selection of these are provided below: S4267_1: IEC 61936-1 is a good starting point for integrating protective fire measures into a substation design. IEC 61936-1 specifies clearances and fire ratings of materials which can be used in a design but it does not take precedence over local laws or regulations. It is therefore important that local laws and regulations are reviewed and where necessary applied before the design criteria specified in IEC 61936-1 is considered; Fire suppression systems can be hazardous to human life and their use should be risk assessed. The requirements for maintenance should also be reviewed to ensure equipment is in correct working order and the risk of inadvertent discharge minimised. S4271_1: The consequences of a battery failure are high and though the incidence is low there is great incentive to introduce measures to avoid them. Companies should consider the case for a low cost, limited functionality Battery Management Systems that provides an alarm when there has been or is about to be an outright failure of a battery or cell; . If quick charging is required constant current or constant-constant voltage methods offer adequate solutions
Collaborative Partners Other DNOs
R&D Providers EA Technology

IFI Annual Report 2010/11
Page 82 of 85 SP Power Systems Limited Registered Office: 1 Atlantic Quay Glasgow G2 8SP
Registered in Scotland No. 215841 Vat No. GB 659 3720 08
Project Title IFI 0401 – STP 5 Networks for Distributed Energy Resources
Description of project A DNO research & development collaboration hosted by EA Technology
Expenditure for financial year
Internal £9,884 Expenditure in previous (IFI) financial years
Internal £31,236
External £50,361 External £255,016
Total £60,245 Total £286,252
Project Cost
£461,910 Projected 10/11 costs for SPEN
Internal £10,000
External £51,434
Total £61,434
Technological area and / or issue addressed by project
The STP Networks for Distributed Energy Resources programme for budget year 2010/11 aimed to maximise potential benefits and reduce costs and risks associated with facilitating the design, development and operation of networks for the integration of low carbon technologies into future network designs, whilst having due regard for the environment and energy efficiency. The programme also aimed to cost-effectively improve the operational efficiency and business performance of Member Companies within prevailing regulatory constraints. Projects Funded in 2010/2011: Completed at the end of March 2011:- S5147_6: Microgenerator Clusters (Stage 6 - Removal of Equipment) (10/11); S5167_2: Correlation of Wind Speeds over 1-20km (10/11); S5189_2: Harmonic Distortion Caused by Inverter Connected Distributed Generation (10/11); S5196_4: Transformer Dynamic Ratings (10/11); S5198_5: Microgrids (economic and contractual issues) (10/11); S5207_2: Long Term Domestic Demands (spreadsheet) (10/11); S5210_1: Use of Capacitors for Reactive Power & Voltage Support on Distribution Networks (10/11); S5212_2; SmartGrid Trial (planning, workshop and specification) (10/11); S5215-1: Latest Developments in Issues Associated with Low Carbon Networks; S5216_1: DSM - Taking a Passive Approach; S5218_1: Review of DWG Toolkit for Identifying Environmental and Social Value in Network Design and Operation (10/11); S5219_1: Standardising the Control and Communications Interface for DG Connections (10/11); S5220_1: Impact of EVs on LV and Distribution Networks (10/11); S5222_1: Improving the Accuracy of Network Losses Measurement (10/11); S5225_1: Connection of Small Generators to LV Networks above the G83 Capacity Limit (10/11); S5235_1: Participate in the Revision of an Updated Flicker Curve (proposal to Cigre/Cired) (10/11); Projects Funded in 2010/2011: In Progress at the end of March 11:- S5187_2: Module 5 Participation in ENARD Annex II DG System Integration (Dissemination); S5195_2: Network losses (energy efficient substations); S5198_4: Microgrids (ancillary services and demand side management) (10/11); S5198_3: Microgrids (technical interface and benefits); S5205_3: Fault Level Management (comparison of current approaches) (10/11); S5205_4: Fault Level Management (through fault withstand) (10/11); S5209_1: Use of Quadrature Boosters on Distribution Networks (10/11); S5217_1: DSM - Taking an Active Approach (10/11); S5234_1: The effects of harmonic distortion on network assets (10/11); S5235_2: Participate in the Revision of an Updated Flicker Curve (participate in Working Group) (10/11). Updated information can be found at :- https://www.stp.uk.net

IFI Annual Report 2010/11
Page 83 of 85 SP Power Systems Limited Registered Office: 1 Atlantic Quay Glasgow G2 8SP
Registered in Scotland No. 215841 Vat No. GB 659 3720 08
Type(s) of innovation involved
e.g. Incremental, Tech Transfer, Significant, Radical
Project Benefits Rating
Project Residual Risk Overall Project Score
13.5 8.5 22
Expected Benefits of Project
Projects within this Module have been cost effective and help improve reliability and safety of generation connection in distribution networks in line with government policy. If the findings and recommendations from the projects are implemented, then the projects will potentially enable each DNO Member of the programme to gain benefits including: Investigate distributed generation connection methods without undue reinforcement, while at the same time improving supply quality by reducing CMLs and voltage unbalance; Positive impact on environmental performance and many have positive impacts on safety; Increased understanding between all Member Companies on technical, commercial and regulatory issues and to develop effective solutions to these issues; Developing understanding of the implications of connecting low carbon technologies to the distribution network in terms of safety, design, reliability, security and power quality; Where possible, try and optimise the Government’s low-carbon strategy and accommodate the likely growth of DG; Improved management of the implications of connecting distributed resources to the distribution network in terms of the statutory, regulatory and commercial frameworks; Investigating low carbon network designs and plan transition from passive to active networks; Improve power quality issues due to dynamic load change; Enabling the development of strategies to manage PQ levels and customer expectations; Reduction in losses for DNOs; Highlight the issues and benefits of Smart Grids, Smart Meters and Active Network Management Systems, ultimately improving CMLs; Significant benefits in terms of enhanced knowledge and awareness of overseas best practice in DG system integration, which can be applied, as appropriate in the UK; Ensure that all participants optimise network design, financial and operational performance as the levels of storage, managed-demand and distributed generation increase on the distribution networks; Developing and emerging distributed generation, demand-side management, storage technologies.
Expected Timescale to adoption
Range 1-3 years - dependent on project
Duration of benefit once achieved
Range 2-5 years -dependent on project
Probability of Success Range 51-100% - dependent on project
Project NPV = (PV Benefits – PV Costs) x Probability of Success
£28,841

IFI Annual Report 2010/11
Page 84 of 85 SP Power Systems Limited Registered Office: 1 Atlantic Quay Glasgow G2 8SP
Registered in Scotland No. 215841 Vat No. GB 659 3720 08
Potential for achieving expected benefits
There are a huge variety of projects within the 2010/11 work programme for Module 5. A number of these projects are scientific based and will require further research and development to achieve improvements in operational performance and integration into the Network Operators business environment. Projects in these areas are mainly stages of much larger multi-stage projects and require further work to optimise network design, financial and operational performance from which the customer and stakeholders will benefit. Other projects are looking at better ways of improving working and productivity for network planners, in a manner that could be implemented straight away. Collectively, the 10/11 work programme demonstrates the development of the technical understanding in relation to connecting and integrating low carbon technologies onto the distribution network; in terms of safety, design, reliability, security and power quality. STP has also delivered a number of notable innovations since its inception.
Project Progress to March 11
The majority of projects or project stages started in the Module during 10/11 have been completed, but some projects span more than one year. The outputs of individual stages which form part of larger multi-stage projects have provided some notable conclusions and recommendations. A small selection of these are provided below: S5167_2: The probability reduction ratios r(1,20) for individual pairs of sites show a distinct linear variation with height difference between the two sites, but there is no discernible variation with distance between sites. If we could confidently apply this probability reduction ratio to the exceedence curve behind the P27 ratings, the single circuit ratings could be raised by about 13%. Further work, preferably using 6-minute weather data from pairs of sites within 20 km of each other, is recommended to clarify the relationship between the 3-hour and 6-minute probability reduction ratios, in order improve the accuracy and confidence of the possible ratings enhancements suggested by this work S5207_2: It is recommended that the spreadsheet tool is used for future studies into the impact of changes in domestic load on peak demand in order to inform or substantiate network reinforcement strategies; It is recommended that further consideration be given to using the reaggregated profiles to assess the relative losses and network component aging considerations of Smart Grids/ Active Network Management and other future network topologies involving domestic load due to higher than average concentrations of low-carbon technologies. Such information could prove useful in future network design considerations;

IFI Annual Report 2010/11
Page 85 of 85 SP Power Systems Limited Registered Office: 1 Atlantic Quay Glasgow G2 8SP
Registered in Scotland No. 215841 Vat No. GB 659 3720 08
Project Progress to March 11 (Continued)
The effect of voltage reduction on domestic load will vary depending upon the appliance mix active at the time of reduction. There will be times when voltage reduction is likely to be more successful than others in reducing the network load. It is recommended that the spreadsheet tool is used alongside information on the voltage response of various appliance groups to predict the success or otherwise of voltage reduction strategies; By adding in varying penetrations of microgeneration into the spreadsheet tool, the relative frequency of occurrence of the conditions for sustained islanding due to match of local load and generation could be studied. It is recommended that the spreadsheet tool is used to evaluate mixes of generation that may cause future network issues where islanding is concerned. S5212_2: The feasibility study has produced a Specification and Project Plan for a Smart Grid trial, which fits the criteria for a Tier 1 funded project, as described in Ofgem’s LCN Fund Governance Document.
Project Progress to March 11 (Continued)
There are also number of single stage projects that have already identified potential benefits and opportunities for further innovative technical development work. A small selection of these are provided below: S5219_1: Whilst there is progress in developing standards for interoperability and communications there is much less progress in developing reference architectures or a strategic plan for how ANM solutions might be replicated or at what level control should take place. The definitions and diagrams of ANM structures used to develop interoperability standards could be adapted for this purpose. However, much of the information required for the work on architectures and co-ordinating control will need to be learnt from practical trials. At present, there is insufficient experience of how ANM can be implemented. To collate the lessons learnt, each ANM solution could be mapped onto an initial agreed architecture. The lessons learnt in turn would help refine the architecture. At the practical level, the Danish Cell Concept is a useful means to develop ANM in a more strategic manner on the ground. These activities should help demonstrate how the regulatory framework needs to be adapted to enable more strategic planning and encourage new players such as virtual power plants and microgrids.
Project Progress to March 11 (Continued)
S5220_1: Modelling work has shown a variation in the maximum uptake of EVs which can be accommodated by existing power distribution networks, due to varying assumptions regarding charging regimes, energy consumed and the network to be modelled. Analysis of UK networks has shown that relatively high levels of EV uptake can be accommodated within the current network. Potential mitigation measures can include smart charging measures such as time-of-use charging, or automated integration with ‘Smart Grids’, or technological solutions such as upgrading of sub-station transformers. The extent to which the impacts of EV charging on the distribution network could be mitigated using techniques to change behaviour, such as time-of-use pricing could be assessed as part of ongoing EV trials such as the Plugged in Places initiatives. The two principal conductive charging systems are classified by the speed of charging. Both slow and fast charging has the potential to impact upon the distribution network. Fast charging points designed to re-charge a battery during a journey, such as those which may be installed at motorway service stations, have the potential to create clustered high demand in areas where power demand is currently low.
Collaborative Partners Other DNOs
R&D Providers EA Technology
