infrastructure and long-term investing by peng chen... · infrastructure and long-term investing...
TRANSCRIPT
Infrastructure and Long-Term Investing
July 2013
Peng Chen, PhD, CFA, Chief Executive Officer & Portfolio Manager, Asia ex Japan,
Chairman, Dimensional SmartNest
34453_072013
Agenda 1. Who is Dimensional
2. Defining Infrastructure
3. Historical Risk and Returns
4. Infrastructure and Long Term Portfolio
5. Return and Cost of Capital of Regulated
Infrastructure
6. Methods and Inputs for Calculating
Cost of capital
7. Summary
34453_072013
Who is Dimensional
34453_072013
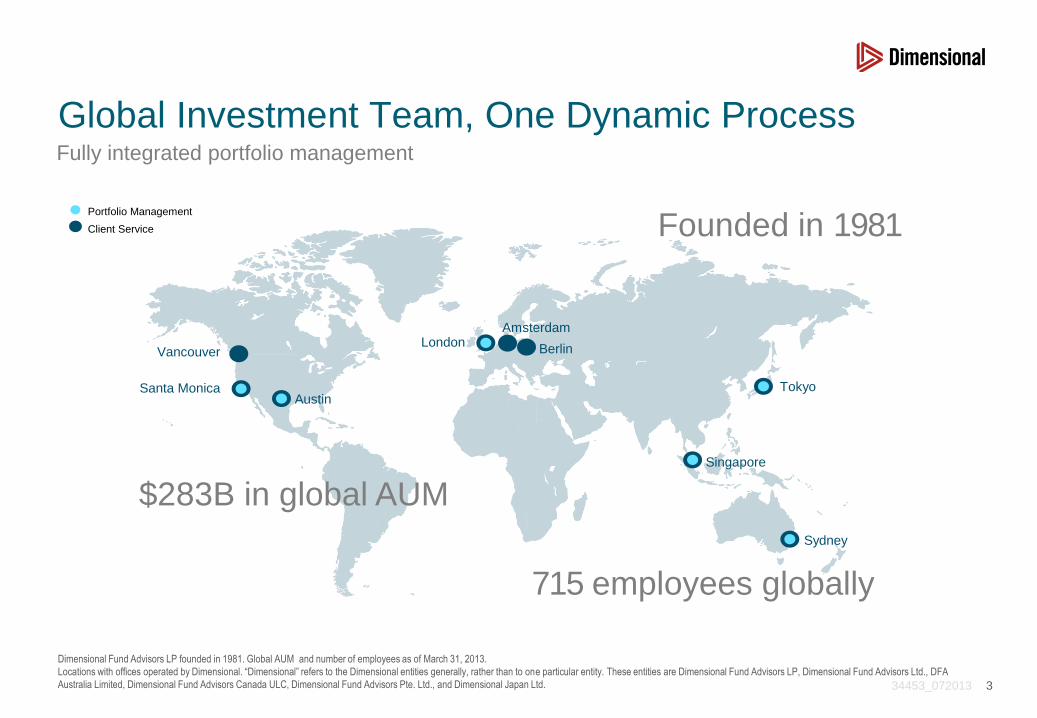
Global Investment Team, One Dynamic Process
3
Vancouver
Santa Monica Austin
London Amsterdam
Berlin
Singapore
Sydney
Tokyo
Portfolio Management
Client Service
Dimensional Fund Advisors LP founded in 1981. Global AUM and number of employees as of March 31, 2013.
Locations with offices operated by Dimensional. “Dimensional” refers to the Dimensional entities generally, rather than to one particular entity. These entities are Dimensional Fund Advisors LP, Dimensional Fund Advisors Ltd., DFA
Australia Limited, Dimensional Fund Advisors Canada ULC, Dimensional Fund Advisors Pte. Ltd., and Dimensional Japan Ltd.
Fully integrated portfolio management
715 employees globally
$283B in global AUM
Founded in 1981

34453_072013
Closely Affiliated with Leading Academics Deep working relationships benefit Dimensional’s solutions and investors
4
Academic Members of the
Investment Policy Committee
US Mutual Fund
Board of Directors
Kenneth R. French, Chairman
Tuck School of Business
Dartmouth College
Eugene F. Fama
Booth School of Business
University of Chicago
Robert C. Merton, Nobel Laureate
Sloan School of Management
Massachusetts Institute of Technology
George M. Constantinides
Booth School of Business
University of Chicago
John P. Gould
Booth School of Business
University of Chicago
Roger G. Ibbotson
Yale School of Management
Yale University
Edward P. Lazear
Graduate School of Business
Stanford University
Myron S. Scholes, Nobel Laureate
Graduate School of Business
Stanford University
Abbie J. Smith
Booth School of Business
University of Chicago
34453_072013
“Dimensional” refers to the Dimensional entities generally, rather than to one particular entity. These companies are Dimensional Fund Advisors LP, Dimensional Fund Advisors Ltd., DFA Australia Limited, and Dimensional Fund
Advisors Canada ULC.
1. Global asset allocation assets are for information only; these assets are primarily an aggregate of underlying funds and are not counted in totals.
All assets in US dollars. Numbers may not total 100% due to rounding.
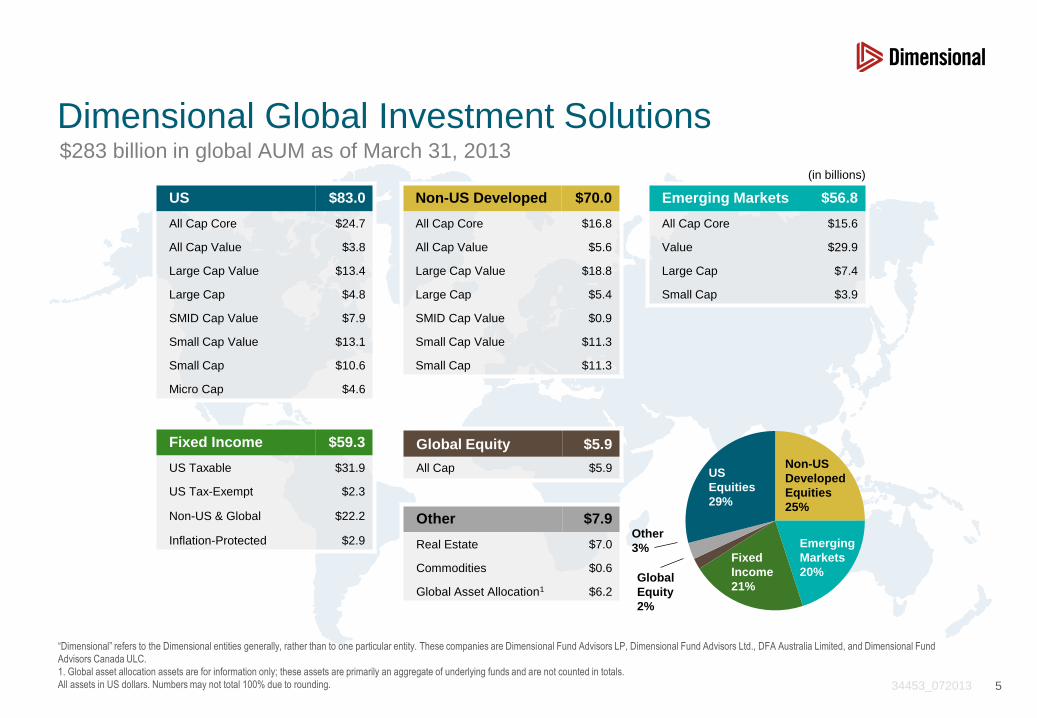
Dimensional Global Investment Solutions $283 billion in global AUM as of March 31, 2013
5
US $83.0 Non-US Developed $70.0 Emerging Markets $56.8
All Cap Core $24.7 All Cap Core $16.8 All Cap Core $15.6
All Cap Value $3.8 All Cap Value $5.6 Value $29.9
Large Cap Value $13.4 Large Cap Value $18.8 Large Cap $7.4
Large Cap $4.8 Large Cap $5.4 Small Cap $3.9
SMID Cap Value $7.9 SMID Cap Value $0.9
Small Cap Value $13.1 Small Cap Value $11.3
Small Cap $10.6 Small Cap $11.3
Micro Cap $4.6
Fixed Income $59.3
US Taxable $31.9
US Tax-Exempt $2.3
Non-US & Global $22.2
Inflation-Protected $2.9
Global Equity $5.9
All Cap $5.9
Other $7.9
Real Estate $7.0
Commodities $0.6
Global Asset Allocation1 $6.2
Non-US
Developed
Equities
25%
US
Equities
29%
Fixed
Income
21%
Emerging
Markets
20%
Other
3%
Global
Equity
2%
(in billions)
34453_072013
Defining Infrastructure
34453_072013 7

34453_072013
Infrastructure Essential physical assets, facilities, and systems that enable society to function.
It includes
• Transportation (roads, bridges, tunnels, airports, railroads, ports, etc.),
• Energy and utilities (power generation, fuels, water systems, etc.),
• Communication (line-based networks, air-based networks),
• Social (schools, hospitals, prisons, other public buildings) assets of society.
These are long-lived, real assets that are costly and time-consuming to replace, often
without immediate substitutes, that typically generate relatively stable cash flows that
increase with inflation.
8
34453_072013
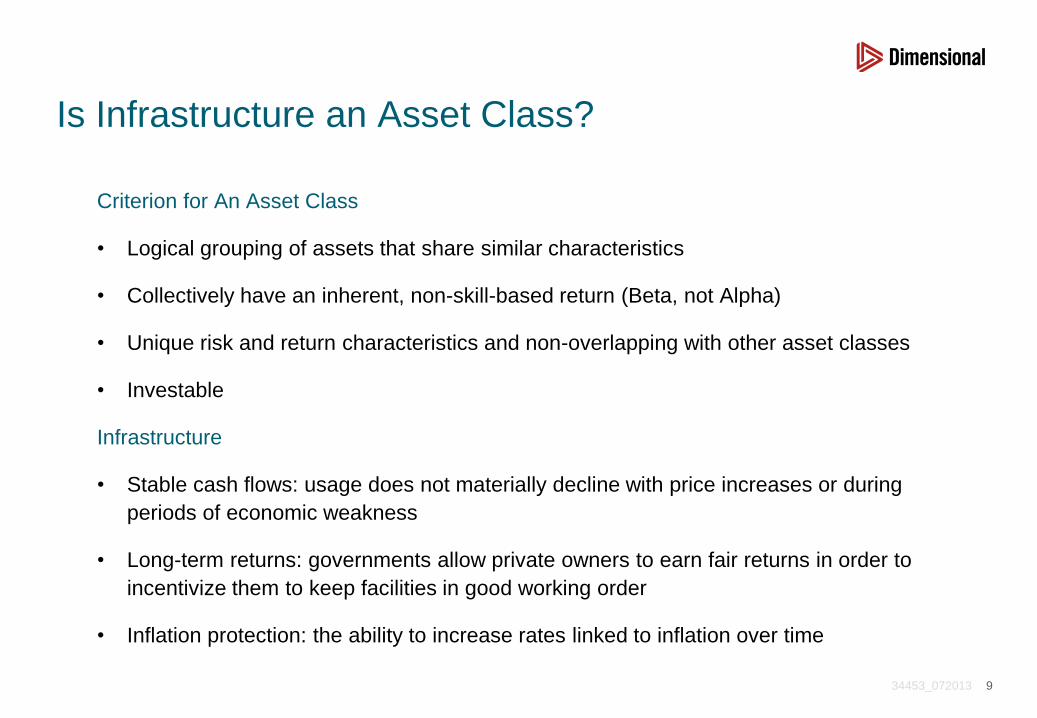
Is Infrastructure an Asset Class?
Criterion for An Asset Class
• Logical grouping of assets that share similar characteristics
• Collectively have an inherent, non-skill-based return (Beta, not Alpha)
• Unique risk and return characteristics and non-overlapping with other asset classes
• Investable
Infrastructure
• Stable cash flows: usage does not materially decline with price increases or during
periods of economic weakness
• Long-term returns: governments allow private owners to earn fair returns in order to
incentivize them to keep facilities in good working order
• Inflation protection: the ability to increase rates linked to inflation over time
9
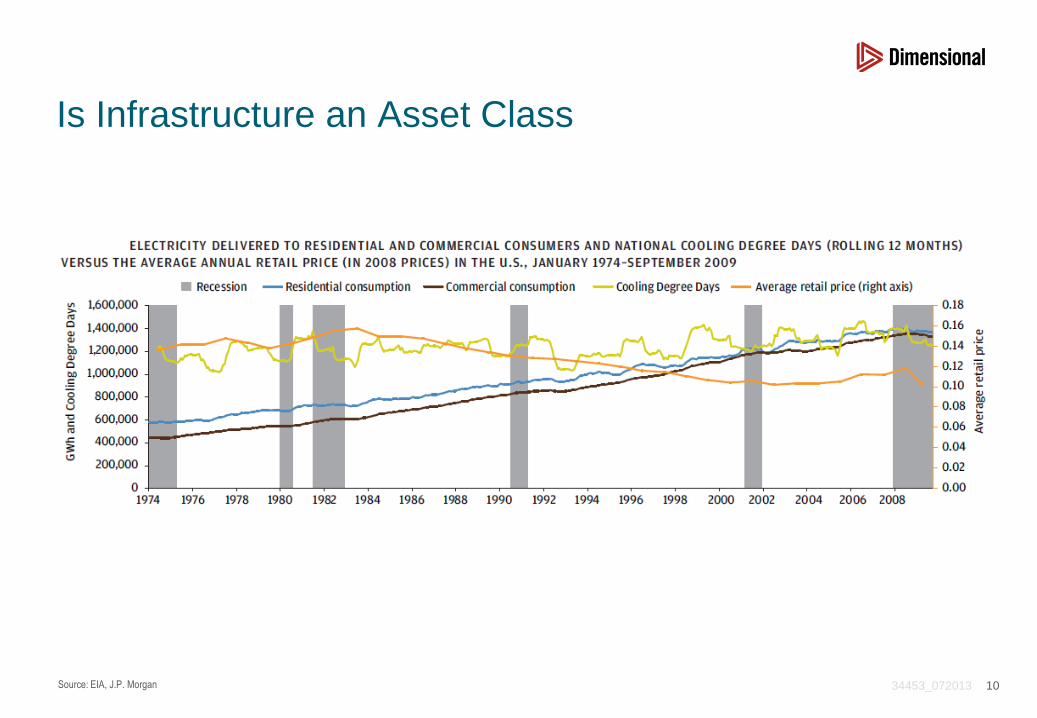
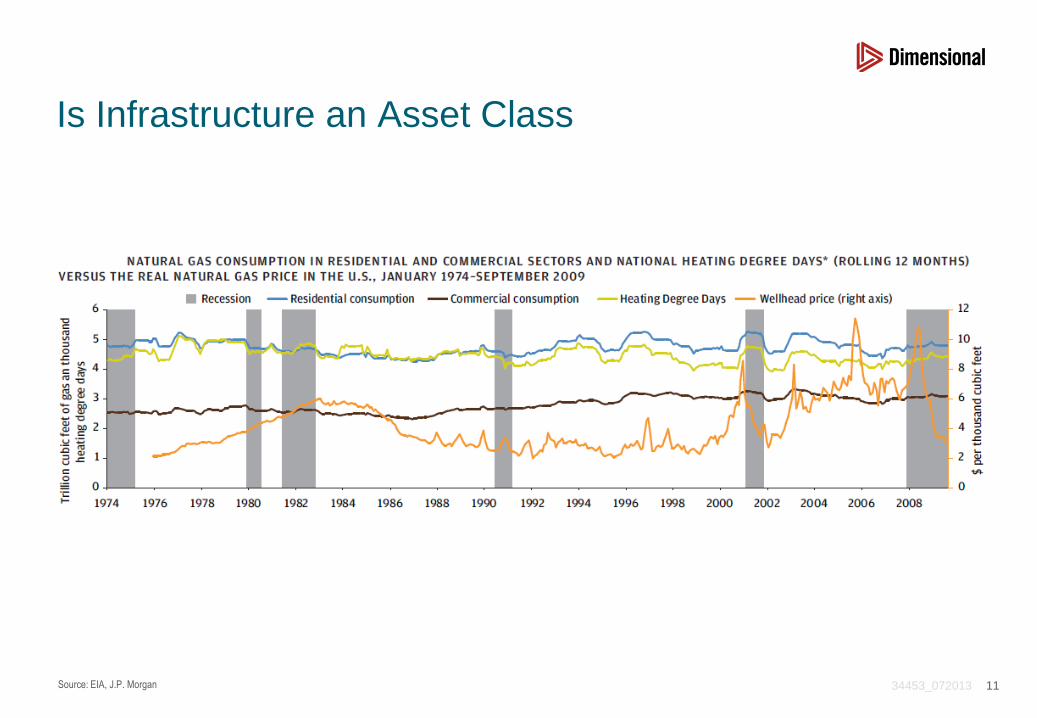
34453_072013 Source: EIA, J.P. Morgan
Is Infrastructure an Asset Class
10
34453_072013 Source: EIA, J.P. Morgan
Is Infrastructure an Asset Class
11
34453_072013
Ways of Investing in Infrastructure
12
• Direct ownership – control, but concentrated risks
• Private Equity Funds/Partnerships – more diversified
• Listed Infrastructure Vehicles
– Traded on an exchange,
– Liquid, and have extensive financial reporting requirements regulated by the various stock exchanges
34453_072013
Historical Risk and Return
34453_072013
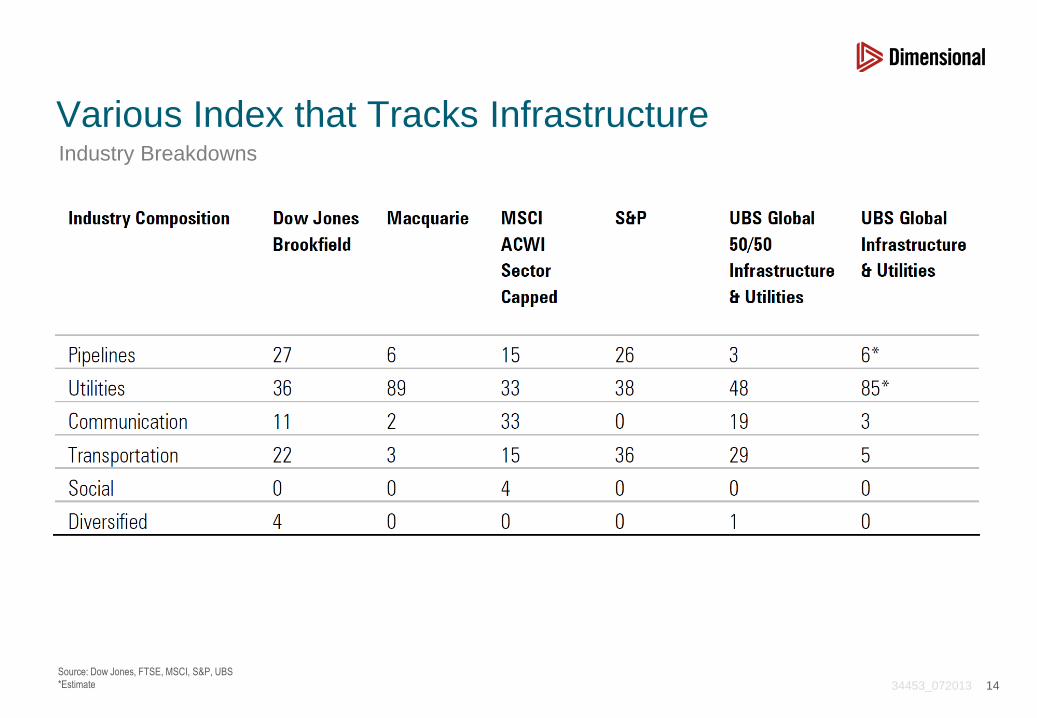
Source: Dow Jones, FTSE, MSCI, S&P, UBS
*Estimate
Various Index that Tracks Infrastructure Industry Breakdowns
14
34453_072013 Source: Ibbotson Associates.
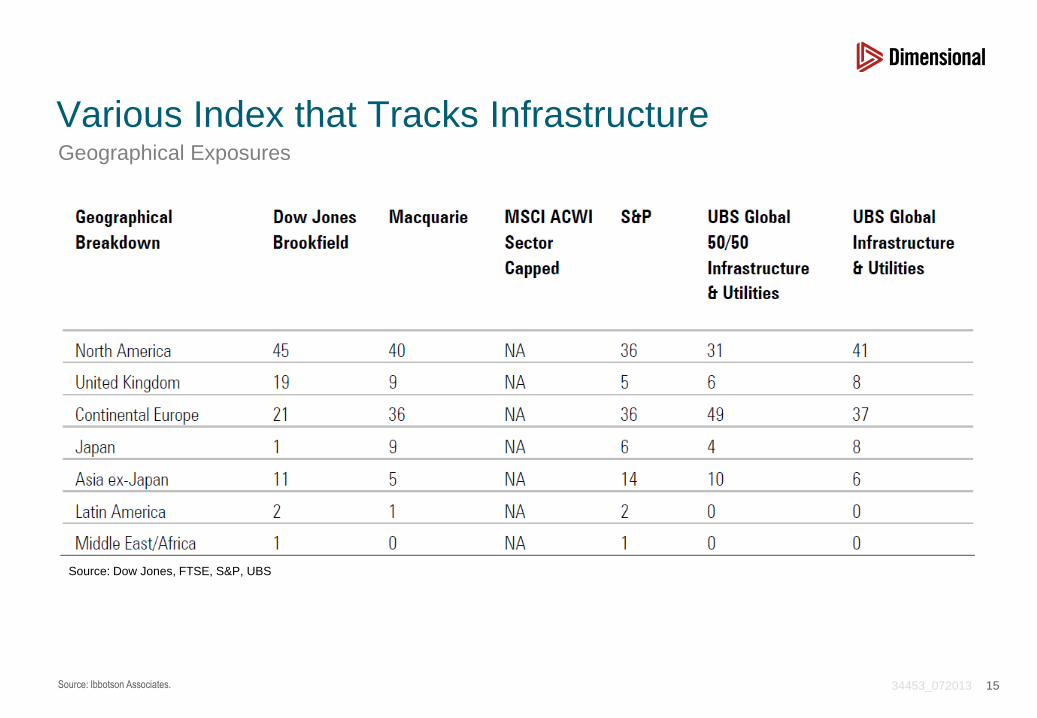
Various Index that Tracks Infrastructure Geographical Exposures
15
Source: Dow Jones, FTSE, S&P, UBS
34453_072013 Source: Ibbotson Associates.
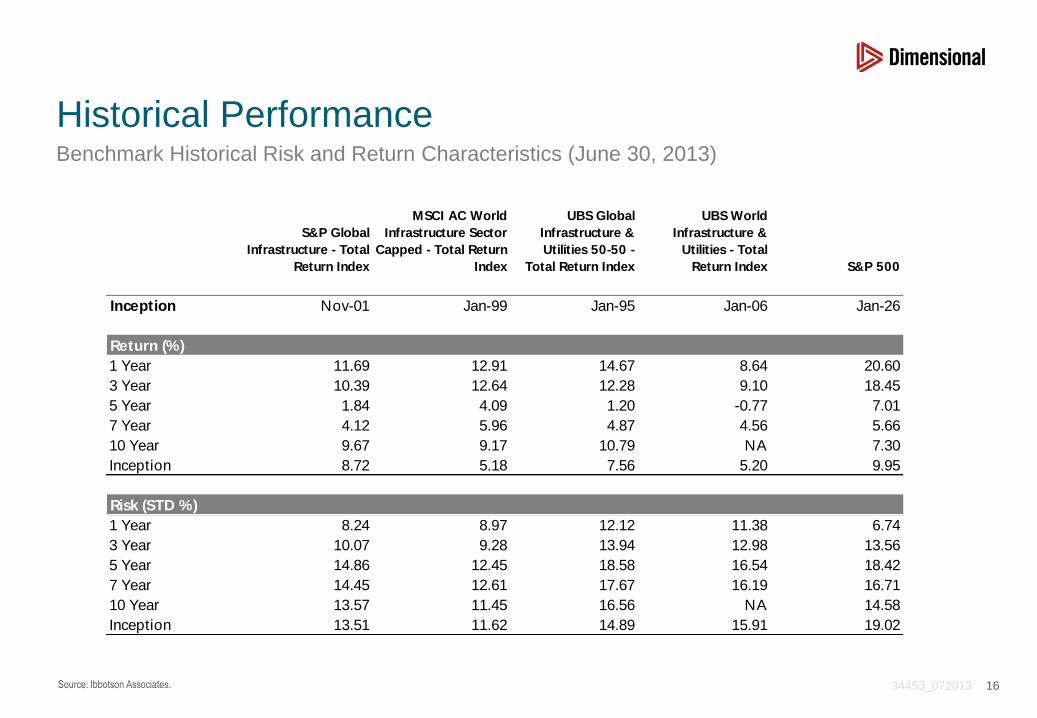
Historical Performance Benchmark Historical Risk and Return Characteristics (June 30, 2013)
16
S&P Global
Infrastructure - Total
Return Index
MSCI AC World
Infrastructure Sector
Capped - Total Return
Index
UBS Global
Infrastructure &
Utilities 50-50 -
Total Return Index
UBS World
Infrastructure &
Utilities - Total
Return Index S&P 500
Inception Nov-01 Jan-99 Jan-95 Jan-06 Jan-26
Return (%)
1 Year 11.69 12.91 14.67 8.64 20.60
3 Year 10.39 12.64 12.28 9.10 18.45
5 Year 1.84 4.09 1.20 -0.77 7.01
7 Year 4.12 5.96 4.87 4.56 5.66
10 Year 9.67 9.17 10.79 NA 7.30
Inception 8.72 5.18 7.56 5.20 9.95
Risk (STD %)
1 Year 8.24 8.97 12.12 11.38 6.74
3 Year 10.07 9.28 13.94 12.98 13.56
5 Year 14.86 12.45 18.58 16.54 18.42
7 Year 14.45 12.61 17.67 16.19 16.71
10 Year 13.57 11.45 16.56 NA 14.58
Inception 13.51 11.62 14.89 15.91 19.02
34453_072013 Source: Ibbotson Associates.
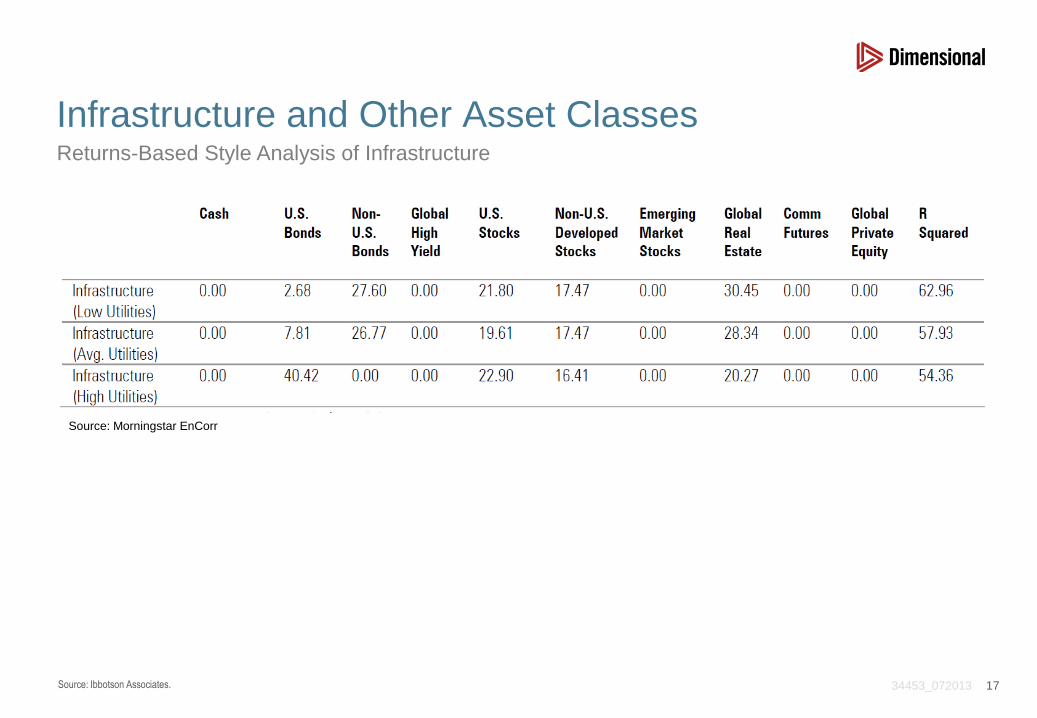
Infrastructure and Other Asset Classes
17
Returns-Based Style Analysis of Infrastructure
Source: Morningstar EnCorr
34453_072013
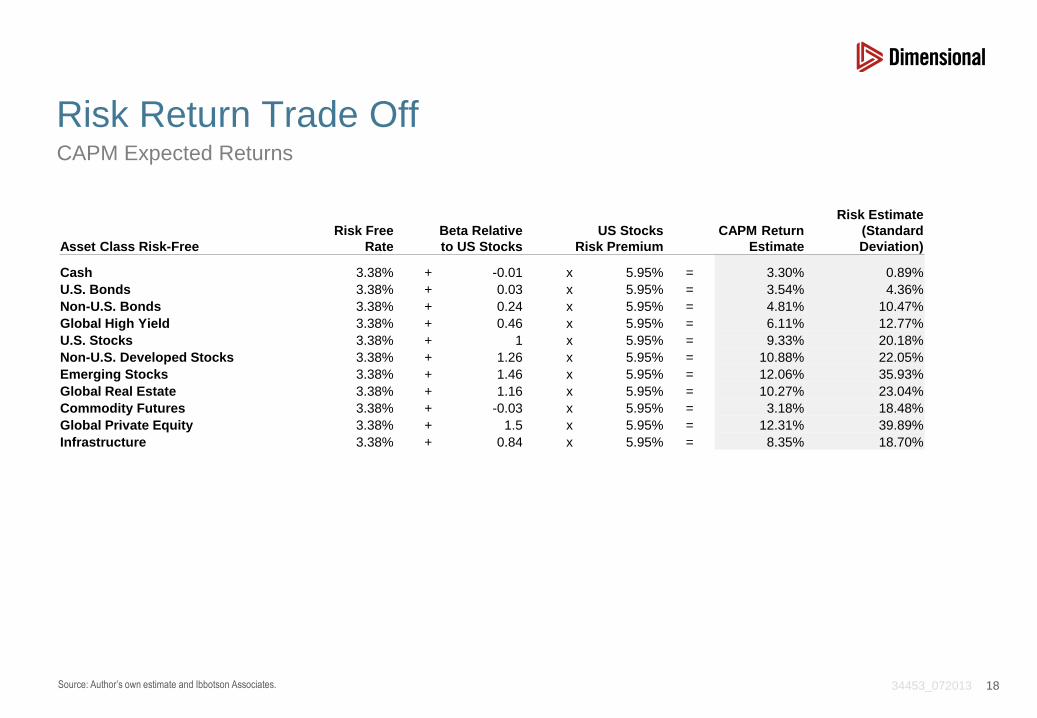
Risk Return Trade Off
18 Source: Author’s own estimate and Ibbotson Associates.
CAPM Expected Returns
Asset Class Risk-Free
Risk Free
Rate
Beta Relative
to US Stocks
US Stocks
Risk Premium
CAPM Return
Estimate
Risk Estimate
(Standard
Deviation)
Cash 3.38% + -0.01 x 5.95% = 3.30% 0.89%
U.S. Bonds 3.38% + 0.03 x 5.95% = 3.54% 4.36%
Non-U.S. Bonds 3.38% + 0.24 x 5.95% = 4.81% 10.47%
Global High Yield 3.38% + 0.46 x 5.95% = 6.11% 12.77%
U.S. Stocks 3.38% + 1 x 5.95% = 9.33% 20.18%
Non-U.S. Developed Stocks 3.38% + 1.26 x 5.95% = 10.88% 22.05%
Emerging Stocks 3.38% + 1.46 x 5.95% = 12.06% 35.93%
Global Real Estate 3.38% + 1.16 x 5.95% = 10.27% 23.04%
Commodity Futures 3.38% + -0.03 x 5.95% = 3.18% 18.48%
Global Private Equity 3.38% + 1.5 x 5.95% = 12.31% 39.89%
Infrastructure 3.38% + 0.84 x 5.95% = 8.35% 18.70%

34453_072013 19
Efficient Frontier Asset Allocation
Source: Ibbotson Associates.
34453_072013
Return and Cost of Capital of Regulated
Infrastructure
34453_072013
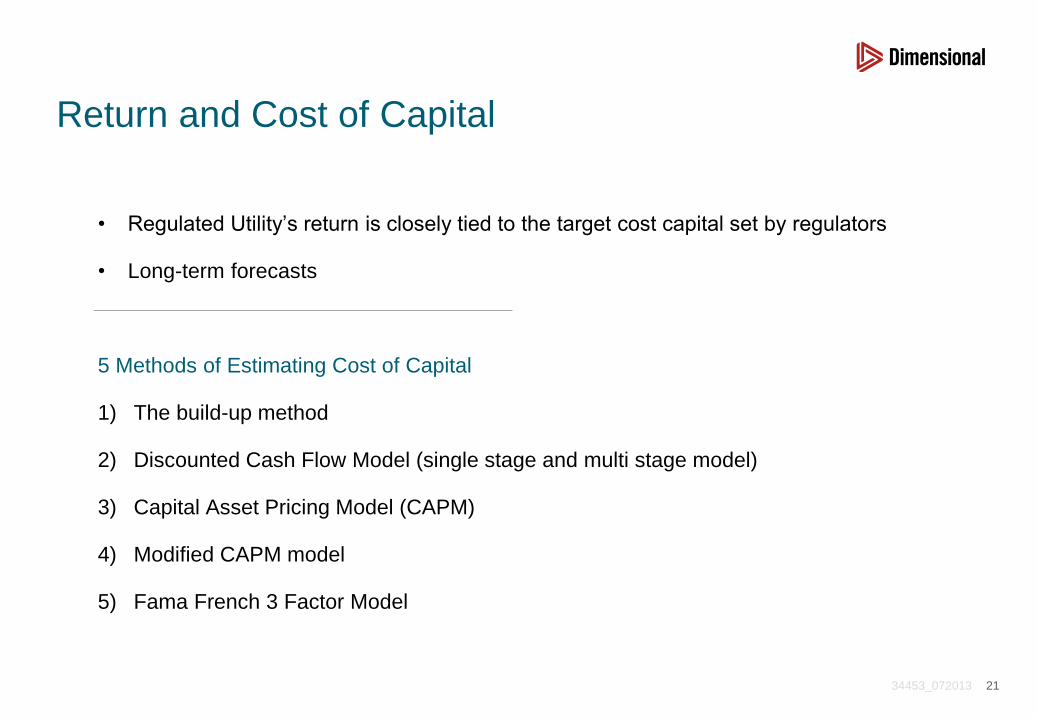
Return and Cost of Capital
• Regulated Utility’s return is closely tied to the target cost capital set by regulators
• Long-term forecasts
5 Methods of Estimating Cost of Capital
1) The build-up method
2) Discounted Cash Flow Model (single stage and multi stage model)
3) Capital Asset Pricing Model (CAPM)
4) Modified CAPM model
5) Fama French 3 Factor Model
21
34453_072013
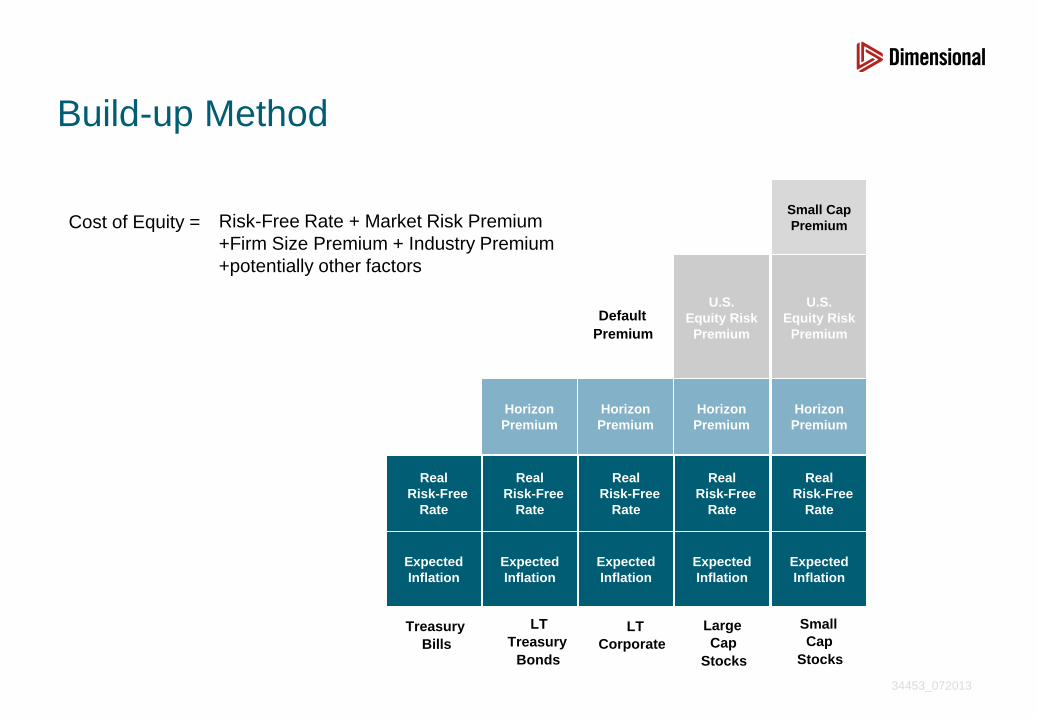
Build-up Method
Treasury
Bills
LT
Treasury
Bonds
LT
Corporate
Bonds
Default
Premium
Large
Cap
Stocks
Small
Cap
Stocks
Small Cap
Premium
U.S.
Equity Risk
Premium
Horizon
Premium
Real
Risk-Free
Rate
Expected
Inflation
Real
Risk-Free
Rate
Expected
Inflation
Real
Risk-Free
Rate
Expected
Inflation
U.S.
Equity Risk
Premium
Horizon
Premium
Real
Risk-Free
Rate
Expected
Inflation
Horizon
Premium
Real
Risk-Free
Rate
Expected
Inflation
Horizon
Premium
Risk-Free Rate + Market Risk Premium
+Firm Size Premium + Industry Premium
+potentially other factors
Cost of Equity =
34453_072013
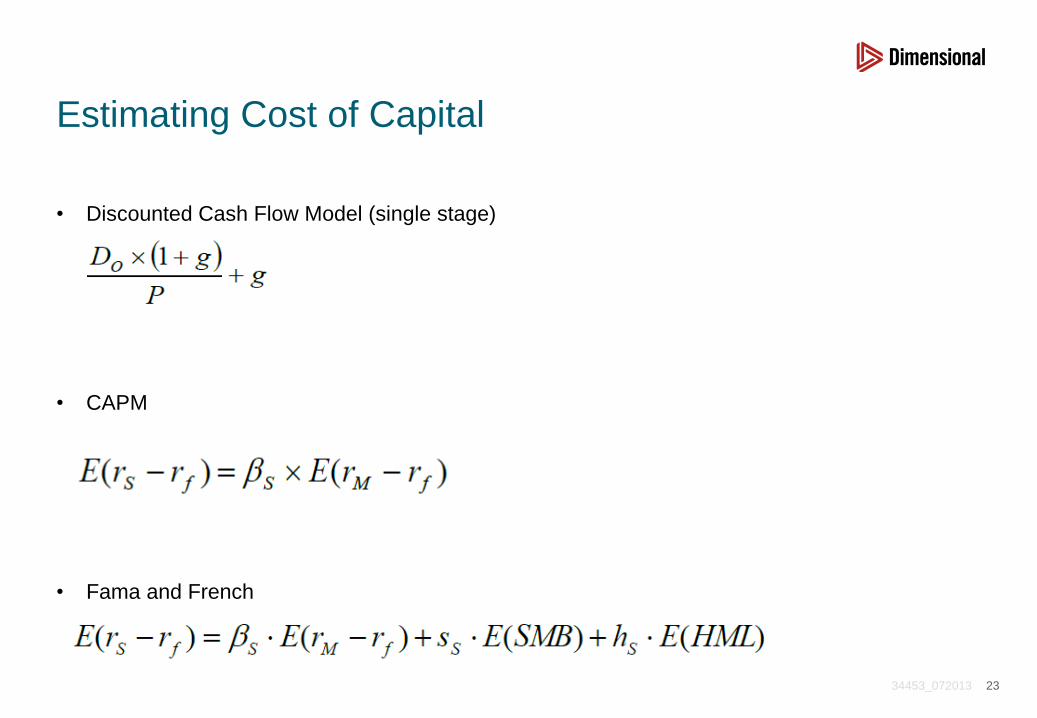
Estimating Cost of Capital
• Discounted Cash Flow Model (single stage)
• CAPM
• Fama and French
23
34453_072013 Pastor and Stambaugh (1997), Costs of Equity from Factor Based Models. NBER Working paper.
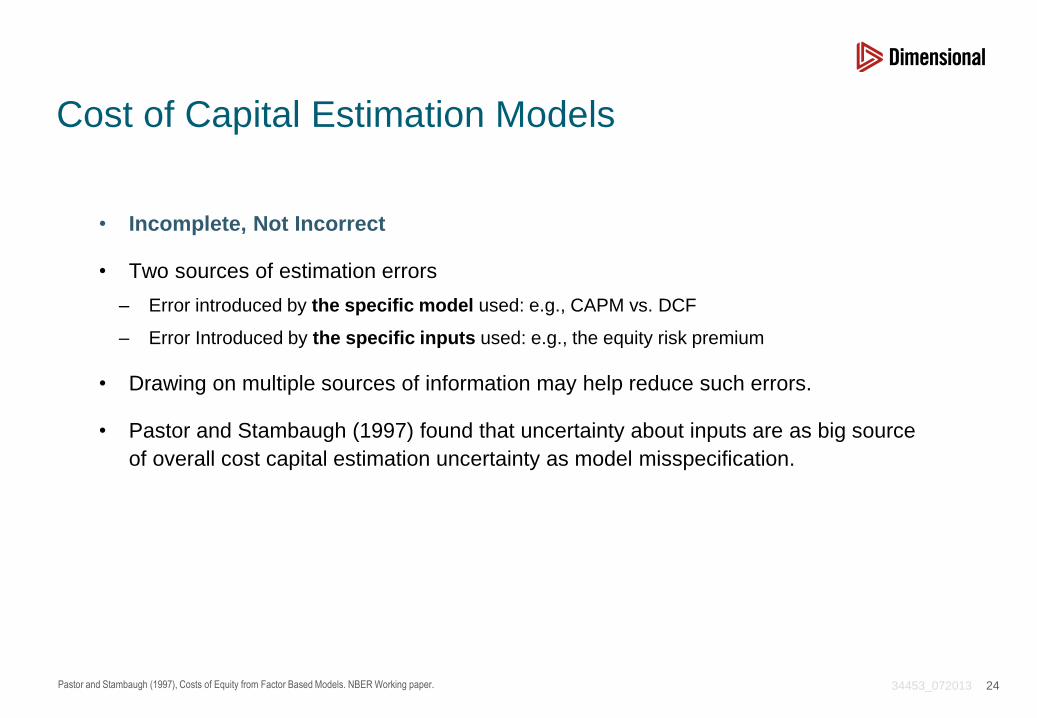
Cost of Capital Estimation Models
• Incomplete, Not Incorrect
• Two sources of estimation errors
– Error introduced by the specific model used: e.g., CAPM vs. DCF
– Error Introduced by the specific inputs used: e.g., the equity risk premium
• Drawing on multiple sources of information may help reduce such errors.
• Pastor and Stambaugh (1997) found that uncertainty about inputs are as big source
of overall cost capital estimation uncertainty as model misspecification.
24
34453_072013
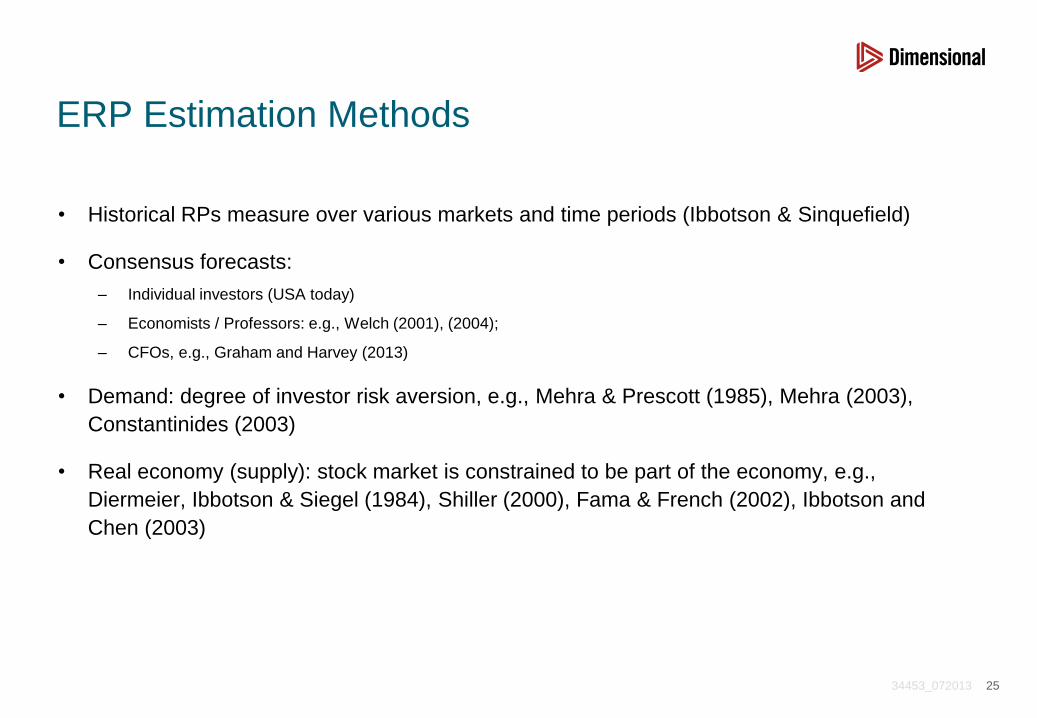
ERP Estimation Methods
• Historical RPs measure over various markets and time periods (Ibbotson & Sinquefield)
• Consensus forecasts:
– Individual investors (USA today)
– Economists / Professors: e.g., Welch (2001), (2004);
– CFOs, e.g., Graham and Harvey (2013)
• Demand: degree of investor risk aversion, e.g., Mehra & Prescott (1985), Mehra (2003),
Constantinides (2003)
• Real economy (supply): stock market is constrained to be part of the economy, e.g.,
Diermeier, Ibbotson & Siegel (1984), Shiller (2000), Fama & French (2002), Ibbotson and
Chen (2003)
25
34453_072013 Source: Ibbotson Associates (2013)
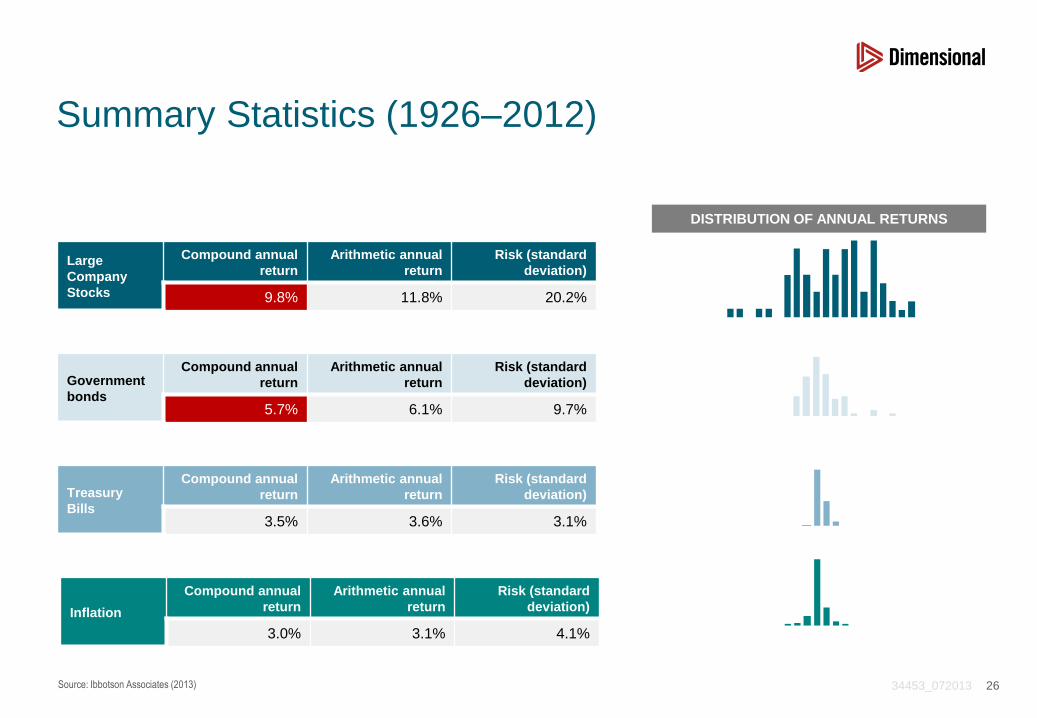
Summary Statistics (1926–2012)
26
DISTRIBUTION OF ANNUAL RETURNS
Large
Company
Stocks
Compound annual
return
Arithmetic annual
return
Risk (standard
deviation)
9.8% 11.8% 20.2%
Government
bonds
Compound annual
return
Arithmetic annual
return
Risk (standard
deviation)
5.7% 6.1% 9.7%
Inflation
Compound annual
return
Arithmetic annual
return
Risk (standard
deviation)
3.0% 3.1% 4.1%
Treasury
Bills
Compound annual
return
Arithmetic annual
return
Risk (standard
deviation)
3.5% 3.6% 3.1%
34453_072013
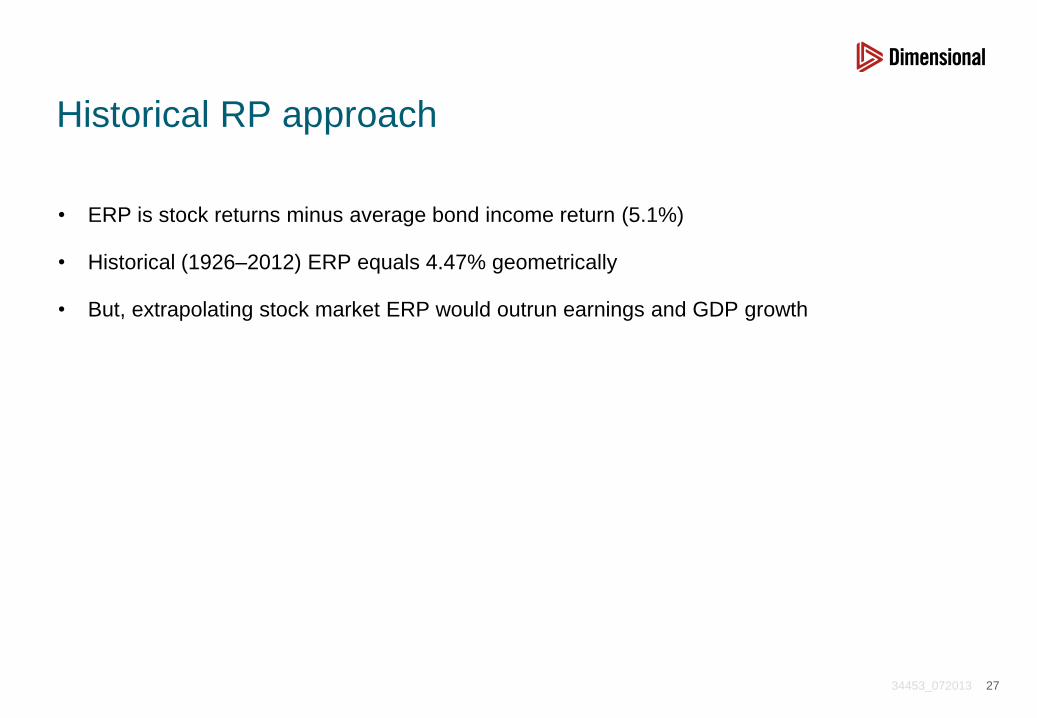
Historical RP approach
• ERP is stock returns minus average bond income return (5.1%)
• Historical (1926–2012) ERP equals 4.47% geometrically
• But, extrapolating stock market ERP would outrun earnings and GDP growth
27
34453_072013
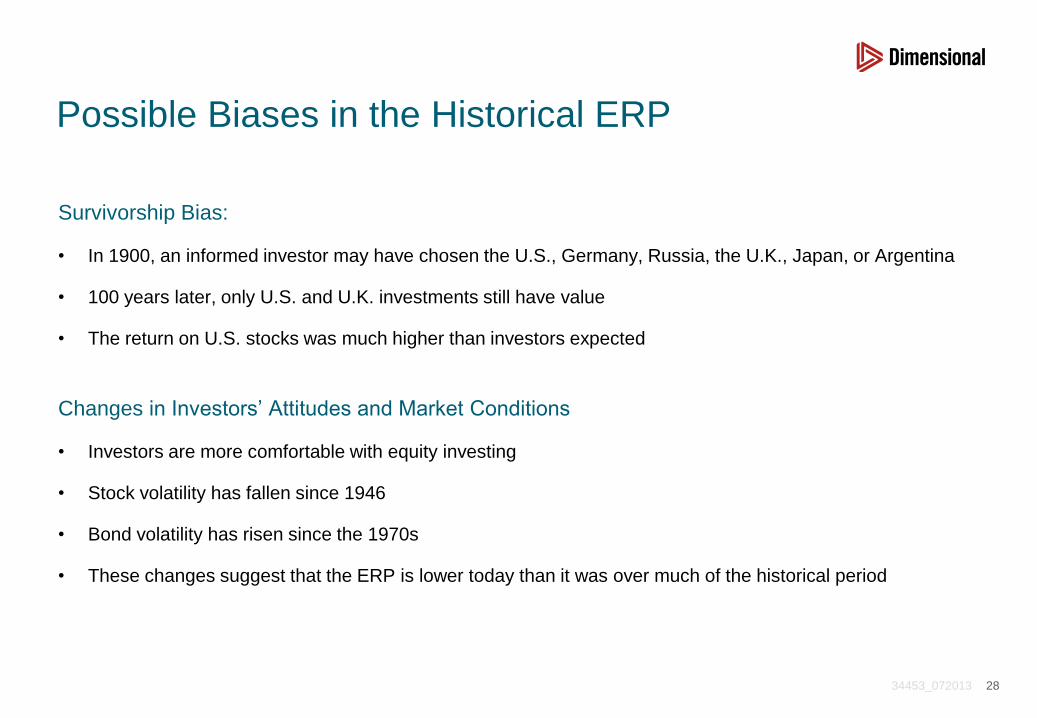
Possible Biases in the Historical ERP
Survivorship Bias:
• In 1900, an informed investor may have chosen the U.S., Germany, Russia, the U.K., Japan, or Argentina
• 100 years later, only U.S. and U.K. investments still have value
• The return on U.S. stocks was much higher than investors expected
Changes in Investors’ Attitudes and Market Conditions
• Investors are more comfortable with equity investing
• Stock volatility has fallen since 1946
• Bond volatility has risen since the 1970s
• These changes suggest that the ERP is lower today than it was over much of the historical period
28
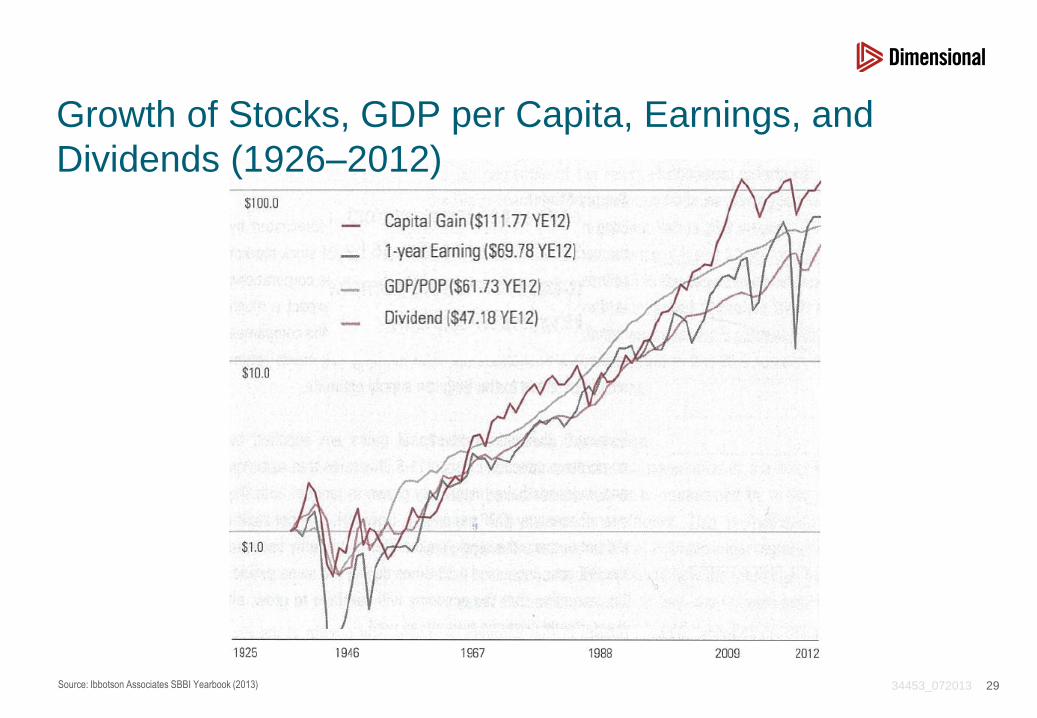
34453_072013 Source: Ibbotson Associates SBBI Yearbook (2013) 29
Growth of Stocks, GDP per Capita, Earnings, and
Dividends (1926–2012)

34453_072013
The Supply Of Stock Market Returns
• Stock market participates with earnings and real economy growth
• Supply factors include inflation, earnings, PE ratios, dividends and payout ratios,
and GDP per capita
• Retained corporate cash can be used for dividend payouts, share repurchases,
acquisitions, etc
• Assumes Miller & Modigliani, constant ERP, inflation pass-thru, and current fair-
priced PE ratio
30
34453_072013
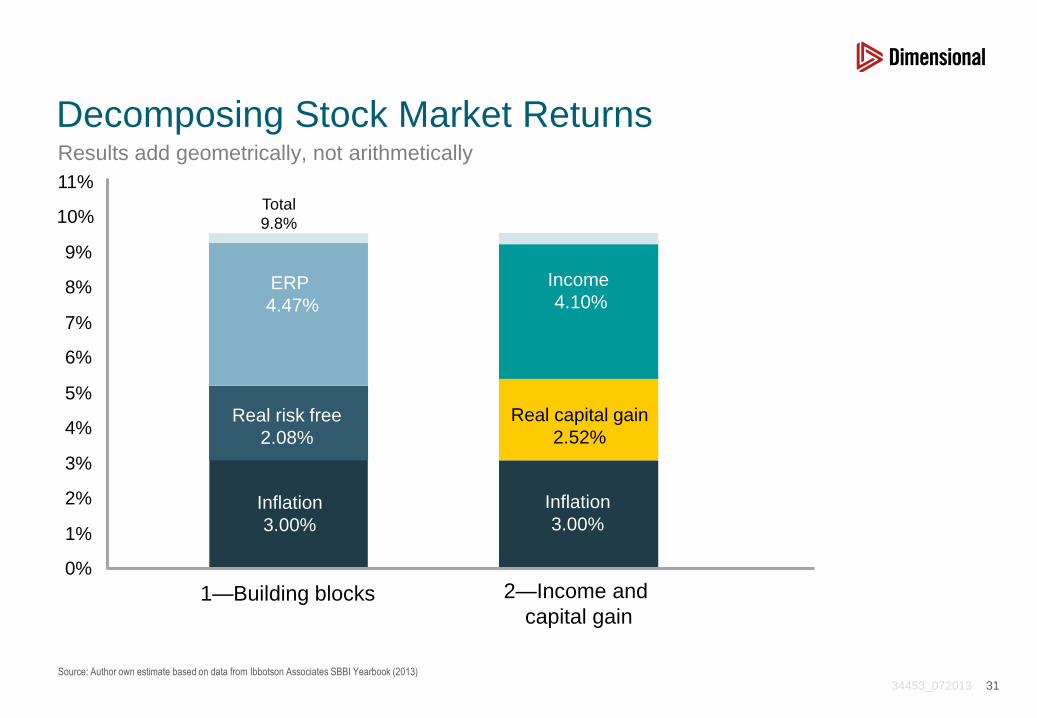
Decomposing Stock Market Returns Results add geometrically, not arithmetically
31
0%
1%
2%
3%
4%
5%
6%
7%
8%
9%
10%
11%
1—Building blocks 2—Income and
capital gain
Inflation
3.00%
Real risk free
2.08%
ERP
4.47%
Real capital gain
2.52%
Income
4.10%
Inflation
3.00%
Source: Author own estimate based on data from Ibbotson Associates SBBI Yearbook (2013)
Total
9.8%
34453_072013 Source: Author own estimate based on data from Ibbotson Associates SBBI Yearbook (2013)
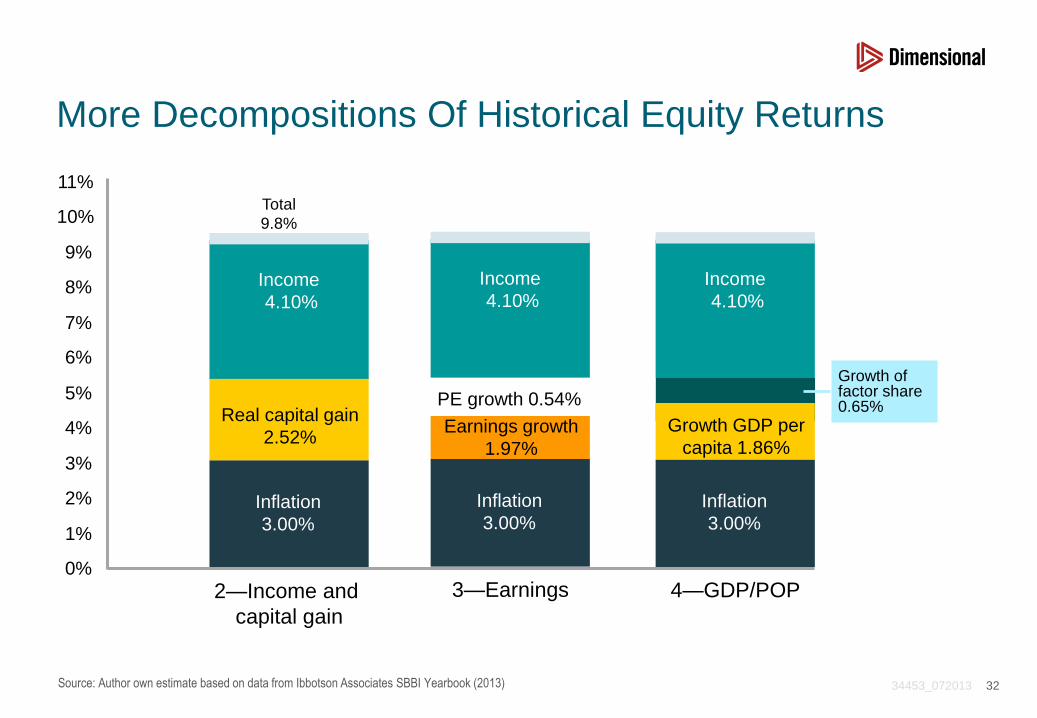
More Decompositions Of Historical Equity Returns
32
0%
1%
2%
3%
4%
5%
6%
7%
8%
9%
10%
11%
2—Income and
capital gain
Real capital gain
2.52%
Income
4.10%
Inflation
3.00%
3—Earnings
Earnings growth
1.97%
Income
4.10%
Inflation
3.00%
4—GDP/POP
Growth GDP per
capita 1.86%
Income
4.10%
Inflation
3.00%
Growth of factor share 0.65% PE growth 0.54%
Total
9.8%
34453_072013 Source: Ibbotson Associates SBBI Yearbook (2013)
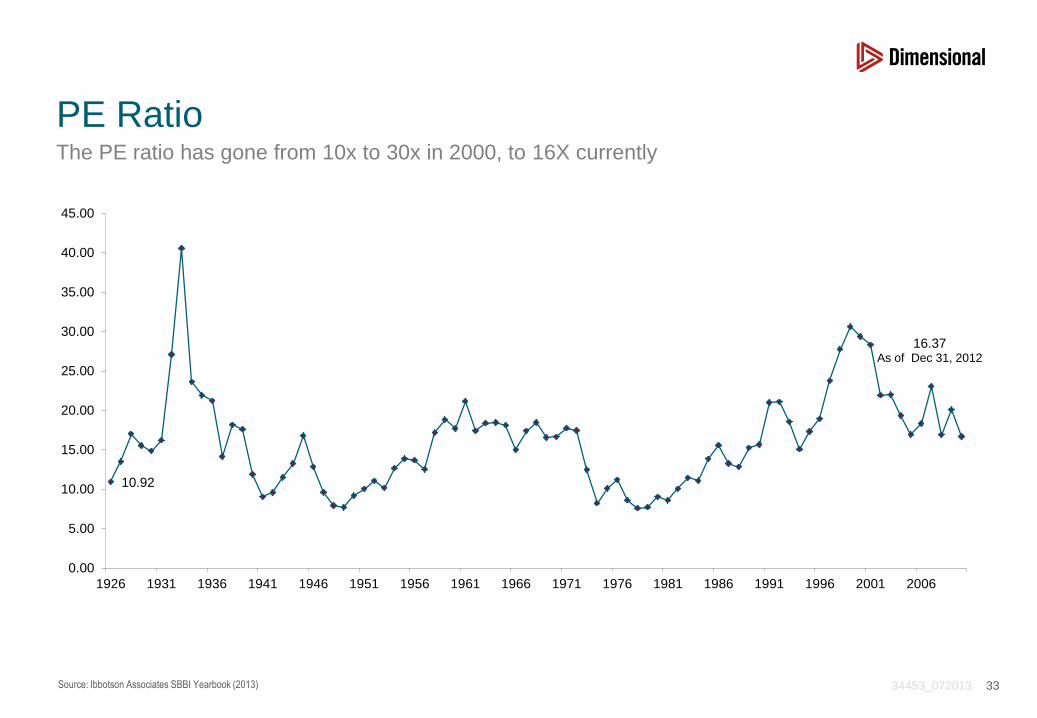
PE Ratio The PE ratio has gone from 10x to 30x in 2000, to 16X currently
33
10.92
16.37 As of Dec 31, 2012
0.00
5.00
10.00
15.00
20.00
25.00
30.00
35.00
40.00
45.00
1926 1931 1936 1941 1946 1951 1956 1961 1966 1971 1976 1981 1986 1991 1996 2001 2006
34453_072013 Source: Author own estimate based on data from Ibbotson Associates SBBI Yearbook (2013)
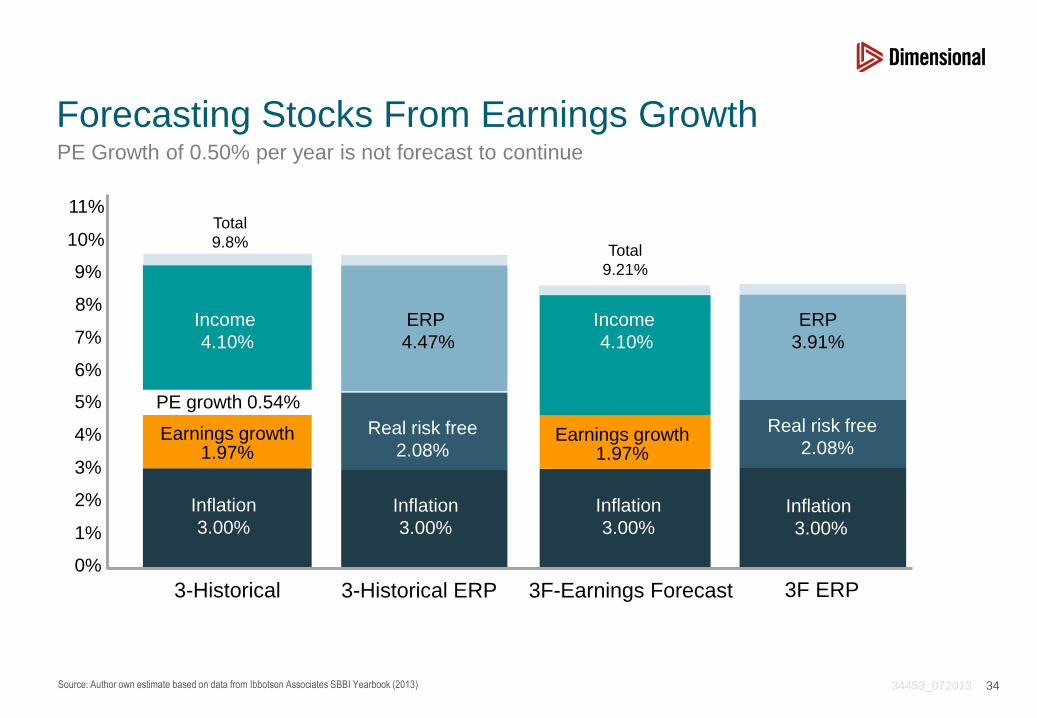
Forecasting Stocks From Earnings Growth PE Growth of 0.50% per year is not forecast to continue
34
0%
1%
2%
3%
4%
5%
6%
7%
8%
9%
10%
11%
3-Historical
Inflation
3.00%
Earnings growth 1.97%
PE growth 0.54%
Income
4.10%
3F ERP
Real risk free
2.08%
ERP
3.91%
Inflation
3.00%
3-Historical ERP
Inflation
3.00%
Real risk free
2.08%
ERP
4.47%
3F-Earnings Forecast
Inflation
3.00%
Income
4.10%
Earnings growth 1.97%
Total
9.8% Total
9.21%
34453_072013 *Arnott & Asness (2003) disagree, claiming that corporations waste retained earnings.
The Dividend Yield Approach
• Add the current dividend yield (2.14%) to future dividend growth
• But Miller & Modigliani show that lower payouts do not affect total returns*
• Future EPS and dividend growth will be higher than past growth because of low dividend
payouts and the high current PE ratio
35
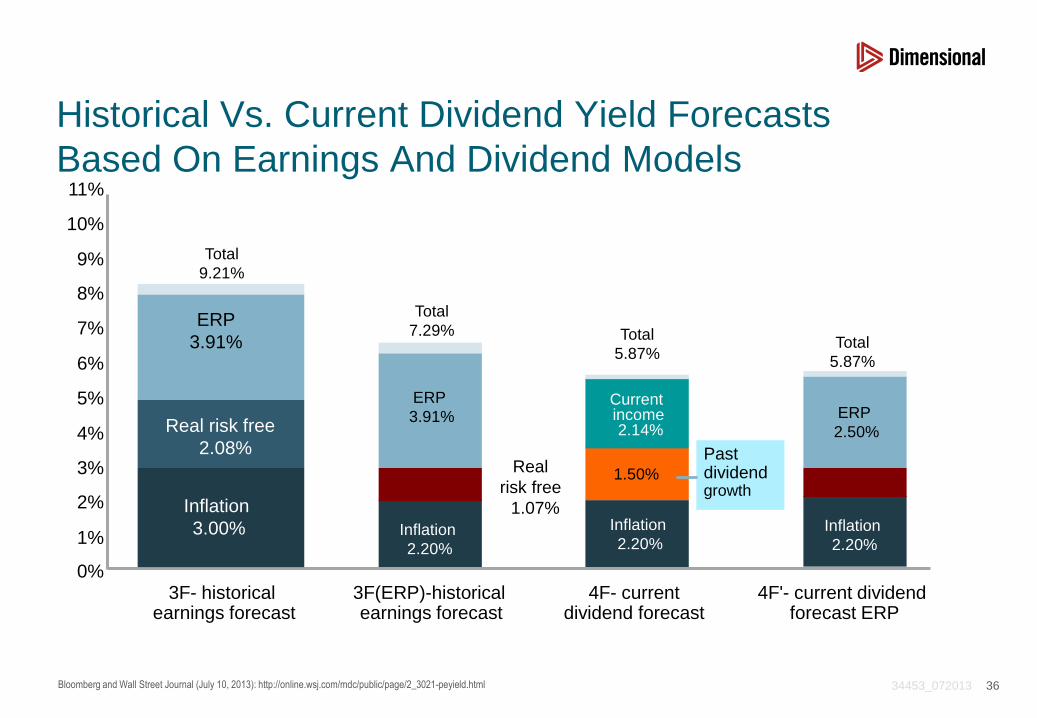
34453_072013 Bloomberg and Wall Street Journal (July 10, 2013): http://online.wsj.com/mdc/public/page/2_3021-peyield.html
Historical Vs. Current Dividend Yield Forecasts
Based On Earnings And Dividend Models
36
0%
1%
2%
3%
4%
5%
6%
7%
8%
9%
10%
11%
3F- historical earnings forecast
3F(ERP)-historical earnings forecast
4F- current dividend forecast
4F'- current dividend forecast ERP
Past dividend growth
Real
risk free
1.07%
ERP
3.91%
1.50%
Current income 2.14%
Inflation
2.20%
Inflation
2.20%
ERP
2.50%
Inflation
2.20%
Total
7.29% Total
5.87% Total
5.87%
Total
9.21%
Real risk free
2.08%
ERP
3.91%
Inflation
3.00%
34453_072013 Source: Graham and Harvey (2013)
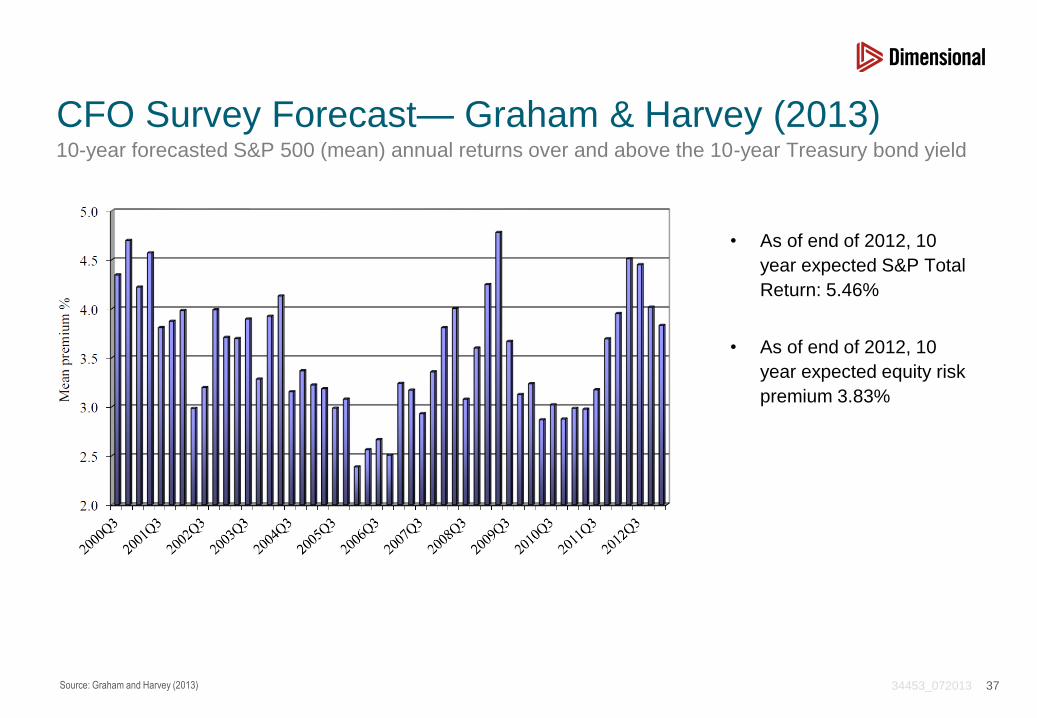
CFO Survey Forecast— Graham & Harvey (2013)
10-year forecasted S&P 500 (mean) annual returns over and above the 10-year Treasury bond yield
• As of end of 2012, 10
year expected S&P Total
Return: 5.46%
• As of end of 2012, 10
year expected equity risk
premium 3.83%
37
34453_072013 Source: Author own estimate based on data from Ibbotson Associates SBBI Yearbook (2013)
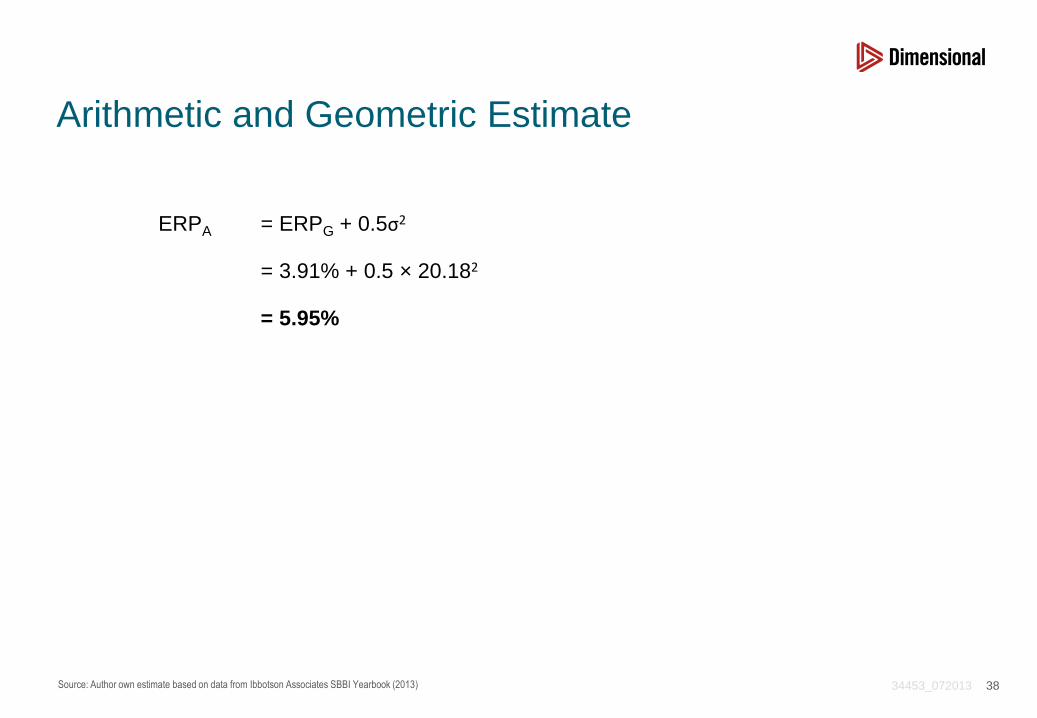
Arithmetic and Geometric Estimate
ERPA = ERPG + 0.5σ2
= 3.91% + 0.5 × 20.182
= 5.95%
38
34453_072013
Summary
• Infrastructure should be treated as an separate asset class
• Infrastructure investments has lower risk and returns than traditional equities. Return is tied to
long-term cost of equity targets
• Long-term strategic portfolios should allocate to infrastructure, particularly for investors on the
lower to modest risk levels.
• The dedicated allocation to Infrastructure tends to be around 3-5% (in addition to existing weights
in the broad equity portfolios)
Cost of Capital
• Many potential methods. No method is incorrect; only incomplete methods
• Estimation error in inputs needs to be considered, in particularly equity risk premium
39
34453_072013 40
Ang, Andrew and Geert Bekaert. 2001. “Stock Return Predictability: Is It There?” Columbia University and NBER Working Paper.
Campbell, John Y. and Robert J. Shiller. 2001. “Valuation Ratios and the Long Run Stock Market Outlook: An Update”, NBER Working
Paper, No.8221.
Diermeier, Jeffrey J., Roger G. Ibbotson, and Laurance B. Siegel. 1984. “The Supply for Capital Market Returns,” Financial Analyst Journal,
vol. 40, no. 2 (March/April): 2-8.
Fama, Eugene F. and Kenneth R. French. 2002. “The Equity Risk Premium,” Journal of Finance, vol. 57, no. 2 (April): 637-659.
Graham, John R. and Campbell R. Harvey. 2013. “Expectations of Equity Risk Premia, Volatility and Asymmetry from a Corporate Finance
Perspective,” Working Paper, Fuqua School of Business, Duke University.
Ibbotson Associates. 2013. Stocks, Bonds, Bills, and Inflation 2001 Yearbook, Ibbotson Associates, 2013.
Ibbotson, Roger G., and Rex A. Sinquefield. 1976a. “Stocks, Bonds, Bills, and Inflation: Year-By Year Historical Returns (1926-1974),” The
Journal of Business, vol.49, no. 1 (January), 11-47.
Ibbotson, Roger G., and Rex A. Sinquefield. 1976b. “Stocks, Bonds, Bills, and Inflation: Simulations of Future (1976-2000),” The Journal of
Business, vol. 49, no. 3 (July): 313-338.
Mehra, Rajnish, and Edward Prescott. 1985. “The Equity Premium: A Puzzle,” Journal of Monetary Economics, vol. 15, no. 2, 145-161.
Miller, Merton, and Franco Modigliani. 1961. “ Dividend policy, Growth and the Valuation of Shares,” Journal of Business, vol. 34, no. 4
(October): 411-433.
Shiller, Robert J. 2000. Irrational Exuberance, Princeton University Press, Princeton, NJ.
Welch, Ivo. 2000. "Views of Financial Economists on the Equity Premium and Other Issues." The Journal of Business, vol. 73, no. 4
(October): 501-537.
References

34453_072013
Disclaimer
41
This presentation is strictly for information purposes only and shall not be used for any other purposes. All information in this presentation is
given in good faith and without any warranty and is not intended to provide professional, investment or any other type of advice or
recommendation and does not take into account the particular investment objectives, financial situation or needs of individual recipients.
Before acting on any information in this presentation, you should consider whether it is suitable for your particular circumstances and, if
appropriate, seek professional advice. Dimensional does not accept any responsibility and cannot be held liable for any person’s use of or
reliance on the information and opinions contained herein.