e-mail: mannin@ibbotson -...
TRANSCRIPT

Fama-French and Small Company Cost of Equity Calculations
This article appeared in the March 1997 issue of Business Valuation Review.
Michael Annin, CFASenior Consultant
Ibbotson Associates225 N. Michigan Avenue, Suite 700
Chicago, IL 60601-7676312.616.7892
E-mail: [email protected]

Abstract
This paper explores the ability of CAPM and Fama-French to adequately reflect size in
cost of equity on a stable basis across time. CAPM does not appear to accurately reflect size in
cost of equity. In the most recent time period, CAPM actually predicts a positive relationship
between size and return. Fama-French appears to reflect size in cost of equity both in the most
recent time period and historically. Given that CAPM is widely used by valuation professionals,
it is important to note the low betas that CAPM is producing for small companies for the most
recent sixty month time period.
1
Fama-French and Small Company Cost of Equity Calculations
Michael Annin
Cost of Equity Model Basics
When practitioners select a cost of equity model, they are seeking a model that is
generally accepted by other practitioners, easy to use, accurate, and relatively stable over time.
Cost of equity models that exhibit these characteristics are rare.
Because cost of equity is a concept that is not readily observable, it is open to a fair
amount of controversy. Therefore, people who work with cost of equity seek to use models that
are commonly used to help reduce this element of controversy.
Cost of equity models must also be easily employable to be used by practitioners. A
model can make perfect sense in theory, but if it isn’t easily employable in practical situations,
the model will be of limited usefulness to practitioners.
Of course, to be useful in practical situations, a cost of equity model must produce
results that are both accurate and stable over time. Although cost of equity is not something that
is readily observable, if a cost of equity model produces results such as negative numbers or
numbers over 100%, the model is clearly failing. While no model will work in every instance, in
general the model should produce sensible results on a consistent basis.
Cost of capital is a long-term concept. The intent is to produce a figure that will
adequately compensate equity investors over a long period of time. Although a company’s cost
of capital will change over time, the cost of capital for a company or an industry should be
relatively stable from period to period unless there has been some dramatic structural reason for
the change. Companies fortunes will rise and fall over time, but month to month there should be
little change in cost of capital numbers.

2
The Capital Asset Pricing Model
The capital asset pricing model (CAPM) is still widely used by many practitioners.
Although the theoretical problems with CAPM have been well documented, it is still one of the
more common cost of equity approaches employed for valuation purposes.
CAPM is heavily used in the marketplace for three of the four reasons that have been
outlined above. CAPM is widely taught in most undergraduate corporate finance classes. Even
though it’s weaknesses have been documented, practitioners are typically left with no easy
alternative to replace it with. Therefore, almost by default it is generally accepted.
One of the biggest reasons why CAPM has remained so popular is its ease of use. In
comparison to most other cost of equity models, CAPM is extremely easy to employ. In it’s most
basic form, the capital asset pricing model is stated as:
E R R ERPi f i( ) ( * )= + b
In words, CAPM states that the expected return on a security is equal to the risk-free rate plus the
equity risk premium multiplied by the company’s beta. All one needs is the equity risk premium,
the risk-free rate, and a determination of beta. Both the equity risk premium and the risk-free
rate can be looked up in financial publications. Calculating betas is a straight-forward ordinary
least squares regression, but there also exist a number of different beta services where beta can
also be looked up.
More often than not CAPM will produce numbers that appear to be reasonable. If one
assumes a risk-free rate of around six percent and an equity risk premium of around seven
percent, CAPM produces a cost of equity of thirteen percent for a company having a beta of 1.
When a model produces an average cost of equity of 13%, it is difficult to state that the model is
producing inaccurate results.
3
Exhibit 1 contains a graph of CAPM calculations for approximately 3,500 companies
included in Ibbotson Associates’ Cost of Capital Quarterly publication. CAPM produces a bell
shaped distribution with costs of equity centered around thirteen to fourteen percent. Graphs
such as the one depicted in Exhibit 1 lead people to presume that CAPM is in fact accurate when
based on a large sample of companies.
This combination of factors has lead to CAPM being one of the most popular cost
of equity models in use by practitioners. But is CAPM stable? In particular, is CAPM
stable for all but the smallest companies?
Size, Expected Return and CAPM
There are many areas in the field of finance that are open to debate. One of the few areas
where there seems to be a general consensus is the relationship between company size, as
measured by equity capitalization, and return. Historically, small capitalization companies have
outperformed large capitalization companies over an extended time period.
The relationship between size and return was first noted by Banz (1981). Other studies
have been performed that have concluded that over long periods of time, small companies will
out-perform large companies. If this is the case, then smaller companies should have higher
betas than larger companies in a general sense. If one looks at long periods of time, this is the
case.
Berk (1995) argues that smaller firms should be expected to have higher expected returns
because they have higher risk. Berk states that if one holds operating cash flows constant
between two companies with differing levels of risk, the company with greater risk will have a
lower market value of equity, and a higher expected return. Using this rationale, one should
expect smaller firms to have higher cost of equity than larger firms.

4
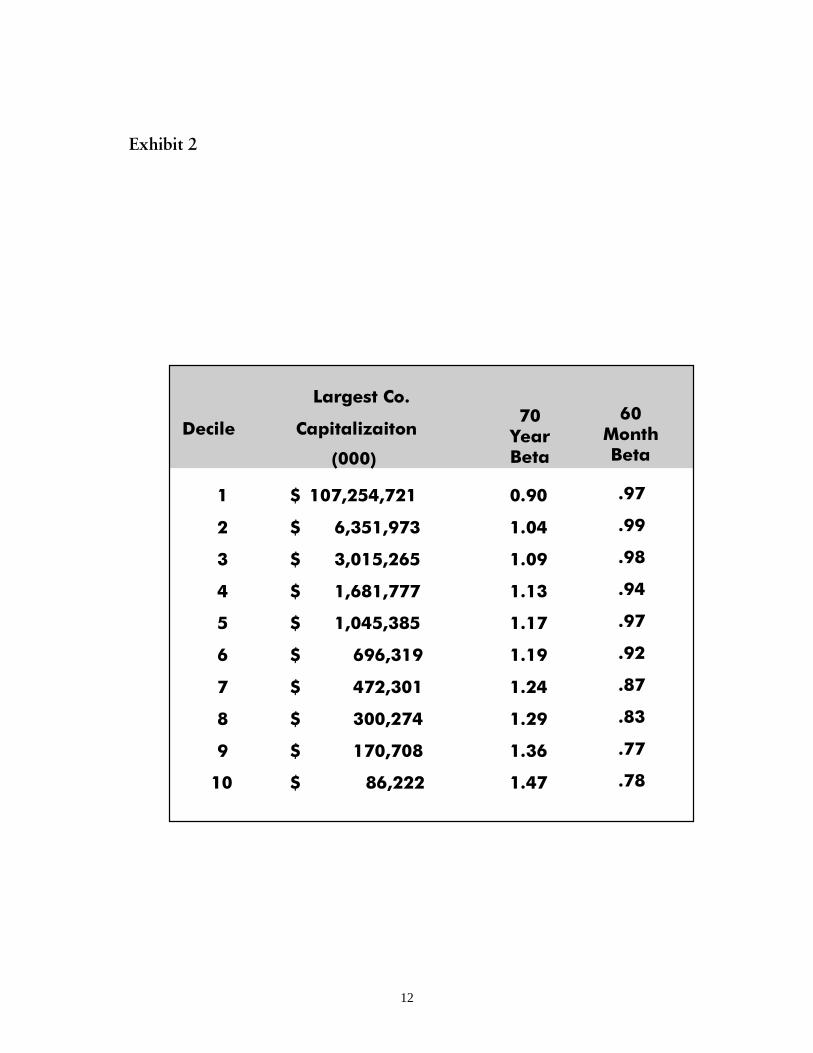
Exhibit 2 shows the portfolio betas for NYSE deciles where betas are computed back to
1926. Exhibit 2 shows a relationship between size and expected return on a historical basis.
Over this time period CAPM indicates that small companies should have higher costs of equity
than large companies. On an actual basis, small companies have outperformed large companies.
In fact, CAPM actually under-predicts small company returns over this time period. It is this
type of analysis that has lead to the development of the small stock premium that is used as an
additional term for CAPM cost of equity calculations.
Data for the most recent time period shows a completely different result. If decile betas
are calculated for the most recent sixty month period, the deciles containing the smaller NYSE
companies actually have the lowest betas. In short, the far right column of Exhibit 2 shows
CAPM results that are the opposite one would expect with betas declining with company size for
the sixty month time period ending with December, 1995. Because CAPM is a single factor
model, low betas translate into low CAPM costs of equity.
Exhibit 2 is restricted to all NYSE companies which comprise most of the largest
companies in the market. If the analysis is expanded to a broader database such as the 3,500
companies included in Ibbotson Associates’ Cost of Capital Quarterly (CCQ), the results are
more striking. The advantage of using the CCQ database is that it includes a number of very
small companies trading on the NYSE, AMEX and NASDAQ.
When the companies from the CCQ database are organized into portfolios by equity
capitalization, the graph in Exhibit 3 is the result. The graph clearly shows a positive
relationship between expected return and size -- a result that is contrary to what the long-term
historical evidence indicates. What is happening here? Are investors actually requiring a lower
return on their investment for investing in extremely small companies or is the CAPM providing
artificially low numbers for these small companies?
5
In Exhibit 4, the NYSE decile data is presented on a rolling sixty month basis. The
graph shows the fluctuation of the first, fifth, and tenth deciles over time. The largest companies
are included in the first decile. The smallest companies are included in the tenth decile. Exhibit
4 clearly shows the movement of small company betas over this time period.
The most alarming result of this analysis is that practitioners using betas for all but the
largest capitalization companies will be potentially understating the cost of equity using CAPM.
In the aggregate, CAPM is understating cost of equity for small companies. For the period ended
December 1995, the smaller the company, the greater the mismeasurement. Clearly, CAPM is
failing to account for size in a stable fashion.
Fama-French Model Cost of Equity Model
More recently Fama and French (1994) have proposed a cost of equity model that is an
extension of CAPM. The Fama-French model is a multiple regression model that incorporates
both size and financial distress in the regression equation. The Fama-French model is typically
stated as:
E R R ERP s SMB h HMLi f i i i( ) ( * ) ( * ) ( * )- = + +b
The Fama-French model is a multi-factor model that states that factors other than the movement
of the market and the risk-free rate impact security prices. Where CAPM states that security
prices are primarily tied to movement with the market, Fama-French have included size and
book-to-market-equity in their equation.
The size factor is the small-minus-big premium (SMB). The book-to-market-equity or
financial distress factor is the high-minus-low premium (HML). Size is measured by equity
capitalization. The Fama-French model anticipates a return premium for small capitalization
companies and for companies with a high book-to-market ratio.

6
In order to calculate the Fama-French cost of equity regression you need both the SMB
and HML premiums as well as the time series total returns for the portfolios of large and small
capitalization stocks and high and low book-to-market stocks.
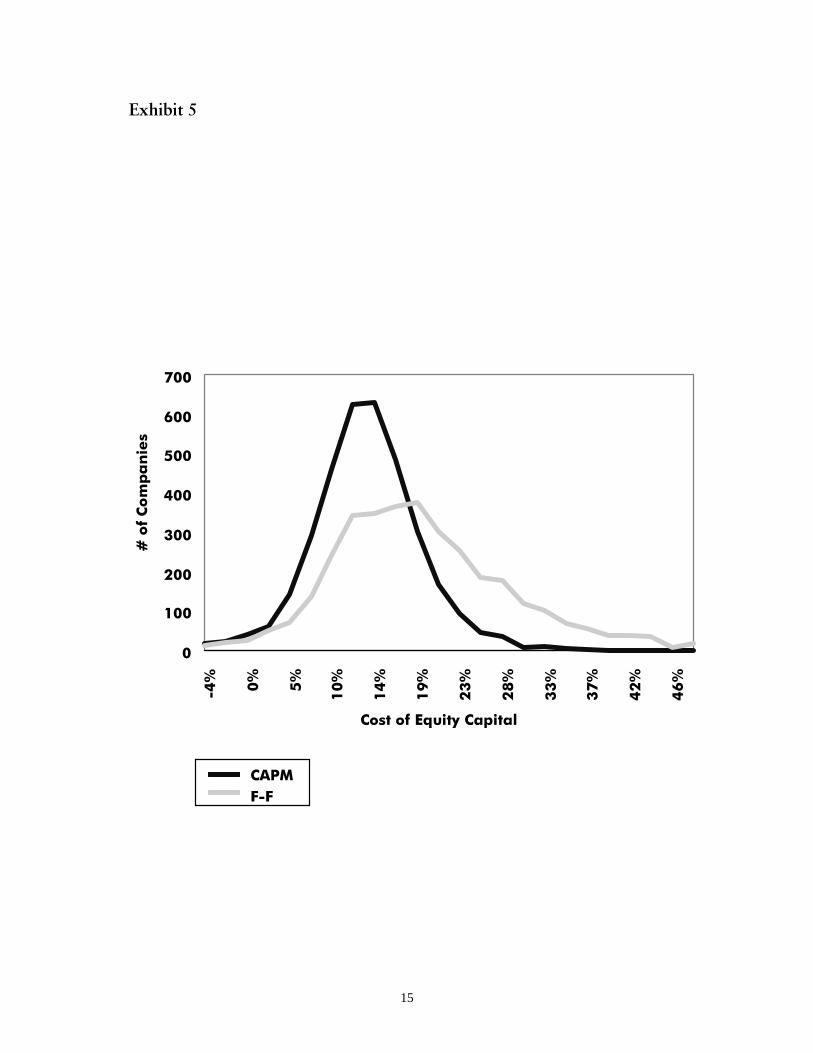
Exhibit 5 shows the distribution of cost of equity statistics for CAPM and Fama-French.
The results are interesting in that for the current time period Fama-French has a higher mean and
is skewed to the right. Some might find this intuitively appealing in that there are probably a lot
more companies where investors are demanding a high cost of equity as opposed to a low cost of
equity.
Fama-French and Small Company Cost of Equity
Given that Fama and French have included size as a factor in their equation, we thought
it would be useful to compare the Fama-French model to the same universe of companies that we
have calculated for CAPM. Exhibit 6 shows the thirty sized ranked CCQ portfolios under the
Fama-French model. Where CAPM showed a positive relationship between size and return,
Fama-French shows a negative relationship. Stated another way, for the most recent time period,
where CAPM fails to correct for size Fama-French appears to correct for size.
This is an interesting result, because if CAPM is less accurate than it appears for small
companies and has an obvious lack of stability for small companies, the Fama-French model
could be viewed as a viable alternative.
Fama-French and Cost of Equity Stability

7
The data for the sixty month time period ending with December 1995 seems to indicate
that the Fama-French cost of equity model corrects for company size. Does Fama-French correct
for size over an extended time period?
Because of the limited data history, it is difficult to test the Fama-French model for an
extended historical time period. Time series data for the size portfolios and the market-to-book
portfolios are only available back to 1963, making 60 month regressions possible back to 1968.
However, using the available data, both Fama-French and CAPM can be tested simultaneously
for approximately thirty years of history.
Given that the purpose of the analysis is to test the ability of CAPM and Fama-French to
properly account for size, we can hold a number of variables constant. In performing the
historical cost of equity calculations, we held the equity risk premium, SMB and HML premiums
constant. We also excluded the risk free rate from our calculations.
With this framework, we then accessed the Center for Research in Security Prices (CRSP) to
calculate cost of equity on a rolling sixty month basis back to 1968. Any company having a
minimum of 36 months of data at any point in time would be included in the sample.
Once the regressions have been performed, the companies are sorted by equity
capitalization by period and grouped into twenty portfolios. This allows for an easy comparison
of cost of equity methodologies across time. Exhibit 7 shows the twenty portfolios plotted in
equity capitalization v. cost of equity space for different historical time periods. During all of the
time period shown, Fama-French appears to be correcting for size. CAPM, however, appears to
properly reflect size in some years but not in others.
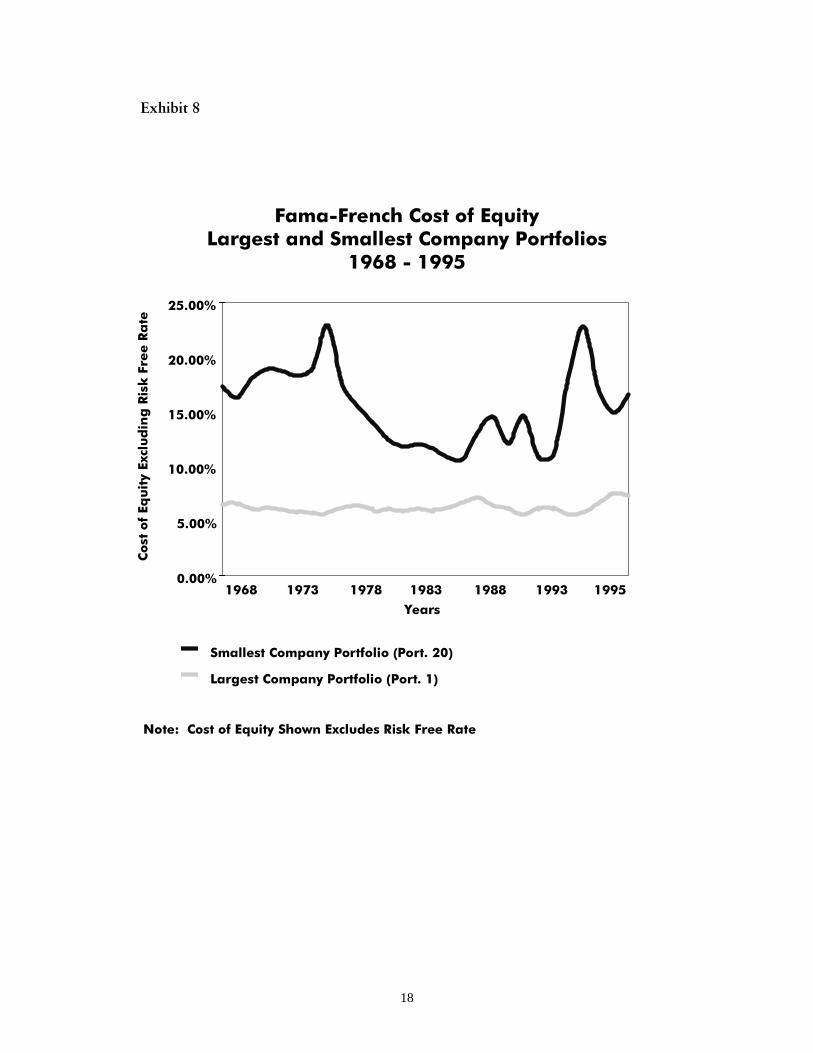
Exhibit 8 shows the portfolio average cost of equity for Fama-French for the largest
companies (Portfolio 1) and smallest companies (Portfolio 20) on a rolling basis through time. In
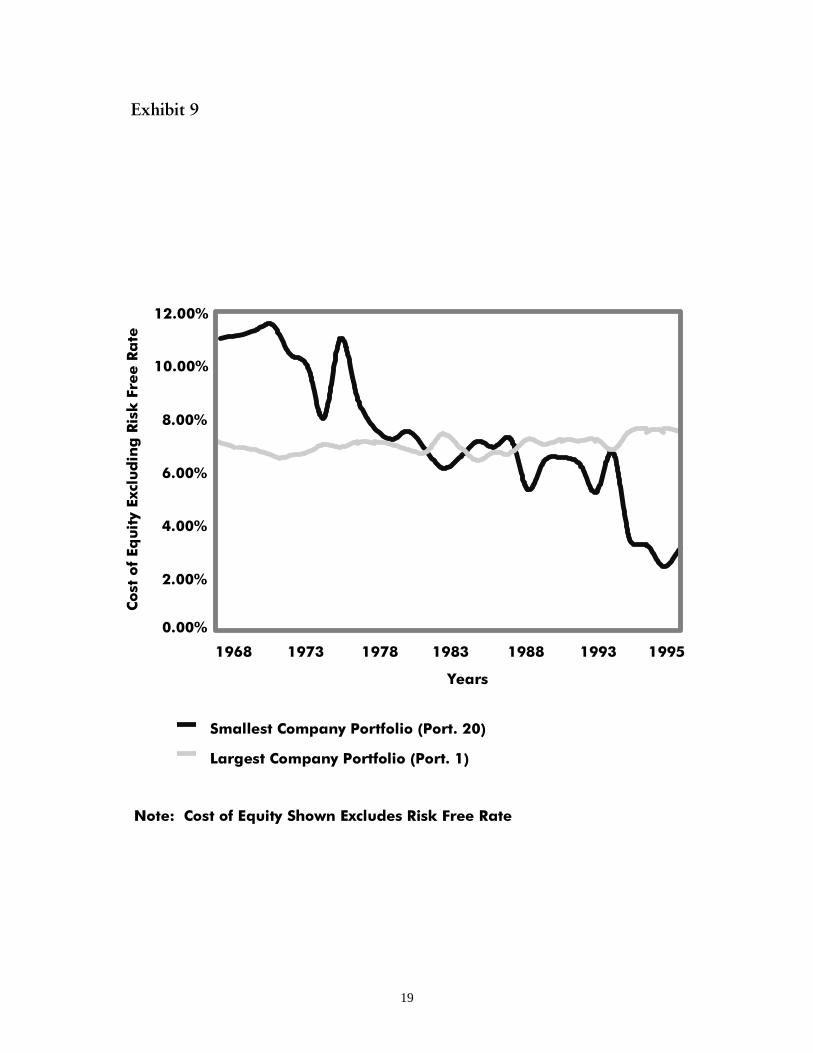
all periods Fama-French appears to correct for size. Exhibit 9 shows the same large company

8
and small company portfolios under CAPM. CAPM does not consistently correct for size over
this same time period.
When the smallest company portfolio is compared under CAPM and Fama-French, the
graph in Exhibit 10 is the result. For all time periods Fama-French is greater than CAPM. This
is a result that we should expect because the CAPM numbers do not have a size premium
incorporated in them. However the Fama-French numbers do not exhibit the same general
decline in value over the twenty-eight year time period.
Implications for Practitioners
What does all of this mean? This article began by addressing four key factors that
practitioners are seeking from cost of equity models. In addition to being generally accepted, a
cost of equity model should be easy to use, accurate, and relatively stable over time.
While CAPM is generally accepted and easy to use, from a micro-capitalization company
standpoint, the model appears to be failing from an accuracy and stability standpoint. In general,
CAPM is under-reporting cost of equity for all but the largest companies during the current time
period. The smaller the company, the greater the mismeasurement.
All cost of equity models are just that -- models. Any model that attempts to explain a
complex financial concept such as cost of equity will inevitably fail for different companies in
different situations. However, when cost of equity figures for different models are averaged over
a large number of companies, the hope is that a sensible answer will emerge. This is why
comparing and averaging costs of equity for companies in an industry will often provide a more
realistic assessment of an individual company’s cost of equity.

9
The alarming thing about CAPM in the most recent time period is that the model’s flaw
does not disappear when averaged across a large number of small companies. The implication is
that practitioners should compare their small company betas to similar large capitalization
companies or to industry averages to sanity check them.
The Fama-French model appears to correct for size. In this regard, Fama-French would
be an improvement over CAPM for small companies. However, from this analysis, it is not
possible to say the Fama-French model adds greater stability to the cost of equity process. The
volatility of cost of equity figures for the smallest companies still remains quite high.
In addition, it is difficult to characterize Fama-French as generally accepted or easy to
use. This can change however. To make it easy to use, all one needs is three beta type figures as
opposed to a single factor for CAPM. The Fama-French model is relatively young from an
academic stand-point. Time will tell if it becomes generally accepted.
10
References
Banz, R. F., “The Relation Between Return and Market Value of Common Stocks,” Journal ofFinancial Economics, 1981, vol. 9, pp. 3-18.
Berk, J. B., “A Critique of Size-Related Anomalies,” Review of Financial Studies, 1995, vol. 8,pp. 275-286.
Cost of Capital Quarterly, 1995 Yearbook, Ibbotson Associates.
Fama, E. F., and K. R. French, “Industry Costs of Equity,” University of Chicago Working Paper396, 1994.
Stocks, Bonds, Bills and Inflation, 1996 Yearbook, Ibbotson Associates.

11
&RVW�RI�(TXLW\�&DSLWDO
�
���
���
���
���
���
���
���
���
��
��
���
���
���
���
���
���
���
���
���
��RI�&RPSDQLHV
([KLELW��
12
/DUJHVW�&R�
'HFLOH &DSLWDOL]DLWRQ��<HDU%HWD
� ������������� � ����
� ��������������� � ����
� ��������������� � ����
� ��������������� � ����
� ��������������� � ����
� ���������������� � ����
� ���������������� � ����
� ���������������� � ����
� ���������������� � ����
�� ����������������� � ����
�����
([KLELW��
��0RQWK%HWD
���
���
���
���
���
���
���
���
���
���

13
([KLELW��
��
���
����
������
�������
��������
���� ���� ���� ���� ���� ����
3RUWIROLR�/HYHUHG�%HWD
$YH
UDJH�&DSLWDOL]D
WLRQ������

14
5ROOLQJ����0RQWK�1<6(�'HFLOH�%HWDV
'HFLOH�� 'HFLOH�� 'HFLOH���
([KLELW��
15
�
���
���
���
���
���
���
���
��� ��
��
���
���
���
���
���
���
���
���
���
&RVW�RI�(TXLW\�&DSLWDO
��RI�&RPSDQLHV
&$30)�)
([KLELW��

16
([KLELW��
&DSLWDOL]DWLRQ�Y��)DPD�)UHQFK�
��
���
����
������
�������
��������
��� ��� ��� ��� ��� ��� ���
&RVW�RI�(TXLW\
$YH
UDJH�&DSLWDOL]D
WLRQ������
3RSXODWLRQ�LV�,EERWVRQ�$VVRFLDWHV·�&&4������<HDUERRN�FRPSDQLHV

17
����
��
���
����
������
�������
��������
����������
�����������
�� �� ��� ��� ��� ���
&RVW�RI�(TXLW\�&DSLWDO�([FOXGLQJ�5LVN�)UHH�5DWH
(
T
X
L
W
\
�
&
D
S
L
W
D
O
L
]
D
W
L
R
Q
�
�
�
�
�
�
([KLELW��
����
(
T
X
L
W
\
�
&
D
S
L
W
D
O
L
]
D
W
L
R
Q
�
�
�
�
�
�
����
(
T
X
L
W
\
�
&
D
S
L
W
D
O
L
]
D
W
L
R
Q
�
�
�
�
�
�
����
(
T
X
L
W
\
�
&
D
S
L
W
D
O
L
]
D
W
L
R
Q
�
�
�
�
�
�
����
(
T
X
L
W
\
�
&
D
S
L
W
D
O
L
]
D
W
L
R
Q
�
�
�
�
�
�
����
(
T
X
L
W
\
�
&
D
S
L
W
D
O
L
]
D
W
L
R
Q
�
�
�
�
�
�
��
���
����
������
�������
��������
����������
�����������
�� �� ��� ��� ��� ���
&RVW�RI�(TXLW\�&DSLWDO�([FOXGLQJ�5LVN�)UHH�5DWH
��
���
����
������
�������
��������
����������
�����������
�� �� ��� ��� ��� ���
&RVW�RI�(TXLW\�&DSLWDO�([FOXGLQJ�5LVN�)UHH�5DWH
��
���
����
������
�������
��������
����������
�����������
�� �� ��� ��� ��� ���
&RVW�RI�(TXLW\�&DSLWDO�([FOXGLQJ�5LVN�)UHH�5DWH
��
���
����
������
�������
��������
����������
�����������
��
���
����
������
�������
��������
����������
�����������
�� �� ��� ��� ��� ���
&RVW�RI�(TXLW\�&DSLWDO�([FOXGLQJ�5LVN�)UHH�5DWH
�� �� ��� ��� ��� ���
&RVW�RI�(TXLW\�&DSLWDO�([FOXGLQJ�5LVN�)UHH�5DWH
)DPD�)UHQFK
6/�&$30
18
)DPD�)UHQFK�&RVW�RI�(TXLW\/DUJHVW�DQG�6PDOOHVW�&RPSDQ\�3RUWIROLRV
�����������
�����
�����
������
������
������
������
<HDUV
&RVW�RI�(T
XLW\�([FOXGLQJ�5LVN�)UHH�5DWH
6PDOOHVW�&RPSDQ\�3RUWIROLR��3RUW�����
/DUJHVW�&RPSDQ\�3RUWIROLR��3RUW����
���� �������� ���� ���� ���� ����
([KLELW��
1RWH���&RVW�RI�(TXLW\�6KRZQ�([FOXGHV�5LVN�)UHH�5DWH
19
<HDUV
�����
�����
�����
�����
�����
������
������
&RVW�RI�(T
XLW\�([FOXGLQJ�5LVN�)UHH�5DWH
���� �������� ���� ���� ���� ����
([KLELW��
6PDOOHVW�&RPSDQ\�3RUWIROLR��3RUW�����
/DUJHVW�&RPSDQ\�3RUWIROLR��3RUW����
1RWH���&RVW�RI�(TXLW\�6KRZQ�([FOXGHV�5LVN�)UHH�5DWH

20
6PDOO�&RPSDQ\�&RVW�RI�(TXLW\8QGHU�&$30�DQG�)DPD�)UHQFK
�����������
)DPD�)UHQFK
6�/�&$30
�����
�����
������
������
������
������
&RVW�RI�(T
XLW\�([FOXGLQJ�5LVN�)UHH�5DWH
���� �������� ���� ���� ���� ����
([KLELW���
1RWH���&RVW�RI�(TXLW\�6KRZQ�([FOXGHV�5LVN�)UHH�5DWH