based on research by roger ibbotson, james xiong, robert p. kreitler, charles f. kreitler, and peng...
Post on 19-Dec-2015
217 views
TRANSCRIPT

BASED ON RESEARCH BY ROGER IBBOTSON, JAMES XIONG,
ROBERT P. K R E I T L E R , CHARLES F. KREITLER, AND PENG CHEN
National Savings Rate Guidelines for Individuals
Financial Planning for Women
October 14, 2009Presented by Jean Lown, Ph.D.
PPT Design by Diana Burk

2
Upcoming FPW
FPW survey via e-mailNovember 11: All about Individual Retirement
Accounts & Why switch from a traditional to a
Roth IRA

3
How will these guidelines help me?
“Provides guidelines that
individuals of different ages, incomes, and accumulated wealth
can easily apply in determining
how much to save for an adequate retirement.”

4
Definitions
pre-retirement gross income: yearly income before subtracting any deductions
pre-retirement net income: gross income minus the amount saved for retirement each year during pre-retirement
savings: stocks, mutual funds, bonds, CDs, IRAs, savings accounts
% of pre-retirement income: post-retirement replacement income (calculated at 80% and 60%)

5
The Approach
The amount needed for retirement savings is calculated based on pre-retirement net income rather than gross income
Basing savings rate on pre-retirement net income significantly reduces the amount of money needed

6
Three Easy Steps
1. Determine the annual cash flow needed in retirement
2. Determine the capital (total $) needed to generate this lifetime retirement cash flow
3. Determine the annual savings needed to build the capital to provide retirement cash flow

7
Determine annual cash flow needed
Calculation of Assets Needed at Age 65 to Provide Retirement Cash Flow
Income Pre-retirement $20,000 $40,000 $60,000 $80,000 $100,000 $120,000
Less Annual Contributions to Savings $1,720 $ 4,880 $8,760 $13,120 $17,600 $23,040
Net Income (Gross Less Savings) $18,280 $35,120 $51,240 $66,880 $82,400 $96,960
Income Post-Retirement
(80% Replacement of Net Income) $14,624 $28,096 $40,992 $53,504 $65,920 $77,568
Sources of Retirement Income
Estimate Social Security $11,242 $17,795 $22,177 $25,252 $27,343 $27,343
Pension of Other Income -- -- -- -- -- --
Annual Cash Flow from Portfolio $3,382 $10,298 $18,815 $28,252 $38,577 $50,225
Total Annual Income in Retirement $14,624 $28,096 $40,992 $53,504 $65,920 $77,568
Portfolio Assets Needed to Provide Annual Cash Flow $64,946 $190,647 $434,847 $512,821 $697,144 $904,063

8
Determine Capital needed to generate lifetime retirement cash flow
Savings Rate for Different Income Levels with 80% or 60%
Replacement of Gross Income and No Past Savings
Age Income
SavingsRate for
80% Income
Replacement
SavingsRate for
60% IncomeReplacement
25 $20,000 6.8% 1.4%25 $40,000 10.0% 4.6%25 $60,000 12.0% 6.4%25 $80,000 13.8% 8.0%30 $20,000 8.8% 2.0%30 $40,000 12.8% 5.8%30 $60,000 15.6% 8.4%30 $80,000 17.2% 10.4%35 $20,000 11.4% 2.4%35 $40,000 16.4% 7.4%35 $60,000 19.6% 10.6%35 $80,000 22.0% 13.2%35 $100,000 23.8% 14.8%
Savings Rate for Different Income Levels with 80% or 60%
Replacement of Gross Income and No Past Savings
Age Income
SavingsRate for
80% IncomeReplacemen
t
SavingsRate for
60% IncomeReplacement
40 $20,000 14.8% 3.2%40 $40,000 21.6% 9.8%40 $60,000 25.8% 14.2%40 $80,000 29.0% 17.4%40 $100,000 31.0% 19.8%45 $20,000 20.0% 4.2%45 $40,000 29.4% 13.4%45 $60,000 35.0% 19.4%45 $80,000 39.4% 23.6%45 $100,000 42.8% 26.8%45 $120,000 46.2% 30.2%
Savings Rate for Different Income Levels with 80% or 60%
Replacement of Gross Income and No Past Savings
Age Income
SavingsRate for
80% IncomeReplacement
SavingsRate for
60% IncomeReplacement
50 $20,000 28.8% 6.0%50 $40,000 42.4% 19.0%50 $60,000 50.0% 27.2%50 $80,000 56.8% 33.4%50 $100,000 61.0% 39.0%50 $120,000 66.6% 43.8%55 $20,000 45.6% 9.6%55 $40,000 66.6% 30.2%55 $60,000 79.8% 43.8%55 $80,000 89.6% 53.2%55 $100,000 97.0% 62.0%55 $120,000 105.6% 70.0%60 $20,000 94.6% 19.6%60 $40,000 137.2% 62.4%60 $60,000 >150% 89.8%60 $80,000 >150% 111.2%60 $100,000 >150% 130.2%60 $120,000 >150% 146.0%

9
Example of how to use the table
Age Gross Income
Savings Rate
Deduction Each $10,000 of Portfolio
35 $20,000 8.60% 1.75%
35 $40,000 12.20% 0.86%
35 $60,000 14.60% 0.55%
35 $80,000 16.40% 0.43%
35 $100,000 17.60% 0.34%
A 35 year old with gross income of $80,000 needs to save 16.4% or $13,120, leaving net income of $66,880.
However, if already saved $100,000, then deduct 10 x 0.43% = 4.3% so that should save 16.4% - 4.3% = 12.1%, each year until retirement.

10
Determine Capital needed to generate lifetime retirement cash flow 80%
Savings Rate for Different Gross Income Levels with 80% Replacement of Net Income
Age IncomeSavings
Rate
Deduction Each
$10,000 of Portfolio
25 $20,000 5.8% 1.60%25 $40,000 8.2% 0.78%25 $60,000 10.0% 0.55%25 $80,000 11.2% 0.40%30 $20,000 7.0% 1.65%30 $40,000 10.0% 0.79%30 $60,000 11.8% 0.54%30 $80,000 13.6% 0.42%35 $20,000 8.6% 1.75%35 $40,000 12.2% 0.86%35 $60,000 14.6% 0.55%35 $80,000 16.4% 0.43%35 $100,000 17.6% 0.34%
Savings Rate for Different Gross Income Levels with 80%
Replacement of Net Income
Age IncomeSavings
Rate
Deduction Each
$10,000 of Portfolio
40 $20,000 10.2% 1.67%40 $40,000 14.8% 0.86%40 $60,000 17.6% 0.57%40 $80,000 19.8% 0.42%40 $100,000 21.4% 0.35%45 $20,000 12.4% 1.76%45 $40,000 18.0% 0.90%45 $60,000 21.4% 0.59%45 $80,000 24.0% 0.45%45 $100,000 26.2% 0.37%45 $120,000 28.2% 0.31%
Savings Rate for Different Gross Income Levels with 80%
Replacement of Net Income
Age IncomeSavings
Rate
Deduction Each
$10,000 of Portfolio
50 $20,000 15.0% 1.87%50 $40,000 22.0% 0.97%50 $60,000 26.2% 0.64%50 $80,000 29.8% 0.48%50 $100,000 32.2% 0.39%50 $120,000 35.0% 0.33%55 $20,000 18.6% 2.11%55 $40,000 27.2% 1.04%55 $60,000 32.6% 0.71%55 $80,000 36.6% 0.53%55 $100,000 40.2% 0.43%55 $120,000 43.6% 0.36%60 $20,000 23.8% 2.39%60 $40,000 34.4% 1.23%60 $60,000 41.2% 0.81%60 $80,000 46.8% 0.61%60 $100,000 51.4% 0.50%60 $120,000 55.4% 0.41%

11
Projected Accumulated Wealth by Current Age forVarious Income Levels at 80% Net Income Replacement
Panel A: 50% Probability
AgeIncome$20,000
Income$40,000
Income$60,000
Income$80,000
Income$100,000
Income$120,000
35 $0 $0 $0 $0 $0 $0
40 $9,811 $27,836 $49,969 $74,839 $100,394 $131,425
45 $22,290 $63,243 $113,526 $170,029 $228,088 $298,588
50 $39,117 $110,984 $199,226 $289,384 $400,271 $523,991
55 $59,408 $168,553 $302,567 $453,160 $607,898 $795,793
60 $85,394 $242,282 $434,916 $651,381 $873,804 $1,143,889
65 $118,414 $335,965 $603,084 $903,249 $1,211,675 $1,586,193
Panel B: 90% Probability
AgeIncome$20,000
Income$40,000
Income$60,000
Income$80,000
Income$100,000
Income$120,000
35 $0 $0 $0 $0 $0 $0
40 $6,702 $21,824 $39,176 $58,674 $78,710 $103,038
45 $16,005 $45,408 $81,512 $122,082 $163,768 $214,387
50 $26,023 $73,831 $132,533 $198,497 $266,277 $348,581
55 $37,434 $106,207 $190,650 $285,540 $383,042 $501,436
60 $51,562 $146,292 $262,607 $393,310 $527,612 $690,691
65 $68,650 $194,775 $349,637 $523,658 $702,467 $919,594
Income is gross income. Savings start at age 35.
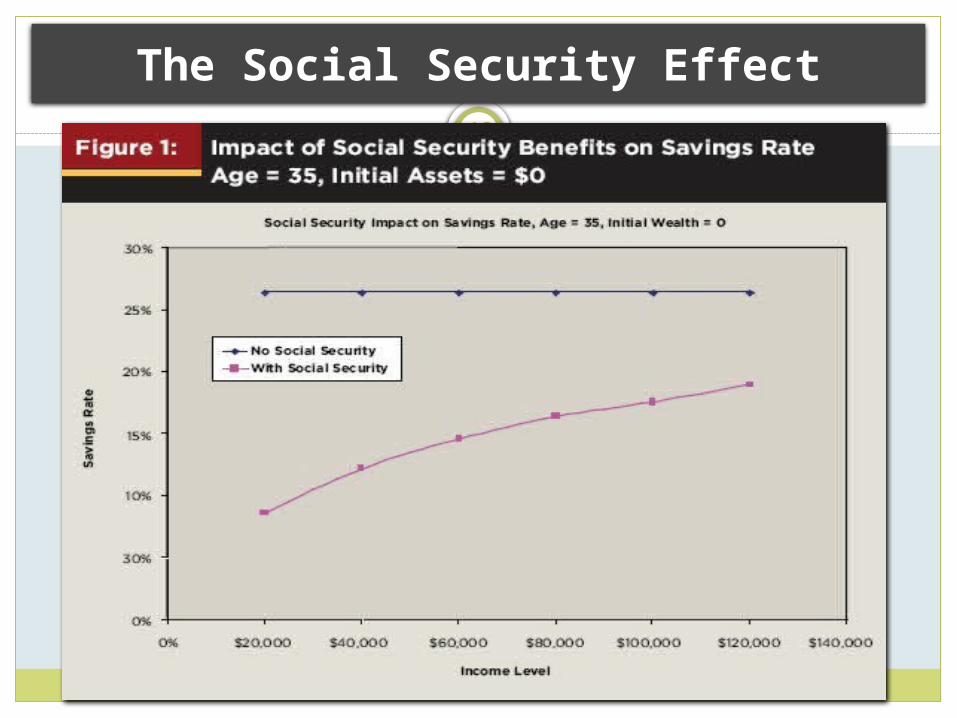
12
The Social Security Effect

13
Stocks and Bonds Allocations Across Target Maturity Funds
ProviderYears
to Retire
35 30 25 20 15 10 5 0
Provider A
Stock 90% 86% 82% 76% 70% 55% 45% 45%
Bond 10% 14% 18% 24% 30% 45% 55% 55%Provider
BStock 100% 93% 93% 88% 80% 75% 68% 60%
Bond 0% 7% 7% 12% 20% 25% 33% 50%Provider
CStock 84% 78% 69% 59% 54% 49% 40% 33%
Bond 17% 22% 32% 41% 46% 52% 60% 68%
Average Stock 86% 86% 81% 74% 68% 60% 51% 46%
Bond 14% 14% 19% 26% 32% 41% 49% 54%
Allocations obtained from the prospectus of each fund in Aug 2005.

14

15
Summary Checklist 1
Saving for retirement is possible with reasonable savings rates
Starting early is important so you can save without a significant drop in lifestyle
Critical inflection point at age 35 to 40
Creates benchmarks for amount needed for retirement based on income and age
Shows targets for how much an individual should have accumulated at age 65 prior to retiring (SS FRA > 65)

16
Summary Checklist 2
Calculated on retirement income as a percent of net pre-retirement income
Calculates cash flow using an 80 percent replacement ratio of pre-tax pre-retirement net income for a single person
Shows the difference in savings required for 60 and 80 percent replacement ratios with out the pre-retirement net income approach
Takes into account Social Security benefits

17
Summary Checklist 3
Shows how higher-income individuals need to save at a substantially higher rate as Social Security benefits are skewed to lower-income individuals
Starting your savings after 35 to 40 increases the challenge of an increasingly higher savings rate needed to accumulate sufficient capital
Those whose income increases faster than inflation will have to save an increasing amount to “catch up” so as to be able to provide for the higher assumed standard of living in retirement

18
Additional Variables
How long will you live? Longer = more $ Planning for a Secure Retirement http://www.ces.purdue.edu/retirement/ Module 1B- links to longevity estimators
Does not “cover” Long term care expensesHealth care expenses will likely be MUCH
higher than during working yearsMedicare funding is in trouble

19
Health Care Costs in Retirement2009 Retirement Confidence Survey
Retirees report health care costs at least as much, if not more, than expected
40% of retirees have spent more on health care than they expected

20
Health Care $ needed in Retirement
EBRI research $ needed to cover health insurance to
supplement Medicare & out-of-pocket health care expenses
a women retiring at age 65 in 2009 will need $98,000–$242,000 for a 50% of having enough
money $164,000–$450,000 for a 90% chance

21
NATIONAL SAVINGS RATE GUIDELINES FOR INDIVIDUALS
What questions do you have?
http://spwfe.fpanet.org:10005/public/Unclassified%20Records/FPA%20Journal%20April%202007%20-%20National%20Savings%20Rate%20Guidelines%20for%20Individuals.pdf

22
FPW Survey & Nov. 11 Program
Email survey of FPW participants coming soon
Nov. 11: All about IRAs and why switch to a Roth
December: No programReminder: check the FPW website
www.usu.edu/fpwPPTs posted on the web