information tc users - mcgill universitydigitool.library.mcgill.ca/thesisfile21321.pdf ·...
TRANSCRIPT

INFORMATION TC USERS
This manuscript has been reproduœd from the microfilm master. UMI films
the text diredly from the original or copy submitted. Thus. some thesis and
dissertation copies are in typewriter face, while others may be from any type of
computer printer.
The quality of this ntproduction is dependent upon the quality of the
copy submitted. Broken or indistinct print. coIored or poor quality illustrations
and photographs. print bleedthrough, substandard margins. and improper
alignment can adversely affect reproduction.
ln the unlikely event that the author did not send UMI a complete manuscript
and there are missing pages. these will b8 noted. Also, if unauthorizecJ
copyright material had to be removed. a note will indicate the deletion.
Oversize materials (e.g.. maps. drawings, chans) are reproctuced by
sectioning the original, begiming al the upper Ieft-hand comer and continuing
from left to right in equal sections with small overlaps.
Photographs induded in the original manuscript have been reproduœd
xerographically in this copy. Higher quality 6- x 9- black and white
photographie prints are available for any photographs or illustrations appearing
in this copy for an additional charge. Contact UMI directly to arder.
Bell & Howell Information and Leaming300 North Zeeb Road, Ann Arbor. MI 48106-1346 USA
800-521-0600


•
'.
Desulfurization ofINCO Semi-Blister Copper
by
Ioannis John Roumeliotis
Department of Mining and Metallurgical EngineeringMcGill UniversityMontreal~ Canada
January 1999
A thesis submitted to the Faculty of Graduate Studies andResearch in partial fulfillment of the requirements
for the degree of Master of Engineering
C I. J. Roumeliotis

1+1 National Libraryof Canada
Acquisitions andBibliographie Services
395 Wellington StreetOttawa ON K1 A 0N4canada
Bibliothèque nationaledu Canada
Acquisitions etservices bibliographiques
395. rue WelfingtonOttawa ON K1 A 0N4Canada
The author bas granted a nooexclusive licence allowing theNational Library of Canada toreproduce, lo~ distribute or sellcopies of this thesis in microform,paper or electronic formats.
The author retains ownership of thecopyright in this thesis. Neither thethesis nor substantial extracts from itmay be printed or otherwisereproduced without the author' spernusslon.
L'auteur a accordé une licence nonexclusive permettant à laBibliothèque nationale du Canada dereproduire, prêter, distribuer ouvendre des copies de cette thèse sousla forme de microfiche/~dereproduction sur papier ou sur formatélectronique.
L'auteur conserve la propriété dudroit d'auteur qui protège cette thèse.Ni la thèse ni des extraits substantielsde celle-ci ne doivent être imprimésou autrement reproduits sans sonautorisation.
0-612-50657-6

•
•
Abstract
The INCO finishing procedure represents the near final stages ofcopper production
at the Copper Cliff Smelter in Sudbury, Ontario, whereby semi-blister copper, at 4-6 wt %
Ni and 2-3 wt % S, is processed ioto blister copper, at 100 ppm S and 0.4 wt % Ni. in a
modified Pierce-Smith converter combining top-blown oxygen injection and bottom-blown
nitrogen stirring of the melt to accelerate semi-blister desulfurization. The procedure is
performed in two stages ofequal duration: in the firs~ melt saturation with oxygen and sulfur
elimination from 2-3 wt % S to 300 ppm is achieved by 45 minutes ofoxygen top-blowing
and nitrogen bottom stirring; in the second stage, oxygen injection is terminated and sulfur
removal from 300 ppm to 30-100 ppm proceeds by the reaction ofdissolved S and 0 under
a further 45 minutes of nitrogen stirring.
The apparent decrease in the rate kinetics of sulfur elimination during second stage
finishing prompted an investigation into the possible causes impeding sulfur removal. Two
possible causes were identified: the cessation of surface tension driven flow, or "Marangoni
convection', upon oxygen saturation of the mell and surface coverage by nickel oxidation.
[n this study 1 to 2 kg liquid charges of Cu - 1 wt % S, Cu - 3 wt % Ni and cathode copper
were impinged with an oxygen gas stream of 75 cm3/min from a gas lance 1.5 cm above the
melt surface to examine whether Marangoni convection cao indeed he provoked in these
systems and to compare sulfur elimination between Cu-S and Cu-Ni-S melts. Marangoni
convection was not observed in these systems but surface oxidation did occur readily and
was found to impede sulfur elimination; the etTect being more pronounced in the Cu-Ni-S
meIts.
Cu-S and Cu-Ni-S alloys were also exposed to the open atmosphere to examine
desulfurization of stagnant melts under air. Although surface oxidation immediately
occurred in these melts, it was found that at a particular concentration of S and 0 in the
liquid Cu-S alloy the melt periodically erupted with effervescence resulting in disintegration
of the oxidized surface layer and accelerated S removal. The Cu-Ni-S alloy which did not
undergo spontaneous bubbling maintained the integrity of its slag layer and sulfur removal
was therefore graduai.

• Résumé 11
•
La procédure d'affinage INCa représente le stage une des demieres étapes de la
production de cuivre à l'affinerie Copper Cliff de Sudbury~ en Ontario. Dans cette opération~
le cuivre semi·blister (c.·à-d. ayant des cloques en surface)~ à 4·6 % pds dt: Ni et 2-3 % pds
de S~ est traité pour être transformé en cuivre blister contenant 100 ppm de S et 0~4 % pds
de Ni. Ce traitement a lieu dans un convertisseur Pierce·Smith modifié dans lequel on
insuffle de l'oxygène au haut du fOUi· et, au bas~ de l'azote qui assure le mélange du métal en
fusion pour accélérer la désulfurisation du semi·blister. L'opération s'effectue en deux étapes
de durée égale (45 minutes). Au cours de la première, on sature le métal en fusion d'oxygène
et on en réduit la teneur en souffi'e à 300 ppm en continuant à souffler l'oxygène par le haut
et l'azote par le bas pour assurer le mélange. À la seconde étape, on cesse d'injecter de
l'oxygène mais la réduction de la teneur en soufre~ se poursuit jusqu'à 30 à 100 ppm~ par
réaction de S et de 0 dissous grâce au mélange par l'azote.
La diminution apparente de la cinétique d'élimination du soufre au cours de la
seconde étape de l'affinage a donné lieu à une étude visant à déterminer les causes
susceptibles de nuire à cette élimination. Nous avons identifié deux causes possibles: la
cessation d'écoulement induit par la tension superficielle~ ou convection de Marangoni, après
saturation en oxygène du métal fondu~ et la formation d'une couche de nickel oxydé à la
surface. Dans le cadre de l'étude, des phases liquides à 1 kg - 2 kg de Cu à 1 % pds de S~ de
Cu à 3 % pds de Ni et 1 % pds S~ et de cuivre pur ont été bombardées d'un flux de gaz
d'oxygène de 75 cm3/min provenant d'une buse à gaz placée à 1~5 cm au-dessus de la surface
du métal en fusion, afin de déterminer s'il était effectivement possible de provoquer la
convection de Marangoni dans ces systèmes et pour comparer les taux d'élimination du
soufre dans le Cu-S et le Cu-Ni·S en fusion. On n'a pas observé de convection de Marangoni
dans ces systèmes; par contre~ l'oxydation en surface s'y produit facilement et affecte
l'élimination de soufre, cet effet étant plus prononcé dans le cas du Cu·Ni-S en fusion.
On a aussi exposé les alliages Cu·S et Cu·Ni-S à l'air libre pour étudier le processus
de désulfurisation des bains stagnants à l'air. Même s'il y avait oxydation immédiate à la
surface de ces alliages en fusion, il a été détenniné qu'une certaine concentration de S et de
o dans l'alliage liquide Cu-S provoquait périodiquement l'effervescence du métal fondu, ce

• Résumé UI
•
qui entrainait la désintégration de la couche superficielle oxydée et accélérait l'élimination
du S. Dans le cas de l'alliage Cu-Ni-S, qui ne connaissait pas un tel bouillonnement spontané,
l'intégrité de la couche de scories étant maintenue, ('élimination du soufre se faisait moins
rapidement.

• Acknowledgements IV
•
This research program could not have been canied out without the financial support
ofNSERC and INca which in the case ofthe latter was complemented by the indispensible
technical support provided by its staff, Dr. Sam Marcuso~ Mike Humphries. and Jin Liu- and
through the use of its analytical facilities at Copper Cliff.
Special thanks to the teaching staffof the Department of Mining and Metallurgical
Engineering al McGill University, including Department Chaînnan Prof. G. Demopoulos for
his persona! involvement in the course of this investigation- Prof. A. Laplante for his
discussion on statistical analyis and in conjunction with Florence Paray as co-editor of the
translated abstrac~ and especially my supervisor Prof. Ralph Harris whose continued faith.
moral encouragment. technical assistance and discussions proved invaluable for the
completion of this study.
The technical staff ofthe Departrnent ofMining and Metallurgical Engineering who
also deserve particular mention are H. Ward. M. Riendeau. R. Paquette. H. Campbell and E.
Fernandez for providing technical assistance and consultation beyond their duty
requirements. To fonner and fellow graduate students, T. Brzezinski. Y. Baik. R.
Sankanarayanan. H. Abulewuf~ B. Handle, M. Ikezawa, T. Luganova-Shrenyakova and Qi
Xia. 1 would like to thank them all for providing a forum for moral support and technical
discourse while H. Abule\\,oufa's contribution ofhis data acquisition equipment for use in this
study was additionally appreciated.
Gratitude and recognition go to Claudia Cieri and Richard Thesi for their time and
effort donated ta translating the abstract of this thesis to french. [would also like to thank
my immediate family, Eugeni~ Ioann~ Demosthenes and David for providing continued
encouragement throughout this research program and to Donatella Battista whose faith,
support and inspiration were indispensible for completing this work. Additional thanks aIso
go out to John Kappos. Sami Ramadan and other friends for their moral support and other
intangible contributions.

• Table ofContents v
Abst...ct............................................................................................................................... 1
Résumé................................................................................................................................. ii
Aeknowledgements............................................................................................................ iv
Table of Contents.............................................................................................................. v
List of Figures.................................................................................................................... vii
List of Tables...................................................................................................................... xii
Nomenclature..................................................................................................................... xiii
•
Chapter 1.1.11.21.3
lA
Chapter 2.2.1
2.2
2.3
2.42.5
Chapter 3.3.13.2
IntroductioD .The Smelter Flowsheet in 1992 .The Smelter Flowsheet in 1993 .Blister Copper Production from MK Concentrate ..1.3.1 Oxygen Flash Converting of MK Concentrate to Semi-Blister1.3.2 Finishing ofSemi-Blister to Blister .Research Objectives .
Literature Review .Thennodynamics and Thermochemistry ofCopper Converting .2.1 .1 Conventional Copper Converting .2. 1.2 Copper Converting at INCO .Gas-Liquid Interactions .2.2.1 Top Blown Gas Injection with High Momentum Jets .2.2.2. Top Blown Gas Injection with Low Momentum Jets .Interfacial Phenomena. .2.3.1 Surface Active Solutes and Surface Tension .2.3.2 The Role of Surface Active Solutes on Reaction Rates .2.3.3 Surface Tension Driven Flow .Oxidation Studies .Hypothesis .
Experimental Metbodology- .Experimental Program .Test Apparatus .3.2.1 Design Criteria. .3.2.2 Selection of Fumace Technology .
Parabolic Clarnshell Heater .Silicon Carbide Resistance Heating Fumace .
3.2.3 Reaction Vesse!. .3.2.4 Gas Regulation System .
114557
10
1111Il13171820222227293239
404040404040424549

• Table ofContents vi
3.3
3.43.5
3.6
Chapter 4.4.1
4.2
Chapter s.5.1
5.2
Chapter6.
Chapter 7.
Gas EvacuationIVentilation .Gas De1ivery .
Experimental procedure .Test 1 - Test 6 .Test 7 - Test 9 .
Elemental Analyses .Charge Preparation '" .3.5.1 In Situ Alloy Preparation .3.5.2 Master Alloy Preparation .Selection of Experimental Conditions .
Resalts........................................•..............................................................Experimental ResuIts .
Test 1: Desulfurization of a Cu - 3 wt % S Alloy .Test 2: Desulfurization of a Cu - 1 wt % S Alloy with 66 cm:;
O:lmin .Test 3: Desulfurization of a Cu - 1 wt % S Alloy with 75 cm3
°2/min .Test 4: Desulfurization ofCu - 3 wt % Ni - 1 wt % S Alloy with 75
cm) O:/min .Test 5. Test 6: Oxidation ofCathode Copper with 75 and 372 cm3
O:/min .Test 7, Test 8: Desulfurization ofCu-1 wt % S Alloy Exposed to
Air .Test 9: Desulfurization of Cu - 3 wt % Ni - 1 wt % S Alloy
Exposed to Air .Discussion of Errors .
Discussion.................................................................................••..............Discussion of Results .5.1.1 Marangoni Convection .5.1.2 The Role of Surface Films on Mass Transfer .5.1.3 Melt Effervescence .Summat")' .
Conclusions .
Recommendations for Future Work. .
49494949505051535456
585858
61
65
67
70
73
7881
838383858689
91
93
Appendix A. X..Ray ISEM Analyses............................................................................ 94
•References 96

• List ofFigures vii
•
Chapter 1Figure 1.
Figure 2.
Figure 3.
Figure 4.
Chapter 2Figure 5.
Figure 6.
Figure 7.
Figure 8.
Figure 9.
Figure 10.
Figure Il.
The Copper Cliff Smelter flowsheet in 1992 operating separate nickel andcopper production circuits2
••••••••••••••••••••••••••••••••••••••••••••••••••••••••••••••••••••••••••
The current Copper Cliff Smelter flowsheet after implementation of processand equipment modifications in 19932
•••••••••••••••••••••••••••••••••••••••••••••••••••••••••
The INca Multi-purpose vessel (MPV) for finishing of semi-blister toblister' .
Process curve of sulfur for the (NCO MPVI9• Stage ( sulfur elimination is
performed by oxygen top-blowing and enhanced by nitrogen stirring. InStage It oxygen injection is terminated while nitrogen agitation of the meltis continued .
The Cu-S phase diagram showing the oxidation path of Cu2S to blister Cuduring conventional convening according to Biswas and Davenporf l
. Theshaded region depicts the operating zone of the INca finishingprocedure .
The phase relations of the copper-rich region of the Cu-Ni-S phase diagramat 1473 K shown superimposed on the isoactivity line ofNi and S accordingto Larrain and Lee I9
.32
••••••••••••••••••••••••••••••••••••••••••••••••••••••••••••••••••••••••••••••••••
The phase relations and various isothenns of the copper-rich corner of theCu-Ni-o system according to Taskinen36 and Kuxmann and Riecke311
• Thearrows trace the oxidation path followed by nickel during the rNCOfin ish ing procedure 19••••••••••••••••••••••••••••••••••••••••••••••••••••••••••••••••••••••••••••••••••••
The composition and temperature changes experienced by the copper chargeduring a pilot plant test of the INca finishing procedureI9
•••••••••••••••••••••••••
(a) Dimpling ofa Iiquid surface by a low momentum gas jet. (h) Increasingthe jet momentum beyond a critical value results in splashing i.e. ejection ofmaterial from the impingement area. (c) At high jet momentum the gaspenetrates the liquid resulting in a lower volume of ejected material. (d)Schematic depiction ofthe geometric model developed by WakelinM and theensuing dimension less relationship .
Types of adsorption behaviour observed at liquid-metal interfaces (a)positive adsorption (h) negative adsorption (c) electrocapillary behaviour,according to Brimacombe72
.
Effect of (a) dissolved oxygen and (h) dissolved sulphur on the surfacetension of liquid copper at various temperatures according to Monma andSuto73 •••••••••••••••••••••••••••••••••••••••••••••••••••••••••••••••••••••••••••••••••••••••••••••••••••••••••••
2
4
8
9
13
15
15
16
19
23
24

• List ofFigures viii
•
Figure 12.
Figure 13.
Figure 14.
Figure 15.
Chapter3Figure 16.
Figure 17.
Figure 18.
Figure 19.
Figure 20.
Figure 21.
Figure 22.
Figure 23.
Figure 24.
Surface renewal by eddies al interfaces: (a) no surface active material present(b) in the presence ofsurface active material according to Richardson i'9•••••
Macro-scale interfacial motion on the surface of liquid copper generated by(a) the impingement ofan oxygenjet on the melt surface which leads to (b)radial spreading of the oxide patch at high velocity towards the regions ofhighest surface tension (c) .
(a) Micro-scale interfacial motion generated by the penetration ofeddies atthe gas-liquid interface with a solute composition exceeding that of theinterface resulting in motion towards regions of higher interfacial tensionaccording to Brimacomben . (b) Macro-scale interfacial motion generatedby the dissolution of a partially immersed solid resulting in Iiquid motionaway from the solid-liquid interface when there is positive adsorption of thesolute on the Iiquid surface and towards the solid-tiquid interface when thereis negative solute adsorption on the Iiquid surface according toBrimacomben .
Variation of the sulfur dioxide pressure in equilibrium with CUlsl• CUlS.Cu20 and the liquidus curve ofcoppe~ .
Temperature versus total. normal cmissivity of heavily oxidized stainlesssteel and aluminum oxide 103
.
Schematic representation of the (a) profile and (b) plan view of the siliconcarbide resistance furnace designed and used in this investigation .
The time-temperature profiles of an iron black heated to 1473 K in thec1amshell radiation furnace and to 1523 K in the SiC resistance fumace....
Wiring diagram for the SiC resistance furnace featuring (WC' Omega CN9111series controllers which allowed for high thermal stability in the bath .
Schematic representation of the (a) cross section of the reaction vessel.crucible and accessories and (b) plan view of the AI water jacket and itsaccess ports .
Schematic representation of the test apparatus when the quartz reactionvesser and graphite receptacle were used .
Photograph of the test apparatus during operation .
Broadside and cross section ofthe cathode copper sheet. Elemental analyseswere performed on the shaded regions .
Cross section ofcrucible and solidified slag layer from Test 1 .
28
31
32
35
42
43
44
45
46
47
48
52
53

• List ofFigures ix
•
Figure 25.
Chapter4Figure 26.
Figure 27.
Figure 28.
Figure 29.
Figure 30.
Figure 31.
Figure 32.
Figure 33.
Figure 34.
Figure 35.
Regions of alloy ingot sampled for elemental detenninations .
The dissolved S and 0 concentration profile over time in Test 1. Thevertical line coincides with the introduction of the 02-N2 gas mixture ontothe melt surface at 170.6 cm3/min and '~2 = 0.62 .
Photograph of the luminescent patch beneath the tip of the gas lance in Test1 at the start of 02-N2 gas blowing. The dark spot on the tube is a largedroplet of matenal that had been ejected from the bath .
(a) Schematic diagram ofthe region on the quartz tube Most atTected by themelt ejections. (b) Photograph ofthe fractured reaction vessel near its radialbottom ringed with droplets ofcopper/copper oxide .
The time-temperature profile of the alloy melt in Test 1 relative to thesarnpling time. The horizontal line marks the bath setpoint temperature of1498 K .
The dissolved S and 0 concentration profiles over time in Test 2. Thevertical line coincides with the introduction ofpure O2 onto the melt surfaceat 66 cm3/min .
The time temperature profile of the mdt in Test 2 relative to the samplingtime t = 0; the depression in the curve near 1400 K indicates liquefaction ofthe alloy charge while the horizontalline marks the bath setpoint temperatureof 1523 K.••..................................................................................................
Photographs of the alloy surface and oxide film from Test 2 at (a) 1523 Kand t = 70 minutes; a highly emissive solid or Iiquid oxide near the cruciblewall is surrounded by the darker Iiquid alloy and (b) room temperature wherethe blistered alloy surface is partially covered by dark regions of oxidizedcopper .
Photograph of the quartz reaction vessel~ from Test 2~ along its verticallength showing solidified droplets ofejected material.. .
The dissolved Sand 0 concentration profile over time for Test 3 at 1523 K.The vertical line coincides with the introduction of pure O2 onto the meltsurface at 7S cmJ/min .
The time temperature profile of the melt in Test 3 relative to the samplingtime t =0; the depression in the curve near 1400 K indicates liquefaction ofthe alloy charge white the horizontal line marks the bath setpoint temperatureof 1523 K .
55
59
60
60
61
63
63
64
64
66
67

• List o[Figures x
•
Figure 36.
Figure 37.
Figure 38.
Figure 39.
Figure 40.
Figure 41.
Figure 42.
Figure 43.
Figure 44.
Figure 45.
Figure 46.
The dissolved S, 0 and Ni concentration profile over rime in Test 4. Thefirst and second vertical lines coincide respectively with the introduction ofpure O2 onto the melt surface at 75 cm3/min and then at 372 cmJ/min .
Photograph ofthe melt surface in Test 4 covered by an emissive oxide filmat 1523 K and t = 40 minutes. The dark region is the liquid metal surfacethat was exposed after a sample had been extracted from the meIL .
The time temperature profile of the melt in Test 4 relative to the samplingtime t = 0; the depression in the curve near 1400 K indicates liquefaction ofthe alloy charge while the horizontailine marks the bath setpoint temperatureof 1523 K .
The dissolved 0 concentration profile over time in Test 6. The first andsecond vertical Iines coincide respectively with the introduction of pure Ozonto the melt surface at 75 cm3/min and then at 372 cmJ/min ....•...............
Photographs of the melt surface at 1523 K in (a) Test 6 covered by anemissive oxide layer after 22 minutes of O2 blowing (Le. lsampling = 32minutes) and (b) Test 5 after 35 minutes ofOz blowing at 75 cmJ/min; notethe mirror image of the gas lance on the dark but reflective melt surface....
The time temperature profile of the melt in Test 6 relative to the samplingtime t = 0; the depression in the curve near 1400 K indicates liquefaction ofthe alloy charge while the horizontalline marks the bath setpoint temperatureof1523 K .
Photograph of the melt surface in Test 8 covered by an emissive oxide atapproximately t =0 minutes. The darker spots are the exposed surface oftheliquid alloy .
Photograph of the melt surface effervescing in Test 8 at t = 28 minutes.....
The dissolved Sand 0 concentration profiles over time for Test 7 and Test8. The dashed and solid vertical lines respectively mark the occurrence andduration of effervescence in Test 7 and Test 8 .
The time temperature profile of the melt in Test 7 relative to the samplingtime t = 0; the plateau in the curve near 1400 K indicates Iiquefaction of thealloy charge while the horizontalline marks the bath setpoint temperature of1523 K........................................................................................•................
The time temperature profile of the melt in Test 8 relative to the samplingtime t = 0; the plateau in the curve near 1400 K indieates liquefaction of thealloy charge while the horizontal line marks the bath setpoint temperature of1523 K........................................................................................•................
69
69
70
72
72
73
75
76
76
77
77

• List ofFigures xi
•
Figure 47.
Figure 48.
Figure 49.
Chapter5Figure 50.
Figure 51.
Figure 52.
Figure 53.
Figure 54.
Figure 55.
AppendixAFigure AI.
Figure A2.
The 5, 0 and Ni concentration profiles over time in Test 9. The verticalIines coincide respectively with the introduction of pure O2 onto the meltsurface at 75 cm3/min and submerged nitrogen injection at 2000cmJImin .
Photograph ofthe melt surface in Test 9 covered by an oxide layer at t = 32minutes .
The time temperature profile of the melt in Test 9 relative to the samplingrime t = 0; the plateau in the curve near 1400 K indieates Iiquefaction ofthealloy charge while the horizontalline marks the bath setpoint temperature of1523 K .
The concentration profiles over time in Tests 1 and 2 adjusted to the timescale of Test 1. The verticalline coincides with the start of O2 delivery toboth melts .
The concentration profiles over lime in Tests 3,4, and 6 adjusted to the timescale ofTest 3. The verticalline coincides with the start ofO2 delivery to ailthe melts .
The concentration profiles over time in Tests 2 and 3 adjusted to the timescale of Test 3. The vertical line coincides with the start ofO 2 delivery toboth melts .
The 5 concentration profiles over time in Tests 8 and 9. The sampling timein Test 8 was adjusted to the time scale of Test 9 when a similar Sconcentration is observed in bath melts .
The sulfur concentration profile from CS alloy blown with O2 at 75 cmJ/min,500 cmJ/min and 1000 cm3/min and from CNS alloy blown with oxygen at1000 cml/min, according to Rioux I04
.
The 5 concentration profile over time in Test 8 compared to Rioux'stestwork with CS alloy blown with oxygen at 75 cmJ/min. The time scalein Test 8 is adjusted to Rioux's sampling time when a similar Sconcentration is observed in bath melts. The vertical line indicates the startofO 2 blowing at 75 cmJ/min in Test 8 .
Qualitative identification of slag components in Test 1 by X-raydiffraction .
Qualitative identification ofejected material on the quartz reaction vessel inTest 1 by scanning electron microscopy .
79
80
80
84
84
85
87
88
89
94
9S

• List ofTables xii
•
Chapter 2Table 1.
ChapterjTable 2.
Table 3.
Table 4.
Table 5.
Table 6.
Chapter4Table 7.
Table 8.
Table 9.
Table 10.
Table 11.
Table 12.
Table 13.
Parameters ofthe experimental system used by Kikuchi67-70 et al. according
ta Alyaser66 ~ .
Dimensions of the reaction vessel and its accessories .
Average elemental composition of INCO cathode copper sheet .
Composition ofHYCOR alumina crucible according to the manufacturer..
Elemental determinations for CS and CNS alloys .
Experimental conditions used for desulfurization and oxidation tests .
Tabulated S and 0 assays from Test 1 conducted at 1498 K by blowing an02-N2 gas mixture with ~()., = 0.62 at 170.6 cm3/min on Iiquid Cu - 3 wtO.IoS alloy ~ .
Tabulated S and 0 assays from Test 2 conducted al 1523 K by blowing pure0: at 66 cm3/min on the surface of liquid CS alloy .
Tabulated S and 0 assays from Test 3 conducted at 1523 K by blowing pureO2 at 75 cm3/min on the surface ofa CS alloy charge .
Tabulated S, 0 and Ni assays from Test 4 conducted al 1523 K with CNSalloy initially blown with pure Oz jet at 75 cm3/min and then at 372cmJImin .
Tabulated 0 assays from Test 6 conducted at 1523 K by blowing a pure Ozjet at 75 cmJ/min on the surface ofa cathode copper .
Sand 0 detenninations for Test 7 and Test 8. The time scale in Test 8 hasbeen adjusted ta coincide with the sampling time ofTest 7 at t = 61 minuteswhere the S content ofboth metts is similar .
Tabulated S, 0 and Ni assays from Test 9 for CNS alloy melted under airand then blown with pure O2 al 75 cm3/min and finally subjected tosubmerged N2 injection at 2000 cmJ/min ..
21
46
52
54
55
57
58
62
65
68
71
74
78

• Nomenclature Xill
Abbrevial;onsatm atmospheres (mulliply by 10/325 to allain value in Pa)CDN CanadiancmJ cubic centimeterscmJ/min cubic centimeters per minute (divide by 6 x lOi to attain value mJ/s)g gramJ jou/esK degrees Kelvinkg Idlogramkg-mole ki/ogram-molekJ IdlojouleskPa kilo-Pascals (multiply by 1000 10 altain value in Pa)m melersmJ cubic metersmin minutesAfPV Mu/ti-Purpose Vesselmt metric tonnemtpd metric tonne per dayN NewtonsNmJ normal cubic metersNmJ/hr normal cubic metres per hourOFC Oxygen Flash ConverlingPa Pascals secondsTemp Temperature'Vol % composition in volume percentwt% composition in weight percentX mole fractionyr year
Chemical Symbols
•
AIJOJ
CH"CoCuCuOCUJOCu~
FeNiNiONJO.O}SiSOl
alumina (aluminum oxide)methane (natural gas)cobaltcoppercopper (lI) oxidecopper (/) oxidecha/codteironnickelnickel oxidediatomic nitrogenmonatomic oxygen and diatamic oxygen respectivelysiliconsuifur dioxide

• Nomenclature
Dimensionless N IlmbersFr FroudeMa MarangoniRe ReynoldsSc SchmidtSh Sherwood
Supersc,iptsb bulkphase1 interface
xiv
Subsc,ipts(g) gas(i) Uquid(s) soUd1. S reactanls 1 or S
Symbol S.l. Unils Typictll U"ilsCt negative slope ofsurface (N/m)/(/cg-mole/mJ
)
tension-solute concentration plot~ negative ofgradient ofsolute kg-mole/mJ
concentration across Iiquidfilmy surface activity coefficient unitless~ change in quantity unit dependentri surface concentration or adsorption kg-mole/ml8 fractional surface coverage by solute unitlessJ.l gas or liquid viscosity kg/mis poise (g/cm/S)J.lB chemical potenlial ofreactant B V0 surface tension N/m dyne/cmtV electrical po/en/ial Va activity ofsolute or species unitlessCI' Cs concentration ofreaciants kg-mole/mJ
f1C concentration gradient kg-mole/mJ
du inner diameter a/lance m mmde diame/er ofcavity m mmD diffusivity ofsolute m]/s~GD standardfree energy offormation J/kg-mole k.//g-mole. kJg gravitational constant (9.81 mir) mirhh deplh ofbath iTl mmHe dep/h ofcavily m mmHo lance height m mm• ID inner diameter m mmka apparent rate constant dependent on the order ofthe reac/ion

• Nomenclature xv
Symbol S.l. Units Typical Unitsk,,," overall mass transfer coefficient misK equilibrium adsorption coefficient unitlessM, momentum ofgas jet N dyne (N x 1(/)n flux kg-mole/m1Is g/m1/sp pressure Pa atm./cPa.4J partial pressure Pa atmR universal gas constant (8.314 J/moleJK) Jlkg-mole/K J/g-mole/Kr/l radius ofbath m mmr, radius ofreaction area m mmS spreading coefficient N/m dynelcmT temperature K oC
li" axial gas velocity mis cm/sli," gas jlowrate al lance outlet m)/s cm)Is. cm)/minX mole fraction unitless[X] disso/ved species kg-mole/mJ
[X]("u dissolved species in copper kg-mole/mJ
[X]w, adsorbed species on liquid surface kg_mole/mJ
•

• Chapter 1. Introduction
•
INCO's Copper-Cliff Smelter in Sudbury, Ontario is a leading non-ferrous metals
producer with annual yields of 120,000 mt of copper and 115,000 mt of nickel. Over the
decades. the production flowsheet al the smelter bas been modified continuously in response
to technological developments, economic demands and increased environmental
awareness l.1. These factors combined led to a decrease in sulfur dioxide (S02) eroissions
at the smelter from 2,000,000 mtlyr to 685,000 mtlyr between 1970 and 1985. In the Mid
1980's.. the Ontario Ministry of the Environment initiated the "Countdown Acid Rain" 3
program which required INca to further reduce sulfur dioxide eroissions to 265.000 mt/year
by 1994. INca responded to its newenvironmental obligations at Sudbury with the "S02
Abatement Project'~. At a capital cost of CDNS540,000,000, the project was designed to
lower S02 emissions by the target date. increase the efficiency of INCO's manpower ~_nd
energy resources. reduce smelter operating costs. improve the converter workplace
environrnent and affect these changes without diminishing productivitr,6. Meeting these
goals involved substantial changes to the smelting and copper production circuits. Smelting
practice was improved with existing INCO flash furnace technology and through
consolidation of INCO's mill resources while copper smelting and convening was enhanced
with technology borrowed from the ferrous industry i.e.. melt stirring via bottom injection
of inert gas through porous plugs.
The pwpose ofthis study is to examine copper convening practice at the Copper Cliff
Smelter and investigate the factors affecting the kinetics ofdesulfurization in the finishing
stages of blister copper production. To better understand the Inetallurgy of INCO's
converting practice, it is instructive to examine the smelter circuit in some detail and the
major changes to the flowsheet between 1992 and 1993+.
1.1 The Sme/ter F/owsheet in 1992
In 1992, the smelter complex operated individual nickel (Ni) and copper (Cu) circuits
(see Figure 1) which processed 2800 mtpd of nickel concentrate al 11-12 wt% Ni, 2-3 wt%
Cu, and 1000 mtpd of copper concentrate al 28-30 wt% Cu, 0.8-1.0 wt% Nil.!. Nickel
+ The evolution of the smelter tlowsheet priorto the period 1992-1993 is documented in the referenc;:s cited l.2.

Cu Concentrate• Chap_te_'_1_e__In_"_o_d_u_ct_io_n 2
Ni contentrate
D Liquid SOI Plant~ 501 - ~AcidPlant ~
1Bessemer Matte
tDCJ
Matte Separation
Nickel ~umde 1
ConvertersReverb
Roasters Flasb Furnace  WMatthe for __, Flasb Furnace1 as outs
~ i ,
~ 1 Sla&'------~------Mg -,'
~ atte :: Ma~tte501 1 1
1 !t..-.-.--=------.;~---......,
= Semi- ~ ~~- CUIS -.. c::=::J -Blister. ~ ~ L.u--vJ
Conc. Cu ConvertersFlasb
Converter 1Blister Cu00 Nickellulfides 1
Roasters Metaiiics tIlHatMetal Car c=:::J
Nickel Oxide t - T -
~~ 1 1& Refineries Copper Refinery
Tbe Copper Cliff Smelter nowsheet in 1992 operatïng separate nickel andc:opper production circuits:.
Figure 1.
•
concentrate was either flash smelted in the INca flash fumace or was partially oxidized in
multiple hearth roasters and then smelted in oxygen-fuel fired reverberatory fumaces to
produce a matte of 30-35 wt% CuNiCo+. Fumace mattes were blown with air in Pierce
Smith (PS) conveners for partial sulfur elimination and almost complete iron removal,
through oxidation and slagging, producing a sulfur deficient nickel-eopper white metal, or
'''Bessemer matte". containing 75 ~JO Cu-Ni and 22 wt% S. Converter slags were reverted
to the reverberatory furnaces for cleaning and disposai while the Bessemer matte was sent
for further processing.
Cu-Ni matte was cast into molds in the matte processing plant and slow cooled to
promote the segregation of its constituent phases into grains of copper sulfide and Cu-Ni
alloy within a matrix of nickel sulfide7• Solidification of the matte into physically and
chemically distinct phases allowed for its crushing, grinding and separation into concentrates• Prior to 1992 nickel concentrate was processed solely by reverberatory smelting'.1

• Chapter 1. Introduction 3
•
of nickel sulfide., copper sulfide and a Ni-Cu alloy containing precious metals. The nickel
products unde~·ent further roastinglrefining procedures while the copper fraction., a nickel
bearing chalcocite (6-7 wtOAJ Ni), was sent to the copper smelter for oxygen flash converting
to semi-blister copper.
In the copper production circuit., concentrate from ore flotation was oxygen flash
smelted to matte at 45-50 wtO/o CuNiCo. Both matte and semi-blister were blown to blister
copper in PS converters and then transferred via hot metal cars to the copper refinery where
the metal was cast., solidified and subsequently electro-refined to cathode copper.
INCa strategy's to meet production and environmental goals called for fewer SO:!
emission sources, elimination of process redundancy and inefficiency, intensification of
process rates and improvements in copper smelting and converting practice l.l·...s·6 • Sulfur
containment in 1992 was achieved principally through the rejection of pyrrhotite to the mill
tailings during mineraI processing of the mined ore. At the nickel smelter, large volumes of
weak SO:! gas streams were generated by the Herreshotf roasters., reverberatory fumaces and
nickel converters. Process redundancy was identified in the practice ofseparating copper and
nickel during ore heneficiation and at the matte separation stage while production limits were
imposed on bath metals production circuits due to the processing of nickel in the copper
circuit. The presence of nickel in copper matte from flash smelting and in semi-blister
copper from flash converting introduced a number of metallurgical challenges to converting
practice8• During the finishing blows to blister, excessive oxidation of nickel and copper
near the tuyere lioe ofthe PS converters resulted in the fonnation of a solid oxide or -mush
that separated by gravity ta the melt surface. Accumulation of ·mush' between successive
converter cycles reduced the production capacity of the converters while accretions of the
refractory oxides on the tuyere line interfered with punching procedures and air flow as
shown by Bustos et a19• Matte from the nickel smelter was periodically transferred to the
copper converters to ·washout' i.e. reduce the accrued oxides ofnickel and iron., into a Cu-Ni
matte and a fluid slag which were recycled to the nickel smelter. Ferro-silicon additions
were made ta every third or fourth washout to create stronger reducing conditions and affect
a more thorough removal of the oxides.

• Chap.:....;te~r-=1;";,,;;,,.__L_n_t~.......o_d.....u.......c_ti_o_n 4
Washout procedures highlighted important deficiencies in smelter practice.
Reduction of the slag by the iron sulfide in the matte released sulfur dioxide into the
workplace environment while asYIlchronous production schedules in copper converting and
nickel smelting delayed transfers of nickel matte to the copper converters and recycling of
washout products to the nickel furnaces and converters. These recycles were an
encumbrance to the nickel circuit because the large transfers of copper upset the
metallurgical chemistry of nickel production.
1.2 The Smelter Flowsheet in 1993
The process and equipment modifications made by 1993 resulted in the smelter
flowsheet shown in Figure 21.2·10.11. Implementation of new production methods has
allowed INCa to maintain production levels ofcopper and nickel. resolve its metallurgical
problems in copper production and meel target SO:! emissions.Bulk Cu-Ni Concentrate
Fe-Si
Chalcocite ~ ,Concentrate MK Flasb Converter
1Semi-Blister Cu
~ - Alloy & - c---,.. . • c-::;JSlag Cu-N1 Alloy
Finisbing Converters
1------S02 •
~I Steam Dryer 1
1 r f(~Converters
eF~Flash Furnaces
1Bessemer Matte
tOr::J
Matte Separation
00Roasters
1Nickel Sulfides Blister Cu
& 9Metallia
~ Hot Metal Car
....--...-..--M-a-r-~e-ts---.::--- 1
& Refineries Copper Refinery
The curreDt Copper Cliff Smelter flowsheet alter implemeDtation or procasand equipmeDt modifications in 1993%.
1Nickel Oside
Nickel Sulfide
Figure 2.•

•
•
Chap_te_'_1_e__/n_"_lJ_d_u_c_ti_o_n 5
Rationalization of INCO's mill resources under the "S02 Abatement Project" has
simplified ore processing to produce a bulk copper-nickel concentrate. Oxygen flash
smelting of the mill concentrate yields a matte at 45-50 wt% CuNiCo which is transferred
to PS converters and blown with air to a Bessemer matte. Preliminary cooling of the
Bessemer matte is conducted in the converters with nitrogen injected through the tuyere line.
Cooled matte is transferred to the matte processing plant where aIl Cu-Ni separation takes
place after matte solidification and segregation into its constituent phases via comminution.
magnetic separation and column flotation. The products ofmatte separation are metallic Cu
Ni alloy, and concentrates of nickel sulfide and copper sulfide. Nickel products are sent for
further refining whereas the chalcocite (MK) concentrate, now the sole feed for copper
production, is steam dried and then flash converted to semi-blister copper in the recently
developed MK flash reactor. The use of column flotation during matte separation has
decreased the nickel content in the MK concentrate from 6-7 wt % Ni to 3-4 wt% Ni and
consequently has reduced the amount of metals recycle to the smelter furnaces. Finishing
of semi-blister to blister is performed. in modified PS converters, by oxygen top-blo\ving and
enhanced by bottom stirring of the melt with nitrogen. The high strength, low volume.. SO:!
gas streams from the flash fumace and flash converter are directed to the 502 plant for sulfur
fixation while the development of sulfur-free washouts using Cu-Ni alloy and ferrosilicon
have largely eliminated fugitive SO:! emissions from the finishing stages. The new washout
procedures have the added benefits of not being dependent on matte from the smelting
fumaces and the recycled washout products are more amenable to processing in the bulk
smelting and Bessemer converting units.
1.3 Blister Copper Productionfrom MK Concentrate
1.3.1 Oxygen Flash Converling ofMK Concentrale 10 Semi-Blisler
INCO's experimentation with oxygen flash converting (OfC) began in 1947 as an
extension to its flash furnace research program for primary srnelting of sulfides12. Initial
OfC trials on comminuted MI( concentrate without flux additives produced molten copper

•
•
Chap_te_'_1_e__/n_t_r_v_d_u_ct_io_n 6
in addition to various oxides of nickel, copper and iron. Significant nickel oxidation
observed in these experiments presented a metallurgical barrier against commercial
application of OfC to MK concentrale al the time. OfC testwork renewed at lNCO·s
research facilities in the late 1970's and early 1980's successfully smelted concentrates with
mineralogical and chemical compositions ranging from pure chalcopyrite to chalcociteI1.13.1-4.
An important result of these experiments was that nickel oxidation could he minimized by
practicing OfC at high temperature and recovering all the nickel in sulfur saturated copper
or semi·blister.
Commercial scale OfC ofMK concentrate was impiemented at Copper Cliftïn 1985
using modified PS converters to process 250 mtpd ofwet chalcocite cak.es~ al 74 wt% Cu~
4.2 wt% Ni. and 21 wt% S into semi-blister copper at 2-3 wt% S and 4-6% Ni. NiO
formation and large temperature fluctuations were controlled by maintaining 8% moisture
in the tilter cakes and adjusting the oxygen/filter cake ratio accordingly. Desulfurization of
semi-blister to blister in PS converters by submerged air injection via tuyeres yielded blister
copper at 100 ppm S and < 1% Ni.
The desire to increase energy efficiency and intensify process rates under the "S01
Abatement Projecf~ resulted in a new drying procedure for the MK concentrate and the
development of a new flash procedure and a flash reactor with a greater production
capacitylo.l';. Current practice is to dry 725 mtpd of fine nickel containing chalcocite to
< 0.2% moisture in a MYren multi-coil stream dryer operated at 483 K. The dried
concentrate is fed through two burners near each endwall of the MK flash reactor, a
cylindrical vessel 18 m in lengili by 4.5 m in diameter, and flash convened to produce semi
blister and a high strength S02 gas stream. Nitrogen sparging of the mel~ via porous plugs
on the reactor bonom, enhances mixing conditions and allows for oxygen utilization
efficiencies of up to 90%. The semi-blister, a mixture of white Metal and metallic copper.
with an aggregated S content of 2-3 wt% S and 3-5 wt% Ni, is transferred to the Multi
Purpose Vessel (MPV) for further desulfurization to blister while the SOI gas stream is
directed to the acid plant for fixation to sulfuric acid.

•
•
Chap..;...;te_r_l_._--..;;;..In:....;;.;t~~...;;;.o~d..;;..;.u..;..ct_i_o...;.n 7
1.3.2 Finishing ofSemi-Blister to Blister
Although nickel oxidation was controlled during OFC it persisted in the finishing
procedures of 1992. Oxide production and accumulation in the converters were anributed
to the variable mixing conditions generated in the melt trom submerged air injection via
tuyeres Il. In the vicinity of the tuyere Hne the injected air oxidized substantial quantities of
nickel and copper and only provided adequate agitation of the melt in this regionI5.16.17.18.
Under these mixing conditions the oxides could not he redigested sufficiently into the melt
and either separated out to the melt surface due to density differences or accreted on the
tuyeres and other converter surfaces. The use of air as the oxidizing gas also limited the
amount ofsensible heat available for melting anode scrap.
Thermodynamic analyses of the temary Cu-Ni-S and Cu-Ni-O systems by INCO l9
indicated that under equilibrium conditions it was possible to selectively remove sulfur as
S02 with minimal nickel oxidation and subsequently separate nickel from the melt as NiO
without significant copper oxidation ll. INCO's pilot testwork on semi-blister melts top
blown with oxygen and bottom stirred with nitrogen via a porous plug produced blister
copper at near chemical equilibriumt 1. Concurrent washout experiments developed a new
procedure using a Cu-Ni-fe-Si alloy, with a Cu:Ni weight ratio of 3-4~ to reduce oxide
accretions ioto a Cu-Ni alloy of the same Cu:Ni ratio as the washout medillln, and a fayalite
slag containing 1 wt% Ni and 0.5 wt% Cu.
Industrial application of these procedures depended on vessels that could provide
unifonn agitation of the melt and uninterrupted oxygen delivery. These requirements were
satisfied by the INCa MPV (see Figure 3), a tuyereless PS converter, 10.7 m in length by
4 m in diameter, retrofitted with an oxygen lance in each endwall and five porous plugs· with
a preset permeability to nitrogen in the reactor bottom. Natural gas bumers coupled to the
oxygen lances are fired during washouts to create reducing conditions and sustain the
reaction temperature at 1573 K. Two MPVs are operated at ail times and altemate between
processing semi-blister or holding Cu-Ni alloy at temperature in preparation for later use in
washouts.
• A later modification to the MPV increased the number ofporous plugs from five to six·::.

• Chap_te_'_l_e__L_n_"'_lJ_d_"_c_tl_·o_n s
Figure 3. The INCO Multi-purpose vessel (MPV) for finisbing of semi-blister to blister!.
•
Desulfurization is perfonned by top-blowing oxygen at 5300 Nm3/hr while the melt
is stirred with nitrogen injected at a rate of 14 Nm3/hr/plug. Tonnage oxygen~ utilized near
85% efficiency, also provides excess heat for melting cold anode scrap. Disposable oxygen
probes monitor the oxidation state of the melt to detennine the endpoint of blowing and
prevent overoxidation of the molten copper charge. Bottom stirring with nitrogen enhances
the process kinetics by providing uniform mixing conditions in the bath. This method of
agitation was borrowed from the ferrous industry where it is applied to ladle refining
procedures to accelerate thermal and chemical homogenization of the melt and the kinetics
of the refining reactions ll. INCO~s adaptation of bottom stirring to copper smelting and
converting represents the tirst application of this technology to commercial copper
production 10.11.
The MPV converts 135 mt of semi-blister al 2-3 wt% S, 3-5 wt% Ni ioto blister at
0.6 wt% Ni, 70 ppm S~ and 1 wtO/O 0 at temperatures between 1493 K and 1573 K. About
25 mt ofcopper scrap is also added into the reactor during the cooverting procedure. Sulfur

• Chap_te_'_1_e__l_n_t'_,o_d_u_c_t_io_n 9
Stage!!1
1
1
1
1
1
1
1
11
1
1
1300ppm1
1
1
1
1
1
1
20,000 ppm
100
1,000
10,000
IOO,ooO~------"-------------"-------'
Stage!
-V:J
-ec.c.--~
::E"=
907515 30 45 60
Time (minutes)
Process curve of sulfur for the INCO MPVI9JO. Stage 1 sulfur elimination is
performed by oxygen top-blowing and enhanced by nitrogen stirring. In StageIl, oxygen injection is terminated while nitrogen agitation of the melt iscontinued.
10-t---t--+--.......-+---t--+--+--.....---+--+--+-_~-+-'o
Figure 4.
•
elimination from roughly 2 wt% S to 70 ppm S, occurs in two stages (see Figure 4) of
approximately equal process time; the second stage having a lower rate ofdesulfurization1 9.:!o.
A change in the rate of sulfur elimination is observed to occur at a sulfur content of300 ppm
which corresponds to oxygen saturation (roughly 1 wt% 0) and partial oxidation of the
nickel values in the melt. Industrial practice is to terminate the oxygen top blowing at 300
ppm S in the belief that the oxygen dissolved in the melt is more than sufficient to oxidize
the remaining sulfur. Nitrogen bottom blowing through porous plugs is continued at that
same rate during the second stage of finishing. At the end of two finishing cycles, 150 t of
washout alloy with a Cu:Ni ratio of 3 is transferred from the holding MPV to the finishing
MPV along with 15 mt of 15 wt% Si ferro-silicon. The oxy-fuel burners are fired at 70%

• Chapter 1. Introduction 10
•
stoichiometric oxygen to maintain the process temperature at 1573K and create a reducing
atmosphere that minimizes alloy oxidation. The reduction process is assisted by nitrogen
injection into the bath and produces slag and excess alloy which are bled to the bulk smelting
circuit.
1.4 Research Objectives
A project was commissioned at McGill University in 1993 by INCa as pan of an
effort to improve the process kinetics in second stage converting. Its purpose was to
detennine if sulfur elimination is impeded by the foonation ofoxide impurities such as Nia
since this species is thennodynamically stable at oxygen saturation and at the concentration
of the impurity encountered industrially. The role of surface phenomen~ such as the
Marangoni effect. during desulfurization was also to he examined given the presence of two
surface active agents Le. S and a in the melt.
The influence of nickel on desulfurization kinetics was to he evaluated by comparing
the rates ofsulfur elimination in copper-sulfur melts both in the presence and absence ofNi
in the bath. Surface phenomena were to he examined under quiescent melt conditions in
order to facilitate their observation and also provide an indirect evaluation of bath mixing to
desulfurization kinetics.

• Chapter 2. Literature Review Il
•
Copper extraction from sulfide concentrates encompasses pyrometallurgical
procedures such as reverberatory smelting, INCO and Outokumpu flash smelting, the
Isasmelt top-blown process, the Vanyukov bath smelting process and the Noranda and
Mitsubishi continuous processes. These production methods are differentiated by the shape
and size ofthe reactors, the delivery mechanism ofconcentrate, flux. reverts, recycle slag and
ofair/oxygen mixtures to the melt during smelting and converting, the ancillary operations
applied after each process stage to recover valuable by-products~ and in copper refining
procedures. Continuous copper production is further distinguished by the combination of
several process stages ioto one.
[0 spite of the number of production routes copper pyrometallurgy is basically
separated ioto three process stages: smelting, converting and refining. Industrial interest to
optimize these stages has generated studies regarding the kinetics, thermodynamics and
thennochemistry of copper extraction. Kinetic studies relevant to the present investigation
are those involving the oxidation of copper matte and copper-sulfur alloys by top-blowing
ofoxygen-inert gas mixtures while submerged gas injection and vacuum rermïng procedures
are aIso considered here. The role of surface active elements and other surface phenomena
on reaction rates are also examined from the perspective of the Cu-S-O, Cu-Ni-S and Cu-Ni
a systems.
2.1 Thermodynamics and Thermochemistry ofCopper Converting
lNCO's finishing procedure resembles the final part of the copper making stage of
most converting operations and therefore a brief review ofconventional copper converting
is presented below to highlight the thermochemical considerations of the INCO process.
2.1.1 Conventional Copper Converting
Copper converting is usually regarded as the production of impure metallic or
'blister' copper by the sequential oxidation of iron sulfide and copper sulfide in smelter
matte. This procedure is most often performed in a Pierce·Smith converter (4 m ID x 9-11

• Chap..;;..;;te;..;;.r......;;2;,,;,.;;,.__L_'_·te_~_a_t_u_re_R.....;,ev.......;.,.;e~w 12
m length) by submerged injection of air or oxygen-enriched air (23-26 vol. % OJ ioto the
melt at 500-700 Nm3/minute through water cooled tuyeres spanning the inner length of the
reactor. A typical converter cycle processes 200-500 mt of matte at 1473 K and produces
100-200 mt ofblister copper with by-products of iron-silicate slag and effluent gas bearing
sulfur dioxide as summarized by the unbalanced reaction21:
The matte is converted in two distinct stages made autogenous by the exothermic oxidation
of its sulfide components of which the thennodYnamics and phase relationships have been
detailed elsewhere22-3o. In the initial slag-forming stage iron sulfides are oxidized to FeO.
Fe30~ and SOl while silica flux is added in with the iron oxides to increase their fluidity and
hence facilitate their removal during slag tapping procedures. The impure Cu2S or "white
metal· end product is subsequently oxidized in the copper-making stage to blister copper by
the overall reaction21::
The phase relations of copper-making are described hy the temary Cu-S-O system yet a
simplified representation ofCu2S oxidation to blister copper can he made with the binary Cu
S phase diagram (Figure 5). The initial oxidation of CUlS (Point A) produces SOl and a
sulfur deficient white metal containing 19.7 \\'t% S by the reaction21:
(3)
•
When the melt composition reaches the Cu-Cu2S miscibility gap (Point B) a blister copper
phase containing 1 wtO..Io S is produced which increases in proportion to the white Metal with
continued mell oxidation. Beyond this immiscibility region (Point C) sulfur exists only as
a dissolved species in blister copper and its continued removal takes place by its reaction
with dissolved oxygen (Equation (4»31. The relationship between the activity of sulfur and
:~GO for Cu~S oxidation was derived from a linear regression ofthe thermodynamic values obtained between1403 K and 2000 K using Outokumpu·s HSC Chemistry Version 1.10 thennodynamic software.

• C/'apter 2. Literature Review 13
oxygen is one that is mutually inversed and therefore at the endpoint of converting (point D)
the blister copper contains 0.001-0.03 wt% S and 0.1-0.8 \\1 %0. Although further
desulfurization may take place with continued blowing the procedure is tenninated to prevent
copper oxide formation by Equation (5)31.
[51 + 2[0] - SO âGo = - 68,367 + 37T JCu Cu - 2(g) (4)
(5)
1573
1673"'olu"
"'lIil~ mrttll'
1273
4041:
1373
/473
117320Cu~
15/0
Mass%S
5
Moll~" '1JIis'~" Cil + "'olu" "'lIi,~",rttll' \......... .......~
INCO CO""~ni"gZo,,~
C Co"v~"tio'" CO""~ni"g P",II III U7J K B..... ............... • ........_........._........._..................D
1176K VI
........0.9 !.s l4tolu" 'blist~,'Cil + CII:S(f1 1'.7!. S
0.6 ~.s 1140K
Cllrfl + CII:S,fI
1900
/000
Cu
1300
Moll~"'blisu, Cil '
1400
G'~
~::: 1200...~~
~
E 1100~ IJ56K
Figure S. Tbe Cu-S pbase diagram sbowing tbe oxidation patb of Cu2S to blister Cuduring conventional converting according to Biswas and Oavenporr l
• Tbesbaded region depicts tbe operatïng zone of tbe INCO finisbing procedure.
•2.1.2 Copper Converting allNCO
As mentioned in Chapter 1, INCa processes a sulfur-saturated copper melt (- 2 wt%
S) or 'semi-blister' containing significant nickel values (- 4 wt % Ni) into blister copper (100
ppm S, 0.6 wt% Ni) at 1523 K - 1573 K in a two stage procedure in which the first is

• Chap_te_r_2_.__L_;_te_~_a_t_u_re_R_ev_;e_w l_4
operated with oxygen top-blowing and nitrogen stining of the melt and the second with only
stirring of the bath by injected nitrogen. The procedure was developed on the basis of a
thennodynamic analysis conducted by INCOl9 which sought to minimize ~mush't formation
and maintain nickel levels in the final blister product within acceptable tolerances for
subsequent copper electro-refining. It was found that under equilibrium conditions, sulfur
can he removed from semi-blister at elevated temperatures by oxidation to SO~ 'Mth minimal
nickel oxidation and significant oxygen dissolution in the melt. Upon cooling, the dissolved
oxygen reacts with dissolved nickel to form NiO which separates from the melt with minimal
copper oxidation and/or entrainment and thus lowers the nickel concentration of the melt to
desirable levels.
The relevant thermodynamic information relating to conversion of semi-blister can
he obtained from published literature on the Cu-Ni_S32-35 and Cu-Ni-O systems36-38. Larrain
and Lee3:! calculated the phase relationships and isoactivity lines for Ni and S in the Cu-Ni-S
system which were largely corroborated by Chuang and Chan~s and are shown
superimposed for the copper-rich region at 1473 K in Figure 6. Taskinen"s36 compilation of
various isotherms in the Cu-Ni-O system in addition to Kuxmann and Riecke's38 data are
presented in Figure 7 which reveal the strong temperature dependence of 0 and Ni
solubilities in copper.
INCO determined the degree of Ni and S oxidation in the copper rich region of the
phase diagram by combining the activity data from the Cu-Ni-S diagram with the free
energies offormation31 ofNiO and SO~:
t -Mush' in the INca vemacular refers to a dry slag layer/dross consisting ofcopper oxides and nickel oxidesthat is fonned during conversion of semi-blister.•
lVi(S) + f02(g) = NiO(S) J1G ° = - 468,190 .+ 170T J
~S2(g) + 02(g) = S02(g) t1G o= -362,418 + 72T J
(6)
(7)

• Ch ap..;;..;te;,.;;"r......:2~._-......:::L:.;;:;.:.:te~~.::1l:.:.;tu::.:.~:....:e:....::.:R:.::ev-:....:.:;e;;;",.,;,w~ 15
0.3 Nickel Acrivity
White Meral &0Se", i-Blister
Matte
0.2
Ps:
1 li: 10"
3 li: 10.7
1 li: 10-7
6 8 10 12 14 16 18 20 12
22
20
11
16
.. 14
~ 12:.ri.!
fi. 10- 0.03 0./
~ 8
6
4
2
1 4
Figure 6.Wt -4 Nickel
The phase relations of the copper-rich region of the Cu-Ni-S phase diagram at1473 K sbown superimposed on the isoactivity line of Ni and S acconling toLarrain and LeeI9
•.J1.
5
4-----T••ki•••........................ K.s••••• Riecke
---
1.51.00.5
Ü 3.=.1~Z~-- 2 ..... tml(~
•Figure 7.
Wt -/_ OSYlea
The phase relatioll5 and various isotherms of the copper-ricb coner of the CuNi-O system acconling to TaskinenJ6 and Kusmann and RieckeJa
• The arrowstrace the oIidation path followed by nickel duriDg the INCO finishiDgprocedure19
•

• CI,apter 2. Literature Review 16
If Pso~ is assumed to he 0.20 atm (2 x 10" Pa) while Ps-:. and Po~ are the equilibrium partial
pressures of sulfur and oxygen, then the sulfur content ofa semi-blister melt at 1473 K can
be reduced to below 0.2 wt % before Po: becomes sufficiently high to cause NiD
fonnation '9• The Cu-Ni-O diagram shows that sulfur-free copper at 1573 K containing 3 wt
% Ni can dissolve upto 0.6 wt % oxygen (Point A) before any nickel oxidation takes place.
Continued oxygen dissolution at 1573 K increases the oxygen content and decreases the
nickel content of the copper. At point B the dissolved oxygen content of the copper reaches
1.1 wt% which is sufficient to lower the nickel content of the melt to 0.6 \\1 %. without
oxidizing copper, by cooling the melt to the casting temperature of 1423 K 19•
The composition and temperature profiles of the melt f~om a pilot plant test of the
finishing procedure are sho\\"n in Figure 8. A holding period of30 minutes \vas incorporated
into the INCa conversion technique to approach equilibrium because early test results
indicated that sorne copper had oxidized in spite of vigorous melt stirring \\ith nitrogen.
Cooling the charge to the casting temperature of 1423 K was accomplished by adding cold
anode scrap to the melt which was found to be more rapid than natural cooling and did not
affect the elimination of nickel as NiO.
Tlme (mlnutel)The composition and temperature changes experienced by the copper chargeduring a pilot plant test of the INCO finishing procedure".• Figure 8.
4
-f!.-.!- 31:o
;-:oÊ 1otJ
1
o
• TCDlpcr8t.rc
• Nlckcl• OEYlca
• S••'.r
20 40 60
.: Cooli1l6
80
1573
-1523 ~w..:1-•..Il
1473 ÊIlt-
1323

•
•
Chap.:..:te;;.";;,,r.....:2~._--:;;L~;~te~,.,..;;.;;1I~tu~,.,.....:e;.....;R_ev_'~·e_w 17
1.1 Gas-Liquid Interactions
A rate process involving two immiscible phases which are not in chemical
equilibrium with each and are brought into contact can he regarded as the following series
ofmass transport and chemical reaction steps between the reactant species ofeach phase39.-W:
1) Diffusion ofthe reactant species from the bulk oftheir respective phases andthrough a boundary layer to a gas-liquid or liquid-liquid interface.
2) Chemical reaction at the interface which includes absorption~ adsorption~
dissociation or activated complex fonnation.
3) Diffusion of the initial reactants and/or reactant products away from theinterface.
The sum of the three steps determines the overall rate of reaction while the step providing
the most resistance is considered to he rate controlling. In higher temperature processes.
where near chemical equilibrium exists at the reaction interface, diffusion ofa reactant in the
liquid and/or gas phase is often the rate limiting step while in lower temperature systems the
chemical reaction may exercise all or joint control over the process rate.
Mass transfer rates between two fluid phases such as in gas-liquid Metal systems
depends on the physical properties of the phases, on dynamic conditions in the reaction
system and on the concentration driving force that is equivalent to the difference between the
equilibrium concentration and effective bulk concentration of the bulk liquid41• A reactant
gas species may contact a liquid metal either by diffusion through a stagnant gas phase or by
convection when it is part ofa laminar or turbulent gas jet that is either blown onto the liquid
Metal surface or is injected into the meh.
The mass flux of any system can he related generally to the kinetic and
thermodynamic influences of the system according to the following equation:
(8)
here n .. is the mass or molar flux per unit area, kav is the overall mass transfer coefficient and

• Chapter 2. Literature Review 18
•
Ile is the concentration driving force in the liquid phase. Although useful kinetic data can
be derived from diffusion controlled studies~ industrial pyrometallurgjcal procedures usually
involve convective contact between the gas phase and the mell. Ferrous and non-ferrous
processes both make use of submerged injection and top-blown procedures of which the
physical behaviour ofthe injected gas and the flow regimes established in these reactors have
been modelied at low temperature42-SS
• Combining this information with available thermo
chemical data can yield mass transport relationships defined in terms of dimensionless
groups which consider the transport., dynamic and geometric properties of the system~l.S7-6.&.
ln top-blown systems the gas jet impinging on the liquid May experience starvation
of its reactant species. When this condition arises the Mean gas pressure in the bulk gas
above the liquid surface is reduced to a value less than the pressure in the jet. Therefore~
analysis of kinetic data must recognize whether starvation has occurred othemise mass
transfer coefficients May become unreliableS7•
2.2.1 Top Blown Gas Injection with High Momentum Jets
Gas impingement on a liquid can generate several modes of flow between the phases
depending on the gas velocity and the angle and position of the lance above the liquid
surface. Molloy'B identified three main modes according to the observed surface effects:
dimpling, splashing and penetrating which are depicted in Figure 9 and show the change in
shape of the surface depression from a parabola or semi-circle to a V-shape with increasing
jet momentum42• A low jet velocity or large lance height between the liquid and impinging
gas creates a dimple or slight depression on the liquid surface (Figure 9{a). Increasing the
gas momentum by reducing the lance height or increasing the gas velocity leads to a critical
depth of depression which if exceeded results in the entrainment of liquid in the surface
indent followed by its outward ejection signalling the start of splashing (Figure 9(b».
Further increases in gas momentum eventually results in deeper penetration of the liquid
phase by the gas stream which is accompanied by a reduction in the volume of ejected
matena! (Figure 9(c». Two consequences of increased jet momentum account for this

• Chap..:...;te;....'_2.:....;.__L_'_·t_e"_1l_t_u_"_e_R_ev_i_e_"' 1_9
behaviour: an increased proportion of the gas jet is reflected back ioto itself while the
remaining portion of the reflected gas oot entraioed in the incoming jet follows a longer
trajectory along the periphery or Hp of the depressio042•
w...
\\\\\\,\\\
(d)-----.-
H<:(Ho + H....tHo Ho
: ",
(a)
If.... depth of cavityHo lance height~ jet momentumPl density of Iiquid phaseg gravity
*/u jet constant for momenlum transfer
Ca) Dimplinl of a liquid surface by a Iow momentum las jet. (b) Increasing thejet momentum beyond a critical value results in splashing i.e. ejection ofmaterial from the impinlement area. (c) At high jet momentum the laspenetrates the liquid multing in a lower volume of ejected DlateriaL (d)Schematic depiction of tbe leometric model developed by Wakelin and theensuinl dimensionless relationship6S.
Figure 9.
•

• Ch ap.:.:te:.:.r...:2:.:.._--::;;;;L:.;.;t;..:e;.:..r.::.1I~tu.::.'...;;,e...;;;;R..:.:ev:.....;"",:,,;ew~ 2_0
Although Most industrial top-jetting processes operate in the splash or the penetration
regime investigators modelling these procedures at high temperature have operated under the
critical zone because flow patterns and interfacial areas cao be described by reaction models
such as Higbie's Penetration Theory'u. In top blown batch processes such as iron
decarburization and copper desulfurization by oxygen~ mass transport control altemates
between the gas phase when the impurity level in the liquid phase is high and the liquid
phase when the concentration driving force in the bulk liquid drops to a small value.
Wakelin60 and Lohe64 provided the basis for detennining the gas-phase mass transfer
coefficient from low temperature models in which jets of air or CO2 with a momentum of
0.08 N were blown on the surfaces ofmercury and water. The Wakelin model6s depicting
the geometry ofthe impingement area shown Figure 9(d) was used to correlate the measured
Sherwood number (Sh) to the Reynolds number (Re) and Froude number (Fr) as66:
Sh = a[Re(l + Fr)]" (9)
where a =6.57 and n =0.43 for air impinging on water. Schmitt and Wuth~1 also developed
an empirical mass transport relationship with the Sherwood number for top-blo"n systems
at high temperature when the jet momentum was 0.3 N and mass changes occurred only in
the Iiquid phase:
(10)
•
In the above equation K' and K" are dimensionless constants, and r /hh is the ratio of the
bath· s radius to its depth. The authors expressed the dimensionless groups in order of
dccreasing importance and found that the Schmidt number, Sc, containing onl) the transport
properties of the metaIlurgical system~ had the strongest effect on mass transport while the
dynamic and geometric factors were less influential.
2.2.2. Top Blown Gas Injection with LoN' Momentum Jets
Rate measurement relationships developed for high momentum gas jets cannot he
extraPQlated to low momentum jets without incurring significant error. Alyase~ reviewed

• Chap_te_r_2_.__L_;_te_~_1I_tu_"_e_R_ev_'_·e_w 2_1
mass transfer studies by Kikuchi et al.67•70 in which low momentum gas impingement in low
and high temperature systems was investigated; in both cases the correlation of Sh to the
dimensionless groups were similar for the system parameters defmed in Table 1.
Table 1. Parameten of the eIperimeDtal system used by Kikuchi61•10 et al. accordiDg to
A!yase~.
Systems IDvestigated Re Sc H/do rldo do(x IOZ m)
Law Temperature 13-1500 0.4-30 1.6-5 0.4-126
Napthalene-N2
Toluene-NzAcetic Acid-N2
Water-N2-NH3
High Temperature
Graphite-CO-C02 0.57-0.93 1.5-6.3 1.4-3.1 0.4-1.3
Liquid fe-CO-COz 0.57-0.9 0.8-1.5 1.4-2.9 0.66-1.3
At low temperature the effect of nitrogen impingement on the sublimation of napthalene or
the evaporation of toluene, water or acetic acid was expressed as66:
(11)
where rs is the radius of the reaction area and dis the inner diameter of the lance. The high
temperature oxidation of graphite and decarburization of iron by CO-CO;! gas mixtures
yielded the following respective relationships66:
(12)
(13)
•ft was concluded that the gas-liquid reaction rate was controlled by resistance in the gas
phase mass when the exPOnent for the Reynolds number was between 0.66 and 0.7666•

• Chapter 2. Literature Review
2.3 Interfacial Phenomena
22
•
2.3.1 Surface Active Solutes and Surface Tension
Within a liquid. attractive forces are exened on each Molecule by its surrounding
neighbours. When the liquid is panitioned to create a gas-liquid interface.. the surface atoms
lose halftheir neighbours and there is a tendency tûwards minimum surface area because of
a net inward attraction acting on the surface atoms71• The work associated with surface area
minimization or the surface tension (0) is govemed by the strength of intermolecular
attractions in the liquid. Strong intermolecular attractions lead to high surface tensions..
molar heats of vaporization, boiling points. and viscosities.
Strongly adsorbed solutes on the liquid surface, an applied potential or changes in
temperature can ail affect the interactions between surface MoleculesT!.. A surface active
solute can decrease the surface tension of a liquid with increasing solute concentration
(àalaCs>O) when it is positively adsorbed (rs > 0).. i.e... when it is in excess on the surface
relative to the bulk (see Figure 10(a» while the converse (aolaCs < 0) applies when the
solute is negatively adsorbed (rs < 0) (see Figure 10(b». Systems which exhibit
electrocapillary behaviour such as amalgam-electrolyte and liquid Metal - fused salts
experience changes in interfacial tension as seen in Figure 10© when a potential is applied
at the interface.
Most surface active solutes in liquid metals adsorb positively on the melt surface.
The Group VIb elements. i.e. 0, S, Se, and Te, are the most commonly encountered solutes
lowering interfacial tension in ferrous and non-ferrous pyrometallurgical refining
procedures71. Elevating the temperature of a liquid Metal solution containing a positively
adsorbed solute increases its surface tension. These effects are illustrated respectively for
oxygen and sulfur dissolved separately in liquid copper at various temperatures in Figure
Il (a) and Figure l1(b). Both figures also show that the effect of solute concentration on
surface tension becomes less pronounced at higher temperatures.

• Chapter 2. Literature Review 23
- 00 < 00-CI ac.=.:
r. > 0CI aiIl~ 1- 1•·w 1
-= 1..Il 1-CI ab -T------------ 1
Cs CsSolute CODceatralioa
(a)
-0-a= èo.;;
èC <0CIIl •~- f. > 0•.-u.:!..Il-c:-
C' c·s s
Solute CODceDtratioD
(b)
-0- ali:e-;;cIl
po.-.!!lOI
~..Il-li:-
- PoteDtial (+) E,. (-) PoteDtia. -
(c)
• Figure 10. Types oC adsorption bebaviour obsen'ed al liquid-metal interfaces <a) positiveadsorption (h) Degalive adsorption (c) elec.....pillary bebaviour, accordiDK toBrimacombel1
•

• CI'ap_te_'_2_e__L_i_te_'_Q_tu_'_e_R_e_vl_ee_w 2_4
1.3,..---------------------------.......,
• Figure 11. Effec:t of<a) dissolved oxygen and (b) dissolved sulpbur on tbe surface tensionof liquid copper at various temperatures according to Monma and Suto".

• Chap_te_'_2_e__L_i_te_'_1I_tu_"_e_R_ev_,_ee_"' 2_5
The accumulation of surface tension data for a Iiquid Metal is usually performed by
rneasuring the dimensions ofa sessile liquid drop resting on a horizontal surface over a range
of solute compositions and temperature. Applying this data to the Langmuir and Gibbs
adsorption isotherms yields a relationship between the activity of the solute and the
depression in the surface tension ofthe liquid Metal solution. ln the simplest case ofa single
chemisorbed solute, /, the Langmuir adsorption isothenn descrihes the fractional coverage
el of the liquid surface as7~:
a,= Ka
1 - e ' ,1
(14)
where QI is the activity of the solute 1 and K )s a temperature dependent equilibrium or
adsorption coefficient. The appropriate form of the Gibbs isotherm providing the surface
concentration or adsorption of the solute iS75:
da ; - (rs - ;Sr,) dl!sA
(15)
where 0 is the surface tension, rA and r B are the adsorptions of the bulk phase A and solute
B respectively~ X; represents the atom fraction of the two components in the bulk phase and
J.1B is the chemical potential of B. Under strong adsorption behaviour Equation (15) can he
simplified toS7:
where ri" is the temperature independent adsorption at full coverage. Substituting for a, from
Equation (14) and integrating yields in the limiting case of a pure solvent's:
• oP - 0 = R~ln(l + K,ai)
(16)
(17)

• Chap.:..:te:.:,.'...:;2:.:,.__~L~;t~e~'a:.:.t~u:.:.~~e_R.....;ev~;e.;;...", 2_6
where 0" and a are the surface tensions of the pure metal and a1loy. For a strongly adsorhed
solute. rI can he obtained as the linear slope from a plot of a vs Ina,.
Equilibrium surface concentrations on iiquid metal interfaces can be established
almost instantaneously. A simplified form of the diffusion equation:
(18)
•
\vhere n is equal to the surface excess. C is a constant concentration gradient between the
interface and bulk liquid and D is the diffusivity of the solute~ was used by Richardsonn to
demonstrate that the equilibrium surface concentration of oxygen in liquid iron is reached
within 10-3 to 10·s second even when oxygen was present at one-tenth its bulk saturation
concentration.
The above treattnent considers ideal adsorption of a solute on a liquid metal surface
consisting ofequivalent sites. Deviations from this behaviour arise when there are attractive
or repulsive interactions in the adsorbate or other competitively adsorbed solutes present.
Sun and Belton76 reported that in the liquid Cu-S system repulsive interactions in the
adsorbate led to more rapid than expected coverage of the liquid copper surface with
increasing sulfur concentration. Negative deviations from ideality observed by Gallois and
Lupis77 in the liquid Cu-O were ascribed to attractive forces acting hetween the adsorbed
oxygen atoms. The contrasting hehaviour ofvarious adsorbates May he related to differences
in the structure of the surface layer and size of the adsorbed atoms but an adequate model to
corroborate these assumptions has yet to he developed. The traditional model descrihes
surface saturation of a liquid metal substrate as close-packed coverage by a monolayer of
doubly charged anions (e.g. 02.~ S2-~ Se2-) however for the Ag-O and Cu-O systems surface
saturation by oxygen ions is less than close-packed and more consistent with coverage by a
two dimensional ionic compound with the stoichiometry M 30 (where M = metal atom)n.78.
Surface interactions are further complicated when two or more solutes are present
together because the effects are generally not additive and may he influenced unpredictably
by other non-active solute elements. Chromium and carbon in liquid iran are two non-active

• Chap.:..:te:.:.r....:2:.:.._--:;;;;;;L~;t;.::.e.:..ra:.:.;t;;.;;.u:.:..~~e.....;;;;R~ev~;e~w 2_7
solutes individually but when present together at low concentrations result in lowered
interfacial tension12• Behon proposed that the interactions between two competitively
adsorbed solutes may he addressed by introducing a coverage dependent surface activity
coefficient into Equation (14) leading to a more general form of the Langmuir isotherm7.l:
(19)
•
2.3.2 The Role ofSurface Active Solutes on Reaction Rates
Interfacial phenomena are not considered to affect thennodynamic equilibria between
different phases but are known to influence the rates of interfacial chemical reactions the
extent which depends on the nature of the solute, its surface activity and mass transport
conditions in the liquid79•
Mass transfer in most pyrometallurgical refming procedures takes place under strong
mixing conditions and in the absence of surface active elements agitation of the melt
produces eddies which transport elements of fluid from the bulk to the interface resulting in
constant renewal ofthe liquid surface79 (see Figure 12(a». At the interface~ mass transport
ta and from the fluid element can occur by unsteady-state diffusion until it is displaced by
aoother eddy. Depending on the level of melt agitation the residence time of the eddy at the
interface cao range from 1O~ second for vigourous stirring to approximately 1 second for
more quiescent conditions79• Non-reactive solutes strongly adsorbed on the liquid surfaces
cao reduce mass transfer coefficients by blocking reaction sites at the interface and inhibiting
chemical reaction of less surface active solutes and by lowering the rate of surface renewal.
Under strong mixing conditions, the eddy surface during its lifetime at the interface may
remain free of adsorhed materia! but under gentle stirring it May establish the equilibrium
concentration of the adsorbed solute and hence interrupt mass transfer and chemical reaction
at the interface. Areas of reduced surface tension created by the adsorbed solute aise
diminish reaction rates by opposing eddy dispersal at the surface Le. surface renewal, with
a force equal ta the difference of the two surface tensions (see Figure 12(b)). At higher
solute surface concentrations and under quiescent conditions the number, frequency and area

• Chap.:.:te:.:.r.....:2~._---=L;;.;;;.;,;.;;te~~..:.;;tl....;;,.;tu~'......;;e;.-R~ev_'~·e_w 2_8
of surface clearings decreases which can arrest bath diffusional and eddy processes.
~....-", ~ -...: \....-
"~-. t".lt. ~ ...
1 ..... '"1 \ \, 1 \ 1 \ 1 \ 1 \
,6 .1 \6 16 • 1
li \j .1 .l/ 1 •
,/ II \1 Il Il
:1 II Il Il li
(a)
il
~~f
\ 1
~ 1
l'\ rIl
(b)
\ ;\ ~.l/
11Il .1
Figure 12. Surface renewal by eddies at interfaces: <a) no surface active material present(h) in the presence of surface active material according to Richardson79.
Darken and Turkdogan80 reviewed a number of gas-liquid systems where there is
strong chemisorption and found that the interfacial reaction rate was usually proportional to
the reciprocal activity of the interfering solute and that the limiting behaviour was consistent
with Langmuir adsorption with interfacial reaction occuning at vacant sites. The apparent
rate constant.. ka.. for such an interfacial reaction in the presence of one chemisorbed solute
is described by74:
(20)
•where at high surface coverage.. Le. K,o, » 1.. or when the concentration of a surface active
solute approaches bulk saturation equation 20 reduces t074:

• Chapter 2. Literature Review 29
k =a
k
K,ai(21)
ln a multicomponent system having a numher of interfering solutes with a fraction
of sites available only for reaction~ Behon proposed a generalized fonn ofthe rate equation7~:
(22)
where p represents the fraction ofsurface available for reaction. Behon74 approximated the
apparent rate constant for the adsorption of nitrogen in liquid iron in the presence of oxygen
and sulfur from Fruehan and Martonik~s81 data by combining equations (19) and (2I)
yielding under the assumption that y; = 1:
k = (K!fls + KeflO)-1Q k k (23)
•
Fruehan and Martonik82 also found that the kinetics of the same reaction cao he increased
\Vith the addition ofchromium. a non-surface active solute. because of its ability to suppress
sulfur activity7~.
2.3.3 Surface Tension Driven Flow
Surface tension gradients in other instances cao lead to surface turbulence which may
increase the rate of interfacial reaction kinetics. James Thomson correctly identified this
phenomenon in 1855 while investigating the motion of alcohol droplets on the surface of
wate~3. Surface tension driven flow or ·"Marangoni convection'!>' arises when a shear stress
develops along a liquid surface and changes the motion of fluid a10ng the interface in the
direction ofhighest interfacial tension resulting in increased heat and mass transport. This
shear stress 'ts' expressed along a direction x, as84:

• Chap..:.;:te~'.....;;;2;",;.._--:::L~it,;"",.;;;e...;;..r~1l~tU.;...r....;;.,e_R_ev~i_e_", 3_0
do ao dT aa de aa dlIJ"t' = - =-'- + -'- + -'-
S dx ar dx ae dx a", dx(24)
•
develops from gradients of temperature T, concentration of a surface active solute e in the
liquid or electrical potential • between two liquids. however. in Many systems the effect of
temperature is small unless the temperature gradients at the interface are very large71•
Following Thomson's early experiments, Marangoni convection has since been recognized
to maintain foam film stability against hydrodynamic draïnageS5• influence the size. shape.
and propenies of \velds86• enhance the rates of gas-liquid metal reactions that are transport
controlled in the Iiquid phase. i.e., copper desulfurization66.87
• nitrogen absorption in liquid
iron88• and cause local refractory corrosion in steelmaking fumaces by slag film motion above
the slag level&.a.
Brimacombe and WeinbergS9 first recorded the occurrence of interfacial motion in
liquid metals when a low momentum « 6 x 10's N) oxygen jet was impinged on the surfaces
of liquid copper and tin. An oxide patch observed on the melt surface directly beneath the
gas lance was seen to move radially outward from the center of the bath to the periphery of
the liquid surface at high velocity (see Figure 13). The interfacial motion was attributed to
localized surface tension gradients between the oxide and surrounding Metal caused by the
non-uniform transfer of oxygen at the interface. Similar behaviour has been reported by
Lange and Wilken90 for a number of low and high temperature two phase systems while
Barton and Brimacombe'S91 measurements ofoxygen absorption in liquid copper credited
Marangoni convection with increasing mass transfer coefficients by an order of magnitude.
Other local sources of solutes are capable of invoking surface tension flow on both
the micro and macro-scale. In stirred melts, eddies carrying a positively adsorbed surface
active solute from the bulk phase to the melt surface can lead to micro·scale interfacial
motion due to the lower surface tension ofthe eddy fluid element relative to the surrounding
interface71 (Figure 14(a». Convective motion cao also occur from the dissolution of a
partially immersed solid because of resulting longitudinal surface tension gradients which
learl to movement away from the interface if the solute is positively adsorbed (rs > 0) and
towards the interface if the solute is negatively adsorbed (rs < 0)72 (Figure 14(b».

• ChaP.:....:te-.:...r.......;2~.__L--.;,;...;...te.;....~_a_tu_~_l!_R_ev_'.;....·e_w 3_1
~ ~
II Metal> II MetaVOxide > fT Oxide
(a) (b) (c)
Figure 13. Macro-scale interracial motion on tbe sunace of liquid copper generated by (a)the impinlement of an 0XYlen jet on the melt sunace whicb leads to (b) radialspreading of the oside patch at high velocity towards tbe l'eIions of bighestsurface tension (c).
ab
s:z=::7.-......•... "'. .
c.~
(a)
'".,C Llqllid
•Figure 14.
(b)
(a) Micro-scale intenacial motion generated by the penetration of eddies at tllegas-liquid interface with a solute composition exceeding tbat of tbe interfaceresulting in motion towanls l'eIions of higher intenacial tension, acconling toBrimacomben• (b) Macro-scale intenacial motion generated by tbe dissolutionof a partially immersed solicl resulting in liquid motion away from the solidliquid interrace wben therre is positive adsorption of the solute on the liquidsurface and towards the solid-liquid intenace when there is negative soluteadsorption on the liquid sunace according to Brimacombel1
•

• Chapter 2. Literature Review 32
Prediction ofthe onset of interfacial motion bas been attempted with limited success
using hydrodynamic stability analysis on gas-liquid systems involving aqueous and organic
solutions by examining the ratio of the destabilizing interfacial tension force resulting from
mass transfer to viscous forces i.e. the Marangoni numbern :
apd2Ma = -- (25)
~
In liquid Metal systems where interfacial tension~ liquid density and adsorption effects are
much greater it is more convenient to evaluate interfacial movement in tenns of an initial
spreading coefficient, S. which in the case of oxygen blown on a liquid metal surface is
expressed asT.!:
S = o,\,'elo! - (0aride + (J.\felOuaru/e)
where S must he positive for oxide movement to occur.
2.4 Oxidation Studies
(26)
•
Rate determinations for the desulfurization or oxidation of copper-sulfur melts are
often perfonned by thermogravimetry, whereby the mass of the charge is recorded as a
function oftime~ by on-line analyses ofthe exiting reaction gases. through periodic chemical
analyses of the melt or by a combination ofthese methods. A common observation in Many
of these studies is the removal of sulfur in two or three distinct stages: a slow and sometimes
variable initial desulfurization stage followed by a dominant stage of relatively rapid sulfur
elimination and ending with a final stage of decelerated desulfurization.
Ajersch and Toguri40 measured the oxidation rates of liquid copper sulfide by
thennogravimetry under gas diffusion control conditions and saw three distinct regions in
the desulfurization curve of Cu2S as it progressed to liquid Cu. An initial stage of variable
weight 1055 was attributed to the time required for the diffusing oxygen gas to establish
steady-state conditions. In the second stage as the melt composition entered the C~I) - Cu2SCl)
miscibility gap region desulfurization (weight 10ss) proceeded at a constant rate. When the

• Chapter 2. Literature Review 33
copper sulfide phase was eliminated the mell continued ta lose weight at a slower rate
although past a critical point continued oxygen delivery to the melt resulted in a net weight
increase due ta copper oxide fonnation. Throughout the desulfurization procedure the
composition of both liquid phases was assumed to he invariant and equilibrium conditions
maintained through continuous mixing of the sulfide phase by the settling motion of the
denser liquid copper droplets. The mass·time curves of iron bearing matte oxidized under
similar conditions by Asaki et al.92 followed a similar path although the initial stage was
characterized by a mass gain due to oxidation of the iron ta iron oxide.
Fukunaka et a1.93 bubbled Ar·O! gas mixtures into molten copper containing 0.74
\\1%) S and 0.01 wt % 0 at 1523 K and.. as with Ajersch and TOguri!l. descrihed an initial
period ofslow sulfur removal.. followed by an interval of rapid sulfur elimination that ended
with a period of decelerated desulfurization. In both the first and third stages. the slower
desulfurization rate coincided with significant oxygen dissolution in the rnelt. Gas flo\\'Tate
(1 x 10.5 rnJ/s ta 2 x 10.5 m3/s). oxygen partial pressure of the gas stream (10 kPa to 30 kPa)
and lance immersion depth in the melt (0.018 m to 0.033 m) were aIl varied to determine
their effect on the rate ofdesulfurization. Higher gas flowrates and oxygen partial pressures
in the injected gas increased the rate of the second stage and shortened the duration of the
initial stage while changes in the lance immersion depth negligibly affected these rates. In
the vicinity of the lance. it was assumed that oxygen was consumed by the two elementary
reactions:
lS1 + 2[0] = S02(g)
02(g) = 2[0]
(27)
(28)
•and that equilibrium was reached between the sulfur dioxide in the gas bubble and the
composition of the melt. A model describing mass transfer around a single gas bubble
suggested desulfurization was controlled by mass transfer in the gas boundary layer and
therefore the rates of the above reactions were determined by the rate ofoxygen supply into
the mell. The authors also observed sorne desulfurization during melting ofthe copper alloy

• Chap.;...;te~r_2_.__L_;~te_~_a_tu_~_e_R_el'_;e_w 3_4
which made the staning concentration of sulfur a variable between each test. Ohn076
confinned that considerable desulfurization and deoxidation can occur from Cu-S-O alloys
during melting or solidification. Alloys ofvaryïng 0 and S concentrations were inductively
melted between 1373 K and 1573 K under a vacuum or an argon atmosphere (PAr = 6.5 kPa
to 101.6 kPa) or were solidified and then remelted under argon (PAr = 1.33 kPa to 102 kPa)
and then chemically analyzed for 0 and S. In all circumstances~ the observed weight change
ratio between sulfur and oxygen was very close to one indicating sulfur and oxygen were
eliminated as SOl. Under vacuum melting~ the rates ofsulfur and oxygen removal could he
expressed as a tirst order rate equation while their rate constants couId he determined with
respect to the inverse oftemperature. However under an inert atmosphere. desulfurization
and deoxidation showed a dependence on dissolved S and a concentrations but not on argon
pressure. Most S and 0 elimination was helieved to take place during melting or
solidification of the alloy when the equilibrium SOl pressure becomes much higher than the
applied argon pressure. These findings agreed with Floe and Chipman'S95 solubility study
of sulfur dioxide in molten copper and Knacke and ProbsCs96 work conceming the
solidification ofcopper melts saturated with SOl' Floe and Chipman anived at an expression
relating the equilibrium pressure of SOz to temperature and the sulfur and oxygen
concentration of the melt93:
6700+ log(w,o/O S)(w,o-!c» 0)2 + 2.21
T(29)
•
0000 applied this equation at a number ofsolute concentrations in the temperature range of
1373 K to 1573 K to demonstrate that sa! fonnation is favourable even at low solute levels.
In Knacke and Probst's96 experiments~ copper melts cooled at various rates (0.2
Kimin to 5 Klmin) continuously expelled sulfur dioxide until the liquidus temperature
(1353K) ('fcopper was reached; further cooling to 100 K below the melting point of copper
resulted in a sudden evolution ofthe remaining gas. Ohno witnessed a similar phenomenon
in the form of vigorous boiling during alloy solidification and referred to the equilibrium
diagram presented by Knacke and Probst showing the variation of the sulfur dioxide pressure

• Chap_te_,_2_e__L_i_te_'_tl_tu_Tî_e_R_ev_,_ee_w ------3_5
in equilibrium with solid copper, copper sultide, copper oxide and the liquidus curve of
copper (see Figure 15). During liquefaction ofa Cu-S-O alloy, the pressure ofsulfur dioxide
increases to above 600 kPa and then drops along the liquidus curve ofcopper with increasing
temperature: during solidification the solutes are concentrated in the remaining molteo
material and the pressure of802 inereases similarly.
14001200 1300Temperature (K)
Ol.-__---.l. ---L ---L --l- ..........L-..__........&... --I
1100
-s=-:::!:-_0.5
Qc:I.:l=-
Figure 15. Variation ortbe sulrur dioxide pressure in equilibrium witb Cull), CUIS, CulOand the Iiquidus eUn'e of eopper".
•
ln Rottman and Wuth's97 top blown conversion experiments, gas jets of varying
oxygen composition were delivered through a lance fined with a laval-type nome onto 2kg
baths ofmolten copper mane (65 wtOlO Cu. 14 wt% Fe and 21 wt% S) at temperatures up to
1873 K. By fixing the lance position al 0.07 m above the unstirred melt the oxidizing gas
exited at super-sonie velocities with sufficient momentum to stir the liquid phase without
invoking splashing. Under these conditions the authors concluded the rate-controlling step
during conversion was diffusion of the reaction gases through the viscous sub-Iayer of the
impinging gas jet. Mass changes in the melt revealed two periods of desulfurization eaeh
proceeding at a distinct rate. In the tirst period constant oxygen dissolution into the melt was

• Chapter 2. Literature Review 36
•
accompanied by simultaneous reaction ofoxygen diffusing through the gas boundary layer
at the gas-liquid interface. The authors postulated that sulfur was removed by the reaction
ofthe dissolved oxygen with sulfur in the liquid phase in conjunction with the direct reaction
ofoxygen in the gas phase at the gas-liquid interface. When the melt became saturated with
oxygen (- 0.6 wt% 0). the desulfurization rate increased to roughly twice the rate observed
in the first period and was accompanied by slag formation and increased turbulence in the
gas phase due to SO:! evolution at the melt surface. Although slag coverage reduced the
surface area available for reaction~ a comparison of the oxidation rates of white Metal and
iron bearing matte showed no significant difference. indicating mass transfer was taking
place primarily in the vicinity of the surface depression caused by the gas jet.
Top-blown conversion experiments were also performed Bryukvin et al.98 at 1473 K
1673 K using synthesized Cu2S melts (5 x 10⁻¹ - 2 x 10⁻³ kg)~ instead of matte~ and oxygen
nitrogen gas mixtures (12 - 30 vol.% O2) blown at a fixed rate of 1.67 x 10⁻⁶ m3/s. Two
distinct regions were observed in the mass-time curve of the melt samples: an initial stage
of comparatively low mass loss followed by a secondary stage of accelerated mass loss.
Although the desulfurization rate generally increased with reaction zone temperature and
oxygen partial pressure~ the initial stage was more influenced by temperature whereas the
secondary stage was more affected by gas composition. The transition to secondary stage
desulfurization occurred. as with Rottman and Wuth~ at a certain degree ofmelt oxidation
although this value was not specified. Increased rates of mass loss in the secondary stages
were anributed to metallization ofthe melt and evolution ofdissolved oxygen from the bath
through the decomposition ofoxysulfide phases. The reaction kinetics were found to he zero
order with respect to the sulfur concentration of the melt but not to the temperature and
oxygen partial pressure of the gas jet. The desulfurization mechanism in both stages was
correlated to activation energies calculated for the primary and secondary oxidation stages
at different bath temperatures. At 1473 ~ the higher activation energy of the first stage was
associated with chemisorption ofoxygen onto the melt surface whereas the lower activation
energy of the second stage was characteristic of diffusion. In experiments performed al
1673K~ the ditference between the activation energies was less pronounced implying that the

• 37Chap_te_'_2_.__L_i_te_"_Q_tu_"_e_R_ev_,_ee_"' _
distinction between the two stages is diminished at higher temperatures and mass transfer
becomes dependent on the mixing conditions of the melt.
Jalkanen99 sought to detennine the phenomenology of oxidation of molten copper
sulfide at 1423 K - 1623 K. Temperature. gas velocity, oxygen partial pressure were varied
in addition to the Cu:S molar ratio of Cu2S which ranged between 1.875 to 2.30. Gas
velocity was maintained at less than 2 mis to avoid forming a depression on the melt surface.
The mass-time curves of the sulfide oxidation indicated two stages of desulfurization; the
tirst was related to oxygen and copper saturation of the melt by the reactions:
02(g) + [51 = S02(g) (30)
f0 2(g) + [51 = [0] + S02(g) (31)
Upon saturation of the melt, conversion proceeded to the second stage by the reaction:
(32)
which was assumed to occur in severa! steps: oxygen adsorption (Equation (33) followed
by the formation of an intermediate activated complex as proposed by Byerley et al. 1OO
(Equation (34» which then reacted with dissolved oxygen to produce sulfur dioxide
(Equation (35» that was subsequently released into the gas phase.
02(g) = 2[O]Q(Ù
[51 + [0] = [SOl
[SOl + [0] = S02(g)
(33)
(34)
(35)
•
Sulfur removal increased with gas velocity and oxygen partial pressure yet its relation to
temperature was less obvious; a positive temperature dependance on the rate of
desulfurization was noted during the second stage at zero top blowing velocity but this
dependence became negative at a value between 0 and 1 mis (NTP). It was concluded that
the conversion ofcopper sulfide to metallic copper was controlled jointly by the rate of rnass
transfer of the oxidizing gas to the melt surface and the kinetics of the chemical reaction.

• Chap_te_,_2_.__L_i_te_~_'II_tu_~_l!_R_ev_'_·e_w 3_8
Radioisotope experiments by Morland, Mathew and Hayes \0\ indicated that fonnation
ofan activated complex may he rate-controlling only in the chemical reaction sequence of
SO:2 generation from a copper sulfide melt. The reaction kinetics were detennined by
measuring the transfer rate ofthe radioisotope S3S from molten copper sulfide to gas mixtures
of SO/CO/COl in equilibrium with the melt under conditions that ensured the resuJts would
be independent ofgas flowrate over the melt surface~ melt size~ and the isotope concentration
in the original melt. The authors concluded that S02 generation was controlled by the
fonnation and decomposition of the activated complex sa· according to the reaction:
LS"O)ads = so· :: [S]QtÜ + [Olads (36)
However their estimated reaction rate for copper suJfide oxidation in air at 1523 K was
relatively high at 1 mol S02 m-2s-1 suggesting to the authors that reaction rates in real systems
are mass transport controlled.
Contrasting the activated complex hypotheses was an electrochemical model
proposed by Alyaser and Brimacombe66.87~ in due consideration of the ionic nature of the
sulfide mell. to describe desulfurization ofCu2S baths top-blown with 02-N2 gas mixtures.
The experiments consisted of varying oxygen partial pressure (0.2 to 0.78 vol. %). gas
flowrate (1.67 x 10.5 to 6.67 x 10⁻⁵ m 3/s), bath temperature (1473 K to 1573 K) and mixing
conditions in the bath. Desulfurization was reponed to occur at two distinct rates that were
controlled by the transfer of oxygen in the gas phase to the melt surface. These rates
increased with oxygen partial pressure and the rate of gas delivery to the melt surface but
were negligibly affected by temperature. In the first stage, oxygen dissolution was
accompanied by simultaneous partial desulfurization of the melt according to the reaction:
(37)
•The transition to the second stage upon oxygen saturation ofthe melt resulted in a higher rate
of sulfur removal than the preceding stage due to the reaction of oxygen al the mell surface
in conjunction with the overall bath reaction:

• Chap.:..:te:..:.r......;;2~._..........;;;:L~;.:..:te~~~1I..;;",,;;tu~~....;;;e.....;R;;;..;;;;.,;;;.ev..;....;I;..:;.·e.....;w 3_9
(38)
•
The negligible liquid phase resistance to mass transfer was attributed to the ionic nature of
the melt and to agitation provided by Marangoni convection and spontaneous sulfur dioxide
eruptions from the melt, the latter phenomenon having also heen previously reported by
Sarton and Brimacombe\02 in surfactant studies involving the dissolution of solid Cu2S in
copper melts.
2.5 Hypothesis
The review of the relevant literature regarding copper converting and oxidation
suggests that surface phenomena May he responsible for decreasing the rate ofsulfur removal
at the end ofoxygen blowing in the INCQ finishing procedure. Il is hypothesized that upon
oxygen saturation ofthe melt there is a cessation ofMarangoni convection at the melt surface
and that surface blockage by solid NiO fonnation or by oxygen and/or sulfur adsorption may
be reducing the number of available reaction sites for sulfur elimination.

• Chap_te_,_3_e__E_xperimental Method%gy 40
•
3.1 Experimental Program
The hypothesis presented in Chapter 2 attributed the reduction in mass transfer rates
during second stage converting to blocking of the melt surface through the fonnation of
nickel oxide (NiO) and a decrease in melt agitation from the cessation of surface tension
driven flow upon oxygen saturation of the melt. To test this hypothesis the rates of oxygen
dissolutionlsulfur removal were measured for cathode Cu, Cu ~ 1 wt % S and Cu- 3 wt o~ Ni
- 1 wt % S melts at 1523 K when top blown with O:!~N2 gas mixtures at various oxygen
partial pressures and gas flowrates.
Top-blowing of O:!-N2 ooto molten cathode copper was carried out to observe the
occurrence of surface tension driven flow in a quiesceot bath wheo only one surface active
agent (oxygen) was present and to provide a comparison to the measured oxygen solubilities
of Cu-S and Cu-Ni-S melts tested under similar conditions.
3.2 Test Apparatus
3.2.1 Design Criteria
Melting of a Cu-S alloy under a vacuum or an inert atmosphere has been shown to
result in significant sulfur evolution94 while surface tension driven flow has been attributed
to concentration gradients in addition to thermal and electrical gradientsTl. T0 minimize
premature sulfur losses, melt oxidation~ and possible thennal contributions to surface tension
driven flow it was desired to rapidly reach the process temperature of 1523 K under an inert
atmosphere and maintain good temperature control in the bath at the setpoint temperature.
Uncertainty in the observation of any surface phenomenon could he reduced further by
visually recording the melt surface under quiescent bath conditions.
3.2.2 Selection ofFurnace Technology
Parabo/ic Clamsllel/ Healer
Induction melting of metallic charges was not considered because electro-magnetic
stirring of the bath was helieved to mask the occurrence of surface tension driven flow and

• Chapter3. Experimental Methodology 41
•
aIso upon INCO~s suggestion not to consider desulfurization of inductively stirred melts
since it was felt this had been done previously.
Radiative heating of the copper charge was then attempted with a Research
Incorporated parabolic clamshell heater mode14068. The fumace consisted oftwenty-four.
2000 W. infra-red lamps vertically mounted and assembled in a hexagon comprising of four
lamps per side. The lamps~ connected in a three-phase. delta-series configuration with a
480V drop across each phase, provided a combined power output of 48,000 W. Infra-red
radiation emitted by the lamps was directed to a focal point at the center ofthe furnace cavity
by a parabolic aIuminum reflector positioned behind each lampe These reflectors were
cooled with water flowing at 3 x 10'" m3/s through a copper tube attached to their anterior
surface.
Although the radiation fumace could achieve rapid heating rates. severa! technical
deficiencies rendered its use impractical. To reach the setpoint temperature of 1523 K the
fumace was operated at 100% of its rated power which reduced the useful lifetime of the
lamps to severa! hours and made the duration of experiments unpredictable. Under these
operating conditions the calculated heat losses from the fumace ta the cooling water
amounted to about 24,000 W. or halfofthe power output of the larnps, which consequently
limited the charge temperature to 1473 K.
The upper temperature limit was also affected by the surface emissivity of the
crucible holding the charge material. An iron black heated in an alumina crucible sheathed
in stainless steel reached a temperature 30 K - 40 K higher than what was possible in an
unsheathed crucible. This observation stemmed from an increase in the total. nonnaI surface
emissivity of the crucible surface from about 0.4 for alumina to 0.8 for the oxidized stainless
steel sheath at 1473 K\OJ (see Figure 16).
At the elevated test temperatures the alumina tiberboard used to insulate the fumace
degraded and released oxide particulates which deposited onto the lamps and reflectors.
Disassembly of the heating unit was then required after each experiment to polish the
reflectors ta a mirror finish so as to rnaintain maximum heating efficiency in the fumace.

• Chap_te_,_3_e__E_xpe,imental Method%gy 42
1.0 r-----....,I~----rI----~I~---""Tr----1~--,
- -
-
-
-
-i0.8 ~-~----~-------------------l
" : ...,....~iDless Steel,',: / : He.vu}· Osidlzed, ;
: '-0.6 .--------~-=--.-=-,-,----------------t
',: Aluminum Os.ide
" 4IIil. ....___~ ~ ~ ---=4IIil.~,..."....- --j-......... ... _.0.4
•w
-~e...Cl
Z
..>-..->-.-~~.-
..-~-ClE-
0.2 ~--------------------------l
-o '-- .L.-1 .L.-1 --l1 .....1 ~1_ ____'
300 700 1100 1500 1900 2300
Temperature (K)
Figure 16. Temperature \'ersus total, normal emissi\'ity of heavily oxidized stainless steeland aluminum oxide'OJ•
•
Silicon Carbide Resistance Heating Furnace
Follo\\;ng a major failure of the clamshell heater, a resistance fumace using silicon
carbide (SiC) heating elements \Vas designed and built at McGill University. Six cylindrical
SiC elements (00 = 0.0254 m x overalliength = 0.914 m) each with a heated length of 0.5
m \vere aligned horizontally in a fumace chamber (inner volume of 0.11 m3) \\'hich was
constructed from silica bricks and insulated on the exterior with alumina-silicate tiberboard
followed by a thin layer transite board (see Figure 17). The fumace assembly was enclosed
in a cubical frame made of slotted steel angle which was fastened with bolts and reinforced
at each corner with gusset plates.
The SiC heating rods were arranged in two opposing sets of three elements to create
a heating zone 0.284 m wide and 0.152 m high. Connected in a 3-phase, wye-series
configuration with a voltage drop of 208V across each phase, the elements yielded a
combined power output of 18,000 W.

• Chap_te_,_3 E_xperimental Methodology 43
,....---------- Heaci.c Ele.e.t -------....,Cer•• ic 1.lert -------
1 11 11 '. • 1 11 "5.7 c. 1loi .1
12.' c.
(b)
1 Il• •. .+-
O., c.
(a)
Sc.
1 1- .
~ 11." C.• -•li ... • 1• Ifw ct ~ " 1r-- • "ln Ill) ."
If ct ....- Wl en• •"=
Figure 17. Scbematie representation of the (a) proOle and (b) plan view of the siliconcarbide resistance furnace designed and used in tbis investigation.
•
Although heating was less rapid with the SiC fumace than the clamshell furnace this
deficiency was compensated by the former~s ability to reach a higher melt temperature and
maintain it with greater control over a prolonged period (see Figure 18). High temperature
stability was accomplished with two Omega model CN9111 controllers connected in series
and attached to individual R-type thermocouples immersed in the melt and placed behind a
heating element (see Figure 19). With upper limits of the element and bath controllers set
respectively at 1623 K and 1523 K., power delivery to the furnace was at tirst regulated by
the element controller but as the melt approached the setpoint temperature this function was
assumed by the bath controller.

• Chap_te_,_3 E_xperimental Methodology 44
Due to the modular design of the SiC furnace it was possible to increase the power
of the fumace by inserting additional elements into the heating chamber and to replace any
failed individual components without any major disassembly of the heating unit.
1600
1400
1200-~ 1000-~..=- 800CI..~
c..E 600~
E-
400
2000 IS 30 4S 60 75
Time (minutes)
•
Figure 18. The time-temperature profiles of an iron bloek beated to 1473 K in theclamsbell radiation fumace and to 1523 K in tbe SiC resistance fumace•

• Chap_te_,_J E--,xper;mental Methodology 45
ri
(6) SiCHeatinl
ElementsWye-Series
1 ZL N
rH
• tO t1
~~C~9111A
COII'rallerAT C5 • 3
BatbDA Unit
• tO 1t ! 1 Z
~ ~ !-L :...eN911.COll'roI~
~,,~ T C• 1 • 5 • 3
Figure 19. Wiring diagram for tbe SiC resistance fumace featuring two Omega CN9•••series controller wbicb allowed for bigb thermal stability in tbe batb.
•
3.2.3. Reaction Vessel
Cathode copper or copper aIloy contained in an alumina crucible was inserted into
a transparen~ cylindrical quartz tube which was sealed on one end with a full radial bonom.
The open end of the tube was made gas-tight with an annular, water-cooled top constructed
ofaluminum that had viton o-rings embedded in its interior wall (see Figure 20(a». On the
horizontal surface of the coolingjacket (see Figure 20(b» a number ofaccess ports equipped
with swagelok fittings accornmodated a gas lance, an exhaust tube, a thermocouple, an
oxygen probe, a sampling tube, and a quartz window (see Table 2 for the dimensions of the
reaction vessel and its accessories).

• Chap_te_,_3_e__E_xpel';mental Methodology 46
Inclined Mirror
O-Ring ----Water Inlet --
Quartz Tube -----II
Alumina Crucible--..-......
,......------- Aluminum Water Jacket,....1-+------- Quartz Window
~------Gas Exbaust
-Water outlet,
t---+-- le
Sampling
1tttt*+---tl--- Oxygen Probe1
Water Inlet
Copper Cbarge---.....--+r--I'--""'-,I
Silica Brick----~
(a) (b)
Figure 20. Scbematic representation of tbe (a) cross section of the reaction vesse1, crucibleand accessories and (b) plan view of tbe AI water jacket and its access ports.
Table 2. Dimensions of tbe reaclion vessel and its accessories.
Item ID 00 LenltblHeightm(mm) m(mm) m(mm)
Hycor AlzOJ Crueible 0.07 (70) 0.08 (80) 0.15(152)
Higb Density AlzOJ Crucible 0.068 (68) 0.072 (72) 0.148 (148)
Quartz Reaction Vessel 0.155 (l55) 0.161 (161) 0.61 (610)
Aluminum Water Jacket 0.165 (165)
Mullite Gas Lance 0.006 (6.4) 0.01 (9.5) 0.61 (6.1)
R-type TIC witb Sbeatb 0.01 (9.5) 0.61 (6.1)
Flexible Exbaust Tube 0.008 (7.94) 0.013 (12.7) variable
• Quartz Sampling Tube(s) 0.003 (3) 0.005 (5) variable
Quartz Window 0.013 (12.7)

• _C_h_a_p_te_'_3_.__E.......xperimenta/ Method%gy 47
A mullite lance supplied inert gas to the reaction vessel during alloy melting and later
introduced 02-N2 gas mixtures onto the melt surface for either oxygen dissolution and/or
desulfurization. Prior to melting of the alloy a flexible exhaust tube in conjunction with a
vacuum pump evacuated the reaction vessel of air but in the heating stage served to vent the
effluent gases. An R-type thennocouple sheathed in alumina was immersed into the melt and
regulated the bath temperature while a submerged oxygen probe monitored dissolved oxygen
levels in the alloy. Both the thennal and oxygen level readouts of the bath were recorded by
a data acquisition unit over the duration of the experiment. Quartz tubes inserted through
the sampling port withdrew copper samples from the melt by applying suction at the exposed
end with a rubber bulb pump. The quartz window, in addition to the transparent walls of the
reaction vessel, pennitted visual observation of the melt surface. A mirror positioned above
the quartz window at a 450 inclination to the horizontal plane reflected the image ofthe melt
surface ioto the lens ofa video camera that was close-circuited to a television monitor. The
complete test apparatus is shown in Figure 21 and Figure 22.
Gas CylindersVideo Camera
& Monitor
Sehematic representatïon 01 the test apparata! when the quartz reaetion vesseland graphite reeeptade were used.
Data AequirerTemperatureControllers
Thermocouples
Fame HoocJ-..-, c:::... ~Hi h Flow RotameterSbut-OrrValves"""/ ~_~./ Low Flow Rotameter
PressureNaeuum 0 1, ~1' t SOl -way ValvesGage Gas Dessieant
Vacuum Pump
Figure 21.•

• Chapter3. Experimental Method%gy 48
•
Figu re 22. Pbotograph of the test apparatus during operation.
Corrosive attack of the experimental equipment by molten copper oxide precipitated
several modifications to the test apparatus. HYCOR alumina crucibles used initially for
containing the alloy charge were replaced with high density alumina crucibles due to the
permeability of the fonner to copper oxide. The susceptibility of the high density crucibles
ta thermal and physical shock required that they be placed in a graphite receptacle (Test 3
ta Test 6) in case offailure. Surface eruptions from the melt necessitated an extension to the
crucible wall to prevent contact and subsequent reaction of melt droplets with the quartz
tube. On-lîne monitoring of the oxygen levels was abandoned after the second test because
of electronic noise in the oxygen readings and the vulnerability of the probes ta corrosive
attack by the melt.
The test apparatus was again altered in later tests (Test 7 to Test 9) because ofthe low
sulfur elimination observed in preceding experiments. This effect was attributed partly to a
reduced oxygen potential in the gas phase resulting fram the oxidation of the graphite

• Chap_te_,_3 E_xperimental Methodology 49
•
crucible to carbon monoxide. The quartz reaction vessel was dropped from use in preference
of the charge being melted in the open atmosphere while the aluminum water jacket
remained as a support for the gas lance~ thermocouple and mirror. The use of HYCOR
alumina crucibles was resumed due to their lower cost and greater durability "·hile the
graphite receptacle was replaced with a larger HYCOR alumina crucible (ID x 00 x L =
0.14 m x 0.167 m x 0.22 m) that was partially filled with silica sand to contain copper spills.
3.2.4 Gas Regulation System
Gas Evacual;onIVent;llIl;on
The exhaust tube ofthe cooling jacket was connected in parallel to a ventilation hood~
a vacuum pump and a pressure gauge as shown in Figure 21 and Figure 22. Air was
evacuated from the tube prior to heating by shuning the Dow line to the ventilation hood and
engaging the rotary vacuum pump until the pressure in the quartz vessel had dropped to 10-;
to 10-5 atmosphere. The vacuum line was then closed, the pump was disengaged and the
evacuated reaction vessel was then backfilled with nitrogen. When the heating cycle was
initiated the ventilation Hne was opened and the heated gases exited into the fume hood.
Gas Delivery
Gases from the nitrogen and oxygen cylinders were directed by individual two-way
valves to either a high flowrate rotameter or to a drying cylinder leading into a low flowrate
rotameter. The gases exiting the low flow rotameters were regulated with precision metering
valves and then mixed in the desired proportions upon exiting the flowtubes before being
channelled into the gas lance above the meh.
3.3 Experimental procedure
Test 1 - Test 6
Prior to melting of the charge~ water flow to the cooling jacket was set at 125-160
cm3/s and the reaction vessel was either evacuated and backfilled with ultra-high purity N2
five times or continuously flushed with nitrogen until seven reactor vessel volumes were
displaced. Upen completion of this cycle the data acquirer was activated and power was

• Chap_te_'_3_.__E_xperimental Methodology 50
•
delivered to the fumace. As the charge was heated~ the reaction vessel was continuously
supplied with nitrogen at a rate of 50-80 cm3/s while the exhaust port was left open to
accommodate for the expansion of the heated gas. At the setpoint temperature of 1523 K.
two or three samples were extracted from the melt to provide a reference composition for O.
S and Ni at the start of the experiment. After the initial samples were taken, top-blowing
with an 02-N2 gas mixture and video recording of the melt surface was initiated. The melt
was then sampled at intervals of lOto 15 minutes for the duration of the test (90 to 240
minutes).
Test 7 - Test 9
The charge was melted in the fumace chamber under a fumehood and exposed to the
open atrnosphere. When the alloy had liquified samples were extracted for a period of 160
minutes in Test 7, 135 minutes in Test 8 and 90 minutes in Test 9 while the charge was
exposed to air. In each test oxygen was top-blown onto the melt al 75 cm3/min for
approximately 50 minutes with continued sampling of the meIt. In Test 9 the melt was
subjected to a stage of submerged nitrogen injection at 2000 cm3fmin.
3.4 Elemental Analyses
Elemental analysis for sulfur and oxygen in the copper alloys and test samples were
conducted by the Technical Services departrnent at lNCO~s Copper Cliff Smelter while
nickel determinations were perfonned at the Depanment of Mining and Metallurgical
Engineering of McGill University.
Sulfur analysis was detennined with a Leco IR 332 combustion analyzer in which a
copper sample weighing 0.1 g to 1 g was induction melted in a red heat environment in the
presence ofoxygen and an iron accelerator. The resulting oxygen and sulfur dioxide stream
was de1ivered to an infra-red detector that quantified the sulfur content of the copper sample.
The accuracy of the detector under normal operating conditions was stated ta he ± 2%~ or 1
standard deviation. The unit was calibrated twice with an iron standard of known sulfur
composition prior to the commencement of analysis and was recalibrated after lOto 20
analyses had been perfonned.
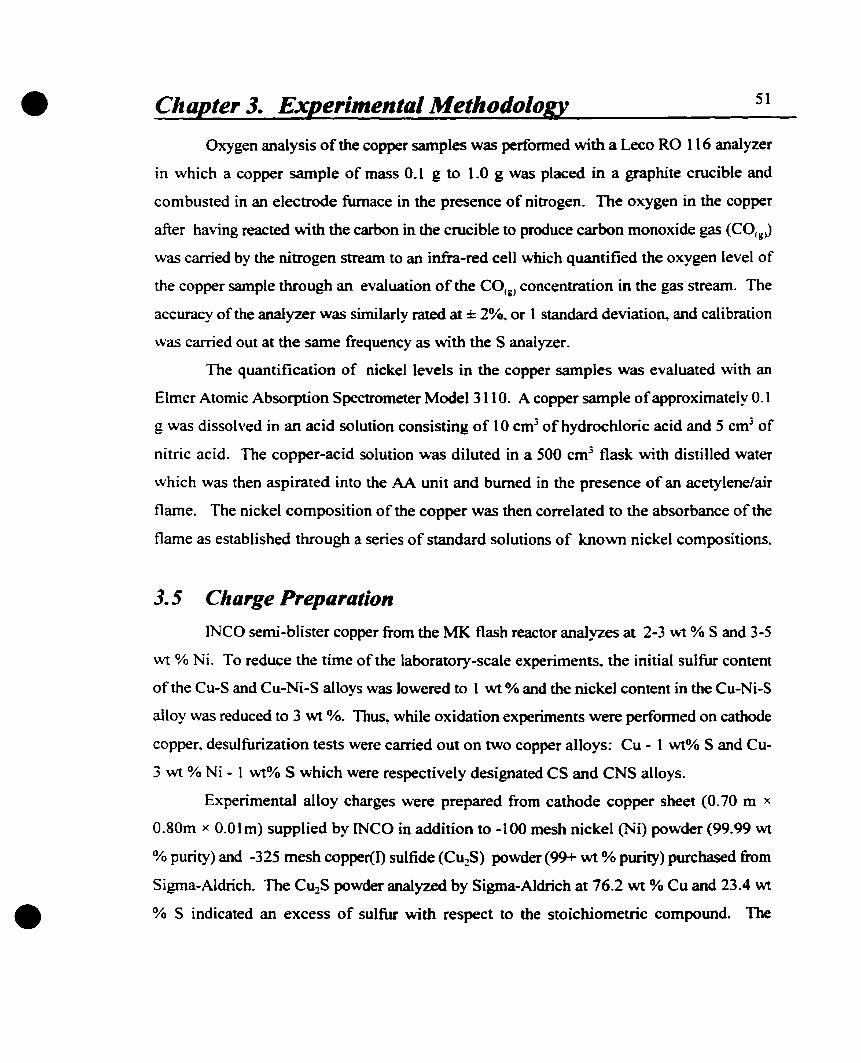
• Chapter 3. Experimental Method%gy 51
•
Oxygen analysis of the copper samples was perfonned with a Leco RD 116 analyzer
in which a copper sample of mass 0.1 g to 1.0 g was placed in a graphite crucible and
combusted in an electrode fumace in the presence of nitrogen. The oxygen in the copper
after having reacted with the carbon in the cnJcible to produce carbon monoxide gas (CO{g»
was carried by the nitrogen stream to an infra-red cell which quantified the oxygen level of
the copper sample through an evaluation of the COtg) concentration in the gas stream. The
accuracy of the analyzer was similarly rated al ± 2%, or 1 standard deviation, and calibration
was carried out at the same frequencyas with the S analyzer.
The quantification of nickel levels in the copper samples was evaluated with an
Elmer Atomic Absorption Spectrometer Model 3Il O. A copper sample ofapproximately 0.1
g was dissolved in an acid solution consisting of 10 cm3 ofhydrochloric acid and 5 cm3 of
nitric acid. The copper-acid solution was diluted in a 500 cm3 flask with distilled water
which was then aspirated into the AA unit and burned in the presence of an acetylene/air
flame. The nickel composition of the copper was then correlated to the absorbance of the
flame as established through a series of standard solutions of known nickel compositions.
3.5 Charge Preparation
INCO semi-blister copper from the Ml( flash reactor analyzes at 2-3 \\'1 % S and 3-5
'-"1 % Ni. To reduce the time of the laboratory-scale experiments, the initial sulfur content
of the Cu-S and Cu-Ni-S alloys was lowered to 1 wt % and the nickel content in the Cu-Ni-S
alloy was reduced to 3 wt %. Thus, while oxidation experiments \vere perfonned on cathode
copper, desulfurization tests were carried out on two copper alloys: Cu - 1 wt% S and Cu
3 wt % Ni - 1 wt% S which were respectively designated CS and CNS alloys.
Experimental alloy charges were prepared from cathode copper sheet (0.70 m x
O.80m x O.Olm) supplied by INCa in addition to -100 mesh nickel (Ni) powder (99.99 wt
% purity) and -325 mesh copper(O sulfide (Cu2S) powder (99+ wt % purity) purchased from
Sigma-Aldrich. The Cu2S powder analyzed by Sigma-Aldrich al 76.2 wt % Cu and 23.4 wt
% S indicated an excess of sulfur with respect to the stoichiometric compound. The

• Chapter 3. Experimental Methodology 52
composition of the cathode copper (see Table 3) was determined by emission spectroscopy
and was perfonned on 10 regions selected randomlyacross the cathode sheet (see Figure 23).
Each elemental assay was derived from 30 determinations i.e. 3 assays from each of the 10
surveyed areas.
Table 3. Average elemental composition of INCO catbode copper sbeet.
Element Composition- Element(wt Olé)
Composition(wt %)
Fe 0.0079 ± 0.0018
Ni
Co
Si
P
Mg
0.04795 ± 0.0153
0.01903 ± 0.0033
0.0126 ± 0.00047
0.0122 ± 0.00084
0.00833 ± 0.0025
Sn
Mn
Cd
AI
Bi
S
0.0037 ± 0.0018
<0.0040
<0.0017
<0.0008
<0.0008
<0.0004·Standard deviation calculated on the basis of the population.
-+ '-1.Ocm
• Figure 23.
SOem
• •:~1---------------~.:
70em
Broadside and cross section of tbe catbode copper sbeet. Elemeatal analyseswere performed OD tbe sbaded l'eIioas.

• Chapter 3. Experimental Methodology 53
3.5.1 ln Situ Alloy Preparation
Preparation ofa Cu-3 wt % S alloy was tirst attempted in a HYCOR alumina crucible
by heating measured amounts ofcathode copper and Cu2S powder under U.H.P. N2 prior to
desulfurization of the melt. In this experiment significant evolution of sulfur dioxide (SO:J
gas occurred during the alloy preparatory stage while the formation of a viscous secondary
phase was observed on the melt surface after oxygen blowing had cornmenced. The
measured sulfur content in the melt at the stan of oxygen blowing had dropped to
approximately 1 wt% as a result of the initial S02 evolution while the frozen slag layer, at
1.5 cm thickness (see Figure 24) was considered to be the reaction product of the molten
charge with components or impurities of the crucible. The crucible composition (see Table
4) consisted predominantly of alumina at 88.3 wt % followed by silica at 11.2 wt % and
minor amounts of other oxides. However a qualitative analysis of the slag phase by X-ray
diffraction (see Appendix A) detected the presence of amorphous copper oxides (CuO and
•
0==
~-
~==
Figure 24.
•
Cross section of crucible and solidified slaglayer from Test 1.

• Chapter 3. Experimental Method%gy S4
•
Cu20) and some Cu2S but not ofany crucible compounds. From these analytical results the
slag layer was believed to have formed by the oxidation of the CUlS powder and therefore
in situ alloy preparation was abandoned after the first desulfurization test. Alloy charges
used in subsequent tests were taken from master alloys that had been prepared in advance.
Table 4. Com ilion of HYCOR alumiaa cruc:ible accordia to tbe manufacturer..
Compouad Composition Compouad Composition(wt -10) (As Impurity) (wt 0/_)
AllO] 88.3 Ti01 0.10
SiOl 11.2 K 10 0.03
F~O] 0.15 MgO 0.03
Na01 0.12 CaO 0.02
3.5.2 Master Alloy Preparation
Two copper alloys at 1 wt% S (CS alloy) and 3 wt % Ni - 1 wt % S (CNS alloy) were
prepared through induction melting ofcathode copper and CUlS powder. and Ni powder (for
the CNS alloy) in a sealed. cylindrical graphite crucible (00 x ID x Height = 9.2 cm x 7.7
cm x 19.1 cm). The proportions of the alloy feed materials were detennined by a mass
balance of the elements where it was assumed that metallic lasses were negligjble and sulfur
recovery was 90 wt 0/0.
The sealed crucible was inserted into the induction fumace chamber and packed with
coarse silica granules to minimize oxidation of the graphite with the outside atmosphere. A
removable centerpiece on the lid of the crucible allowed the charge to be monitored
periodicallyas it was heated. Upon Iiquefaction, the charge was kept molten for roughly 40
minutes to allowadequate time for dissolution ofthe powdered material and homogenization
of the melt. Power delivery ta the induction coils was then suspended and the alloy was left
ta cool and solidify in the crucible. The resulting cylindrical ingot was removed, massed and
then sandblasted to remove any foreign and oxide particulates from its exterior surfaces. The
ingot was sectioned along its vertical axis and drill samples were extraeted from four regions
(see Figure 2S) for O. S and Ni determinations (see Table S).

• Chapter 3. Experimental Methodology
Table 5. Elemental determinatioDs for CS and CNS alloys.
55
CS Alloy CNS Alloy
Sampied 0 S 0 S NiRegion (1ft 0J'.) (wt 0.1'.) (wt %) (wt 0") (wt °4)
1 0.001 0.82 ± 0.01 0.046 1.23 2.86 ± 0.162
2 0.006 0.838 0.023 1.1 1 2.85 ± 0.085
3 0.024 0.80 ± 0.015 0.011 1.08 3.22 ± 0.106
4 0.024 0.80 ± 0.011 0.017 1.24 3.14 ± 0.240
Average 0.014 ± 0.010- 0.81 ± 0.012+ 0.024 ± 0.013- 1.17 ± 0.071- 3.02 ± 0.20·
·Standard deviation calculated on the basis of the sample population
+Standard deviation calculated on the pooled average from the deviation ofeach analysis which is based on twodetenninations per region
1
.....---.......x x ....---........
:z
• Figure 25. Regions of alloy iDiot sampled for elemental determinations.

56•
•
Chapter 3. Experimental Methodology
3.6 Selection ofExperimental ConditionsNine experiments were perfonned at 1523 K+ to investigate the effect ofgas flowrate,
Po: of the gas stream and the presence ofnickel in the melt on desulfurization (see Table 6).
The test conditions were selected on the basis ofprior works and from the observations made
in each test.
The gas flowrates used in the testwork were initially selected to result in low
momentum gas streams, which, upon impingement on the melt surface. would not
appreciably stir the bath or influence the occurrence of surface tension driven flow. Due to
the similarity in the kinematic viscosities ofwater and liquid copper it was assumed that a
water model of the system could provide a reasonable assessment of the level of stirring
anributed to the momentum ofthe gas stream. Water soluble food dye was introduced under
the gas stream and its dispersion was observed under the various gas flowrates. It was found
that at an air flowrate of 100-200 cm3/min no appreciably mixing of the food dye occurred.
Tests 1 through 3 were performed using the copper-sulfur alloy under different gas
flo\\Tates and compositions in order to determine the effect ofthese variables on the rate of
desulfurization. Tests 3 through 6 were conducted under similar conditions with different
alloy charges although the gas flowrate was increased in the later stages ofTests 4, 5 and 6.
a comparison was drawn between the desuJfurization rates of the copper-sulfur (CS)
alloy used in Test 3 and the copper-nickel-sulfur (CNS) alloy used in Test 4. a further
evaluation was made of the dissolved oxygen levels in these alloys which were contrasted
against that for cathode copper (Test 5 and Test 6).
The samples of Test 5 were not assayed on account of the failure of the crucible
containing the copper charge. The final tests in the experimental program (Tests 7 through
9) were designed to assess desulfurization under conditions where the !Wo alloy charges were
melted under air. Reproducibility ofthe testwork was also verified through Test 7 and Test
8 which were carried out with a CS alloy charge under the same experimental conditions.
+-rhe setpoint temperature in Test 1 was lowered to 1498 K because the mell temperature according to thedata acquirer readings had exceeded 1550 K.

• Chapter3. Experimental Method%gy 57
Table 6. Experimental cODditioDs uled for desulfurizatioD aad oxidation tests.
Test Melt Alloyl Charge Stage Gas Lance '~1 :;;z~2
Temp. Charge Mus Flowrate Positioa+K (1) (cml/min) (cm) (atm) (atm)
If 1498 CS 1998 1 169.4 I.S 0.62 0.38
2 1573 CS 1014.5 1 131 I.S 0.50 0.50
3* 1573 CS 1009.4 1 75 1.5
4* 1573 CNS 1092.9 1 7S 1.5Il 372
S* 1573 C.Cu 1011.3 1 75 1.5Il 372
6* 1573 C.Cu 1068.2 1 75 1.5Il 372
7** 1573 CS 830.7 1 Air 0.21 0.79Il 75 1
8** 1573 CS 891.0 1 Air 0.21 0.79Il 75 1
9** 1573 CNS 1035.0 1 Air 0.21 0.79Il 75 1 1III 2000 -1
fin situ alloy preparation of a Cu • J wte!'e S alloyftGraphite receptacle used as spill container
ttt Charges melted uoder an open atmosphere and consequently no nowrate Ï!!i stated in Stage 1.• Distance of the lance tip from the melt surface.
•

58• Chapter 4. Results
4.1 Experimental Results
Test 1: Desulfur;zat;on ofa Cu - 3 wt% S AI/oy
The tirst test of the experimental program anempted to produce a copper alloy of 3
wt % S, in si~ by meiting 0.3 kg (302.0 g) ofC~S powder and 1.7 kg (1696.0 g) ofcathode
copper in a HYCOR alumina crucible under nitrogen gas and subsequently desulfurize this
alloyat 1523 KI with an 02-N2 gas mixture. During liquefaction of the alloy components.
much sulfur was evolved from the melt as was evident by a strong odour ofS02 in the off
gas from the reaction vessel and this was confinned by the initial melt analysis of 1.21 wt %
S. Oxygen-nitrogen gas injection for 71.5 minutes al 170.6 cm3/min and ..Jf>:: = 0.62
decreased the sulfur content of the melt by a further 10 % to 1.07 wt % S while the dissolved
oxygen concentration increased byan order of magnitude from 0.02 wt % to 0.11 wt % (see
Table 7 and Figure 26).
Table 7. Tabulated Sand 0 assays from Test 1 conducted at 1498 K by blowinl an 0zN% gas mixture witb ~Oz = 0.62 at 170.6 cmJ/min on liquid Cu -3 wt°/o S aUoy.
•
Sampling Time [SI [OIM Experimental ConditionmiAules wt Df. wt 0/.
0.00 1.21 ± 5 e-5 0.020 ± 0.005 Melt Homogenization
10.5 O 2 introduced at 105.6 cm3/min
22.3 1.1 7 ± 0.0121 0.050 ± 0.009 O2 blown at 105.6 cm3/min
38.6 0.975 ± 5 e-3 0.085 ± 0.012 O2 blown at 105.6 cm3/min55.3 1.12 0.126 ± 0.009 O2 blown at 105.6 cm3/min71.7 1.09 0.0941 O2 blown al 105.6 cm3/minSI.O 1 07 9,11 ± 0 027 Oz blown al 105 6 cm3/min
Pooled Std. Deviations 9.3 e-3 7.5 e-3MOxygen assays perfonned at McGiII University
Visual recording of the melt surface was tenninated less than 10 seconds after the
start of oxygen blowing due to the failure of the heat shield in front of the video camera.
This brief record of the melt surface showed a luminescent patch beneath the tip of the gas
lance (see Figure 27) but contrary to reports of Marangoni convection in copper meltsn,S9.91,
l The bath controller setpoint was lowered to 1498 K because the output temperature from the data acquirerwas often in excess of 1550 K (see Figure 29).

• Chap_te_'_4_e__R_e_s_u_It._'S 5_9
it did not spread radially outwards at high velocity; instead sorne material was ejected from
this region. Inspection of the quartz reaction vessel at experimenfs end revealed fine
particles uniformly distributed in a circular band (see Figure 28) near the sealed radial bonom
of the quartz tube; a10ng the horizontal tube length the distribution pattern and size of the
particles was more randomized. In sorne regjons large droplets ofejected material (- 0.5 cm)
caused fractures a10ng the vertical length of the quartz tube.
Following severa! minutes of 02-N2 gas blowing a slag layer fonned on the melt
surface which thickened over time and eventually enveloped the tip of the gas lance. Upen
meIt solidification this layer measured 1.5 cm in thickness (Figure 24 in Chapter 3) while X
ray diffraction detennined that it consisted rnostly of Cu:!O~ CuQ and sorne Cu2S.
Penetration of the crucible wall by copper oxide resulted in contact between the melt and the
radial bottom of the reaction tube leading to its failure and termination of the experiment.
~ 0.8-~-;;' 0.6-0.4
~ , •.z:~ 1
tA tust 1 #.-
t ~rI -t -Q• -
t 0.05
0.%
75453015oo +---+--I~+----~-----+---+---+----+----+---+-O
90
Time (minutes)
• Figure 26. The dissolved Sand 0 concentration profile over time in Test 1. The verticalline coincides with the introduction of the Oz-N zlU mixture ORto the meltsurface at 170.6 cmJ/min and .~% = 0.62.

• Chapter 4. Results 60
Figure 27. Pbotograpb of the luminescent patch beneath tbe tip of the las lance in Test 1at the start of 01-N2 185 blowinl. The dark spot OD tube is a large droplet ofmaterial that bad Men ejeeted from tbe bath.
<a) Sehe_atic of the ftlioa on the quartz tube mast afl'ected by the meltejectioas. (h) Pbotograph of the fractuftd radioD vessel Dar lu radial bottomriDCed with dropletl of copper/copper oDde.•
Figure 18.
<a) (h)

• Chap.:.:te:..:..r-.,;4;;",;;..__R~es..;;",.;u~l_ts 61
907560453015o-15
1700-;-------r-------------------1
1
16001 ~
1500~'- .
~ 1400,~ ,
; 1300+
~ 1100 l~ !Q" iE 11007CIl i
E- 10007i
9001!1
800":"
!700---~-..--~--+----i--------...------..---+--~---
-30
Tlme (minutes)
Figure 29. The time-temperature profile of the alloy melt in Test 1 relative to the samplingtime. The horizontalline marks the bath setpoint temperature of 1498K. Thedata during melting of tbe aUoy charge could not he retrieved from the DA unit.
•
Test 2: Desulfurization ofCu -/ ..,t % S Alloy with 66 cnr O/min
Slag formation in Test 1 was initially attributed to the reaction of the melt with the
porous crucible and to an excessive rate of oxygen delivery. Therefore in Test 2~ a 1 kg
(1014.5 g) section ofCS master alloy was melted under nitrogen in a high density alumina
crucible and the oxygen flowrate was reduced to 66 cm3/min while '~2 was increased to 1.
At 1523 K pure oxygen was introduced onto the liquid alloy surface for 156 minutes. Under
these blowing conditions the sulfur content ofthe bath was reduced to 0.62 wt % or by about
40 % (see Table 8 and Figure 30). The dissolved oxygen content increased from 0.23 - 0.47
wt % to a maximum level of0.16 - 0.165 wt % (see Table 8 and Figure 30). An attempt to
monitor the oxygen level in the bath with a submerged oxygen probe failed because the tip
of the probe was consumed by the meh. Although the temperature readings from the data
acquirer were often in excess of 1523 K (see Figure 31)~ the bath temperature controller
consistently displayed 1523 K and therefore no changes were made to the setpoint
temperature in the controller.

• Chapter4. Results 62
Throughout the experiment the melt surface remained free of the type of slag
coverage observed in Test 1 and the characteristic dark surface of the liquid copper was
clearly visible; however a thin, emissive, oxide film collected near the crucible wall (see
Figure 32a) ""'hich after mell solidification appeared as darkened regions on the blistered
copper surface (see Figure 32b). Sorne limited swirling motion ofthis film did take place
but the f10w pattern and velocity were not characteristic of Marangoni convection. The only
surface phenomenon observed was sorne intermittent bubbling on the melt surface. As in
Test 1, there was evidence of material ejection from the melt which appeared as finely
dispersed droplets along the vertical lengili of the cooled reaction tube (see Figure 33).
Despite using a high density alumina crucible~ the cootainer failed and its contents seeped
ooto the quartz reaction vessel resulting in irreparable damage to the tube.
Table 8. Tabulated Sand 0 assays from Test 2 cooducted at 1523 K by blowing pure Ozat 66 cmJ/min 00 the surface of liquid CS allov.
Sampliog Time [SI [0) Experimental StagemiAYtes 'ft 0(, 'ft Olé
0.00 1.03 ± 0.18 0.047 ± 0.024 Melt Homogenization3.30 1.07 ± 0.19 0.023 ± 0.01 1 Melt Homogenization
6.77 O2 introduced at 66 cm3/min
15.63 1.06 ± 0.014 0.05 O 2 blown at 66 cm3/min29.73 0.99 0.11 O 2 blown at 66 cm>/min41.40 0.97 0.1 O 2 blown at 66 cm>/min45.57 0.92 0.064 O 2 blown at 66 cm>/min71.40 0.93 0.068 O 2 blown at 66 cm>/min86.82 0.87 ± 0.014 0.133 ± 0.04 O 2 blown al 66 cmJlm in89.45 0.87 ± 0 0.134 ± 0.008 O 2 blown at 66 cm>/min99.72 0.79 O 2 blown al 66 cmJ/min101.48 0.835 ± 0.007 0.139 ± 0.01 O 2 blown al 66 cmJ/min114.82 0.79 0.144 ± 0.018 O 2 blown at 66 cmJ/min132.98 0.715 ± 0.007 0.139 O 2 blown at 66 cm>fmin144.73 0.68 0.165 O 2 blown at 66 cmJ/min16248 0.62 ± 0014 0,158 ± 0 004 0, blown al 66 cmJ/min
Pooled Std. Deviation 0.087 0.020
•

• Chapter4. Results 63
1."~8.41 ·5
11 -0
1.2 - 11
1 ~ ti t t tt0.3
t#*- 1 -
~ 0.8 t t~•-
t-
~
t0.2 ~- -- 0.6 - QC"IJ
+ + +-
ftO." - +\ 0.1
0.2 ~
l +0 1 01 ,
0 30 60 90 110 ISO 188
Tlme (minutes)
Figure JO. Tbe dissolved Sand 0 concentntion profiles over time iD Test 2. The verticalline coincides witb tbe introduction of pure 0% onto tbe melt surface at 66cmJ/miD.
1600:f
1400/' --........ ;-:&:- 1200
Q..~- 1000•..
iQ~ J
e 800Q~
600
40·r • 1200-90 -60 -30 0 30 60 90 110 150 .10
•Figure JI.
Tlme (mlDutes)
The time temperature pIVfile of the melt in Test 1 relative to the samplinl timet = 0; tbe depression iD the cUn'e Dar 1400 K indicates Uquel.ction 01 tbe .Uoych....e wbile tbe horizontalliDe m.rks the bath setpoiDt temperature of 1!2JK.

• Chap.:..:te:..:..r_4:..:.._--.,;,:.,R;.;;;;e~su;;.:..l:.:.ts~ 64_
<a) (b)
•
Figure 32.
Figure 33.
Photograpbs of the alloy surface and oxide film rrom Test 2 al <a) 1523 K andt = 70 minutes; a higbly emissive solid or liquid oxide De8r tlle cruc:ible wall issurrounded by the darker Iiquid alloy and (b) room temperature wbere tbeblistered alloy surface is partially covered by dark regions of oxidized copper.
Pbotograpb of tbe quartz reactioD vessel, from Test 2, aloDC ils vertic:aIIeDgtbsbowiDI solidined droplets of ejeeted .aterial.

• 65Chap_te_'_4_e__R_e_s_u_/t_'S _
Test 3: Desulfuriz.ation ofCu -1 wt" S Alloy with 75 cml O/min
Due to the loss of two quartz reaction vessels by contact with the melts in Test 1 and
Test 2, the high density alumina crucible used to contain the copper alloy charge was placed
within a graphite spill receptacle (see Figure 21 Chapter 3) while a 15 cm alumina wall
extension was added to the Hp of the alumina crucible to shield the quartz tube from melt
ejections. As in Test 2, a 1 kg (1009 g) section of CS master alloy was melted to a setpoint
temperature of 1523 K under nitrogen. The liquid alloy was sampled three times over a
period of 21 minutes while still under nitrogen and then impinged with pure oxygen at 75
cm3froin for approxirnately 205 minutes. After 130 minutes of oxygen blowing there was
no discernable change in the sulfur content ofthe bath however the oxygen content increased
to about 0.8 - 0.9 wt % (see Table 9 and Figure 34). An additional 75 minutes ofoxygen
blowing reduced the sulfur content to 0.84 wt % while the dissolved oxygen level increased
to 0.12 \Vt %.
Table 9. Tabulated Sand 0 assays from Test 3 conducted at 1523 K by blowing pure 0:at 75 cmJ/min on the surface of a CS alloy chal'Je.
Sampling Time [SI [0) Experimental Conditionmipyta Wt °6 Wt 0/,
0.00 0.953 0.0055.17 0.963 0.024
21.17 0.939
Melt HomogenizationMelt HomogenizationMelt Homogenization
22.58
32.00 0.95646.15 1.0152.92 1.0666.12 168.00 1.0477.50 1.0688.33 0.99391.10 1.04103.78 1.05115.83 1.05
126.33 1.06
• 147.17 1.08
159.33 1.06
0.0060.028
0.0120.0220.0190.022
0.0390.093
0.082
O2 introduced at 75 cm3/min
O2 blown al 75 cm3/minO2 blown al 75 cm3/minO2 blown at 75 cm3/minO2 blown at 75 cm3/minO 2 blown al 75 cm3/minO2 blown al 75 cm3/minO2 blown al 75 cm3/minO2 blown al 75 cm3/minO2 blown al 75 cm3/min
O2 blown al 75 cm3/minO2 blown at 75 cm3/minO2 blown at 75 cm3/min0 .. blown al 75 cm3/min

• Chap..:..;;te~'_4.:;.;.._~R;;;.;:e..:::;.s..;;";;.u..;;,,,,;:lt.::..'S 6_6
O 2 blown at 75 cmJ/min
O2 blown at 75 cmJ/min
O::! blown al 75 cmJ/minO2 blown al 75 cmJ/minO 2 blown al 75 cm]/min
O 2 blown al 75 cmJ/min
0, bloWD al 75 cmJ/min
Experimental Conditions[0)1ft Gli
0.119
[SI"1 G
/,
1
0.985
0.970.819
0.889
0.9450841
169.33
182.08
197.67206.70209.75
220.42228.00
Table 9. COlllin,,~d
Samplinl Timemiputes
0.3
-#.-0.2 :.--0-
1.4....----r----------------------=1==-<\ O••1 .s1 .011.2 111
1 t {t
+ +t 0.1
1
+tT• 0
30 60 90 IZ0 150 180 210 240Time (minutes)
Figure 34. The dissolved Sand 0 concentration profile over time for Test 3 at IS23 K.The vertical line coincides witb the introduction of pure 0 1 onto the meltsurface at 75 cmJ/min.
•
Although observation ofthe bath did Dot reveal any high speed motion ofoxide away
From the region below the lance tip, within 15 minutes ofoxygen injection, the melt surface
was covered by an emissive, oxide layer. Neither the melt nor the oxide penetrated the
crucible.
As in previous tests the bath temperature indicated by the data acquirer usually
exceeded the setpoint temperature of 1523 K displayed by the bath temperature controller
(see Figure 35).
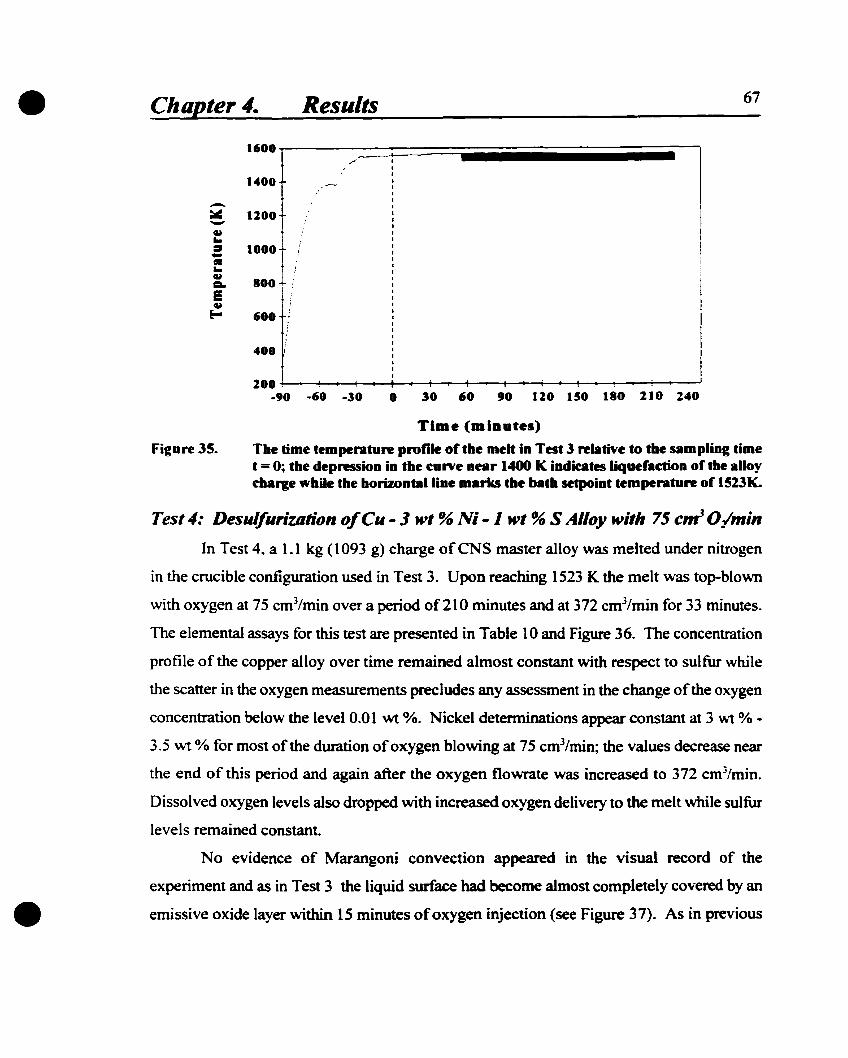
• Chapter4. Results 67
1600/'
/
1400 ~_.
-:lIll: 1200-"~::1 1000-•..QI
800CoEQI~ 600
1
400 i
200 .-90 -CiO -30 0 30 60 90 120 150 180 210 240
Figure 35.
Tlme (mIDutes)
The lime temperature profile of the melt in Test 3 relative to tbe sampliDg timet = 0; the depression in tbe cUn'e near 1400 K indicates liquefaction of the aUoycbarge while tbe horizontalline marks the batb setpoint temperature of 1523K.
•
Test 4: Desulfurization oleu - J H't % Ni -1 H" % S AI/oy with 75 CM O/m;n
In Test 4, a 1.1 kg (1093 g) charge ofCNS master aIloy was melted under nitrogen
in the crucible configuration used in Test 3. Upon reaching 1523 K the melt was top-blown
with oxygen at 75 cm3/min over a period of210 minutes and at 372 cm3/min for 33 minutes.
The elemental assays for this test are presented in Table 10 and Figure 36. The concentration
profile of the copper aIloy over time remained aImost constant with respect to sulfur while
the scatter in the oxygen measurements precludes any assessment in the change ofthe oxygen
concentration below the level 0.01 wt %. Nickel detenninations appear constant at 3 wt %
3.5 wt % for most of the duration ofoxygen blowing at 75 cm3/min; the vaIues decrease near
the end ofthis period and again after the oxygen flowrate was increased to 372 cm3/min.
Dissolved oxygen levels also dropped with increased oxygen delivery to the melt while sulfur
levels remained constant.
No evidence of Marangoni convection appeared in the visual record of the
experiment and as in Test 3 the Iiquid surface had become almost completely covered by an
emissive oxide layer within 15 minutes ofoxygen injection (see Figure 37). As in previous

• Chapter4. Results 68
tests~ the temperature from the data acquirer consistently exceeded the setpoint value of
1523 K displayed by the bath controller (see Figure 38).
Table tO. Tabulated S., 0 and Ni assays from Test 4 conducted at 1513 K with CNS alloyinitially blown with pure 0; jet at 75 cmJ/min and then at 372 cmJ/min.
Sampling Time (S) (0) (Ni) Experimental Stagemjputes WsO/, Ws'/, W, °/,
0.00 1.13 0.004 ± 0.004 Melt Homogenizalion26.17 1.16 3.18 Meil Homogenizalion
28.33 O2 introduced al 75 cc/min
37.67 1.1 O2 blown al 75 cm3/min49.67 1.13 0.052 3.48 O2 blown al 75 cm3/min60.17 1.09 O2 blown al 75 cm3/min66.50 1.11 O2 blown al 75 cm3/min70.17 1.12 0.003 3 O2 blown al 75 cm3/min86.33 1.14 O2 blown al 75 cm3/min101.00 1.12 <O.OOle 3.36 O2 blown al 75 cm3/min115.67 1.04 O2 blown al 75 cm3/min121.67 1.17 0.006 O2 blown al 75 cm3/min131.00 1.15 0.01 3.06 O2 blown al 75 cm3/min141.17 1.13 <0.001 O2 blown al 75 cm3/min152.67 1.16 0.003 O2 blown al 75 cmJ/min161.83 1.13 0.01 3.22 O2 blown al 75 cm3/min174.33 1.16 0.006 O2 blown al 75 cmJ/min185.17 1.15 0.008 3.39 O2 blown al 75 cm3/min195.17 1.16 0.002 O2 blown al 75 cm3/min205.17 1.19 0.003 1.51 O2 blown al 75 cm3/min215.33 1.1 0.004 O2 blown al 75 cm3/min221.83 1.14 O2 blown at 75 crn3/min232.42 1.13 <0.001 2.64 O2 blown at 75 crnJ/min236.62 1.13 0.009 O2 blown al 7S cm3/min
238.80 O 2 introduced at 372 cmJ/min
246.00 1.13 0.006 2.59 O2 blown al 372 cm3/min255.17 1.11 O2 blown at 372 cm3/min261.57 1.12 <0.001 2.61 Oz blown al 372 cm3/min267.50 1.15 <0.001 Oz blown al 372 cmJ/min
• 272.17 1,15 <0001 3}9 03 bloWD at 372 cm3/miD•Oxygen delenninations <0.001 wt % were plotted as zero on subsequent plots of the mellconcentration profile versus time.

• Chap.:..,:te:..:,.'_4.:..:,e_---:::R...:;.:e:..,:s:..:.u:.:.,l.:,.=ts:.-.- 69
0.02
0.03
1 .. S11 ·011 - C-Ni r-I • •1
~ • -1 - - .1111
•++++ ++ ~ ~ ++~1
.~
~ ++H+ +t ++ ~ ++A
11 11 11 11 11 0 1
11
rl
~.~
t,t .... '. 1it 11.14.
A. A
1. . . . --
0.0.
--Z-
...ê=-
0.01
-~--o-
o180 110 140 170110 150906030
oo
o.•
1.6
~1.2-~-......
~ 0.8-
Time (minutes)
Figure 36. The dissolved 5,0 and Ni concentration profile over time in Test 4. Tbe firstand second vel1icallines coincide respectively witb the introduction of pure Ozonto the melt surface at 75 cmJ/min and tben at 372 c:mJ/min.
•Figure 37. Pbotocrapb of the melt lurlace in Test 4 covend by an emissive oxide film at
1523 K and t = 40 min.-ta. The dark region il tbe Iiquid metalsurfaœ tbat wuexposed after a sample bad Men extracted from the melt.

• Chapter4. Results 70
1800 __._-------r------------------...,
1600
,-!
1400-~-~ 1200
=! 100.t;:. aoo l
6001
400 1" .' 1
200 ---+-:--0-'-,-+-1--+-1--+-1........1 -'t-I ........1 -+1-+-1-+-1-I-..lIr--I--+I_I--+I--4I--1i_I--+I_'-+1-""';-120 -90 -60 -30 0 30 60 90 120 IS0 180 110 240 170
Time (minutes)
Figure 38. The time temperature profile of the melt in Test 4 relative to the sampliDg timet = 0; the depression in the cUn'e Dar 1400 K indicates liquefaction of the alloycharge while tbe borizontalline marks tbe bath setpoiDt temPerature of 1523K.
•
Test 5, Test 6: Oxidation ofCathode Copper with 75 and 372 cnr O/m;n
In Test 5 and Test 6 cathode copper was melted under nitrogen in the same crucible
configuration used in Test 3 and Test 4 and subsequently impinged with pure oxygen at a
flowrate of75 cm3/min for 191 minutes and at 372 cm3/min for 20 minutes at 1523 K. The
objectives were to compare the level of oxygen dissolution in cathode copper versus
measurements made for the CS and CNS alloys and observe whether Marangoni convection
would occur more readily under the influence of only one surface active agent i.e. oxygen.
The crucible in Test 5 failed at the start of the experiment which resulted in contact of the
melt with the graphite spill receptacle and hence deoxidation of the copper. This was
evident by a dark and highly reflective melt surface observed for the duration of the
experiment (see Figure 40b). As a result of this event the samples from Test 5 were not
analyzed and the experiment was repeated as Test 6 with a copper charge weighing 1 kg
(1068 g).

• Chap_te_'_4_-__R_e_'S_ul_ts 7_1
The oxygen concentration profile ofthe copper meit over rime in Test 6 is tabulated
in Table Il and graphically depicted in Figure 39. During oxygen blowing at 75 cm3fmin,
the oxygen detenninations were widely scattered between 0.001 wt % and 0.01 wt %; at the
higher oxygen flowrate of 372 cm3/min the dissolved oxygen level increased to between
0.285 wt % and 0.373 wt % after 20 minutes ofblowing.
Table Il. Tabulated 0 assays from Tnt 6 cODducted at 1513 K by blowiDg • pure 0: jetat 75 cmJ/miD OD the surface of a cathode copeer.
SampliDI Time (0) ExperimeDtal CoaditioamiAules Wc °A
0.00 0.009 Melt Homogenization7.12 0.031 Melt Homogenization
8.78 0 .. introduced at 75 cc/min
17.95 0.006 O 2 blown at 75 cmJ/min28.22 0.005 Oz blown al 75 cmJ/min37.48 0.093 Oz blown al 75 cmJ/min49.12 0.0008 Oz blown at 75 cmJ/min57.95 0.0015 Oz blown al 75 cm3/min67.85 0.0036 Oz blown al 75 cm3/min78.03 0.018 O 2 blown at 75 cm3/min87.63 0.0018 Oz blown al 75 cm3/min97.95 0.0088 Oz blown al 75 cmJ/min107.78 0.0019 Oz blown al 75 cm3/min117.53 0.0036 Oz blown al 75 cmJ/min128.20 0.003 Oz blown al 75 cmJ/min137.53 0.0032 Oz blown al 75 cm3/min147.95 0.0026 Oz blown al 75 cmJ/min157.57 0.0033 Oz blown al 75 cmJ/min167.37 0.0089 Oz blown al 75 cm3/min177.37 0.0039 Oz blown at 75 crnJ/min187.37 0.028 Oz blown at 75 crnJ/min197.37 0.002 0., blown at 75 crnJ/min
199.95 0 .. introduced al 372 cmJ/min
207.45 0.373 Oz bJown al 372 cm3/min213.38 0.289 Oz blown al 372 cmJ/min220.62 0.309 O 2 blown al 312 cmJ/min221.28 0.392 Oz blown al 312 cmJ/min
• 234.35 0.285 Oz blown al 312 cm3/min23942 0316 Pl bloWD al 372 cmJ/min

• Chap.:...:te:....;,.'_4.....;,._-.;";,,.R..;.,,;e;;,,;,;;s....;.,;u;.:,,;It.:.;;:,'S 7_2
ln contrast to Test 5, the surface ofTest 6 became covered by an emissive, oxide layer within
10 minutes of oxygen injection (see Figure 40a). Marangoni convection was not observed
in either ofthese experiments and as in previous tests the melt temperature values from the
data acquirer and the bath controller display often differed (see Figure 41).Il 1il
,. Left Axi_ 1 1'1 ,'1 o Rillat A_i_
l
+0.04 " 1~O.4,
j+1,1'1
•:. 1" 1
l1 •
++~~ •0.03 1 0.3,
1: • ,,~ '. 1 'fi!• 1- '. 1 -1
~ :1 ~- il -..- 0.01 .~ " 0.1 -,.0 i' • Q- " -
"
,l,1Ill,,.
0.01 ~. • 1• • ~•• ! i1 •1 • i 1
11 i
~ ~1 ! • • • i~1
, • ~• • 1 • • , i i.· • 1 :. 1. T
30 60 90 110 150 180 110
0.1
•
Figure 39.
Figure 40.
Time (minutes)Tbe dissolved 0 concentration proftle over time in Test 6. Tbe first and secondverticallines coincide respectively witb tbe introduction of pure 0 1 onto themelt surface at 75 cmJ/min and tben at 371 cml/min.
(a) ~)
Pbotograpbs of the meh surface at 1513 K la (a) Test 6 covered by an emissiveoside layer alter 11 minutes of0 1 blowinl (Le. ....... = 31 miautes) aad (h) Test5 after 35 miDutes of O 2 blOWÎnl at 75 cmJ/miD; note tbe mirror image 01 tbelU lance on tbe dark but refleetive melt surface.

73
1111
~-~_. --·-·urrr•• _
o 30 60 90 120 ISO 110 210 240
Tlme (minutes)
The time temperature profile of the melt in Test 6 relative to the samplinl timet = 0; tbe depression in tbe cUn'e near 1400 K indates liquefaction of tbe alloycharge while tbe borizontal tine marks the bath setpoint temperature of 1523K.
Figure 41.
• Chapter4. Results
1100
1600 f-
- 1400::.=-u 1200..:1-• 1000..u~
E 100ue-600
400
200-120 -90 -60 -30
•
Test 7, Test 8: Desulfurization ofCu-l "'t % S Alloy Exposed to Ai,
ln Test 7 and Test 8, CS master alloy charges. weighing respectively 0.83 kg (831g)
and 0.89 kg (891g), were melted in HYCOR alumina crocibles under air with the objectives
of measuring sulfur elimination of stagnant melts exposed to the open atmosphere and
verifying the reproducibility ofexperimental results. In bath tests the crucibles were placed
within a larger HYCOR alumina spill receptacle which was partially filled with silica sand.
The melt surface in both tests became partially covered with an oxide layer from the
onset ofsampling which was initiated just prior to the melt reaching 1523 K (see Figure 42).
[n both tests, the melt spontaneously etTervesced (see Figure 43), Le., erupted with bubbles
and vigorously agitated the bath for 10-20 minutes, which destroyed the oxidized surface
layer and accelerated sulfur elimination. A period of melt quiescence followed this
effervescent episode after which the melt erupted for a second tïme. These eroptïons sprayed
materia! from the melt onto the interior fumace chamber and ooto the fiberfrax iosulation
caver located 44 cm above the melt surface. The composition profiles over time ofTest 7

• Chapter4. Results 74
and Test 8 are tabulated in Table 12 and presented in Figure 44 which also marks the onset
of effervescence in both tests. The sampling rime in Test 8 was adjusted to coincide with
time scale ofTest 7 when the melt assays are almost identical at about 0.16 wt % S. Oxygen
impinged on the melt surfaces ofboth tests at 75 cm3/min did not appear to affect oxygen
dissolution or sulfur elimination from the melts (see Figure 55, Chapter 5) and both tests
showed thennal deviations from the setpoint temperatures which were unrelated to the
surface eruptions. The source of these deviations remained undetennined.
Similar repons ofeffervescence were made by Rioux'o.. in desulfurization tests ofCS
alloy charges top blown with oxygen at 75 cm3/min, 500 cm3/min and 1000 cm3/min. The
charges were melted in the experimental apparatus used in this study and under the same
crucible configuration and conditions used in Test 7 and Test 8 ofthis study. Rioux aIso did
not observe any instances of Marangoni convection in any of the tests.
Table 12. Sand 0 determinations for Test 7 and Test 8. The time scale in Test 8 has Menadjusted to coincide with tbe sampling time of Test 7 at t = 61 minutes wherethe 5 content of both melts is similar.
15281511
1528
1454
1414
148815001503
1514
0.165
0.473
0.2090.2760.197
0.192
0.056
0.314
0.233
0.1610.161
0.183
0.333
0.0620.056
1524
1522
0.393
0.061 14000.445 1459
0.089 14930.425 1517
0.136 1521
0.274 1529
0.234 1517
0.164 1528
0.045
0.00
10.00
20.00
30.00
31.67
37.57
41.1345.50
50.0555.50
61.00
62.67
68.34
70.42
75.50
82.05
83.1793.50
Time Test 7 Test 7 Test 7 Test 8 Test 8 Test 8(5) (01 Temp. (SI (0) Temp.
o 0 0 0
•

• Chapter4. Results 75
Table 12. ContinuedTime Test 7 Test 7 Test 7 Test 8 Test 8 Test 8
[SI (01 Temp. (SI [01 Temp.0 0 0 0
93.53 0.25 1524104.00 0.57 1531
109.10 0.062 1527
116.00 0.019 1513
123.55 0.235 1512125.84 0.02 1523126.95 0.056 0.598 1525
137.88 0.044 1534139.02 0.246140.95 0.021 1510148.67 1.5 1514158.15 0.019 1536162.05 0.615 1529168.00 0.013 1507174.
• Figure 42. Photograph of the melt surface in Test 8 covered by aD emissive ollide atapprollimately t = 0 minutes. The darker spots are the ellposed surface of theliquid alloy.

• Chap_te_'_4_e__R_e_s_u_/t._s ---'-6
Figure 43. Pbotograpb of the mett surface effen'escing in Test 8 at t = 28 minutes.
0.811
T ••• 7 Tea.' 1
• S ô1
0.7 i- lr
• 0 0
0.6 ~ <P- <P~
t- 0.5 ..~ cp-- 0.4 .. +0 1
1-..
l...- 0.3 ...~- li + +1+0.%
1+cp
if t 10.1 + 1
1Jo 4~ ~ • 1
L,I .::. AJ0 . ~, e- L'.. ~. . .
0 30 6. 90 1%0 150 II.
Tlme (mlautes)
•Figure 44. The dissolved Sand 0 concentration profiles over time for Test 7 and Test 8.
The dashed and 50Iid vertical Iines respectively mark the occurrence andduratioD of effervescence in Test 7 and Test 8.

• Chap_te_r_4_e__R_e_s_u_/t_'S 7_7
1100 ~---------------------------...,
1'00
1400-~- 1%00~..=-CIl 1000..~
CIooEi 100~
P.600
400
200-90 -60 -30 o 30 60 90 120 150 1110 210 240
Figure 45.
Time (minutes)
The time temperature profile of the melt in Test 7 relative to the sampling limet =0; the plateau in the cUlVe near 1400 K iDdicates liquefaclion of the alloycbarge 'l'bile tbe borizontalline marks the bath setpoiDt temperature of 15Z3K.
1800
1'00
1400-~- 1%00~..=-CIl 1000..101c:a.Ei 800G.l
P.600
400
200-90 -60 -30 o 30 '0 90 120 150 110 210 240
• Figure 46•
TilDe (lDinutes)
The dme temperature profile of the melt iD Test 8 relative to the sampliDI limet = 0; the plateau iD the cUlVe Dur 1400 K indicates liquefaclion of the alloycharge 'l'hile the horizontalline marks the bath setpoiDt temperature of 1513K.

• Chapter 4. Results 78
Test 9: Desulfur;zat;on DIeu - J wl " Ni -1 wt " SAI/Dy Exposed to Air
The same conditions and crucible configuration which were used in both Test 7 and
Test 8 were applied in Test 9 to measure sulfur elimination trom a 1 kg (1035.0 g) melt of
CNS master alloy. The concentration profile of the melt (see Table 13 and see Figure 47)
shows a graduai decrease of sulfur over time and no greater degree of oxygen dissolution
over the copper-sulfur melts in Test 7 and Test 8; nickel assays do not showany obvious
trend and are above the Mean alloy concentration. No spontaneous eruptions were observed
and the melt surface always remained covered by an oxide layer (see Figure 48). Submerged
nitrogen stirring of the bath did not affect the nickel and oxygen levels in the bath~ but the
increased melt agitation did result in greater sulfur removal. The time temperature profile
of the bath~ sho~ in Figure 49~ displayed deviations from the setpoint temperature of 1523
K al periodic intervals.
Table 13. Tabulated S. 0 and Ni assays from Test 9 for CNS aUoy melted uader air aadtbea blowD witb pure 0 1 al 75 cmJ/min and finally subjected to submerged N1injection at 2000 cmJ/min.
SamplïDg Time (SI (0) [Ni) Temp Experimental ConditionmingtCS w'°4. wtOt. ft1°6 K
0.00 0.673 0.119 3.01 1418 Meil exposed to air10.57 0.465 0.146 1472 Meil exposed to air20.82 0.046 0.191 4.39 1502 Melt exposed to air30.07 0.329 0.21 1522 Meil exposed to air36.88 0.374 0.215 1530 Meil exposed 10 air43.90 0.358 0.22 1520 Meil exposed to air45.20 0.309 0.228 5.03 1518 Meil exposed to air49.88 0.292 0.195 1515 Meil exposed to air
59.95 0.211 0.192 1531 Meil exposed to air
61.23 0.282 0.187 4.84 1531 Meil exposed to air
69.82 0.25 0.232 1517 Meil exposed to air
72.73 0.23 0.266 1513 Meil exposed to air
79.90 0.223 0.265 1523 MeIl exposed to air
89.73 0.064 0.316 1530 Meil exposed to air
91.73 0.181 0.276 4.17 1523 Melt exposed 10 air• 92.73 O2 introduced al 7S cmJ/min

• Chapter4. Results 79
Table 13. Co"';nll~d
Sampliai Time (S) (0) (Ni) Temp Experimeatal Conditionmingtes m-a "'04p "'-4p "110.72 0.173 0.373 4.78 1536 O2 blown at 7S cm3/min120.02 0.415 1514 O2 blown at 7S cm3/min121.68 0.193 0.38 1509 O2 blown al 75 cm3/min130.73 0.161 0.426 2.46 1520 O~ blown at 75 cm3/min143.73 N., injection at 2000 cm3/min147.15 0.02 0.366 3.85 1508 N2 injection at 2000 cm3/min152.05 0.143 0.502 1507 N2 injection at 2000 cm3/min153.52 0.002 0.467 1510 N2 injection at 2000 cm3/min160.20 0.001 0.469 3.21 1531 N2 injection al 2000 cm3/min169.85 0.003 0.542 1521 N2 injection al 2000 cm3/min182.07 <0.001 0.525 363 1524 Nz injection aI 2000 cm3/mjn
1i 10
1 ô]1 1• 01 1
• 1 1 -Ni• ~ • 10.8 .~ 1. •
;~1 •1
• 1- 4~,
fi! 1- 0.6 ~tft!S +-
f+.~ 1 -- ++ +
~0 --
!tlt ttt t++ + -0.4 .~ -..
+ z- +e:I.J --+lo.z .• + t f f+ a
alA. .!0 • . 1 iA. 1
0.1. • . •0 30 '0 90 110 150 110
Time (miDutes)
Figure 47. The S, 0 aad Ni cODceDtntïoD profile over time in Test 9. The verticalliDes
• coïncide respectively l'ith the iDtroduction ofpure 0XYleD ODto .lIe melt surfaceat 75 cmJ/miD aDd submerged aitrogeD injection at 2000 cmJ/miD.

• Chapter4. Results 80
Figure 48. Pbotograpb of tbe melt surface in Test 9 covered by an oxide layer at t = 32minutes.
1800
1600
- 1400~-~.. 1%00=-al..
1000~=-E~ 800e-
600
400
%00-90 -60 -30 o 30 60 90 1%0 150
•Figure 49.
Tlme (minutes)
The time temperature profile of the melt iD Test 9 relative to the samplial tilDet = 0; tbe plateau in the cunte near 1400 K iodicates liquefacdoa of the alloycbarxe white the horizontal Uae marks the batb 5etpoiDt temperature of 1523K.

• Chapter4. Results 81
•
4.2 Discussion ofErrorsSevera! sources of uncertainty can he identified and related to the scatter in the data
plots. These include the error introduced by the analytical metho~ uncertainty from the
sarnpling procedure, i.e., with respect to the depth and position ofthe sampling point and the
size ofeach sample, and contamination of the quartz sampling tubes. The error of analysis
for Sand 0 assays, according to INCO, was within 2 % ofthe detennination; uncertainty due
to contamination of the sampling tubes could not he easily identified while evaluation of the
sarnpling error, by the simultaneous extraction oftwo samples al the same depth and position
in the melt, could not he perfonned accurately due to technical constraints on the test
apparatus. To minimize the sampling error, all attempts at sampling were directed to the
bottom ofthe melt however this May have also introduced an additional source ofuncertainty
by stirring the melt. Having two unknown quantities il was not possible to separate the
contribution of each error source in the computation of the sample variance or standard
deviation. ather sources of error which were not considered in this analysis included the
accumulated mass loss from the melt due to sampling, which did not exceed more than 5-6%
of the initial charge mass, the periodic adjustments made to the gas rotameters to maintain
the desired gas flowrate and with respect to comparisons and the difference in the charge
masses between the experiments since this was usually less than 10%. Statistical anomalies
in the elemental detenninations, especially those of oxygen, may have been caused by the
oxidation of the sample during its transfer to the quench bath or the withdrawal ofoxidized
surface material rather than bulk liquid from the mell.
The standard deviation of the S and a detenninations applied in Tests 2-9 are mostly
based on the pooled average of the sample standard deviations calculated from Test 2 while
the values calculated in Test 1 were applied ooly to that experiment. This approach was used
because the calculated deviation for S was higher in Test 2 over Test 1 while the standard
deviation for oxygen in Test 1 was based on elemental determinations performed at McGill
University rather than at INCO. The sample standard deviation for oxygen at low
concentration «0.01 wt % 0) was estimated from one result in Test 4 to he 0.004 wtO.IO since

•
•
Chap_te_'_4_e__R_e_s_u_/t._'S S_2
a similar calculation could not he perfonned from the assays in Test 2. The standard
deviation of oxygen detenninations between 0.01 wt % and 1 wt % was taken as 0.020 wt
% from while readings above 1 wt % 0 were not plotted with an assumed standard de\t;ation.
ln ail tests the standard deviation of the sulfur assays between 0.1 wt % and - 1 wt % was
assumed to he 0.087 wt %; S assays below this range were not ploned with a standard
deviation because no repeat detenninations were perfonned on Iow suifur sampIes which
were near the lirnit of the analytical method.
The results of the nickel detenninations in Test 4 and Test 9 are difficult to assess
because repeated analysis of the samples consistently registered values higher than the Mean
concentration of the CNS master alloy ingot with aimost no variance. The nickel standard
solutions used for the analysis were reproduced several times without affecting the elemental
detenninations. Hence the high nickel readings May have arisen from contamination of the
samples by the oxidized surface layer of the melts or the influence ofan unaccounted minor
eJement in solution with the melt samples; interference from dissolved copper was not
considered because the relevant atomic absorption literature precluded that possibility.
Satisfactory regression analyses could not he perfonned on plotted data due to the
high standard deviation ofanalysis in Many of the samples following Test 1. The calculated
standard deviation of the sulfur assays was 0.087 wt % and represented almost 10 % of the
initial sulfur concentration whereas the standard deviation of the low oxygen measurements
aimost matched the elemental determination. As a result of the large uncertainty in the
plotted data and therefore the numerous possibilities regarding the selection of a best fit
curve attempts at regression analyses of the data were abandoned.

83•
•
Chapter 5. Discussion
5.1 Discussion ofResults
5.1.1 Marangoni Convection
The hypothesis presented in Coopter 2 presumed that sulfur removal from a copper
nickel-sulfur melt might he impeded by the cessation of Marangoni convection upon oxygen
saturation of the melt and nickel oxide formation blocking the melt surface. Marangoni
convection was not observed in any of the experiments performed at the selected oxygen
flowrates. Slag accumulation on the melt surface in Test 1 obstructed surface observations
yet in Test 2~ where a lower oxygen flowrate and a CS alloy prepared in advance were used
to prevent excessive slag formation., the melt surface remained highly visible and no
instances of Marangoni convection were observed. Instead., a thin oxide film was seen
swirling at low velocity on the melt surface but this motion could he attributed to the
impinging gas glancing against oxidized particles. However. sulfur removal. in the absence
of the slag layer~ proceeded more rapidly in Test 2 over Test 1 in spite of the reduced gas
tlowrate (see Figure 50).
Due to the absence of Marangoni convection in Test 2~ the oxygen flowrate in Test
3 (CS melt) was increased to 75 cm3/min while the test crucible was cemented to a wall
extension and placed in a graphite receptacle intended to prevent melt spills and ejections
from damaging the quartz reaction vessel. Test 4 and Test 6 were similarly conducted with
charges ofCNS alloy and cathode copper respectively. The results of these three tests (see
Figure 51) revealed that oxygen dissolution was greatest in the CS alloy ofTest 3 and while
sorne sulfur removal took place in Test 3 none occurred in Test 4. No instances of
Marangoni convection were witnessed in any of these three experiments but all the melts
experienced surface oxidation., although not to the extent seen in Test 1. The effectiveness
of the slag layer against the transfer of reactants or reaction products to and from the gas
liquid interface was made evident from the results ofTest 2 and Test 3 (see Figure 52) where
a greater degree of sulfur elimination was acmeved in the fonner using a lower oxygen
tlo\\Tate and where the observed surface oxidation was much less and partially in the fonn
of a fluid film rather than a solid layer.

• Chap_te_'_5_-__D_iS_C_"_S_S'_·O_R 84
0.3
-~•-0.2 ~-Q-
0.1
0.4
818015030
1
1 T ••'l T ••• l1 • S A1
,j 1 .0 0
tt! f tAttA • • .~
t#*t~
t ~ ~~
+
1+ + + ++ + + + + ,.
f+. ft+ + +
. .. .oo
1.4
1.2
t
-~ 0.8•-~-r.I'l 0.6-
0.4
0.2
60 90 120
Tlme (minutes)
Figure 50. Tbe concentration profiles over time in Tests t and 2 adjusted to tbe lime scaleorTest t. The verticalliDe coincides witb tbe start oro1 delivery to botb melts.
1.4 0.2
-';;!.-~--Q-
0.15
0.1
0.05
t
11
f t
t t LT~3T~4T""o. 0 a
1
1.2
0.6
0.8
0.2
0.4
r.I'l-
-fi.-~-
• Figure 51.
0~-+-......;t--=-"""'~~~~~-4'i----f..w.&.""''''~~114---''~~~--+0
o 60 90 120 150 180 218 240
Tlme (minutes)
Tbe concentration prordes over time in Tests 3,4, and 6 adjusteel to tbe timescale in Test 3. Tbe vertical Une coincides witb tbe stan of0 1 delivery to .U tbemelts.

• Chapter 5. Discussion 85
1.4 o...1 T ••• % Tn.31 • S 41
1.1 1 .0 0
t~ ttttt* ti t tt t tt f tf tf0.3
1
- *t f-
~ 0.8
t tfit- -
~
t0.1 •- -- 0.6 -C"I.l
*++0- -+ +++
o...
+ +0.1
+ + +0
30 60 90 110 150 180 110 2..0
Time (m iD utes)
Figure 52. Tbe concentration profiles over dOle in Tests 2 and 3 adjusted to tbe fiOle scaleorTest 3. Tbe verticalline coincides witb tbe star! oro1 delivery to botb mells.
5.1.2 The Role ofSurface Films on Mass Transfer
•
Surface oxidation and hence the minor amount of desulfurization in Test 3 and Test
4 cao he related to the blowing conditions and lack ofmelt agitation. Oxygen saturation of
copper melts is typically in the range of 1 wt % at 1523 K and even higher for Cu-Ni melts
according to the Cu-Ni-O phase diagraml9.J6 (see Figure 7, Chapter 2) because nickel
suppresses the activity coefficient of oxygen to about 0.7 at 1523 K37 and hence increases
oxygen activity. ln Tests 1 - 6 the recorded oxygen values were much below oxygen
saturation with the CNS alloy showing the least tendency to dissolve oxygen and the greatest
likelihood to oxidize its metallic components.
Thennodynamics predicts that nickel oxidizes more readily than either copperlOS or
sulfur; this was observed in Test 4 when the dissolved oxygen and nickel content ofthe melt
had dropped as the oxygen flowrate was increased from 75 cm3/min to 372 cm3/min,
presumably due to increased nickel oxidation, while the sulfur level remained unaffected.
The low oxygen flowrates impinged on the melt surfaces did not induce any melt agitation

•
•
Chap_te_'_5_-__D_i_sc_"_s_s_io_n s_6
and in tum would have led to low rates of surface renewaI thereby established and
maintained large concentration gradients ofoxygen between the melt surface and the bulk
liquid. As previously mentioned in Chapter 2, Richardson7\ estimated that an iron melt
containing one·tenth its saturation level ofdissolved oxygen, would attain surface saturation
with a monolayer of the dissolved species within milliseconds. If surface saturation is
readily established in a stagnant melt then surface oxidation becomes thermodYnamically
favourable and the surface concentraùon gradients needed to drive Marangoni convection
are dissipated. Sorne support to these arguments are aIso found in the observations made in
Test 5. The crucible containing the cathode copper had failed aImost immediately bringing
the melt into partial contact with the graphite crucible for the duration of the experiment; the
copper being continuously deoxidized was not subject to the surface coverage observed in
Test 3, 4 and 6 and yet Marangoni convection did not take place. If the melt had been
sufficiently stirred then rapid surface renewaI May have maintained sufficient surface
concentration gradients but under the prevailing bath conditions this May not have occurred.
5.1.3 Melt Effervescence
The difficulty in achieving substantial sulfur removal from Tests 1 through 4,
prompted Tests 7 and 8, and 9. using CS and CNS alloy charges respectively, to he melted
under air in order to measure desulfurization of unperturbed melts exposed to the open
atrnosphere. Knacke and Probsfs96 diagram (see Figure 15, Chapter 2) indicated that melting
ofa Cu-S alloy would lead to large scale sulfur evolution during melting or solidification and
therefore the initial meil assays were not unexpectedly below 0.5 wt% S. Two conclusions
relating to the earlier tests can he drawn: melting ofthe alloy charges under ultra-high purity
nitrogen in Tests 2, 3 and 4 was necessary to prevent significant desulfurization prior to
oxygen injection and evidence of melt ejections in these earlier tests cao he partly attributed
to SO;! evolution during solidification ofthe charges upon completion of the tests. Although
the melts in Tests 7 - 9 experienced surface oxidatio~ oxygen absorption and sulfur removal
occurred to a greater extent in these tests over previous attempts with oxygen blowing at low
flO\\'Tates. Desulfurization of the exposed melts was expected to he gradual in these

Figure 53.
•
•
Chap_te_'_5_e__D_i_sc_"_s_s_io_n 8-7
experiments. However in Tests 7 and 8 spontaneous effervescence for a 20 minute period
caused disintegration or digestion of the oxidized surface Layer and accelerated sulfur
elimination; the CNS alloy charge in Test 9 did not experience turbulent eruptions and
therefore sulfur elimination progressed gradually and to a lesser extent than in the CS melts
(see Figure 53). At the time of the eruptions~ the alloys had fully liquified and therefore the
phenomenon could not he attributed solely to the melting process since several periods of
effervescence were witnessed over the duration of the experiment separated by intervals of
melt quiescence. Effervescence is believed to occur when the melt has reached a certain
degree ofoxygen super-saturation; the effervescence stops when the leve1 ofsuper-saturation
or the "driving force" for S02 evolution is insufficient to nucleate bubbles.
0.1
1T•••• T....
8.6+ · S 6 !
1 1
i !1 1
.!, 0.4 t Il
- 1
~ 0.11 i ft t t t t t 1
i ± ...6 • 1
o ....!-_1- -+---+-----i!'---+---+I--~IA=---::;"!,--_A::;;:,.__Io 30 60 90 110 ISO
Tlme (minutes)
The S concentration profiles over time in Tests 8 and 9. The sampling lime inTest 8 was adjusted to the time scale of Test 9 wben a similar S concentrationis obsenred in both melts.
Effervescence in Cu-S alloy melts was aIso witnessed by Rioux IC),J while examining
the effect ofjet momentum on desulfurization from CS and CNS alloys melted in the test
apparatus ofthis study and in similar conditions to Tests 7~ 8 and 9. In Rioux ~s experiments,
a pure oxygen gas stream was delivered onto the mell surface from a gas lance 1 cm above

• Chap_te_'_5_e__D_'_·s_C_"_ss_i_o_R 88
the bath at 75 cm3/min, 500 cm3/min and 1000 cm3/min for the CS alloy and at 1000 cm3/min
for the CNS alloy. The results of Rioux's experiments, reproduced in Figure 54 without
alteration, show more rapid sulfur removal with increased oxygen delivery to the CS melt
whereas sulfur elimination from the CNS alloy was slower than for the CS alloy blown at the
same oxygen tlowrate. A comparison of Rioux's CS alloy experiment blown with 75 cm3
O!min to the concentration profiles over time ofTest 8 show a fair degree of similarity (see
Figure 55) and indicates that this modest injection ofoxygen contributed little if anything to
the ensuing desulfurization. According to Rioux, increasing the gas flowrate accelerated the
onset ofeffervescence in the CS melts but did not provoke Marangoni convection; it should
be noted however that the turbulent conditions created on the melt surface at higher jet
momentum could have precluded witnessing such an eventuality. Some bubbling observed
by Rioux in the CNS melt was subdued compared to the eruptions of the CS alloy blown at
the same oxygen tlowrate; this result was probably due to the rapid coverage of the melt
surface by NiD which aIso proceeded to consume the alumina sheath of the bath
-~•- 0.1~--~- 1
• es AUoy
6. eN! AUoy
•0.01 +.--+--~--+---i--+-~--+---1I---+---1I---+--I---+-~I---+--1
o 20 40 60 10 100 120 140 160
Tlme (minutes)
Figure 54. The S concentration pronle Crom CS aUoy blo.n with 0 1 at 75 cmJ/min, SOOcmJ/min and 1000 cmJ/miD and froID CNS alloy blown with oI)'gen at 1000cmJ/min, accordinl to Rioas·....

• Chapter 5. Discussion 89
0.8 1
I.6RIO.S 1.T••••
~~
0.6 .6
1/t- .6~ 0.4--~
~-1
.6 111
0.1 i 1111
.6 ~
••• .6 4• • • ......o . T .
0 30 60 90 120 150 180 210
Time (minutes)
Figure 55. The S concentration profile over time iD Test 8 compared to Rioux's testworkwith CS aUoy blown with oxygen at 75 cmJ/min. The time scale in Test 8 isadjusted to Rioux's sampling time wheD a similar S concentration is observedin both melts. The verticalline indicates the start of 0 1 blowing at 75 cmJ/minin Test 8.
•
5.2 Summary
This study failed to correlate the cessation of Marangoni convection as a factor in
diminished sulfur elimination from Cu-Ni-S melts or observe surface tension driven flow in
any of the copper and copper alloy melts used in this testwork. The causes of slow sulfur
removal observed in this investigation can he attributed to the low oxygen flowrates used in
the experiments which did not provide a sufficiently high rate ofoxygen delivery to the melt
or in tum agitate the liquid charges. As a consequence of melt quiescence large
concentration gradients May have developed between the bath and the bulk liquid leading to
surface oxidation and elimination of the surface concentration driving force required for
Marangoni convection. In this regard, nickel oxidation in the copper-nickel-sulfur melts
proved to he more effective in reducing or preventing desulfurization over the copper
oxidation in the corresponding copper-sulfur melts. In the absence ofMarangoni convection,
melt effervescence was the only observed surface phenomenon that May have led to

•
•
Chap_te_'_S_e__D_is_c_u_s_s_io_ft 90
accelerated sulfur elimination from the copper-sulfur melts; again nickel oxidation May have
been responsible in suppressing this phenomenon and hence sulfur removal from the CNS
liquid alloy. Under the conditions of low oxygen blowing and open atmosphere
desulfurization the progress of sulfur elimination and oxygen dissolution should he
considered in tenns of resistance to mass transfer through an oxide layer rather than as a rate
phenomenon.
Rioux's fmdings aIso corroborated that nickel oxidation impedes sulfur elimination
from semi-blister melts even under increased melt agitation. Although effervescence was
observed in the stagnant melts ofCS a1loy exposed to air in tbis study, Rioux demonstrated
that its onset could he accelerated with more rapid oxygen delivery to the melt but aIso he
suppressed by nickel oxidation on the melt surface. ft is this author's opinion that as a result
ofnickel oxidation a correlation between the cessation ofMarangoni convection and reduced
sulfur elimination in INCa semi-blister copper cannot he satisfactorily established. Under
both quiescent and agitated conditions in the mel~ rapid surface coverage by nickel oxidation
preciudes the observation of Marangoni convection on the melt surface. The high degree of
turbulent mixing required to disrupt this layer. which is already achieved in the INCa
finishing converter by bottom blown gas injection~ would create metallodynamic conditions
where Marangoni convection could not he observed or its contribution to desulfurization he
quantified.

• Chap..;.,:te:..:;.r_6..:;;..;.__C;;;...o;",,;n..;..c::..:l..:.;;u~s.:.:;o:..:.n.:.:s~ 91
Test 1 to Test 6: Oxidation by a Low Momentum Oxygen Stream
1) Marangoni convection was not observed in any of the melts impinged with oxygen
al 66 cm3/min and 75 cm3/min. Instead the CS and CNS alloy underwent oxidation
fonning either a partially fluid film~ as in Test 2~ or a solid layer~ as in Tests 3~ 4 and
6. on the free surface.
2) Stagnant metallodynamic conditions in the melts helped sustain large concentration
gradients between the gas-liquid interface and the bulk fluid by providing a low rate
ofsurface renewal which made conditions favourable for the formation of oxide on
the surface.
3) The surface slags fonned in Tests 3~ 4 and 6 impeded the transfer of reactants or
reaction products to and from the gas-liquid interface. This effect was most
pronounced in the CNS alloy melt whereby no discernable sulfur elimination was
recorded.
Test 7 to Test 9: Oxidation oIes and CNS Liquid Alloy in Air
4) Sulfur elimination and oxygen dissolution in CS and CNS alloy melted under air
proceeded more rapidly and to a greater degree than similar charges impinged with
oxygen at low flowrates.
•
5) lncreased sulfur elimination over earlier tests was attributed partly to the sudden
evolution of S02 from the alloys~ in the form of effervescence~ in the course of
melting them under air. Additional periods ofeffervescence experienced by the CS
alloy charges disrupted the oxidized surface layer resulting in more rapid sulfur
elimination as compared to a similarly tested CNS alloy melt which did not undergo
any effervescence or eruptions thereby leaving the slag layer intact.
The onset of effervescence in liquid CS alloy is believed to occur when the melt
achieves a certain degree ofoxygen super-saturation. The effervescence stops when
the level of super-saturation or the "driving force' for S02 evolution is insufficient
to nucleate bubbles but will reappear periodically if the melt continues to absorb
oxygen until sufficient super-saturation is again reached. Once sufficient S has been
removed such that the necessary super-saturation can no longer he attained the
effervescence ceases since the dissolved oxygen concenttation cannot exceed its level
of saturation with respect to the Cu-O system,.
Chap_te_'_6_e__C_o_n_c_/_"_S,_·o_ft_S 9_2
6)•
7) Il is believed that the inability of the systems to achieve this level of super-saturation
once sulfur is low enough and dissolved oxygen is high enough, that the oxygen
content ofthe melt cannot he increased further and the mechanism ofdesulfurization
changes to one in which there is no longer any S02 bubble nucleation as seen during
effervescence. Consequently, desulfurization becomes slower in accord with the
INCa observations during the second stage of the finishing procedure.
8) The Marangoni aspect of the hypothesis in Chapter 2 was not confirmed but a
discovery was made about the nature of the desulfurization process in Cu-S baths~
i.e., periodic effervescence.
•

• Chapter 7. Recommendations[or Future Work 93
•
Experiments have a1ready been conducted by Rioux104 as an extension to this
investigation which examined the effect ofgas jet momentum or the rate of oxygen delivery
to the melt on the desulfurization ofCS and CNS a1loy melted under air.
It would be of interest to this author to further quantify the onset ofeffervescence in
copper-sulfur melts by more accurate measurement of the sulfur and oxygen levels prior to
bubbling since this phenomeno~ to the knowledge ofthis author~ has not been previously
reported in copper melts. Rioux's assays did not involve oxygen detenninations due to time
and resource constraints while the scaner in the experimental data of this investigation did
not provide an accurate indication to the onset of bubbling. Funhennore. it would he
necessary to investigate whether the type ofcrucible used during experimentation May have
contributed to effervescence.
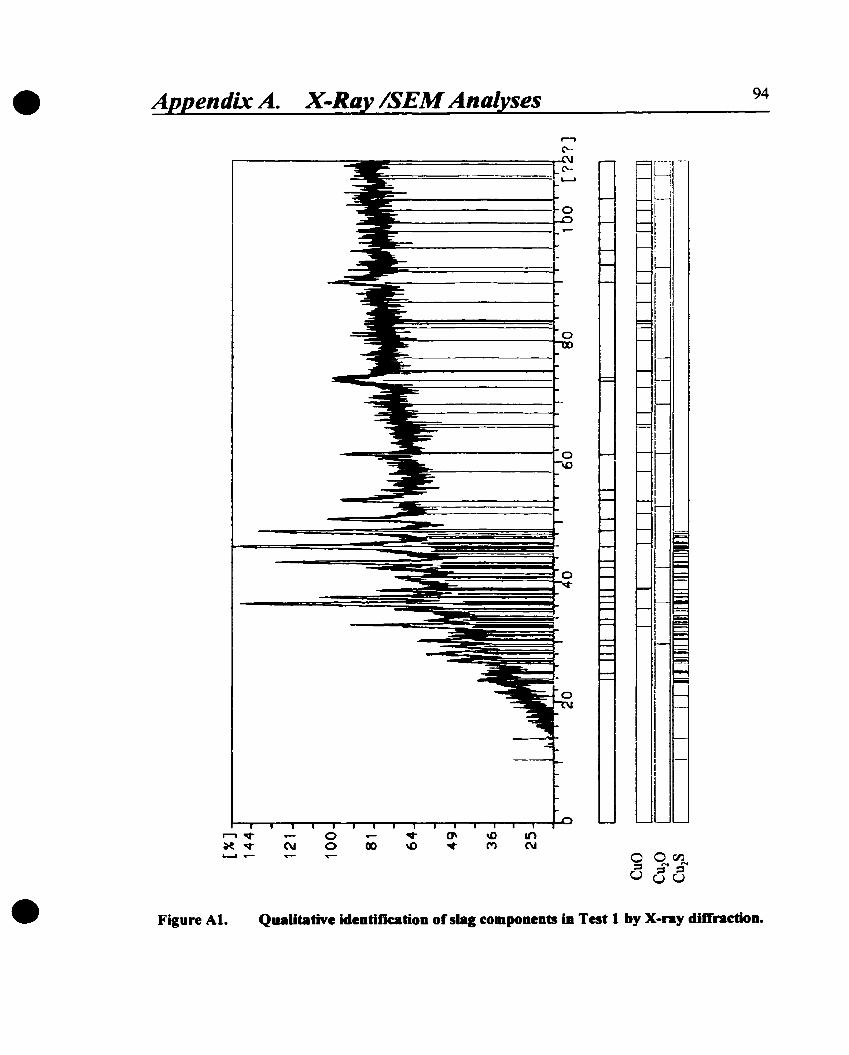
• -1J!pendix A. X-Ray /SEM Analyses
C'-.
~========l~
;......-...~-------I-o
o
94
"""'v 0 v (J\ ~ III~v N 0 ex> \0 v M NL....I_
• Figure Al. Qualitative ideDtificatioD ofsial compoDeDU iD Test 1 by X-ray difl'nctioD.

• ~endixA. X-Ray /SEM Analyses 95
- ----- - --- - --- - -i .,1i
_._.-r- -,~- ~:::::---'.. ~~._--~--~::.~
-~ ...........................;r. .i;,'" .•... . -
1~'
'11
..• 1
;>1
."1
r'!, ,
I.n
r
Itj'- '-
~'=-.
. 1
1-'
.:,
Il;1·1- J 1 1
,_-1 ~-....o:" -- --- --~-
l ,~
o l'.!C ;'.1
-i
--:::'-:.. 1.-'-_ 1
~. :. o. '~ ~. J~__~ -~_ -_.._••_-'<.:"" -.0'-'.~ T.-j
• 1 l.
• Figure Al. Qualitative ideDtificatioD 01 ejected Dlaterial OD the quartz reactioD vessel iDTest 1 by KaUDiDI electroD microseopy.

• References 96
1. C.A. Landolt, A. Fri~ S.W. Marcuso~ R.B. Crowx, J. Miszc~ CQ~per Makio~
at INCO's COppeT Cliff Smelter, Proceedings of the Copper 91-Cobre 91International Symposium. Vol. IV: PyrometallurgyofCopper, August 18-21. 1991.Ottawa. Canada. International Symposium Organized by the Metallurgical Societyof Canadian Institute ofMining. Metallurgy and Petroleum. Chilean Institute ofMining Engineers, and Minerais. Metals and Materials Society ofthe AIME, ed. C.Diaz et al., Pergamoo Press, Toronto, New York, 1991, pp 15-29.
2. C.A. Landolt, A Dunon, A. Fritz and S. Segswo~Nickel and COppeT Smeltjm~ atINCO"s CQppeT CliffSmelter, Extractive Melallurgy ofCopper, Nickel and Cobalt:Proceedings ofthe Paul E. Queneau International Symposium, Vol. II: Copper and.!Vickel Smelter Operations / sponsored by the Extraction and Processing Division ofTAIS and the Meta/lurgical Society ofthe Canadian Institute ofMining, Aletal/urgyand Petroleum (CIAf), ed. C.A. Landolt.. TMS, MineraIs, Metals, Materials.Warrendale, PA.. 1993, pp 1497-1528.
3. Ontario Govemment, CouotdoWD Acid RaiD, Ontario Ministty of the EnviTonment..Toronto, 1987.
4. M.C. Bell, J.A. Blanco. H. Davies and P. Garritsen. TaldDi: INca ioto the 90s - The502 Abatement Projecl, CIM Bulletin, Vol. 83. No. 933, 1990, pp 47-50.
5. J.A. Blanco and C.A. Landolt, 502 Abatemeot and EneriV Conservation al loco'sCOppeT Cliff Smelter, Presented al the 73rd SeC/40th SCGCH Conference, Halifax..Nova Scotia. July 15-20, 1990.
6. C.A. Landolt, A. Dunon, J.O. Edwards, and R.N. McDonald.. SQ2 Abatement EoeTiVCOoseMtjQoand Productivityat CQPperCJift JOM, Vol. 44, No. 9, 1992, pp 50-54.
7. J.R. Boldt Jr.. The Winning ofNickel, Loogmans Canada Ltd., Toronto, 1967~ pp275-283.
8. R.J. Neal and R.A. Reybum, Cooverter aperatiOi: Praclice al the CQ~per ClitTSmelter of INCa Metals CompanY, Copper and Niclœl Converters: Proceedings ofa Symposium on Converter Operating Practices Sponsored by the TMS-AIMEPyrometa/Jurgy Committee at the 108th AIME Annual Aleeting in New Orleans.Louisiana. February 19-21,1979, ed. R.E. Johnson, Metallurgical Society ofAIME,New York, 1979, pp 135-143.
9. A.A. Buslos, G.G. Richards, N.B. Gray and J.K. Brimacombe, Injection PheoQmenain NODfeqous Processes, Metall. Trans. B, Vol. 158, 1984, pp 77-89.• 10. P.E. Queneau and S.W. Marcuson, aXYien PyrometaJhqy al COppeT Cliff - A Half

• References
Centwy of p[Q~ss,JOM, Vol. 48, No. 1, 1996, pp 14-21.
97
Il. S.W. Marcuson. C. Di~ and H. Davies, Iop-Blowjni' BOUQm Stjnini Process forProdyci0i Blister Co~per,JOM, Vol. 46, No. 8, 1994, pp 61-63.
12. G.S. Victorovich, OXYien Flash Convenini for Productioo of Co~per, ExtractiveMeta/lurgy of Copper. IVic1ce1 and Cobalt: Proceedings of the Paul E. QueneauInternational Symposium. Vol. 1: Fundamental Aspects, sponsored by the Extractionand Processing Division of TMS and the Meta/lurgical Society of the CanadianInstitute of ,Mining. Metallurgy and Petroleum (CIM), eds. R.G. Reddy and R.N.WeizenbaclL TMS, MineraIs, Metals, Materials, Warreodale, PA, 1993, pp 501-529.
13. M.C. Bell. J.A. Bianco, H. Davies and R. Sridhar, OXYien Flash Smeltini in aConvener, JO.\!, Vol. 30, 1978, pp 9-14.
14. H. Davies. S. Marcuson, G. Osborne, and A. Wamer, Flash Coovenini o(CbalcociteCODcentrate al INCO's port Colbourne Pilot Plant, Extractive Metal/urgy ofCopper.Nickel and Cobalt: Proceedings ofthe Paul E. Queneau International Symposium.Vol. 1: Fundamental Aspects~ponsoredby the Extraction and Processing Divisionof TMS and the Metallurgical Society of the Canadian Institute of Mining.Afetallurgy and Petroleum (CIM), eds. R.G. Reddyand R.N. Weizenbach, TMS.MineraIs, Metals, Materials, Warrendale, PA, 1993, pp 623-637.
15. J.K. Brimacombe, S.E. Meredith and R.G.H. Lee, Hiw Pressure Injection of Air jntoa Pierce-Smith Converter, Metall. Trans. B, Vol. 15B, 1984. pp 243-250.
16. E.O. Hoefele and J.K. Brimacombe, Flow Re~jmes in Sybme[~ed Gas Injection,}vfetal/. Trans. B, Vol. lOB, 1979, pp 631-648.
17. G.N. o ryal1 and J.K. Brimacombe, The Physical Behavior of a Gas lojectedHorizootal)y joto LjQyjd Metal, Metall. Trans. B, Vol. 7B, 1976, pp 391-403.
18. N.J. Themelis. P. Iarassoffand J. Szekely, Gas-Ljgyid Momentym Iransfer in aCo~per CODverter, Trans. Met. Soc. Aime, Vol. 245, 1969, pp 2425-2433.
•
19.
20.
C. Di~ S. Marcuson~ H. Davies and R. Stratton-Crawley, Conversion o(Njckel andSulfur-CQotaiojDa CQgper rD Blister, Proceedings of Copper 87~ Vol. 4.PJtTometallurgy ofCopper, Organized by the Metallurgical Society ofthe CanadianInstitute ofMining and Metallurgy, the Chilean Institute ofMining Engineers. theUniversity ofChile~ eds. C. Diaz et al., Facultad de Ciencias Fisicas y Matematicas,Universidad de Chile, Santiago, Chile, 1987-1988, pp 293-304.
Private communication witb S.W. Marcuson, Sept. 1993.

• References 98
•
21.
22.
..,~
--'.
24.
25.
26.
27.
28.
29.
30.
31.
~..,-'_.
...,...,-'-' .
34.
A.K. Biswas and W.G. Davenport~ Extractive Metallurgy of Copper~ 3rd ed.~
Pergamon. Tarrytown~ N.Y.~ 1994. pp 194-199.
H.H. Kellogg, TbennochemjcaJ Propenjes of tbe System Cu-S al ElevatedTemperature, Cano Metal. Q., Vol. 8, No. 1, 1969, pp 3-23.
A. Yazawa and T. Azakami~ Therroodynamics of Removjni Imputities puriDiCopper Smeltioi, Cano Metal. Q., Vol. 8, No. 3, 1969, pp 257-261.
G.K. Sigwortb and J.f. Elliot, The Tbennodynamjcs ofDilute Liguid COppeT AUovs,Cano lv/eta/. Q.• Vol. 13, No. 3, 1974, pp 455-461.
A. Yazaw~ Tbennodynamic Considerations of Coppet SmeltiOi, Cano Afetal. Q..Vol. 13. No. 3~ 1974, pp 443-453.
J.f. Elliot, Phase RelatiQnsbips in the Pyrometalluri)' ofCQPpet, .fWerall. Trans. B,1976. Vol. 7B~ pp 17-33.
H. Jalkanen and M.H. Tikkanen. EQuilibrium Studies on Hiih-Copper Manes. ScandJ A1erallurgy. Vol. 8~ No. 2. 1979, pp 64-66.
R.C. Sbanna and Y.A. Cbang~ A Tberrnodynamic Analysis of the CQpper-SulfurSystem, }Jeral/. Trans. B. 1980. Vol. Il B~ pp 575-583.
R. Schmid: A Thennodynamic Analysis of the Cu-O System witb an ASSQciatedSolytion Model~ Afetall. Trans. B. 1983, Vol. 148, pp 473-481.
J.M. Larrain~ S.L. Lee. H.H. Kellogg~ ThennQdynamic Prgperties ofCQpper-SulfurMd1s, Cano A1etal. Q., Vol. 18~ NQ. 4, pp 395-400.
C.B. Alcock. Principles ofPyrometa/lurgy, Academic Press, New York, 1976~ pp170-179.
J.M. Larrain and S.L. Lee, TberroQdynamic Properties Qf Copper-Nickel-SulfurMd1s~ Cano Meral. Q.~ Vol. 19. NQ. 2,1980, pp 183-190.
S.L. Lee. J.M. Larrain~ and H.H. Kellogg, TberrnQdynamic Properties Qf MoltenSulfides. Pan III. The System Cu-Ni-S, Metall. Trans. B, VQI. Il B, 1980, pp 251255.
W.J. Schlin, R.H. Craig, and K.J. Richards, The Miscibility Gap and Distribution ofNickel in the Molten Cu-Ni-S, Metall. Trans., Vol. 4,1973, pp 1994-1996.
• References 99
35. Y. Chuang and Y.A. Chang~ Extension ofthe ASSQÇiated Solution Model to TemaryMetal-Sulfur Mells. Cu-Ni-S, Metall. Trans. B, Vol. 138, 1982, pp 379-385.
36. P. Taskinen, Liguidus Eguilibria and Solution Thennodynamics in Copper-RichCogger-Nickel-OxyaeD AlJoys~ Acta Polytechnica Scandinavica. ChemistryIncluding Metallurgy Series, No. 145, Helsinki, 45 pp.
37. A.D. Kulkami and R.E. Johnso~ Tbennodynamic Studies of LiQujd Coppet AIIQYsby Electrornotive Force Methode Part U. The Cu-Nj-O and Cu-Ni Systems, Metall.Trans., Vol. 4, 1973, pp 1723-1727.
38. U. Kuxmann and J. Riecke, Die Glejchaewjchte Zwjschen Nickel und SauerstotIinKugferscbmelzen in Geaenwart von festem Nickeloxjd bzw. njckeloxidhalt;aenSchlacken, Erzmetall, 25, 1972, pp 395-404.
39. G. Astarita l.\1ass Transjër with Chemical Reaction, Elsevier Publishing, New York,1967, pp 1.
40. F. Ajerch and J.M. Ioguri, OXjdatjOD Rates of Ljguid Coppet and Liguid COL1gerSylfide, }Vletall. Trans.• Vol. 3,1972, pp 2187-2193.
41. P. Schmitt and W. Wuth, Mass Traosrer in Pyrometallur~cal Top Slowjoa Systems,Heat and Mass Trans/er in Metallurgical Systems. eds. D.B. Spaldiog and N.H.Afgan, MacGraw-Hill, 1981, pp 271-280.
42. A. Chatterjee and A.V. Bradshaw, Break-Op ora LiQujd Surface byan Imp;oaioaGas Jet~ J Iron and Steel /nst., Vol. 210, Part 3, Mar. 1972, pp 179-187.
43. N.A. Molloy, Impjoaina Jet Flow in a Iwo-Phase System. The Basic Flow Pattern,J Iron and Steel Inst., Oct. 1970., Vol. 208, Part 10, pp 943-950.
44. K. Li, A Model Stydy ofSplasbjn~~J. Iron and Steel /nst., Nov. 1960, Vol. 196, pp275-291.
45. R.B. Banks and D.V. Chandrasekhara. Exgerimental1nvesliiWioQ of the Penetrationora Hjab-Velocjty Gas Jet Throu&b a LiQyjd Surface, J. Fluid Mech.~ Vol. 15, No.3. 1963, pp 13-34.
46. F.R. Cheslak, J.A. Nicholls and M. Sichel., Cavitjes Eonned on Liguid Surfaces byImpjn~jnK Gaseoys Jets, J Fluid Mech., Vol. 36, No. 1~ pp 55-63.
• 47. E.T. Turkdogan, Fluid Dynamjcs oeGas Jets Impjomoi on Surface ofLiQuids~Chem.Eng. Sei., Vol. 21, 1966~ pp 1133-1144.

• References 100
•
48.
49.
50.
51.
53.
54.
55.
56.
57.
58.
F. Tanak~ R. Imai, T. Yanagiya and A. Fuw~ Eneca,y Balance Aoalysjs QnFQODation ofCavitv and SplasbinK hY Top-BloWÎnK Gas Jet, Metallurgical ReviewofAIMIJ, Vol. 12, No. 2, 1995, pp 46-59.
E. Kimura, Fundamental Researcb ofLancina Mecbanism in Mitsubisbi ContinuousSmeltjna Furnace, ISIJ International, Vol. 23, 1983, pp 522-529.
R. Li and R.L. Harris, Interaction of Gas Jets wim Madel Process LiQuids,Pyrometallurgy '95.Papers Presented at the "Pyrometallurgy '95" Confèrence /Organized by the Institution of Mining and A/etallurgy in Association with theInstitute ofi'Jaterials, and Held in Cambridge. England,from /0 to /2 July, 1995.The Institution QfMining and Metallurgy, LondQn, 1995, pp 107-123.
A.H. Castillejos and J.K. Brimacombe, Measurement ofPhysical Cbaracteristics ofBubbles in Gas-Liguid Plumes. Part Il. Local Properties of Turbulent Air-WaterPlumes in Verticall)' Injected Jets, ~\1etall. Trans. B, Vol. 18B, 1987, pp 659-671.
J. Liow and N.B. Gray, S'oppina Resultina from Gas Injection in a Peirce-SmithConverte[. Water Modellina, Aletall. Trans. B, Vol. 218, 1990, pp 987-996.
I.F. Taylor. J.K. Wright and N.B. Gray, Ljguid Mixina ResultiOf: From Reactive GasInjection, The Howard Worner International Symposium on Injection inPyrometallurgy. eds. M. Nilmani and T. Lebner, Melbourne, AustraliéL The Minerais.Metals and Materials Society, 1996, pp 163-174.
N.P. Bacon, J.H. Chesters and LM.D. Halliday, Flow Patterns in Tbree DimensionalShapes, J. Iron and Steellnst.. July 1960, pp 286-292.
K. D. Peaslee and D. G. C. Robertson, Mode1 Studies of Splasb. Waves. andRecirculatina Flows Witbin Steelmaldna Fumaces, Steelmaking ConfèrenceProceedings, Vol. 77 1994. Iron & Steel Soc ofAIME, Warrendale, PA, pp 713-722.
D.G.C. Robertson, The CompYtation orthe Kinetics of Reactions Between MyltiplePhases, EPD Congress /995 : Proceedings of a Symposium /Sponsored by theExtraction and Processing Division, held at the TMS Annual Meeting in Las Vegas,Nevada. February /2-16. J995, ed. G.W. Warren, TMS, Warrendale, Pa., 1995, pp347-361.
A. Chatterjee and A.V. Bradshaw, The Influence or Gas Phase Resistance on MassTransfeC to a LiQuid Metal, Metall. Trans., Vol. 4, 1973, pp 1359-1364.
R.J. Frueban, Mass Transfec Between LiQuid Meta1s and (niected Gases, MetalsTechnology, Vol. 7, Part 3, March 1980, pp 95-101.

• References 101
59. J.K. Brimacombe, E.S. Stratigakos and P. Tarassoff~ Mass Iranfer Between aHorizontal. Submeraed Gas Jet and a LiQuid, Metal/, Trans., Vol. 5, 1974. pp 763771.
60. W.G. Davenpol4 D.H. Wakelin and A.V. Bradshaw, Interaction ofBotb Bubbles andGas Jets with Liguids, Heat and Mass Transfer in Process Metallurgy: Proceedingsof a Symposium Held by the John Percy Research Group in Process Metal/urgy,Imperial College, London. 19 and 20 April 1966, ed. A.w.n. Hills, The Institutionof Mining and Metallurgy. London, 1967, pp 207-245.
61. W.F. Porter, F.D. Richardson and K.N. Subramani~Sorne Studjes ofMass TransferAcross Interfaces Aiilated by Bubble, Heat and Mass Transfer in ProcessAfetallurgy: Proceedings of a Symposium Held by the John Percy Research Groupin Process Meta//urgy, Imperial Co/lege, London, 19 and 20 April 1966. ed. A.W.D.Hills~ The Institution of Mining and Metallurgy, London, 1967, pp 79-115.
62. N.J. Themelis and P.J. Mackey, Solid-LjQyjd and Gas-Ligyid Interactions in a BathSmeltini Reactor, Proceedings ofthe SavardiLee International Symposium on BathSmelting: Proceedings ofan International Symposium / Sponsored Jointly by theA1inerals, Metals & lvlaterials Society, the Iron & Steel Society and the Metal/urgicalSociety oIC/M, eds. J.K. Brimacombe and P.J. Mackey, G.J.W. Kor, C. Bickert andM.G. Ranade, The MineraIs, MetaIs and Materials Society, Warrendale, Pa., 1992.pp 353-375.
63. K. Mori and M. Sano, Interactions Between Injected Bubbles and LiQuid MetaIs,Scaninjecr: International Conference on Injection Metallurgy Lulea, Sweden, June9-/0, 1977/ Organized Jointly by.\1EFOS, Jernkontoret, MEFOS, Lulea, Sweden1977, pp 348-354.
64. H. Lohe, Zum Warme- und Stoffaustausch hein senkrechten Aue-blasen vonGasstrahlen aufFIÜssi~keitsobert1iicheD,Chem. Ing. Tech., Vol. 38, pp. 309-314.
65. J. Szekely and N.J. Themelis, Rate Phenomena in Proce.~s Mela//urgy, WileyInterscience, New York, 1971, pp 724-728.
66. A.H. Alyaser, Oxidalion Kinetics ofMollen Copper Sulphide, Master's Thesis, TheUniversity of British Columbi~ 1993,220 pp.
•67.
68.
S. Taniguchi, A. Kikuchi and S. Maeda, Model Experiments on Mass Transeer in GasPhase Bele"n an Impinaini Jet orOas and Liguid Iron, Testu-Io-Hagane, 1976, Vol.62, No. 2, pp 191-200.
S. Taniguchi, A. Kikuchi and S. Maeda, Kioetics QfOxjdatioo of Graphjte by the

• References
Impinwna Jet ofGas, Testu-to-Hagane, 1977, Vol. 63, No. 7, pp 1071-1080.
102
69. S. Taniguchi, A. Kikuchi, T. Tadaki and S. Maeda, Numerical Analysis on the GasPhase Mass Transeer Between an Impjnaina Jet of Gas and LjQyjd Iron, Testu-toHagane, 1979, Vol. 65. No. 13, pp 1830-1873.
70. S. Taniguchi, A. Kikuchi. T. Tadaki and S. Maeda, Fluid Flow and Mass Transfer inthe Gas-Ljgujd Iron System wim a LaboratoQ'-Scale Induction Fumace,Metallurgical Applications ofMagnetohydrodynamics : Proceedings ofa Symposiumof the International Union of Theoretical and Applied Mechanics held at TrinityCo/lege, Cambridge. UK, 6-10 September 1982, eds. H.K. Moffat and M.R.E.Proctor, The Metals Society, London, 1984.
71. F.W. Ricbardson4 Physical Chemistry ofMelts in Metallurgy, Academie Press, NewYork, 1974, pp 426-439.
72. J .K. Brimacombe, Interfacial Turbulence in Liguid-Metal Systems, PhysicalChemistry ofProcess Metallurgy, Papers Presented at the July 1973 Conference /The Richardson Conférence, eds. J. H. E. Jeffes and R. J. Tait, The Institution ofMining and Metallurgy. London, 1974, pp 175-185.
73. K. Monma and H. Suto, EtIects of Dissolved Sulphur. Oxvaen. Selenium andTellurium on the Surface Tension of LjQyid Copper, Trans. JIM, Vol. 2, 1961 pp148-153.
74. G.R. BeIton, The Interplay Between Sttona Adsorption of Solutes and InterfacialKinetics at the LiQujd Metal Surface, Cano Metal. Q., Vol. 21. No. 2, 1982, pp 137143.
75. G.R. BeIton, Lan~ujrAdSQcptjoo. the Gibbs Adsorption Isothenn. and InterfacialKinetjcs in Ljguid Metal Systems, Metall. Trans. B, Vol. 7B, 1976, 35-42.
76. S. Sun and G.R. Belton, The Effect ofSylfur 00 the Interracial Rates of Reactioo ofQl2 and CQ wjm Ljguid Copper, Meta/l. and Mat. Trans. B, Vol. 29, 1998, pp 296298.
77. B. Gallois and C.H. Lupis, Effect of OXYien on the Surface Tension of LjguidCopper, Metall. Trans. B, Vol. 128, 1991, pp 549-557.
•78.
79.
G. Bernard and C.H.P. Lupis, The SyÛace Tension of Ljgujd Sjlver Al1oys. Part U.Aa-O AllQ)'s, Metall. Trans., Vol. 2,1971, pp 2991-2998.
F.D. Richardson, Interfacial PheDomena and Metallyraical processes, Cano Metal. Q.,

• References
Vol. 21 .. No. 2, 1982, pp 111-119.
103
80. L.S. Darken and E.T. Turkdogan, AdSQJ1Uioo Kjnetics at Elevated Temperature,Heterogeneolts Kinetics al EJevated Temperatures: Proceedings ofan InternationalConference in Metal/urgy and Materia/s Science He/d at the University ofPennsylvania, eds. G.R. BeIton and W.L. Worrell.. Plenum Press, New York. 1970.pp 25-95.
81. R.J. Fruehan and L.J. Marto~ The Rate of Absorption ofNitro~o inlo Liguid ironCootainjna Oxyu:en and Sulfur, Metall. Trans. B.. Vol. lIB.. 1980. pp 615-622.
82. R.J. Fruehan and L.J. Martonik.. Tbe Rate of Absoeptjoo of Hydroaen into Iron andofNittoaen ioot Fe-Cr and Fe-Cr-Ni AllQYs Contai";",: Sulfur, Metall. Trans. B, Vol.12B, 1981.. pp 379-384.
83. L.E. Senven and C.V. Stemling, The Maranaoni Effects, Nature .. Vol. 187, 1960.. pp186-188.
84. K. Mukai, Wenjoa and MaraniQoi Effeet in Iron and Steelmakioa processes, /S/JInternational. Vol. 32, No. 1.. 1992, pp 19-25.
85. Emun.. Van Nostrand's Scientific Encyclopedia. 8th ed., ed. D.M. Considine, VanNostrand Reinhold.. Toronto. 1995, pp 1300-1301.
86. P. Sahoo, T. Debroyand M.J. McNallan.. Surface Tension of Binary Metal- SurfaceActive Solute Systems under Conditions Relevant ta Weldjnu: Metalluci,Y, Metal/.Trans. B.. Vol. 198.. 1988 pp 483-491.
87. A.H. Alyaser and J.K. Brimacombe, Oxidatjon Kinetics of Molten Co~per Sulfide,Metal/. and J'vIat. Trans. B.. Vol. 26.. 1995, pp 25-40.
88. N. Hirashima, R.T.C. Choa, J.M. Toguri and K. Mukai, Tbe Effect of SurfaceMovements on Nitrou:eo Mass Traosfer in Liguid Iron, Metall. Trans. B. Vol. 26B,1995, pp 971-980.
89. J.K. Brimacombe and F. Weinberg, Observatjons ofSuâace Movements of LigujdçQ~per and Tin, Metall. Trans... Vol. 3, 1972, pp 2298-2299.
90. K.W. Lange and M. Wilken~ MaranKoDi Type Interracial PheDQmena iD HiKh andLaw Tempemure Systems, Cano Metal. Q., Vol. 22, No. 3, 1983~ pp 326.
• 91. R.J. Barton and J.K. Brimacombe, Influence ofSuûace Teosjoo-Driveo Flow on theKjnetics ofOxyu:en Abso[J)lion in Molten çQ~per, Metall. Trans. B, Vol. 8B, 1977,

• References
pp 417-427.
104
•
92. z. Asaki, S. Ando, and Y. Kondo, Oxidation ofMolten Comx;t Mane, Metall. Trans.B~ Vol. 198~ 1988, pp 47-52.
93. Y. Fukunak~ K. Nishikaw~ H.S. Sohn, and Z. Asaki, Desulfurization Kinetics ofMolten Coppet by Gas Bubblioi, Metall. Trans. B, Vol. 228, 1991, pp 5-11.
94. Reiichi Ohno, Desulfurization and Deoxidation of Cu-S-O Alloy in InductionMeltiOi and Solidification undet Araon and Ibeir Rates of Elimination in VacuumInduction MeltjD~, l\1etall. Trans. B., Vol. 228, 1991 ~ pp 405-416.
95. C.F. Floe and J. Chipm~ Etfect of Irnpurities on the Solubility ofSulphur DiQxidein Molten Cogper, Trans. AIME, 1942, Vol. 147, pp 28-38.
96. O. Knacke and H. Probst. The Evolution of Gases in Copper Qn SoUdification,Nleta/lurgical Chemistry, ed. o. Kubaschewski, Her Majesty's Stationary Office,LQndon~ 1972, pp 527-31.
97. G. Rotttnann and W. Wuth, Conversion QfCopper Mane by use ofthe IQp=BlowiniTechnjQue, Copper Metallurgy: Practice and Theory: Papers Presented at a MeetingOrganized by the Institution ofMining and Metallurgy, With The Cooperation oftheCentre Belge d'Information du Cuivre, and Held in Brussels. Belgium, on IlFebruary J975~ ed. M.I. Jones. Institution of Mining and Metallurgy, London, 1975~
pp 49-52.
98. V.A. Bryukvin, 0.1. Isybin, L.I. Blokhina. and G.N. Zviadadze, An [nvesti~ation ofthe Oxjdation Kinetics of a Copper Sulfide Melt wjtb Oxy~en., Russ. Metall. (Engl.Trans.), No. 5, 1978, pp 24-28.
99. H. Jalkanen, PheoomenoloKY orthe Oxidatjoo Kinetics of MolIen C"PCOUS Sulphideand Copper, Scand J. Metallurgy, Vol. 10. 1981, pp 257-262.
100. J.J. Byerley, G.L. Rempel, and N. Takebe, Interactioo of Copper Sulfides withCopper Oxides in the Molten State, j'Jetall. Trans .~ Vol. 5, 1974, pp 2501-2506.
101. P.T. MorIand, S.P. Matthew, and P.C. Hayes, The Kinetics ofS3s Exchan~e QelweenSQ/CO/C02 Gas Mixtures and Coppet Sulfide Mells al 1523 K~ Metall. Trans. B,Vol. 228,1991, pp 211-217.
102. R.J. Barton and J.K. Brimacombe, Interracial Turbulence Purim: the Dissolution ofSoJid Cy:S in Moite" Copper~ Metall. Trans. B, Vol. 7B, 1976~ pp 144-145.

• References 105
•
103. F.P. Incrope~ Introduction to Heat Trans/er, 2nd ed., Wiley, New Yor~ 1990, pp681.
104. D. Rioux, Tbe Etfect ofOxylU:0 Jet Momentum 00 the Rate of Pesulfurizatioo ofInco Semi-Blister Copper, B. Eng. Research Project, McGill University, 1998, 32 pp.
IDS. A. Yazawa and S. Nakazawa, CompariSQns BelWeen CQgper. Lead and NickelSmeJtiOi Processes from Thennodynamjc Vje»poiots, Su/fide Smelting '98: Currentand Future Practices, Proceedings o/the Symposium Held at the 1998 TMS AnnualMeeting, San Antonio, Texas, February 16-19. 1998 with additional pyrometal/urgypapers presented at the 1997 TMS Annual Meeting, Orlando, Florida. Fehruary lO13, 1997,005. J.A. Asteljoki and R.L. Stephens, TMS, Warrendale, Pa, 1998, pp 3948.