information to users - mcgill universitydigitool.library.mcgill.ca/thesisfile31075.pdf · 1.1...
TRANSCRIPT

INFORMATION TO USERS
This manuscript has been reproduced tram the microfilm master. UMI films
the text directly tram the original or copy submitted. Thus, sorne thesis and
dissertation copies are in typewriter face, while others may be from any type of
computer printer.
The quallty of this reproduction is dependent upon the quallty of the
copy submitted. Broken or indistinct print, colored or poor quality illustrations
and photographs, print bleedthrough, substandard margins. and improper
alignment can adverselyaffect reproduction.
ln the unlikely event that the author did not send UMI a complete manuscript
and there are missing pages, these will be noted. Also, if unauthorized
copyright material had to be removed, a note will indicate the deletion.
Oversize materials (e.g., maps, drawings, charts) are reproduced by
sectioning the original, beginning at the upper left-hand corner and continuing
from left to right in equal sections with small overlaps.
ProQuest Information and Leaming300 North Zeeb Road, Ann Arbor, MI 48106-1346 USA
800-521-0600


NOTE TO USERS
This reproduction is the best copy available.
UMI~

•
•
•
REVISITING HEMODYNAMIC ANALYSIS OF
PULMONARY EDEMA AFTER THE ONSET OF LEFT
VENTRICULAR DYSFUNCTION USING A
MATHEMATICAL MODEL OF THE CARDIOVASCULAR
SYSTEM.
SHALINI VEERASSAMYDepartment of Biomedical Engineering
Faculty of MedicineMcGili Universit.yMontreal, Quebec
November 2000
~McGill
"A thesis submitted to the Faculty of Graduate Studies and Research in partialfultillment of the requirements of the degree of Masters of Engineering (M.Eng)"
©Shalini Veerassamy; November 2000

1'*'1 National Libraryof Canada
Acquisitions andBibliographie services
395 Welington StreetOttawa ON K1A 0N4canada
Bibliothèque nationaledu Canada
Acquisitions etservices bibliographiques
395. rue WellingtonOftawa ON K1A 0N4Canada
The author bas granted a nonexclusive licence allowing theNational Library ofCanada tareproduce, lo~ distnbute or sencopies ofthis thesis in microfonn,paper or electronic formats.
The author retains ownership of thecopyright in this thesis. Neither thethesis nor substantial extracts from itmay he printed or otherwisereproduced without the author'spemusslon.
L'auteur a accordé une licence nonexclusive permettant à laBibliothèque nationale du Canada dereproduire, prêter, distribuer ouvendre des copies de cette thèse sousla forme de microfiche/film, dereproduction sur papier ou sur formatélectronique.
L'auteur conseJVe la propriété dudroit d'auteur qui protège cette thèse.Ni la thèse ni des extraits substantielsde celle-ci ne doivent être imprimésou autrement reproduits sans sonautorisation.
0-612-70257-x
Canadi
•
•
•
CONTENTS
Table of Contents i
List offigures : iv
List of tables v
Acknowledgements vi
Abstract " vii
Extrait '" , viii
INTRODUCTION 1
ORGANIZATION OF THESIS 2
CHAPTER 1: BACKGROUND 4
1.1 Introduction 5
1.2 Types of models 5
1.3 Application of cardiovascular models 9
l.4 Heart failurc : 9
1.4.1 Hemodynamic changes 10
CHAPTER 2: OVERVIEW OF CIRCULATORY MECHANICS 11
2.l Introduction 12
2.2 Pattern of circulation 15
2.2.1 Systemic circulation 15
2.2.2 Pulmonm-y circulation , 16
2.3 Volume- pressure relationships 18
2.4 Pressure-Flow relationships 19
2.5 Systenlic and Pulmonary Vascular Compliance 19
2.6 Systemic and Pulmonary Vascular Resistance 20
2.7 Modeling in Physiology 21
2.7.1 Modeling objectives : 21
•
•
•
2.7.2 Modeling methodology 22
2.7.3 Model classification 23
CHAPTER 3: LITERATURE REVIEW 24
3.1 Introduction 25
3.2 Brief historica! background 26
3.2.1 Models of auto-controlled cardiovascular models 26
3.2.2 Models of controlled cardiovascular models 28
3.3 Overview of Beneken and De Wit model. 30
3.4 Overview of Leaning et al. model. 33
3.5 Overview of Piene et al. mode!. 36
3.6 Overview of Burkhoff and Tyberg model. " 38
CRAPTER 4: MODEL DEVELOPl'fIENT 40
4.1 Mathematical description of Model subsystems .41
4.1.1 Model 41
4.1.2 Madel structure and equations 43
4.1.3 Madel of the heart. .45
4.1.4 Pericardial Effect. .47
4.2 Implementation 48
4.2.1 Simulink 48
CHAPTER 5: MODEL VALIDATION AND APPLICATIONS 52
5.1 Control parameter values 53
5.2 Sensitivity Analysis : 55
5.3 Simulations 60
5.3.1 Impact of changing LV end -systolic elastance (Eeslv) 60
5.3.2 Impact of changing Systemic Resistance (Ras) 61
5.3.3 Impact of changing heart rate (HR) 61
5.3.4 Impact of increasing Stressed volume (Vs) 62
5.3.5 Impact of changing Peripheral Resistance (Rvs) 63
Il
•
•
•
5.4 Effect of Peripheral resistance on Model 63
5.5 Discussion 72
CHAPTER 6: CONCLUSIONS AND SUGGESTIONS FOR FUTURERESEARCH 76
6.1 Limitations of model. 77
6.2 Applications and suggestions for Future research 78
6.3 Summary and Conclusions 78
APPENDIX 1: DICTIONARY LISTINGS (detinitions) 81
APPENDIX 2: LIST OF SYMBOLS, SUBSCRIPTS, UNJTS EMPLOYED 84
REFERENCES 87
iii

•
•
•
List of Figures:
Figure ( 1): Representation of the heart 14
Figure (2): Schematic representation of the circulatory system 17
Figure (3): Volume pressure relationships with changes in compliance 19
Figure (4): Distinct stages in the modeling process (Carson et al. (983) 22
Figure (5): A schematic representation of the Windkessel model 26
Figure (6): Black diagram of the cardiovascular system 33
Figure (7): Sketch of Piene et al. model (1983) 37
Figure (8): Schematic representation of modeled used for analysis 38
Figure (9): Model 42
Figure (l0): Two typical adjoining lumped parameter segments 43
Figure (lI): Representation of E (t) function 45
Figure (12): Representation of pressure-volume relationship .47
Figure (13): Representation of model in Simulink 50
Figure (14): Simulink representation of the left and right hearts 51
Figure (15): Impact ofchanging LV-end-systolic elastance (Eeslv (mmHg/ml» 67
Figure (16): Impact of changing Systemic Arterial Resistance (Ras) with Eeslv at half its
control 68
Figure (17): Impact of changing Heart Rate (HR) with Eeslv at half its control 69
Figure (18): Impact of changing Stressed Volume with Eeslv at half its control. 70
Figure (19): Impact of changing Systemic Venous Resistance (Rvs) with Eeslv at half its
control 71
iv

•
•
•
List of Tables:
Table (1) : a brief list of the historical origins and uses of the four levels of
modeling 23
Table (2): parameter values chosen to be appropriate for 75-kg man 53
Table (3): showing the control values obtained From control simulation 54
Table (4): Representation of simulation values obtained from Burkhoff/ Tyberg's
Madel 64
Table (5): Representation of simulation values obtained From Madel 64
Table (6): Summary of simulations 75
\'

•
•
•
Acknowledgments
1 would like to thank my supervisors namely Dr. Jason Bates, Dr. Henrietta Galiana and
Dr. Sheldon Madger for their support and guidance throughout my stay at the Biomedical
Engineering Department. Mcgill University. 1 would like to thank my parents, Dr. Deva
and Ruby Veerassamy and sisters for their continuous encouragement and support. 1
would Iike to thank ail the students and staff of the department who have contributed in
my being able 10 attain this goal.
This work was supported by operating grants from the Medical Research Council (MRC)
of Canada.
VI

•
•
•
ABSTRACT
The atm of this project was to extend a mathematical model of the cardiovascular
circulation, originally built by Burkhoff and Tyberg [6]. The model was implemented in
Simulink and consists of 6 lumped vascular compartments intercannected by segments
allowing unidirectional bload flow. A set of 6 differential equations describe changes in
blood volume in the four systemic and two ventricular compartments as functions of time
in terms of the pressure across each companment and the resistances between them. The
madel was used ta investigate why pulmonary venous pressure rises after the anset of left
ventricular dysfunctian. Special attention was given ta the pericardial and peripheral
resistance effects. Sensitivity analysis showed that our parameter values and ratios were
more appropriate than those of Burkhoff and Tyberg [6]. We canclude that, althaugh
stressed volume has a fundamental role in raising the pulmonary venous pressure,
contractile strength and systemic arterial resistance also contribute cansiderably.
vii

•
•
•
EXTRAIT
Le but de ce projet était de mettre au point un modèle mathématique de la circulation
cardiovasculaire. conçue à l'origine par Burkhoff et Tyberg. Ce modèle a été implémenté
sur Simulink et consiste en 6 compartiments vasculaires imerconnectés par des branches
qui laissent passer le flot unidirectionel de sang. Un ensemble de 6 équations
différentielles décrivent les modifications du volume sanguin dans les 4 compartiments
systémiques et les 2 compartiments ventriculaires. Le modèle a été utilisé dans le but de
voir pourquoi la pression de la veine pulmonaire croît après le début de la dysfonction du
ventricule gauche. Des observations plus poussées ont identifié des effets de résistance du
péricarde et de la périphérie. Des analyses de sensibilité ont démontré que les valeurs et
ratios de nos paramètres étaient plus appropriés que ceux de Burkhoff et Tyberg. Nous
concluons donc que même si le volume du stress joue un rôle majeur dans la montée de la
pression de la veine pulmonaire, la force contractile et la pression systémique artérielle y
contribuent aussi considérablement.
VIII

•
•
•
INTRODUCTION
The aim of this project was ta extend a mathematical model of the heart and circulation
originally developed by Burkhoff and Tyberg [7] in order to investigate hemodynamic
determinants of cardiac output. The revised model was implemented in MATLAB using
Simulink 3.0. The model consists of 6 compartments; a right and left heart. lumped
pulmonary artery and vein compartments and lumped systemic artery and vein
compartments. The compartments are interconnected by segments allowing
unidirectional blood tlow. A set of six differential equations describes changes in blood
volume in the 4 systemic and 2 ventricular compartments as functions of time in terms of
the pressure across each compartment and the resistances between them. The right and
left ventricular pumping characteristics are represented by time-varying elastances theory
that relate instantaneous ventricular pressure to volume.
The revised model is used to re-assess the importance of decreased ventricular contractile
state. increased heart rate. increased arterial resistance and decreased venous capacity in
the development of pulmonary congestion after the onset of 'lcure Left Ventricular
Dysfunction (LVD). The model parameter values were chosen according to Magder [24].
We considered the effects of changes in pericardial mechanics, systemic venous
resistance. the baroreceptor retlex and sepsis on Pulmonary Venous Pressure CPVP) after
LVD.
A sensitivity analysis of the model was performed by perturbing each of the parameters
in turn by ± 5% and observing the changes incardiac output and the various
compartmental pressures.

•
•
•
ORGANIZATION OF THE THESIS
Chapter 2 gives an overview of circulatory mechanics, starting with the systemic and
pulmonary circulations. The relationships between volume, pressure and flow are
discussed. Systemic and pulmonary resistances and compliances are reviewed. Modeling
objectives, methodology and classification are also considered in this chapter, which
closes with the historicaI origins and uses of the different leveIs of modeling.
Chapter 3 reviews sorne key models developed for use in cardiovascular research. The
chapter starts with a short historical review and then foc uses in more depth on particular
models. The model equations are described in detail along with schematic
representations.
Chapter 4 deals with the basic structure and equations involved in the model developed
in the present study. A set of six differential equations describing how volume changes in
each compartment is given. The right and left hearts are represented by time-varying
elastances. The Burkhoff and Tyberg model is compared to its extension developed
herein. The chapter also gives a brief description of the Simulink software that was used
to implement the model.
Chapter 5 establishes the control parameter values used in the model. The effects of
changing heart rate, LV end systolic elastance, systemic arterial resistance, and stressed
volume and their role in influencing LVD is investigated. The effects of changes in
2

•
•
•
systemic venous resistance on its own, with the inclusion of the baroreceptor reflex and
with sepsis are also investigated. A sensitivity analysis is also performed.
Chapter 6 describes the results achieved with the mode!. Limitations of the Model, and
suggestions for future research are also presented.
3

•
•
•
CHAPTER 1
4
•
•
•
BACKGROUND
1.1 Introduction
The cardiovascular system is the main transport system of the body. A model of an
individual's cardiovascular system must imitate the relationships among physiological
variables, such as heart rate, systolic and diastolic blood pressures, and breathing rale, at
different physical activity levels. There are four basic types of models used in medicine:
non-mammalian models, culture models. rnammali~n models and mathematical,
computer and physical models.
1.2 Types of Models
(1) Non- mammalian models
Non-mammalian models are a species that can serve as excellent models for certain
biological processes and structures, and are indispensable in the study of others. For
example the giant axon of the squid was the key experimental system at the birth of
modern neuroscience. Nevertheless, inter-taxonomie transfer of information should be
approached with great caution because species difference can be great or even, as in
embryonic development, fundamental.
The advantages of non-mammalian models are:
(1) generally they are more readily available and less expensive than mammals,
(2) the processes they are supposed to illustrate are often displayed more simply and
directly than in higher animais,
(3) their tissues and organs are more accessible and may lend themselves more easily
to microscopie observation, dissection, and laboratory handling.
5
•
•
•
Sorne limitations of non-mammalian model include that unless sorne fundamental
similarity to the human system under study is established, the results cannot be reliably
applied to the human system.
(2) Culture models
Culture roodels involve the culture of ceUs, tissues and organs, including those of human
origin, and have attained a high level of sophistication. They have been responsible for
many recent discoveries. The strengths of this technique are that the cells and tissues in
culture can be maintained in a defined, controlled environment, provided they retain the
differentiated functions that existed in the whole-body system. They are also capable of
providing a rapid and less expensive means of evaluating physical and chernical agents
than live animais, and have allowed the discovery of information that wouId not have
been obtainable from research on more complex systems. Limitations include the fact
that cllltured cells may lose their differentiated fllnction, and they may not mimic the in
vivo response because of the absence of complex tissue and organ interactions that
ordinarily give rise to il. Also, a particular behaviour may be due to infection of the
culture by an unknown and undetected pathogen.
(3) Mammalian models
From historical record, it is c1ear that mammalian models have been central to the
development of modern medicine, both for understanding normal physiology and for
developing diagnoses and therapies. This centrality continues, and for many subtle and
long-term effects of drugs or therapies there is no alternative. Sorne of the strengths of
mammalian models are that humans are mammals. Furthermore mammalian models in
6

•
•
•
which disease development and response to therapy are similar to those in humans can
very often be found. Mammalian models provide standardized and federall y mandated
methods for testing the safety and efficacy of new drugs before they are released for
hurnan clinical trials. Finally mammalian models offer the only reliable testing for
complex prostheses or interventions in which the collective response of the whole system
is important
Sorne of the limitations of marnmalian models include species differences in details of
anatomy and physiology so that similarity of test mammalian species to human systems
must be established before results can be generalized. Also, sorne otherwisc desirable
mammalian models may be expensive and difficuh to acquire and maintain.
(4) Mathematical computer and physical models
Mathematical models and computer simulations are finding increased use and application
as the available computing power increases. The advantages of such models are:
( 1) they codify facts and help confirm or reject hypotheses about complex systems,
(2) they reveal contradictions or incompleteness of data and hypotheses.
(3) they can often allow prediction of system performance under untested or un
testable conditions,
(4) they can predict and supply the values of experimentally inaccessible variables,
(5) they suggest the existence of new phenomena.
Sorne of the limitations are:
(1) the selection of model elements may be suboptimal,
7

•
•
•
(2) incorrect models can fit limited data. (eading to erroneous conclusions.
(3) simple models are easy to manage but complex models couId be needed,
(4) realistic simulations often require a large number of parameters. and the values
needed could be very difficult to obtain.
Mathematical models are good when there is sufficient knowledge of the system to allow
the formulation of strong hypotheses. As the sophistication of computing increases, and
as our ability to acquire data expands. more effective and broader applications may be
expected. The limitations of prediction due to system complexity remains. but further
advances are to be anticipated with contïdence. Physical models are similar in their
strengths and weaknesses to computer models. However, at present they are more limited
in their ability to represent the complex interactions that occue within living systems
accurately.
Cardiac mechanics and hemodynan1ics lend themselves readily to mathematical and
computer modeling. Therefore the achievements to date and the prospects of future
research in this area provide an example of the potential of mathematical and computer
modeling. When involved in computer studies of blood flow in the heart. the normal
function of the heart can be elucidated. and diseases that influence the mechanical
function of the heart can be examined.
8
•
•
•
1.3 Application of cardiovascular models
Models are indispensable for biomedical research. There is no branch of medicine or life
science in which the current knowledge base is not determined in sorne way by research
with models. A modeI of the cardiovascular system originally formulated by O. Burkhoff
and J. Tyberg [7] forros the basis of the current project.
Application of cardiovascular modeis lies mainly in the areas of research and clinicaI
medicine. The purpose is typically to investigate the response of the intact circulation to
various perturbations, which is intuitively difficult due ta the nonlinear feedback nature
of the system. The effects of Central Nervous System (CNS) control and cardiovascular
drugs may also be incorporated. There seems to be a tendency for many cardiovascular
modeIs to be 'comprehensive' 50 that a wide range of situations can be modeled. Such
modeIs, for instance Beneken and De Wit 1967; Pullen 1976 etc., will be discussed in the
later chapters. The major difficulty with such models is validating them.
1.4 Heart Failure
When the heart is unable to pump blood in sufficient amounts ta meet the metabolic
requirements of the tissues of the body, a complex series of derangements happen
throughout the cardiovascular system. These in turn cause widespread disturbances of
body functions. These perturbations become apparent ta the c1inician as the signs of heart
failure and lead to the symptoms perceived by the· patient. Circulatory failure can
sometimes occur in the presence of an increased cardiac output, reflecting the inability of
9

•
•
•
the heart to maintain a normal cardiac output. Howevert in most cases the heart failure is
due to changes in the heart muscle itself.
1.4.1 Hemodynamic Changes
When pumping action of the left ventricle is impaired, end-diastolic pressure increases
causing a retrograde increase in left atrial and pulmonary vein pressure. As the left atrium
dilates, the posterior cusp of the mitral valve is retracted causing mitral regurgitation, and
the pulmonary vessels overfill with blood. The ensuing rise in pulmonary capillary
hydrostatic pressure causes interstitial edema followed by exudation of fluid into the
alveoli (pulmonary edema). As the pulmonary pressure increases the work of the right
ventricle is raised leading to overload and eventual right ventricular failure. When the
right ventricle fails, there is an increase in right ventricular and right atrial pressure,
which lead to dilatation of the tricuspid atrioventricular ring and tricuspid incompetence.
As the atrial pressure rises the systemic veins become engorged and peripheral edema
ensues.
Thus, one of the most common and important consequences of acute LVD is pulmonary
edema, which results from a rise in pulmonary venous pressure.
10

•
•
•
CHAPTER2
Il

• OVERVIEW OF CIRCULATORY MECHANICS
2.1 Introduction
The cardiovascular system is the main transport system of the body. The system
transports respiratory gases, nutrients, and wastes to and from cells. The main
components of the cardiovascular system are:
(l) heart
(2) arteries
(3) veins
Heart: The human heart has 4 chambers; two-thin walled atria separated by an interatrial
septum, and two-thick walled ventricles separated by an interventricular septum. The
heart has 4 valves; the mitral, tricuspid (atrioventricular) and the pulmanary, aartic
• (semilunar valves). The mitral and tricuspid valves apen to allow bload to fïll the
ventricles when the blood pressure is low and velocity is small. The mitral and tricuspid
valves are attached ta papillary muscles which contract during systole and, pull down the
valves to generate systolic pressure rapidly and prevent the valves from inverting into the
atrium. The aortic and pulmonary valves are used in ventricular systole to pump blood
out of the ventricles at high velocity. Unlike the mitral and tricuspid valves. the semilunar
valves have no strings attached. The opening and closing of aIl valves are aperated by
blood itself through hydrodynamic forces.
Arteries: Arteries are thickly walled, muscular, elastic tubes whose diameters vary with
•pulsatile pressure. The arterial wall belongs to the class of materials called visco-elastic.
exhibiting properties appropriate to both an elastic solid and a viscous liquid. These
12
• vessels conduct oxygenated blood away from the heart to the lungs with the exception of
the pulmonary arteries which channel the deoxygenated blood from the heart ta the lungs.
Veins: Veins are relatively thinly walled. highly compliant, coIIapsible, large-capacity
vessels with relatively low transmural pressures and non-linear modeling has to be
applied to obtain an adequate representation of them. Valves are located at various
locations in the venous system to ensure unidirectional blood tlow. These vessels direct
deoxygenated blood towards the heart with the exception of the pulmonary veins, which
carry oxygenated blood from the lungs to the heart. Venules, which are small veins,
collect blood from the downstream end of the capillary beds. Large veins channel blood
from the main venous branches to the vena cava. and nows into the right heart.
Heart Cycle: In a normal adult, heart rate is about 75 beats per minute. Diastole is the
period of ventricular relaxation when blood fills the ventricIe and systole is the period of
ventricular contraction. The P-wave signaIs the start of electrical stimulation of the heart
muscle and in about 0.1 seconds. as the excitation spreads over most of the atrial muscle,
atrial contraction begins causing a single increase in both atrial and ventricular pressures.
This rise in pressure happens in both cardiac chambers because the atrio-ventricular
(mitral and tricuspid) valves are open. [n the late stage of diastole the ventricles are
invaded by electrical excitation process as it spreads over the atrial muscle from the SA
(sino-atrial) node via the bundle of His and the Purkinje fibres. Ventricular contraction
starts not long after the onset of the QRS complex. The ventricles begin to contract; the
intra-ventricular pressure begins to rise, causing the AV (atrio-ventricular) valve to close
• (first heart sound). This period of ventricular contraction lasts about 0.05 seconds and is
called the_'isovolumic phase of contraction' (isovolumic because the ventricles are
13
•

•
•
isolated and the volume remains constant). The contraction phase continues and the intra-
ventricular pressure riscs rapidly until it exceeds the pressures in the pulmonary artery
and aorta. Then the semilunar valves open and systole stans. Blood is expelled from the
ventricles. At first, ejection is fast and then declines during the later stage of systole. The
period of ventricular systole lasts about 0.3 seconds aner which the ventricles starl to
relax and their pressures drop rapidly closing the aorlic and pulmonary valves (second
heart sound). The isovolumic relaxation phase continues for about 0.08 seconds after the
semilunar valves close. The relaxation phase ends with the opening of the A V valves.
which occurs when venlricular pressures fall below atrial pressures. When the AV valves
open, a phase of rapid filling starts. Blood accumulates in the atria during systole and
e1evates their pressures. When ventricular pressures drop below atrial pressures, blood
rushes down the pressure gradient between atrium and ventricle. This phase of rapid
filling lasts about 0.1 seconds. The final stage of the cardiac cycle is known as the phase
of slow filling or diastasis. This period lasts about 0.2 seconds and is due ta continued
venous return and is terminated by atrial systole.
•
pu!....·(···~;,
0'"f"I.~
Figure (1) Representation of the heart [6].
14
•
•
•
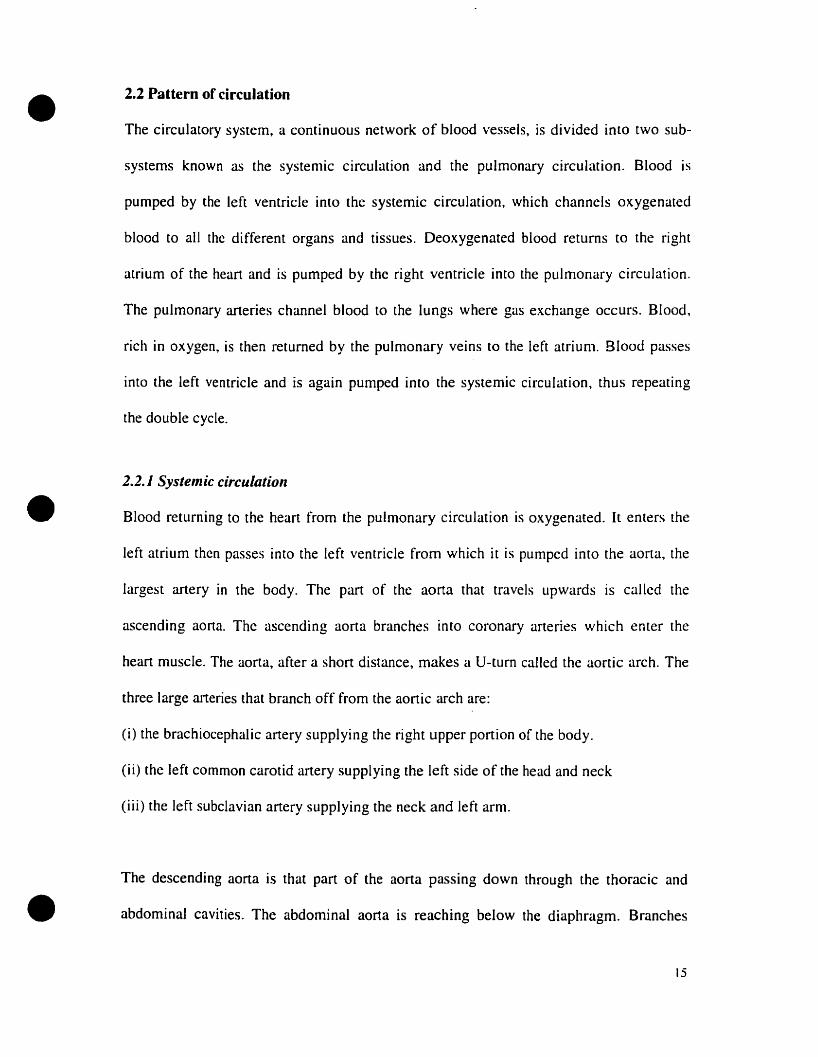
2.2 Pattern of circulation
The circulatory system, a continuous network of blood vessels. is divided into two sub
systems known as the systemic circulation and the pulmonary circulation. Blood is
pumped by the left ventricle into the systemic circulation, which channels oxygenated
blood to aIl the different organs and tissues. Deoxygenated blood returns to the right
atrium of the heart and is pumped by the right ventricle into the pulmonary circulation.
The pulmonary arteries channel blood to the lungs where gas exchange occurs. Blood,
rich in oxygen, is then returned by the pulmonary veins to the left atrium. Blood passes
into the left ventricle and is again pumped into the systemic circulation, thus repeating
the double cycle.
2.2.1 Systemic circulation
Blood returning to the heart from the pulmonary circulation is oxygenated. Ir enters the
left atrium then passes into the left ventricle from which it is pumped into the aorta, the
largest artery in the body. The part of the aorta that travels upwards is called the
ascending aorta. The ascending aorta branches into coronary arteries which enter the
heart muscle. The aorta, after a short distance, makes a U-turn called the aortic arch. The
three large arteries that branch off from the aortic arch are:
Ci) the brachiocephalic artery supplying the right upper portion of the body.
CH) the left common carotid artery supplying the left side of the head and neck
(iii) the left subclavian artery supplying the neck and Ieft arm.
The descending aorta is that part of the aorta passing down through the thoracic and
abdominal cavities. The abdominal aorta is reaching below the diaphragm. Branches
15

•
•
•
from the aorta are channeled to all major organs and tissues. For example. the renal
arteries branch off to the kidneys. The left and right common iliac arteries are divisions
of the aorta in the lower abdominal cavity. They deliver blood to the lower extremities
and pelvic structures.
Blood returns to the heart via two large veins. the superior and inferior vena cava. The
inferior vena cava receives blood from the portion of the body below the level of the
diaphragm. Two brachiocephalic veins collect blood from the upper portion of the body
and empty it into the superior vena cava.
2.2.2 Pulmonary circulation
Blood returning to the heart from the systemic circulation is deoxygenated. The blood
enters the right atrium, then the right ventricle from which it is pumped into the
pulmonary trunk. a very large artery. The pulmonary trunk divides almost immediately
into from the right and left pulmonary arteries. These vessels channel blood to the right
and left lungs respectively. In the lungs, each pulmonary artery gives rise to branches that
supply aIl regions of the organ.
Blood tlows into the extensive capillary networks in the wails of the pulmonary alveoli.
where oxygenation of blood occurs. Pulmonary capillaries deliver this blood ta
pulmonary venules which in turn join to form larger and larger veins. Two pulmonary
veins exit from each lung and channel oxygenated blood to the left atrium of the heart.
One should note that pulmonary veins are the only veins that carry oxygenated blood. and
16
• that pulmonary arteries are the only arteries that carry deoxygenated blood. Below is a
schematic representalion of the circulatory system.
arrerie. '0 lrlf~,oO'
port of body
art.rie. '0 d,ge,',."e"oct and Il'''~'
pulmonary yeln
~""",,--"""""-lun9
righ' ve"trid. -~+-------'l---
hepot1c vein ~--+~-
•
•Figure (2) schematic representation of the circulatory system [I2].
17

• 2.3 Volume-pressure relationships
The systemic and pulmonary blood vessels, like nurnerous other structures in the body.
are elastic structures. The fundamental property of an elastic structure is its inherent
ability to offer resistance to a stretching force and to retum to its resting or unstressed
length or volume after the stretching force has been lifted. The deforming stress is an
increase in the intravascular fluid volume in the intact body. Such increases in the
vascular volume will stretch the wall of the vessels and the recoil of the elastic vessel
walls will increase the intravascular pressure. The ratio of the change in volume to the
change in pressure is called compliance. Most physiologists prefer to define elastic
behavior in terms of compliance even though the terrn elastance is extremely descriptive.
•Compliance is defined as the reciprocal of elastance.
v-vc= (1
p(2.1 )
•
Where VI' is the resting (unstressed volume), that is the volume contained within the
compliant structure when the pressure, P, within the compliant structure is zero, and V is
the volume above the unstressed volume.
Below is an illustration of the volume-pressure relationships that are obtained when
compliance (l/elastance) is changed.
,...
laJ
/l&J
/w
a: a: a:~ ~ ~fi) en <n{I) en <nlaJ l&J Wa: a: a:
~~ ~ ~
.VOLUME VOLUME VOLUME
Increased Normal OecreQsedElastonce Elastance Elastance
or and OrDecreased Compllance IncreasedComoliance Compliance
Figure (3) Volume pressure relationships with changes in compliance.[l2]
18

•
•
•
2.4 Pressure- Flow relationships
The physical principles goveming the flow of fluids through conducting passages (rigid
or collapsible vessels) are derived from the general laws of hydrodynamics. The tluid can
be either liquid such as blood flowing through the cardiovascular system, or air. The
difference lies in the densities and viscosities of these fluids. The basic expression for the
flow of liquid through rigid tubes is Poiseuillets law. Their law states that the volume of
fluid flowing past a point in the tube per unit time (F) ~s proportionaI to the difference in
pressure between the inflow and the outflow ends of the tube (Pi-Po) and the fourth
power of the radius Cr) of the tube, and inversely proportional to the length of the tube (/)
and viscosity of the fluid (7]).
Poiseuille's law can be expressed as follows for conditions of horizontal flow:
(Pi-Po)/F= 8 1] lIT, r"' (2.2)
The term on the right-hand side represents those factors which tend to retard flow and is
known as the resistance to flow. The most commonly used relationship is therefore
(Pi-Po)/F=R, where R is the resistance.
2.5 Systemic and Pulmonary Vascular Compliance
The total lumped compliance of the systemic circulation (i.e. of arteries, capillaries and
veins) can be determined in experimentai animaIs by monlentarily stopping the
circulation, thell rapidly equalizing the arterial and venous pressures by pumping blood
from arteries to veins (Guyton 1973, Green 1979). The intravascular pressure measured
when arterial and venous pressures are equal is the statie transmurai pressure of the
system at that blood volume and is also known as the mean systemic pressure (Pms).
19

•
•
•
Pulmonary vessels, similar to those In the systemic circulation, are elastic, but with
quantitatively different compliances. Most authors believe that the pulmonary arterial
system (e.g. pulmonary artery) is more compliant than the systemic arterial system (e.g.
aorta). Yet, when the lumped compliance of the pulmonary system (i.e. arteries,
capillaries and veins) is compared with the lumped compliance of the systemic system,
the pulmonary system is found to be considerably less compliant than the systemic bed.
The compliance of the seriaI portions of the pulmonary bed is distributed differently from
that of the systemic circulation. The compliance of large pulmonary arteries and veins are
approximately equal (accounting to 15% of the total pulmonary vascular compliance).
The small pulmonary vessels, small veins, venules and capillaries account for the rest of
the pulmonary vascular compliance. Thus, it can be seen that blood vessels of both the
systemic and pulmonary circulations are elastic structures and recoil inwardly when a
volume stress is applied. The total compliance of the systemic circulation is greater than
that of the pulmonary circulation. Aiso the venous systems of both circulations possess
the greatest compliance.
2.6 Systemic and Pulmonary Vascular Resistance
In most physiological systems, an increase in the resistance to tlow is interpreted as a
decrease in the radius of the conduit(s) through which the flow occurs because the length
and viscosity tend to remain constant. The blood pressure that develops in the arterial
vessels of the systemic and pulmonary circulations is largely dissipated by the time the
blood arrives in the atria. This fact indicates that the blood vessels have a resistive
function in addition to their capacitive function. However, the magnitude of their
resistance is different at different levels of the circulation. The ratio of driving pressure to
20

•
•
flow is called vascular resistance. At normal cardiac output of 5.0 l/min for an adult
human, the mean systemic arterial pressure· is between 90-IOOmmHg. [n the systemic
circulation, the major pressure drops and thus the major resistance occurs upstream of the
veins (in the arteries). On the other hand, at a normal cardiac output of 5.0 I/min, the
mean pulmonary artery pressure is 8-15 mmHg. Unlike the systemic circulation, the
distribution of vascular resistance in the pulmonary system is divided approximately
equally belween artery and veins. The total pulmonary vascular resistance is considerably
less than the total resistance across the systemic bed.
2.7 Modeling in Physiology
2.7.1 Modeling objectives
The general categories of modeling objectives are normally identified as descriptive,
predictive and explanatory. Descriptive modeling expresses the quantitative relationships
in terms of equations. Predictive modeling determines how a system would respond to a
stimulus or change in the system. Explanatory modeling is used for description of the
ways in which different patts of the system behave and depend upon each other.
• • Mean systemic arteriaJ pressure vIs Mean systemic pressure. The former is the mean pressure in thesystemic arteries whereas the latter is the pressure observed throughout the systemic circulation whencardiac output is zero.
21
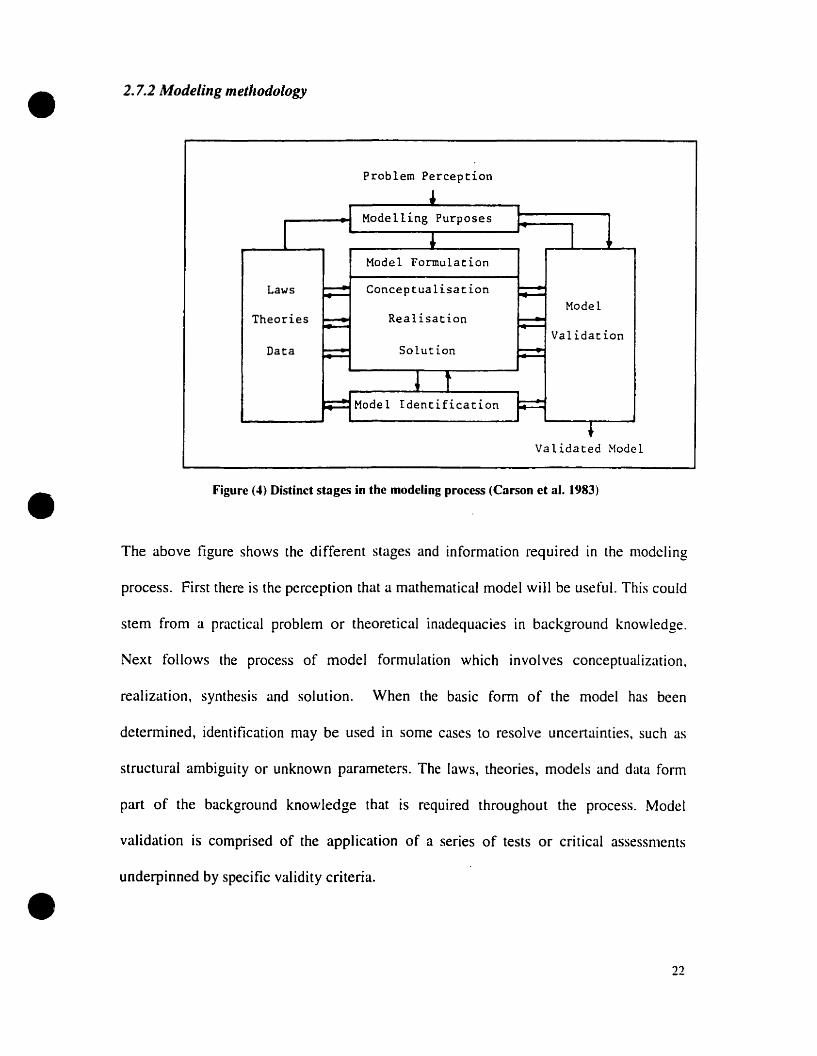
• 2.7.2 Modeling metllodology
Problem Perception
Laws
Theories
Data
Modelling Purposes
Madel Formulation
Conceptualisation
Realisation
Solution
Madel
Validation
•
•
Validated Model
Figure (4) Distinct stages in the modcling process (Carson ct al. 1983)
The abave figure shows the different stages and information required in the modeling
pracess. First there is the perception that a mathematicaI modeI will be use fuI. This cou Id
stem from a practical problem or theoretical inadequacies in background knowledge.
Next follows the process of model formulation which involves conceptualization,
realization, synthesis and solution. When the basic form of the model has been
determined, identification rnay be used in sorne cases to resolve uncertainties. such as
structural ambiguity or unknown parameters. The laws, theories, rnodels and data form
part of the background knowledge that is required throughout the process. Model
validation is comprised of the application of a series of tests or critical assessments
underpinned by specifie validity criteria.
22

•
•
•
2.7.3 Model classification
Circulatory models can be classified inta four levels of increasing complexity. The first
and simplest model classification is the pure resistance model giving mean, continuous
flow where pulsatile effects of blood flow are ignored. The second level of classification
is the lumped (windkessel) model consisting of circulatory subsystems of discrete
resistance, compliance and inertial effects. The third model classification is the
distributed linear model in which circulatory subsystems exhibit distributed resistance,
compliance, and inertial effects and linear approximations are used for the pulsatile
pressure wave flow of blood. The fourth model classification is the nonlinear distributed
model which attempts to provide complete pressure and velocity flow descriptions
throughout the distributed, rime varying circulatory system.
Table 1 shows a brief list of the historica! origins and uses of the four levels of modeling.
Concept Introduction as a research Usemodel
( 1)Pure resistance Young( 1809); Slow variations of mean bloodPoiseuille( 1840) pressure. Elasticity of
microcirculation. Rheology ofblood.
(2)Lumped parameter model Otto Frank ( 1899) Stroke volume from aortic(windkessel) pressure. Analog models.
Analysis of cardiac assistdevices.
(3) Distributed, linear model Womersley( 1957); Computation of Oow from(transmission line) McDonald( 1960) pressure gradient. Space and
time distribution of pressureand Oow. Input impedancestudies.
(4)Distributed, non-linear EuIer( 1755); Lambert( 1958) Accurate pressure and tlowmodel wave forms.
Table (1) brier Iist of historical origms and uses of the four levels of modcling [22]
23

•
•
•
CHAPTER3
24
•
•
•
LITERATURE REVIEW
3.1 Introduction
There have been many attempts to model the cardiovascular system in part and as a
whole. William Harvey (1578-1657), also known as the 'Father of Hemodynamics',
proved that the heart, and not the liver, was the center of the vascular system. His simple
compartmental model obeyed the law of mass conserVation. He applied StarIing's law
which states that the external stroke work done by the heart is proportional ta end
diastolic ventricular volume within physiological limits. In other words the cardiac output
should always be in balance with venous return. This shows that the heart is a self
innervating auto-regulative system. The first mathematical description of blood
circulation was attempted by the brilliant mathematician Leonard Euler in 1775. He
established a mathematical model for blood circulation, which described viscous,
incompressible fluid tlow in elastic arteries. Stephen Hales (1677-1761), who is often
referred ta as a brilliant experimentalist. was the first man to measure arterial blood
pressure in the horse. Hales was also the first to compute cardiac output. The first
cardiovascular model, more commonly known as the Windkessel model, was designed
and developed by Frank Otto in 1899. This very popular model conceives the arteries as a
system of interconnected tubes with fluid storage capacity. [n an intermittent fashion,
commonly known as ventricular ejection, fluid is pumped in at one end, while at the other
end through peripheral resistance, outflow is approximately constant and Poiseuillean. On
the following page is a representation of the Windkessel mode!.
25

•
•
•
~....... -- .....
/. "
'''''.... p '. ~ o~tfl··V.. pu. ('I~
~s
Figure (5) a schematic representation of the Windkessel model
3.2 Brier historical background
This review illustrates sorne of the more important developments which have been made
in relation to physical aspects of the heart and circulation.
3.2./ Models ofAuto-controlled cardiovascular system:
These models describe the instantaneous steady state" behaviour of the cardiovascular
system. In other words, the heart and circulation form a stable system independent of any
other form of control (e.g neural or hormonal).
• Van Harreveld (1949) model used a resistive capacitive electrical analogue. The mean
pressures and flows at the outlet and inlet of the heart, as weIl as the changes when
the system parameters varied, were represented. He described the resistance to blood
flow by the resistance in the electrical circuit. the capacity for blood storage by
charge capacity and blood pressure by voltage. Similar to aH the other work done in
this period, his model represented the steady state behaviour of the cardiovascular
system without taking into consideration the effect of neural or hormonal control.
• Guyton (1955) used a graphical method for the determination of venous return (VR),
cardiac output (CO) and arterial pressure (Pa). Guyton plotted CO and VR vIs right
atrial pressure (Pra) and the interaction of the two curves determines the operating
26

•
•
•
point (i.e. when VR=CO). thereby obeying Starling's law. His model also describes
the steady state conditions that the system might achieve given Iimited environmental
disturbances.
• Grodins' (1959) resistive capacitive model was based on Starling's Iaw of the heart in
which cardiac activity is represented by a Hnear relationship between strake work and
end-diastolic ventricular volume. The model consists of 23 simultaneous equations,
soIved to determine the equilibrium values.
• Noordergraaf (1963) used an eJectricaJ analogue for the study of human
hemodynamics. He devised a mathematical model of the systemic arterial tree (115
segments) to find a quantitative interpretation of the amount of blood passing thraugh
the heart in a specifie lime. This was done by recording the recoil movements of the
body that result from contraction of the heart muscle in ejecting blood from
ventricles. The blood flow through the Ieft ventricle was assumed ta be linear in this
model.
• Dick and RideOut (1965) devised a compartmental model which has 4 segments
representing the major divisions of the arterial tree and in which pumping of the heart
is represented by a time-varying compliance of the Ieft ventricle compartment.
• Beneken (1965) devised a compartmental model similar to that of Dick and RideOut,
but with 8 segments and implemented on an analogue computer. The ventricle
consists of 2 parts, one concerned with shape and the other with the properties of the
wall material. The left ventricle cross-section is assumed to have a cylindrical shape
and a constant lenglh. This modeI, simulated on an electronic analogue, solves 57
equations. Beneken studied the effect of perturbing the parameters on the behaviour
of the system as a whole.
27

•
•
•
•
• Sandguist. Olsen and Kolff (1982) proposed a comprehensive mathematical model
for the mammalian circulatory system based on a set of simplifying assumptions and
statements for the hydrodynamic and thermodynamic processes. Their aim was to
provide a correct quantitative description of the behavior and interaction of blood
flow through the major subsystems and compartments of the circulatory systems.
• Burkhoff et al. (1993) developed a mathematical model to simulate the cardiovascular
system. The ventricles are represented by time-varying elastances. The systemic and
pulmonary circuits are each modeled as lumped venous and arterial capacitances, a
proximal characteristic resistance, and lumped venous and arterial resistances. This
model will be further described in section 3.6.
3.2.2 Models ofControlled Cardiovascular Systems:
(1) Pulsatile models
• Warner (1959) included pulsatile phenomena in his resistive-inductive capacitive
model of the cIosed circulatory system. He set the structural pattern for subsequent
studies. His system was subdivided into a number of sections with the condition that
outflow of any segment is the same as the inflow of the next segment.
• Beneken and De Wit (1967) constructed compartmental model consisting of 19
segments representing the heart chambers. major arterial and venous vessels. The
specific shapes of the ventricles and properties of the ventricular wall are also taken
into consideration. This model is described in more detail in section 3.3.
Beneken and RideOut (1968) showed that computer models of the circulation based
on lumped circuit approximations may be used for. simulation studies of its pulsatile
pressure, flow and volume relationships. Coupled to this basic circulation model, a
28
•
•
•
second model may be developed to simulate the flow of substances carried by the
blood. Such a dependent model is based on the notion that transport tlow is
proportional ta concentration in the dependent circuit multiplied by tlow in the main
circuit. The combined model can be used to control studies relaled to the transport of
carbon-dioxide and oxygen.
• Pullen (1976) based his model structure on the circulatory fluid mechanics of
Beneken and De Wit (1967) with baroreceptor and neural control models of Katona
(1967) and Hyndman (1970) and the "multiple modeling" of Beneken and RideOut
(1968). Pullen introduced an algebraic method for modeling the local effects of
cardiovascular active drugs.
• Piene (1983) developed a 7-segment model hased on Beneken (1964) model. His
model consisted of 4 active heart chambers, 1 pulmonary bed, 1 systemic arterial bed
and 1 venous hed. The heart chambers are contained in an elastic pericardium whose
P-V (pressure volume) relationship was linear. This model is further described in
section 3.5.
(II) Non-pulsalile models
• Boyers (1972) developed a non-pulsatile control model of the cardiovascular system
to study normal responses to posture, blood loss, transfusion and autonomie blockade.
The model eonsists of the heart, large arteries, peripheral circulation and the effects of
a ganglionic agent (Arfonad) on the circulatory response to a large transfusion of
blood. The model simulates the steady state responses of the cardiovaseular system to
stresses ranging from a few seconds to many hours in duration. Ir can also he used to
study the regulation of interstitial fluid and total blood volumes. The results obtained
29
•
•
•
from the tests of the model agree closely with measurements made on the human
circulation.
• Guyton et al. (1972) devised a non- pulsatile lumped-parameter model of the
uncontrolled circulation to which was added a large number of short and long term
control mechanisms. The anaJysis consisted of 354 blocks, each of which represents
at least one rnathematical equation deseribing sorne physiological facet of circulalOry
function. Guyton divided the analysis into 18 different major systems that enter ioto
circulatory control. The model conlains the blood conductive pathway. vaseular
stress, relaxation, membrane dynamics of the capillaries. tissue fluid volume and
pressure, eIectrolyte shifl. autoregulation. autonomie control amongst a number of
other facets. This led to an equation set of arder 37 which was solved using a digital
computer.
• Leaning et al. (1983) reported a mode! originally devised by Pullen, based on the
Beneken and De Wit (1967) model of 19 compart.ments. The objective here was to
study hemodynamic and drug effeets in the CNS controlled eardiovascular system.
This model is described in more detail in section 3.4.
3.3 Overview of Beneken and De Wit model
Figure (6) shows a black diagram of the cardiovascular system with its subdivision into
19 segments; seven systemic al1erial segments, six systemic venous segments, four heart
chambers and two pulmonary segments. Two arterial and two venous segments represent
the intra-abdominal vessels, while three arterial and two venous segments of the systemic
circulation represent the intra-thoracic vessels. This compartmental mode1 takes inta
account the specific shapes of the ventricles and properties of the ventricular wall. The
30

•
•
contractile properties of the heart muscle are inc1uded by equations relating length, force,
velocity, and time based on physiological data. The contractile actions of the atria are
incorporated as time-varying elastances. The description of the systemic and pulmonary
vascular systems covers elastic and viscous wall properties, inertia and viscosity of blood,
proper distribution of blood volume between the various compartments and cardiac
output in the lumped arterio-venous parhways. An electrical analogue computer was used
{Q solve the simultaneous equations. The simultaneous solution of ail equations involved
raises the possibility of studying the behaviour of the system as a whole and of
investigaring its sensitivity to parameter variations.
The equations governing this model are as follows. The relation between volume inflow
and outflow (equation of continuity) is
(3.1 )
The equation of motion is the relation between the left ventricular pressure PLV. the
pressure in the ascending aorta, and left ventricular outflow. The equation is similar for
the right ventricles, thus
(3.2)
FUIAOJ = O···· ..····if PLV ~ PAOI
The atria are modeled as time-varying elastances, thus;
•Pu. = af...\ (t)(V - Vu) lA
PRA = aRA (t )(V - Vu) R,,\
The pulmonary and systemic vessels are modeled by the following equations:
(3.3 )
31

•v; = VOl +J(FoI - F;2 )dt
(3.4 )
(3.5)
(3.6)
•
•
where C is compliance, L is inertance, F is flow (here in first segment), V is volume, R is
resistance, R' is viscosity coefficient and Vu is unstressed volume.
32

•
•
r~--------_:_------------~-l1 1 1
'1 su. wU ~J PUt. l,. 1
CIl ~ \tIIS :, ,..... 1 f' ~••, 1, ...... .,,,, .
, .... "-1 \ 11 • ...... /- t • 1! r!C1fT [ [
1 I~.m. 1:.1 : ~1 \1 1 .1 1:
1 1 / l' 11 t\ / 1' ,
1 Il'Il UrT . ~C. AORflt 1
1 V1rr~~ I1Il1la! - _ - lACiI 1
1 ~\. Il // JFco~ ! 1
1 IN~. YlllA '....~ ,,' tHOA.
1 CAVA jO AUTA 1
:---. -- ---~~- -I-~; ---- --ri-f--1- il' --11 1
! i ~". J2 ( W:~II. ! 1
1 i vtllS 1 UiENa 1 1
, t ' i 1
: 1 !
---l---~-----------------------T---'
HEAD AlDARM$
1 ~ 1 ~~s 1
l''-'-----........,~--------~\ wt~S j, 1 1
ms
•
Figure (6) block diagram of the cardiovascular system. [32]
3.4 Overview of Leaning et al. model
Leaning et al. (1983) based his model on the Beneken and De Wit (1967) model of 19
compartments. The objective here was to study hemodynamic and drug effects in the
33

• CNS controlled cardiovascular system. The model consists of 61 state equations and 178
parameters in total. Leaning et al. carried out tests based on a comprehensive and
systemic program of validation of the circulatory. neural control and local
pharmacodynamie subsystems of the mode!. Emphasis was put on validation aspects of
modeling methodology. Many validation problems occurred because of the large size of
the mode!. The limitations and the possibilities of model reduction and development were
considered.
Below is a Iist of the equations used in the model.
Equations of the nuid mechanics subsystem:
•
•
For aIl segments j, from continuity considerations:
dV._J =L F;. - "f. F k Vj~O, for alljdt 1 1 k J
Arterial segments
(Pj - Pk - cr il; RJA; FJt - G il; )=
L t
wlzere
G JI; = Ilg/ JA; sin!/J It
1 KJ
dVJ
PJ =S-(VJ -V'I/)+-Sd(
Heart Segments, j:
For ventricle segments:
dF jt = [PI - Pl - Rit FJt + F Jt 2 ( P / 2A/ )]
dl L Fjk~J
(3.7)
(3.8)
(3.9)
(3.10)
34
• For atrial segments
(p] - ~)F]t =--"-
R]t
a/t) =y(b2(1/ljS -a,D)+a,D
Timings of the cardiac cycle
(3.11 )
(3.12)
The heart is considered as a set of four separate unidirectional pumps. Cardiac timing
events are similar to thase used in the Beneken and De Wit mode!.
ru =0.1+ 0.09 TH
Tvs=O.16+0.2TH
(3.13)
•where TAS is the period of arterial systole, Tt\ v is the time between the start of arterial
systole and the start of ventricular systole. Tvs is the period of ventricular systole, and TH
is the heart period.
x=ox= sin (pi*tj TAS)
y=oy =sin (pi*(tc -TAV)/ Tvs )
For ail venous segments
,le> TAS
,le <r\S
,lc< TAS or t2>T,.\V+Tvs, TA v < t2 <TA v+ T vs
(3.14)
•Pj<Pk
Pj<Pk
Vj>Vuj
Vj::;Vuj
(3.15)
(3.16)
(3.17)
35

• 3.5 Overview of Piene et al. model
The model of Piene et al. [28] resembled that proposed by Beneken in 1964. It consisted
of 4 active heart chambers (atria and ventricles) which were modeled by time-varying
compliances. The atria and ventricles were connected to each other by unidirectional
val ves and small resistances. The right ventricle was· connected to the left atria by a
lumped windkessel mode! of the pulmonary circulation. The left ventricle was connected
ta the venous system through a similar representation of the systemic arteries. The venous
bed was represented by a large compliance and a small inflow resistance ta the right
atrium. The four heart chambers were contained within an elastic pericardium.
•The time varying svstolic ventricular elastance:
El' (1) ::: C EII/clx sin (2 n(2f-O.25))
where C =contractility, and ElI/iL" is the maximum systolie elastance.
The time-varying systolie atrial elastance:
E (t) =6Ed (sin (2n(21-0.0S)-O.75)
where Ed is the diastolic atrial elastances.
(3.18)
(3.19)
•
The aim of this work was to examine the poteney of a simple model of the circulatory
system for the imerpretation of experimentally obtained data. Piene et al. proved thut
alterarion of myoeardial function of a eompartment of the intact heart will influence the
other eompartments. The pressure-volume relationship of a specifie heart eon1partment is
depicted by the myocardial stiffness plus the effeets of perieardial constraint. It was also
36

•
•
•
shown that, owing to the faet that the heart chambers are arranged 10 series, the end-
diastolic dimensions have to adjust until the outputs on both sides of the heart balance.
Below is a schematic representation of the model used by Piene et al.
Pulmor,ery bed
S~stemlC
llrter~l:!l bec
!Venous bed
Figure (7): sketch of Piene et al. model (1983).[36]
37
•
•
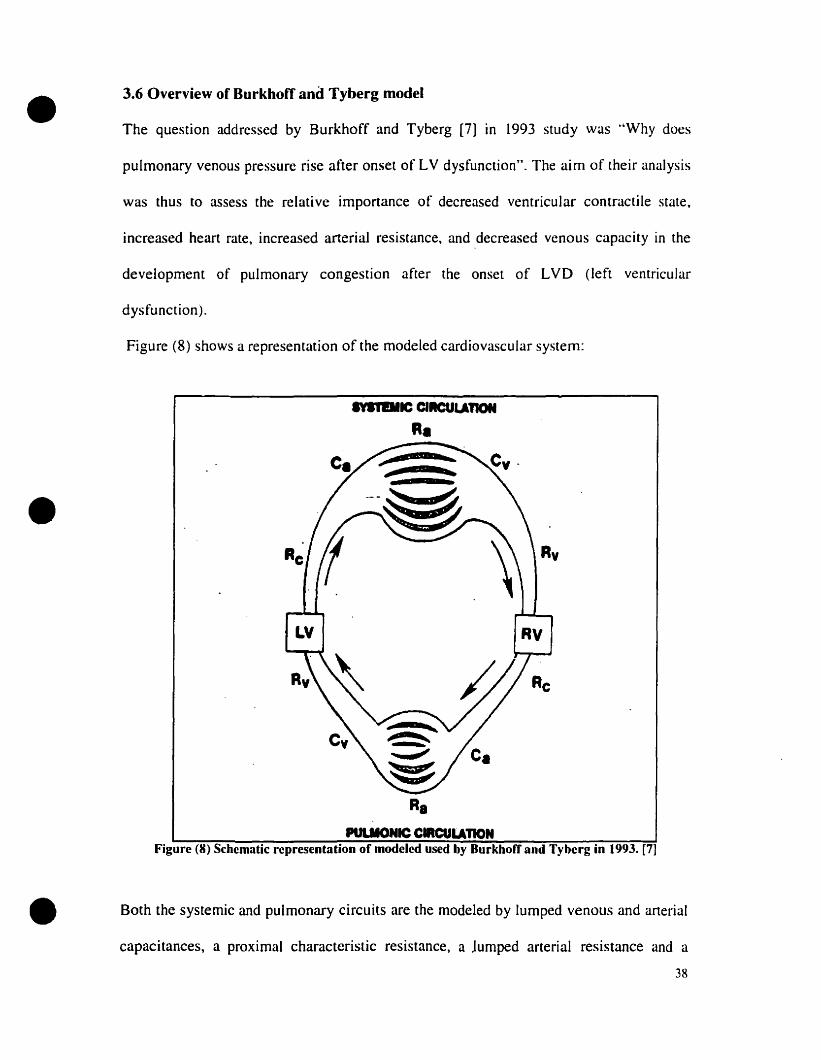
3.6 Overview of Burkhoff and Tyberg model
The question addressed by Burkhoff and Tyberg [7] in 1993 study was "Why does
pulmonary venous pressure rise after onset of LV dysfunction". The aim of their analysis
was thus to assess the relative importance of decreased ventricular contractile state,
increased heart rate, increased arterial resistance, and decreased venous capacity in the
development of pulmonary congestion after the onset of LVD (Ieft vcntricular
dysfunction).
Figure (8) shows a representation of the modeled cardiovascular system:
IVlillllC ClICULAnoN
R•
R.PULIIONIC CIRCULATION
Figure (8) Schematic representation of modeled used by Burkhorr and Tyberg in 1993. [7]
• Both the systemic and pulmonary circuits are the modeled by lumped venous and arterial
capacitances, a proximal characteristic resistance, a lumped arterial resistance and a
38

• resistance to retum blood from the veins to the heart. The right and left ventricular
pumping actions are given by time-varying elastances, which relate instantaneous
ventricular pressure linearly to instantaneous volume. The model assumes a non-linear
end-diastolic pressure-volume relationship, a linear end-systolic pressure-volume
relationship, and a smooth progression between the two during the cardiac cycle.
End-diastolic pressure (Peel) and volume (Veel) are related by
(3.20)
•where A and B are constants. End -systolic pressure (Peo.;) and volume (Vt'.J are related by
(3.21)
where Ees is the maximal volume elastance, VII is the volume at which end-systolic
pressure is OmmHg. A function e (0 depicts the time-course of the chamber stiffness
between end-systole and end-diastole, thus;
e (l)=0.5[sin (mlfe.f - JrI2) +1 J
e (l)=0.5 /U-3Teofl2J/f/
for t < 3Te../2
for t > 3Te.12
(3.22)
•
where Tes is the time for end-systole and, is the time cqnstant of relaxation.
A set of six differential equations describes changes in volumes of the four vascular
compartments and the two ventricles as functions of time. These simultaneous differential
equations were solved numerically.
39

•
•
•
CHAPTER4
40
•
•
•
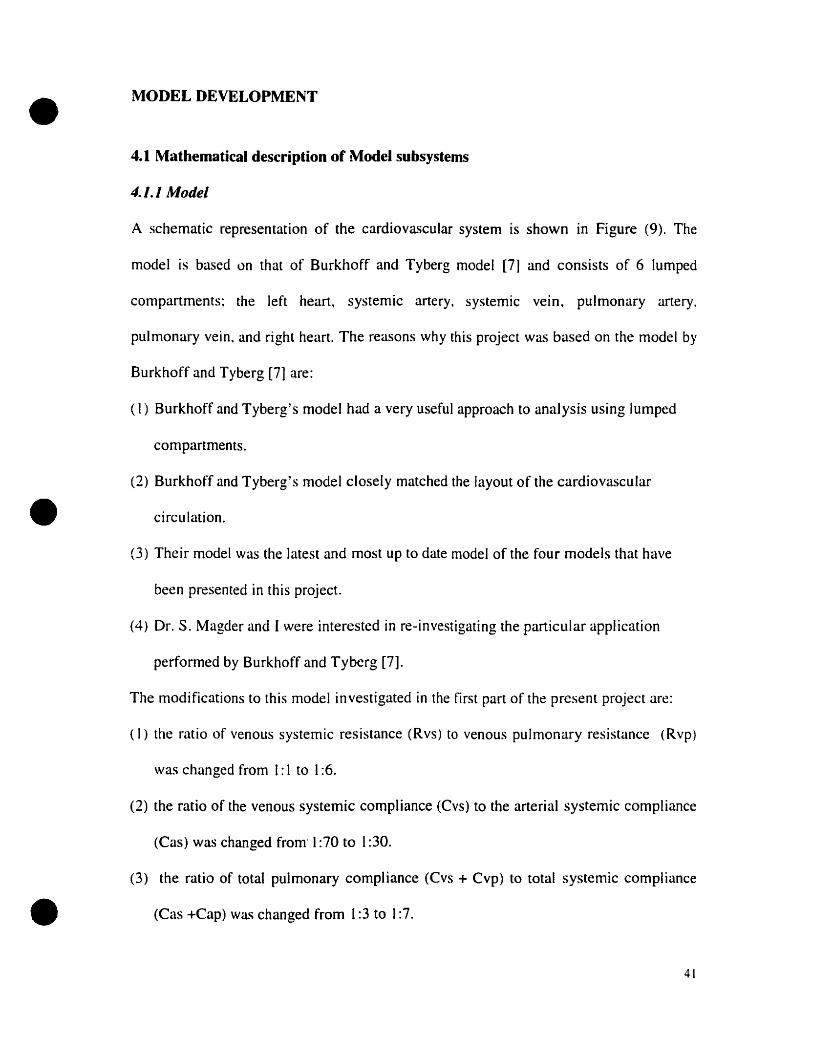
MODELDEVELOPMENT
4.1 Mathematical description of Model subsystems
4.1.1 Model
A schematic representation of the cardiovascular system is shown in Figure (9). The
model is based on that of Burkhoff and Tyberg model [7] and consists of 6 Iumped
compartments: the left heart, systemic artery, systemic vein. pulmonary artery.
pliimonary vein, and right heart. The reasons why this project was based on the model by
Burkhoff and Tyberg [7] are:
(1) Burkhoff and Tyberg's model had a very useful approach to analysis lIsing lumped
compartments.
(2) Burkhoff and Tyberg's model c10sely matched the layout of the cardiovascular
circulation.
(3) Their model was the latest and most up to date model of the four models that have
been presented in this project.
(4) Dr. S. Magder and 1were interested in re-investigating the particular application
performed by Burkhoff and Tyberg [7].
The modifications to this model investigated in the first part of the present project are:
( 1) the ratio of venolls systemic resistance (Rvs) to venous pulmonary resistance (Rvp)
was changed from 1: 1 to 1:6.
(2) the ratio of the venous systemic compliance (Cvs) to the arterial systemic compliance
(Cas) was changed from-I :70 to 1:30.
(3) the ratio of total pulmonary compliance (Cvs + Cvp) ta total systemic compliance
(Cas +Cap) was changed from 1:3 to 1:7.
41

• (4) the stressed volume (Vs) was raised from 750ml to 1830ml.
These ratios of Rvs: Rvp, Cys: Cas, (Cvs+Cvp): (Ca~+Cap) that were chosen for this
project are reflective of the ratios obtained From Dr. Magder' s experimental data.
Furthermore the ratios used in this project are supported by data presented in the
literature [12, 13, 14]. The model sirnulates a normal 70kg man in whom the Cardiac
Output (CO) -= 5 I/min. the MAP -= 90mmHg, PyS -= 6-8 mmHg. and PVP -= 8-
12mmHg.
~ dVvp
dt dtPll'V.,~ P." v", c.'l
• RapP.A P.v
s.\' S.A
p",c.., VIIRas
P.,v..c.
dVvs dVas
dt dt
dV~
dt
• Figure (9) Structure orthe Model used in the present study
42
•
•
•
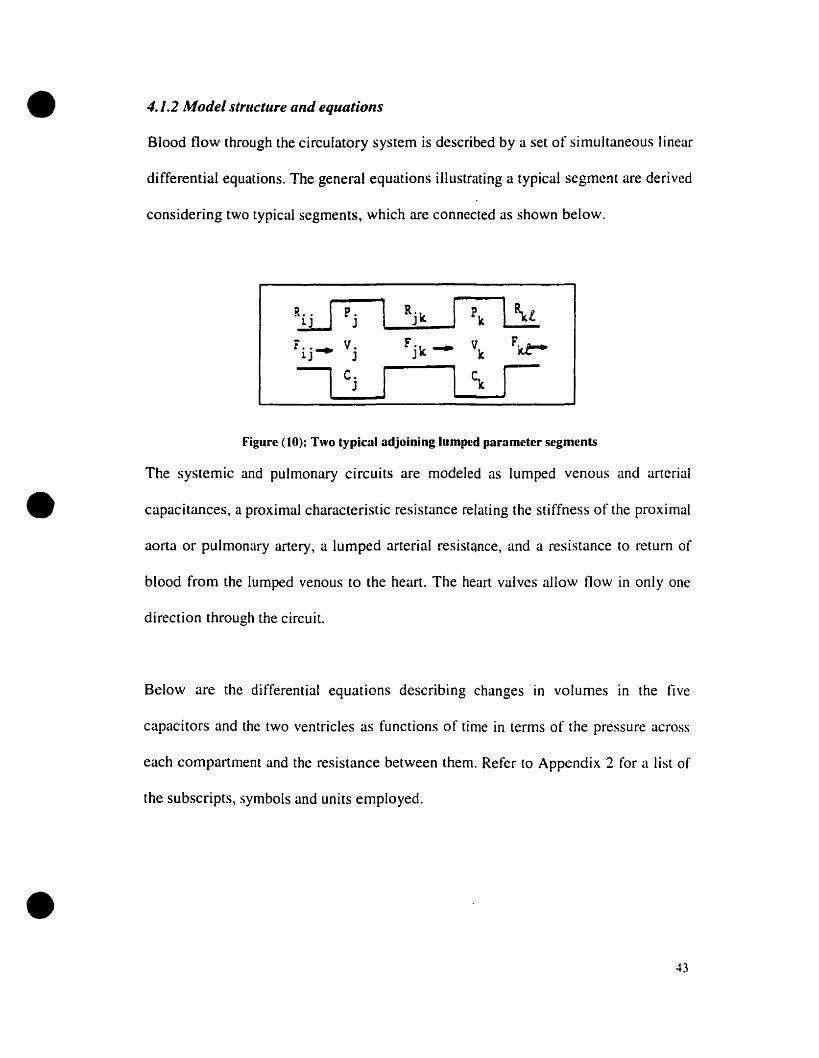
4./.2 Model strflctlire and equations
Blood flow through the circulatory system is described by a set of simultaneous linear
differential equations. The general equations illustrating a typical segment are derived
considering two typical segments, which are connected as shown below.
~ P. Rj ,,- Pk lliJ
F••~ V. Fjk ~ Vk
Fkt-1J J
1 c.1 ~ 1J
Figure (10): Two typical adjoining lumped parameter segments
The systemic and pulmonary circuits are modeled as lumped venous and arterial
capacitances, a proximal characteristic resistance relating the stiffness of the proximal
aorta or pulmonary artery, a lumped arterial resist'lnce, and a resistance to return of
blood From the lumped venous to the heart. The heart valves allow flow in only one
direction through the circuit.
Below are the differential equations describing changes in volumes in the five
capacitors and the two ventricles as functions of time in terms of the pressure across
each compartment and the resistance between them. Refer to Appendix 2 for a list of
the subscripts, symbols and units employed.
43
•
•
•
Model
dVu.r(t) _ Ph' (t) - ~.\ (t) f3 ~.r (1) - ~'r (t)dt - Rer Il' R
u.-
d~.\(t) _ ~.r(t) - ~..r(t) ~'r(t) - Pn,(t) adt - R
u.\ R~ ..\. n'
dVn.(t) = ~'r(t) - Pn.(t) a _ Pn.(t) - ~/II(t) f3 .'n' R n
dt R\., CI'
dV,I/1 (t) = P,.) t) - P.'/I (t) {3 _ F:/I Ct) - ~'I' Ct )n' Rdt Rq , III'
dV~,/,(t) _ PI/I'(t) - ~Jl(t) ~.p(t) - ~\,(t)----:....---a/\.
dt R R~'/I(//'
d~~.(t) _ ~'I'(t) - ~)t) _ p,~.(t) - ~u(t) {3----=-~ - ah' R , I~'
dt R\'1' cr
p = ~'P"l' C
"l'
(4.1)
(4.2)
(4.3)
(4.4)
(4.5)
(4.6)
(4.7)
(4.8)
(4.9)
(4.10)
44

• 4.1.3 Model ofIlle hearl
The right and left ventricular pumping characteristics are represented by time-varying
elastance theary relating instantaneous ventricular pressure lincarly ta instanraneous
volume:
P (t)=E (t){V (t)- Vol (4.11 )
E (t) is modeled as a raised sine wave during systole and an exponential decay during
diastole (Figure (Il ». This model assumes a nonlinear end-diastolic pressure-volume
relationship, a linear end-systolic pressure-volume relatianship, and a smoolh
progression between the two during the cardiac cycle.
~----......,-,------..,.----~--~---~---~--
• 0.9 ~ .
0.8 ~
0.7 -
0.6 rQ)
-g :=8. 0.5 r .E '< 0.4;
0.2:
0.1 j
i0'o 100 200 300 400 500
lime(msec)600 700 800
•Figure Il: Representation of E (t) funetion
45

•
•
where
1[. ft ftE .(t) = - sm(-t --) + 1]
Il ? T Î- l".\' -
3Tfior t < -"-'- 2
() 1 [(t - (3T~./ 2) ]E t = -exp d
1\. ?_ r
(4.12)
(4.13 )
(4.14)
(4.15)
(4.16)
•
A set of equations similar to the one above is used to describe the right heart. The
volume of blood in each compartment is divided into two pools denoted the
unstressed and the stressed volumes. Unstressed volume is the maximun1 volume that
can be placed in a capacitive vessel without raising its pressure above 0 n1mHg. The
pressure within the compartment is assumed to increase linearly with stressed
volume. The total stressed volume of the body equals the sum of the stressed volume
of a1I compartments.
Therefore. total volume in the body is broken down as follows:
(4.17)
46

• 4.1.4 Pericardial Effect
The right and left heart properties are interdependent. since they share a common wall
known as the septum and they are encased in a sac called the pericardium. The effect
of the pericardium is incorporated into the model by adjusting the function of the
right heart, through the end-diastolic right ventricular pressure-volume curve. The
original relationship used by Burkhoff and Tyberg was modified to be:
Pedn' =Crv x [Arv x (exp (8rv x (Vrv-Vorv))-I ] (4.18 )
Pesrv =Eesrv x (Vrv- Vorv) (4.19)
where Crv =0.05. Arv=O.002. and Brv=O.098
•The new Pressure-Volume Relationship of the End-dinstolic curve is given in Figure
(12).
PressureNolume Relationship350~,---~-------.-----~--~~-~-~
1
300 ~ New function
250 ~ -
Figure (12) Representation of pressure-volumc rclationship for end-diastolic curvc.
300250200100 150Volume(ml)
50
oL.- ............l:O---
o
100
Cl .
~ 200:Eal:s ;~ 150!~a..
•47
•
•
•
4.2 Implementation
4.2.1 Simulink
Simulink is a software package, built on top of MATLAB®· 1 for modeling, simulating,
and analyzing dynamical systems. It supports linear and nonlinear systems and model in
continuous lime or sampled time or a hybrid of the two. Also, systems can be multi-rate,
that is, have different parts that are sampled or updated at different rates.
Simulink provides a graphical user interface for building models as block diagrams, using
c1ick-and-drag mouse operations. It includes a comprehensive block library of sinks,
sources, linear and nonlinear components, and connectors. It also allows customization of
existing blocks and creation of new ones.
Models are hierarchical, and can be built using either top-down or bottom-up approaches.
They can be viewed at a variety of levels of detail. This provides insight inca how the
variaus parts of the model interact.
Once a model has been defined, simulation is performed, using a choice of integration
nlcthods, either from the Simulink menus or by entering commands in MATLAB's
command window. The menus are especially useful for interactive work, while the
command-line approach is very convenient for running a batch of simulations. With the
use of scopes and other display blacks, the simulation results can be viewed while the
• MATLAB is owned by The MathWorks. Inc. 3 Apple Hill Drive Natick. MA 01760-2098 UNITEDSTATES; http://www.rnathworks.com
4H

•
•
•
simulation is runnmg. AIso, parameters can be changed during simulation. The
simulation results can be forwarded to the MATLAB workspace for post-processing and
visualization.
The solver used for this model was ode· 5 (Dormand -Prince) with a fixed step size of
0.001 and a single-tasking mode. The time period for one simulation was set to 72
seconds.
A Simulink representation of the model used in the preset study is given in Figure ( 13).
The Simulink representation model of the heart is given on Figure (14).
• ode = ordinary differential equation
49

•Figure (13) Representation of model in Simulink
• •
;,
1 r2-1~Il!
F"'llp·FaIWP
l 'llmari:> 1fi,
'11 14 1 1 1 1.1
lime

•Figure (14) Simulink representntion of Idt and right heart
• •
Pedrv
Pesrv
i 1.
(Peslv-Pedlv)"elv(1) ..Pedlv
(Pesrv·Pedrv)'erv(t) .. Pedrv
(Pesrv·Pedrv)'erv(t)
51

•
•
•
CHAPTERS
52
•
•
•
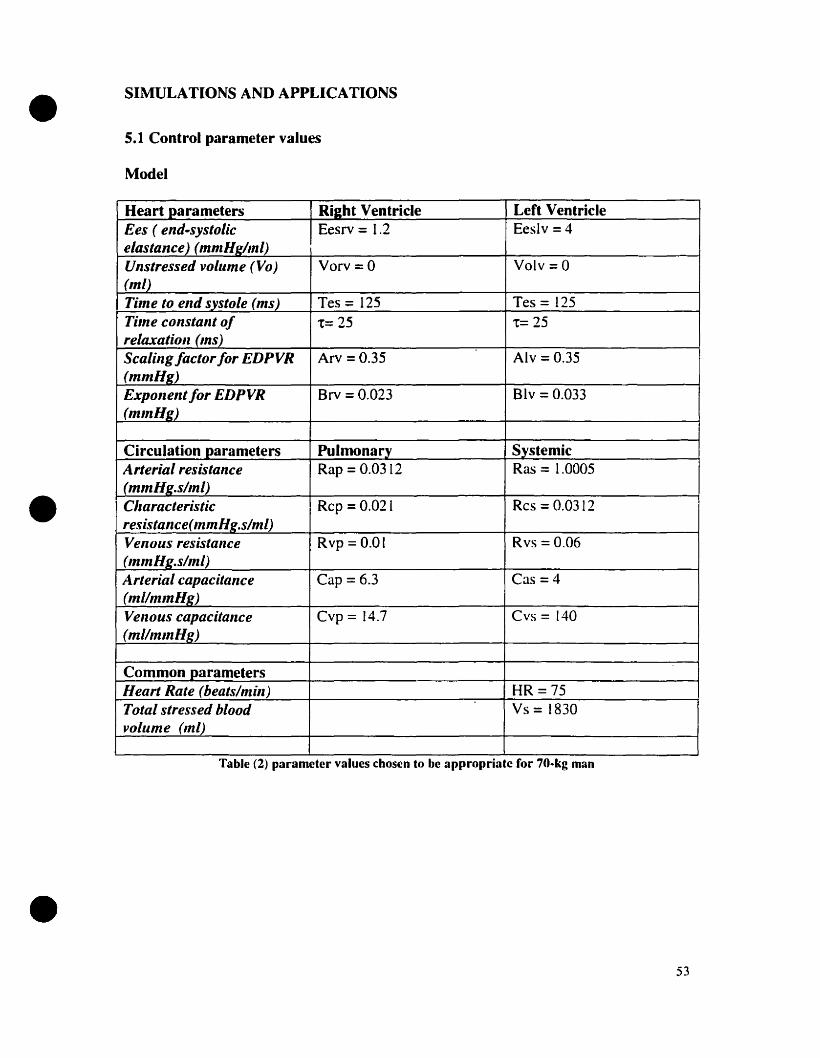
SIMULATIONS AND APPLICATIONS
5.1 Control parameter values
Model
Heart parameters Riaht Ventricle LeCt VentricleEes ( end.systolic Eesrv = 1.2 Eeslv = 4elastance) (mmHg/ml)Unstressed voillme (Va) Varv = 0 Valy =0(mL)Time to end systoLe (ms) Tes = 125 Tes = 125Tùne constant of t= 25 t= 25reLaxation (ms)Scaling factor for EDPVR Arv =0.35 Alv = 0.35(mmHg)Exponent for EDPVR Brv = 0.023 Blv = 0.033(mInHg)
Circulation parameters Pulmonarv SystemicArterial resistance Rap = 0.0312 Ras = 1.0005(mmHg.s/m1)Cllaracteristic Rcp = 0.021 Res = 0.0312resistance(mmHg.s/m1)Venous resistallce Rvp =0.01 Rvs = 0.06(mm Hg.s/mL)Arterial capacitance Cap = 6.3 Cas =4(mi/mlnHg)Velzous capacitallce Cvp = 14.7 CYS =140(millnlnHJ:)
Common parametersHeart Rate (beats/min) HR=75Total stressed blood Vs =1830volume (ml)
Table (2) parameter values chosen to be appropriate for 70-kg man
53

•
•
•
Control values Range of normalvalues
EDLV (End diastolic left ventricular 92.307 ml -------vol.)
EDRV (End diastolic right ventricular 79.694 ml -------vol.)
ESLV (End systolie left ventricular vol.) 24.978 ml -------
ESRV (End systolie right ventrieular 12.381 ml -------vol.)
SV (Stroke Volume) 67.313 ml 60-70 ml
CO (cardiac output) 5.0481/min 4-61/min
PVP (Pulmonary venous pressure) 9.644 mmHg 8-15 nlmHg
MAP (Mean arterial pressure) 90.013 mmHg -90 mmHg
PVS (Systemic vein pressure) 8.47 mmHg -8-10 mmHg
Pedlv(End diastolie left ventrieular 1.838 mmHg 0-2 mmHgpressure)Pedrv (End diastolie right ventricular 7.012 mmHg 4-6 mmHgpressure)(E.F) ejeetion fraction 0.729 ------
Table (3) showing the control values obtained from control simulation
Table (2) shows the control parameters, as weil as their respective synlbols and units used
in this extended model. Table (3) represents the variables that are ca1culated from a
control simulation of the model and the normal range wilhin which they are supposed la
lie for a normal 70-kg man.
54
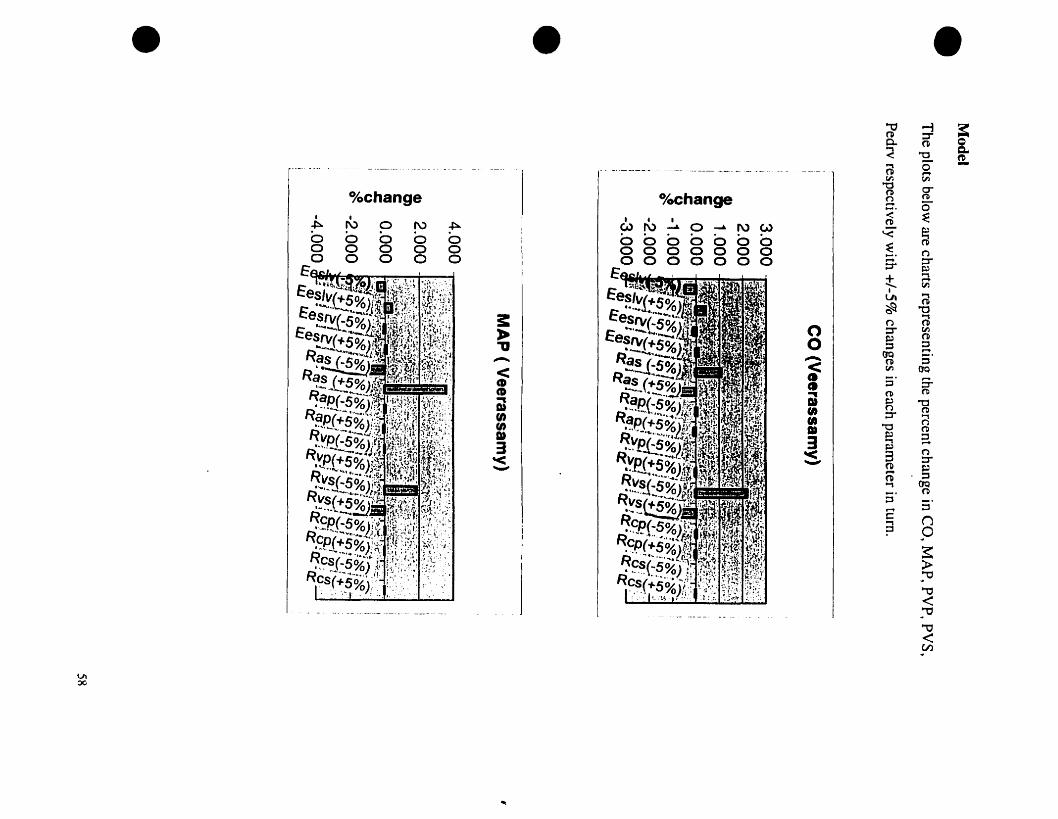
• 5.2 Sensitivity Analysis
A sensitivity analysis of the model was performed by perturbing each of the parameters
in turn. by ± 5% and observing the changes in cardiac output (CO), mean arterial pressure
(MAP), End-diastolic right ventricular pressure (Pedrv), pulmonary venous pressure
(PYP), and systemic venous pressure (PYS). The analysis was performed for both the
Burkhoff and Tyberg model and our extended model. Excel was used to chart the results.
The parameter of major concern here is the systemic venous resistance (Rvs). On
perturbation within ±5%, major differences are noied when comparing the results
obtained by Burkhoff and Tyberg model and our extended model. CO varied within
-±O. 1% for Burkhoff and Tyberg and -±2.2% for our model. MAP varied within -±O.9%
• for Burkhoff and Tyberg model and -±1.8% for our mode!. PYP varied within -±O.3%
for Burkhoff and Tyberg and -±5% for our mode!. Pedrv varied within -±O.4% for
Burkhoff and Tyberg model and -±5.5% for our mode!. PYS varied within -±O.2% for
Burkhoff and Tyberg model and -±2.2% for our model.
These observable differences can be attributed ta the fact that our ratio of systemic to
pulmonary resistance was 1:6 compared to the 1: 1 Qf Burkhoff and Tyberg. From a
physiological basis, on perturbation of the peripheral resistance, one ShOllld obtain a
larger fluctuation than that obtained by Bllrkhoff and Tyberg, and similar to our results.
Hence our ratios are a better representation of the cardiovascular circulation than those
uscd by Burkhoff and Tyberg [7].
•55

•
•
•
For sake of completeness, the remainder of the parameters was also perturbed and the
results charted.
Sensitivity Analysis with Perturbation of (+/-5 % )[values are given as percent
change]
Burkhoff/ Tyberg model
The plots below are charts representing the percent change in CO, MAP, PYP, PYS,
Pedrv. and respectively with +/-5% changes in each parameter in turn.
CO(Burkhoff and Tyberg)
MAP (Burkhoff and Tyberg)
6.0004.0002.0000.000
-2.000-4.000-6.000
Lu
56

• • •
~ ~,>:>(>:
o/oChange1-. a -. ru0 a a aa a a aa a 0 a
..I.a .._. :IL.....:. J"a<"tJ
l ~.......al
l- e- ~
~ I!I ~::7
~ 0
1 1 =m:a
j D.
J ~~
(Q D"- - CD~ca
----
UI-...J
VIOC
• •.-_ .. - ------- -~ ~- - ---_._- ~ - -- - -- - - --- ---- -- _.._------ ---- -------~-- ,_._-- ~ -~ --
%change o/oehange• 1 • 1f\) 0 f\) ~ Wf\)~O~NW
0 0 0 0 00000000 0 0 0 00000000 0 0 0 0000000
3:•'11.....-..<GCD~
Dtfi)fi)1»3'<---
....
•'"0 -i a:n :r
8-0- n~ "0 ID
0" -@ ....tJ'l CIl
"0 a-n (tl~ 5":;:'
~(tl
'<" ~§. (').... ::r::r ~
t....,....CIl
1
@tA
~ "'0(') @
0 :r CIl~ 0
0 ::;:, ::;:,....(JQ 5'....... n< CIl OQCI
::J S-CI(tl (tl
~
~ OC1» (') ('Il(1) :r ...,(1) (')
"'0 ('Il1» e; ::33 ....~
(')'< 3 :r--- fil ~.... ::;:,0Otl...,fil
;:]::;:,....
c: n...,? 0
~>-~""O
""0<~""O
""0<(Il

• • •
"1J<"1J.-.<CDCD~
suenenDJ3'<'-"'
'V<Je.~CD..Dtfi)•1»3:s.
~l.
"'0CDQ....<'<CDCD...DIenenDI
3'<-
"- --~--_._----
% change % change1 1
%changer\> . . .
~ N0 ~ ~ m (X)~:-p 0 0 ~
0 0 0 0 0 a 01 ~ 01 8 U1 a U1 a1 1
....L 1 ....L0 0 0 0 0 0 ~t<' .~ 0 ~ ~ ~ - 01 0 01 00 0 0 0 0 n ,.... .......
0 0 (:) 00 0 0 00 0 0 0
VI\0

• 5.3 Simulations
5.3.1 Impact ofchanging LV end -systolic elastance (Eeslv)
The purpose of this test was to examine the hemodynamic responses to a pnmary
decrease in LV contractile strength with aIl other cardiovascular properties kept constant.
As seen from figure (IS) on page 67, Eeslv was varied from 6 mmHg to 0.5 mmHglml
with control at 4mmHg/mi. As Eeslv was decreased from 4mmHg/mi to 1 mmHg/ml
(representative of reduction in contractile performance) there was a substantial decrease
in CO and MAP from S.OS to 3.67 Umin and 90.01 to 66.11 mmHg. On the other hand,
PVP increased from 9.64 mmHg to 23.8 mmHg.
The same test was performed taking into consideration pericardial effects (see section
4.1.4). The results obtained are a decrease in CO and MAP from S.3 ta 3.8 Umin and
• from 95 to 67.7 mmHg respectively. An increase in PVP is also noted in this case from
10.9 ta 26.6 mmHg.
Burkhoff and Tyberg showed that reducing the contractile performance of the left
ventricle had little effect on PVP. On the other hand, the results obtained in this research
project demonstrates c1early that, although CO does not decrease by a substantial amount
when Eeslv is halved, PVP does undergo a huge increase. The probable reason
underlying why Burkhoff and Tyberg obtained a small rise in PVP is due ta the smaller
Mean Circulatory Filling Pressure used in their mode!.
•60

•
•
•
5.3.2 Impact ofchanging Systemic Arterial resistance'
The raie of increasing systemic resistance in pulmonary edema was tested by setting
Eeslv at half its control value (2 mmHglml). Ras was increased from 1.0005 (0 5.2~
mmHg.s/ml. resulting in a decrease in CO from 4.59 to 2.06 IImin. and an increase in
MAP and PVP from 82.07 ta 183.56 mmHg and from 14.07 to 20.74 mmHg respectively.
The same (est was performed taking into consideration pericardial effects (see section
4. [.4). The results were obtained are a decrease in CO from 4.78 to 2.09 Umin and an
increase in MAP and PVP from 84.8 to [86.74 mmHg and from 15.9 to 22.3 mmHg
respectively. (Figure 16 on page 68)
Unlike the results obtained in the Burkhoff and Tyberg model. PVP is found to be
sensitive ta marked elevations in Ras, particularly when incIuding the pericardial effects.
5.3.3 Impact ofchanging BR
In order to increase HR. Tes was decreased as HR was increased and Eeslv was set (0
half its control value. The results can be secn in figure (17) on page 69. CO increased
from 3.8 ta 5.24 I/roin as HR increased from 50 to 250 beats/min and then plateaued after
ISO beats/min. MAP also increased from 69.192 ta 95.32 mmHg. and then plateaued.
PVP decreased substantially from 20.01 mmHg to 6.5 mmHg.
61
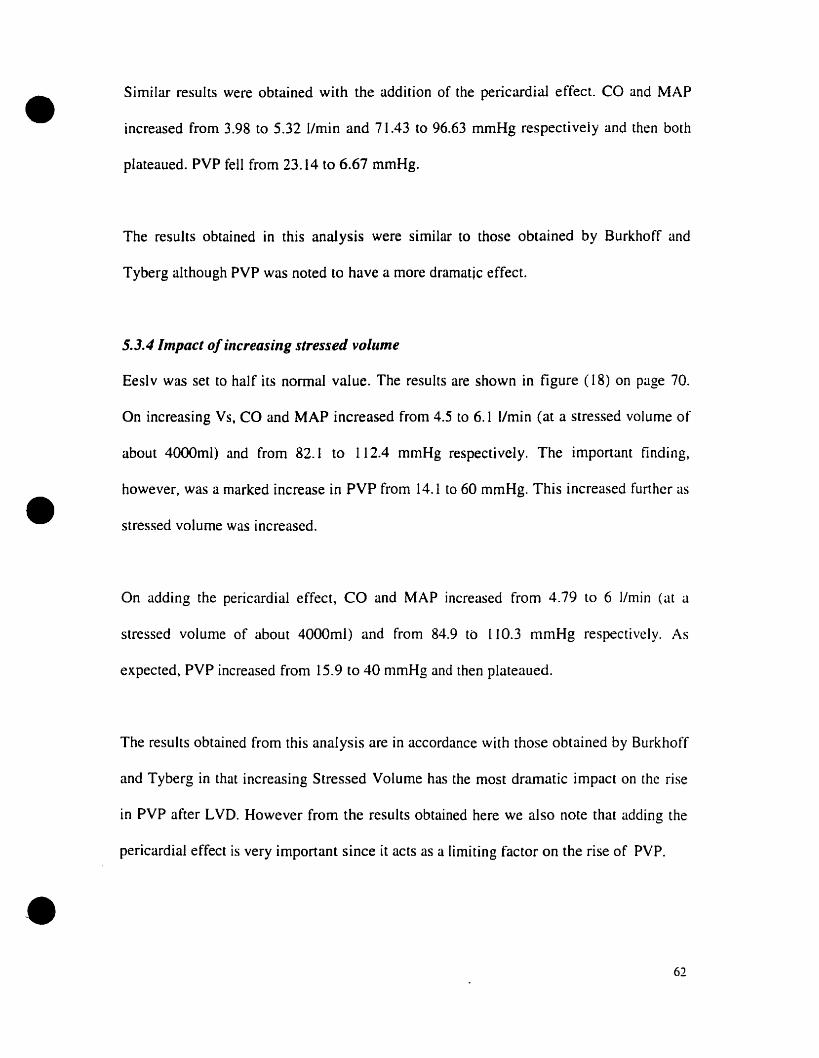
•
•
Similar results were obtained with the addition of the pericardial effect. CO and MAP
increased from 3.98 ta 5.32 I1min and 71.43 ta 96.63 mmHg respectively and then bath
plateaued. PVP fell from 23.14 ta 6.67 mmHg.
The results obtained in this anaJysis were similar ta those obtained by Burkhoff and
Tyberg although PVP was noted to have a more dramatic effect.
5.3.4 Impact ofincreasing stressed voillme
Eeslv was set ta half its normaJ value. The results are shawn in figure (18) on page 70.
On increasing Vs. CO and MAP increased from 4.5 ta 6.1 I/min (at a stressed volume of
about 4000ml) and from 82.1 to 112.4 mmHg respectively. The important finding,
however, was a marked increase in PVP from 14.1 ta 60 mmHg. This increased further as
stressed volume was increased.
On adding the pericardial effect, CO and MAP increased from 4.79 ta 6 IImin (at a
slressed volume of about 4000mI) and from 84.9 tb 110.3 mmHg respectively. As
expected, PVP increased from 15.9 ta 40 mmHg and then plateaued.
The results obtained From this analysis are in accordance with those obtained by Burkhoff
and Tyberg in that increasing Stressed Volume has the most dramatic impact on the rise
in PVP after LVD. However from the results obtained here we also note that adding the
perieardial effect is very important since it aets as a limiting factor on the rise of PVP.
62

•
•
•
5.3.5 Impact ofincreasing SystenJic Venous Resistance
This test consisted of varying Systemic Venous Resistance (Rvs) and observing the
effects on CO, MAP and PVP. Rvs was varied between 0.02 and 0.8 mmHg.s/mI. CO,
PVP and MAP decreased from 5.67 to 0.66 I/min, 28.19 ta 0.98 mmHg and 96.8 ta 25.6
mmHg, respectively.
Keeping Eeslv at half its control, Rvs was varied within the same range but with the
added pericardial effect. Once more CO. PVP and MAP decreased from 5.79 ta 0.67
IImin, 30.46 to 0.98 mmHg and 98.33 to 25.66 mmHg respectively. (Figure (19) on page
71 )
5.4 EfTect of Peripheral resistance on Model
Burkhofftryberg control parameters
Eeslv 3 mmHg/ml Cap 13 ml/mn1HgEesrv 0.7 mmHglml Cas [.32 ml/mmHgRas 0.936 mmHg.s/ml CvP 8 ml/mmHgRap 0.0312 mmHg.s/ml Cvs 70 ml/mmHgRvs 0.0156 mmHg.s/ml Stressed volume 750 mlRvp 0.0156 mmHg.s/mlRes 0.021 mmHg.s/mlRep 0.0312 mmHg.s/ml
63
•
•
CO Pedrv (Pra) MAP PYS PVP
Control (Burkhoffl 5.09 2.58 76.55 3.80 13.07Tyherg)Rvs( xl/2) 5.25 2.85 78.23 3.39 14.13
Rvs(x2) 4.64 1.95 71.22 4.87 10.37
Table (4) Representation of simulation values obtained from Burkhorrrryberg's model
CO PVP MAP pYS· StaticZ PAP Pedrv PedlvPYS
Control(Veerassamy) 5.05 9.64 90.01 8.47 10.48 14.83 /.83 7.0/
Rvs(x1l2) 6.25 17.48 107.58 6.62 9.10 24.03 3.44 14.38
Rvs(x2) 3.49 4.58 66.48 10.07 11.49 8.09 0.81 2.63
Rvs(xl/2) 6.59 17.76 90.01 7.09 9.04 24.68 3.92 14.51baroreceptor renexRvs(x2) 3.22 4.68 90.03 9.36 Il.47 7.92 0.72 2.86baroreceptor renex
Sepsis 5.72 11.02 70.02 8.81 10.22 16.98 0.71 8.11
Rvs(xl/2)sepsis 6.97 17.98 70.00 7.63 8.98 25.33 4.50 14.59
Rvs(x2)sepsis 3.45 4.60 70.01 9.97 Il.49 8.07 0.79 2.66
Table (5) Representation of simulation values obtained from Model.
1. When Rvs was halved, CO increased more significantly in our model l'rom 5.05 to
6.25 compared to 5.09 to 5.25 in the Burkhofl' and Tyberg mode!.
•[ PYS is the ac(ual value calculated under tlow conditions.2 Static PYS is the quotient of the total stressed volume and the compliance of the vasculature (the xintercept of the venous return curve is at zero tlow).
64

•
•
•
2. When Rvs was doubled. CO decreased more substantially l'rom 5.05 to 3.49 lImin in
our modeI compared to 5.09 to 4.64l1min in the Burkhoff and Tyberg mode!.
The next step in this test was to incorporate the baroreceptor reflex. The arterial
baroreceptor reflex system is one of the most powerfuI and rapidly acting mechanisms for
controlling arterial pressure. The rapid resetting of arterial baroreceptor afferents toward
any sustained new level of blood pressure ensures that the retlex. acts as an effective
buffer of the short-term blood pressure fluctuations that accompany daily life. The
primary purpose of the arteriaI baroreflex is to provide rapid and efficient stabilization of
arteriaI blood pressure on a beat-to-beat basis by means of carotid and aortic
baroreceptors. This was done in our model by maintaining the MAP constant at 90
mmHg by adjusting Ras. When Rvs is halved. CO is increased from 5.05 to 6.59 l!min in
the revised mode!. When Rvs is doubled CO is decreased from 5.05 to 3.22 l!min in the
revised model.
The last step in this test was to induce sepsis and see the consequences on Cardiac Output
when peripheral resistance was perturbed. Sepsis (shock) is a progressive, widespread
reduction in tissue perfusion that results from a decrease in effective circulating blood
volume causing a decrease in oxygen delivery and/or exchange in the capillary circuit.
Shock is a cyclic. self-perpetuating problem with numerous causes. aH of which feature
poor perfusion. anaerobic metabolism and release of tissue damaging mediators. During
sepsis. MAP drops due to the decrease in mean systemic filling pressure.
65

•
•
•
Our approach was ta allow MAP ta drop ta 70 mmHg, again by adjusting Ras. Once
again, as expected similar but more drastic effects are obtained. CO increased from 5.05
to 6.97 I!min when Rvs was halved. CO decreased from 5.05 ta 3.45 I!min when Rvs was
doubled.
These results match those determined experimentally by Madger [24].
66
• • •
67

• • •:~~~-~~- r
15
150
20
MAP (mmHgl-1-'-'--'--- ---1200-T _.
Figure (16) Impact of changing Systemic Arterial Resistance with LV end systolic elastance at hait control
BurkhoHrryberg controlT - _- - r~-'" _.. - .. '-r-"'- ~-- .--- -,_. ---.---- .. ---.. r - ...
PVP
CO(Umin) 3"·
2 100
Veerassamy control- -r .. ---- ----.-- r
__ cl __
1
5
4 .-
CO(Umin) 3'"
-_ ... !-
1.5
PVP
MAP
co
1
2
1-
1
2.5
Î
~
1 __
3l
3.5L.
4
1-
L _
4.5
- -1
.1
5
T ..-
PVP (mmHg)10
5.5
MA? (mrnHg)"-200
20150
2 .- MAP15
100
_.. 1.__ . __
1
li4[
f
CO(Umin) 3'-
L
1.5
_. ,CO:.
.... _L.
2
--r1
MAP
1 _ L ___ ... 1. l .__..___ _ 1 .._ 1._.2.5 3 3.5 4 4.5 5
Veerassamy (Pericardial effect)
l' --r -- - ... --- . '1'-"- .- ....- ... 1 l' - .. - r
PVP (mmHg)10
5.5
MAP (mmHg)200
20
150
2
i1 l J.
1 1.5
PVP
1
21
2.5j
3.1
3.5l
4 4.5j
5
10015
PVP (mmHg)
10
5.5
Systemic Arterial Resistance (mmHg.s/ml)
6H
• • •6·- -----
5PVP
CO(Umin)
1--50
15
-.60 10
80
60 10
_.80 15
MAP (mmHg)100
20
PVP (mmHg)--._--- .---. 40 5
250
MAP (mrnHg)--.._--------- -~ -- 10020
-1 "
L.
200L
150
Veerassamy model- . -- 1- ~-- ----
ço.·--
co
["
MAP
Figure (17) Impact of changing Heart Rate with LV end-systolic elastance at half its control
BurkhofflTyberg model--- - . ---1--.- --- .--.------------- _._-_.---- ]"--
.L
100
MAP
.-"
PVP6F_:-
1 -',
5, .CO(Umin) ,-
41;:._.-:
31..-- 50
6
r
-- _.......5 - .
CO ,"(Umin)
T3'-50
MAP
PVP
j -
100
co
100
L.__._0 __._. _
150
Veerassamy (Pericardial affect)-r--
j
150Heart Rate (beats/min)
L
200
200
j PVP (mmHg)40 5
250
MAP (mrnHg)
110020
80 15
GO 1011
!PVP (mmHg)1
. J40 5250
6lJ

• • •Figure (l8) Impact of Stressed Volume with LV end-systolic elastance at hait ilS control
BurkhofffTyberg model MAP (mmHg)T -1 ._-
1 - T- r-- _. --. _.. - T- l - ~--115O. 100
CO 6
(Umin)4l co - .- =j 100Ba
-'- GO
4021- /' -' MAP
PVP J so
aL -- -_ ...-.
J 20L _ ...1. ! 1 1 1 ! . PVP (mmHg)
500 1000 1500 2000 2500 3000 3500 4000
Veerassamy control MAP (mmHg)- r l 1 1 - 1 r r-
T50
10061- Ba
100
co l co _.... - . --1 60
(Umin) : __ MAP 4050
.. 20PVp__l. -:.. L- 1 1. J l. 1 PVP (mmHg)
500 1000 1500 2000 2500 3000 3500 4000
Veerassamy (Pericardial Effects) -1 ~~p (mmHglr - 1 1 T T 1 1100
61--Ba
co 100 604 CO 1(Umin)
J 40MAP2 1
PVP ro 20
a ____1j 1 j J J J PVP (mmHg)
500 1000 1500 2000 2500 3000 3500 4000
Stressed Volume (ml)
70
• • •
10
60
MAP (mmHg)30
100
80 20
BO 20
40PVP (mmHg)
'1". .: __..:_.:c..:"--'----..J 20 00.7 O.B
MAP (mmHg)1 -...'- --.. " - --1 30
100
-- - -- 1 -- _..... - --1
-1
____ r0.6
. r
~-j -~---
0.5
T'_=_ .0.4
Veerassamy control
r -
1
0.3l.
0.2
-1
Figure (19) Impact of changing Systemic Venous Resistance with LV end systolic elastance at hait its control
BurkhofffTyberg control--1-------... -.·----. 1------
0_ ... -.- •• - - - - r
_......1-.o l __ - - - 0.1
6 f~'-'---- ---:--\ .... ,
j .... \ . -""'-'4 f- \ """
\
:t- -- --- -r--
CO ~~-- ........(Umin)~. ....- -. -
2~- "-',_
'...
, "'...... \ ', ....
\ "
CO 4r '\~(Umin)
2
____ J ... _-~.. __. .
0.5 0.6
Veerassamy (Pericardial effect)- --1' - ~-'----1' ...0-
10
40PVP (mmHg)
.:::~j 20 00.8
J
I GO 10
40-- _ PVP (mmHg)
-- 20 00.8
MAP (mmHg)
30
100
BD 20
GO
1"
1
0.7
__ __ 1
0.7
r
.1
0.6
_____ 1
0.5
1.
0.4
.J . . __
0.4 .
-1
J
0.3
_J
0.3
J.
0.2
L~
0.2
--1-1 -
0.1
_1 _
___ J_
0.1
"
\\
o
61\"-"",
o
CO(Umin)
2 .-
Systemic Venous Resistance (mmHg.s/ml)
71

•
•
•
5.5 DISCUSSION
The results obtained from this analysis clearly suggest that significant rises of PVP do
occur as a consequence of acute LVD. On decreasing LV strength (decreasing Eeslv),
MAP (blood pressure) and cardiac output were decreased and PVP was increased
whereas in the Burkhoff and Tyberg model there was only minimal increase in PVP.
Increases in systemic arterial resistance caused a rise in blood pressure, a decrease in
cardiac output and a rise in PVP. Increasing heart rare had a role in restoring cardiac
output, but caused a significant decrease in PVP. An increase in stressed volume caused
an increase in CO which eventually plateaued, a rise in blood pressure and a rise in PVP.
The results obtained are unlike those From Burkhoff and Tyberg who concluded that
stressed vascular volume is the only quantity capable of elevating PVP substantially. This
analysis shows clearly that although stressed volume produces a fise in PVP so does
decreasing LV strength and increasing systemic arterial resistance.
Adding the pericardial effect caused CO to plateau earlier and a smaller rise in MAP. A
smaller but still notable rise in PVP also occurred. The pericardial effect thus attenuated
the effects of increasing stressed volume. This leads to the conclusion that the
pericardium acts as a limiting factor in the rise of PVP aner the onset of acute LVD.
Our model's behaviour was generally consistent with both clinical and experimental
observations [12. 13. 14, and 24]. The results obtained in this analysis are in agreement
72
•
•
with the commonly held notion that LV function leads to a primary increase ln
ventricular end-diastolic pressure that is transmitted backward to the pulmonary venous
system (unlike that faced by Burkhoff and Tyberg). In addition, they are consistent with
the notion that impaired LV function leads to a primary increase in PVP due to blood
shifting to the pulmonary From the systemic system.
The validity of our choice of parameters and their ratios in the revised model is
reinforced by the results of changing systemic venous resistance. Compared to the results
obtained with the original model of Burkhoff and Tyberg, we obtained a bigger rise in
cardiac output. On addition of the baroreceptor reflex (reflecting more appropriately the
human system), an even larger rise in cardiac output was obtained and this was further
elevated in the case of sepsis. [n addition, these results are consistent with those obtained
in humans.
In order to ascertain the validity of our model in this project, a comparison of our resulls
was made with previous work done in this area. A current understanding of the dynamics
of the closed-Ioop circulatory system is mainly based on the theoretical and experimenlal
work of Guyton and his colleagues. Their studies explained why the venous pressure
volume curve shifts downward and to the left during acute heart failure. This is attributed
ta the shifting of blood from the systemic to the pulmonary systems due to the transienl
mismatch of stroke volumes between the right and left ventricles. The underlying
mechanism in our model regarding the accumulation of blood in the pulmonary
circulation is similar to that of Guyton but different from that of Burkhoff and Tyberg.
• The conclusion derived from the present projcct, which matches Guyton et aL, is that the
73

•
•
•
transient stroke volume mismatch is a direct consequence of the sudden decrease in LV
contractile strength. Burkhoff and Tyberg's conclusion, however, is that accumulation of
blood in the pulmonary circuit is primarily due to redistribution of blood from the
unstressed ta the stressed pool. From our results we can thus conclude that whereas
incre,lsed stressed volume after the onset of LVD is definitely a key factor in raising
PVP, il is nOl the only one. The other factors indude changes in left ventricular end
systolic elastance, systemic arterial resistance and heart rate.
Ta further reinforce our model, the sensitivity analysis given in section 5.2 shows that a
crucial factor is the right choice of parameter values and their ratios. This sensitivity
analysis clearly shows the differences between the Burkhoff and Tyberg model and the
one described in this thesis. Our most significant observation here is the percent change
in cardiac output when Rvs is perturbed. In the normal human, a change in Rvs is
expected to cause a change in pumping effectiveness and hence cardiac output. This
change is hardly noticeable in the Burkhoff and Tyberg mode!. Furthermore, as predicted,
on addition of the baroreceptor reflex and sepsis, bigger increases in cardiac output were
observed in our mode!. Indeed, such effects can be inferred by inspection of the model.
(Eq.4.1-4.10)
74
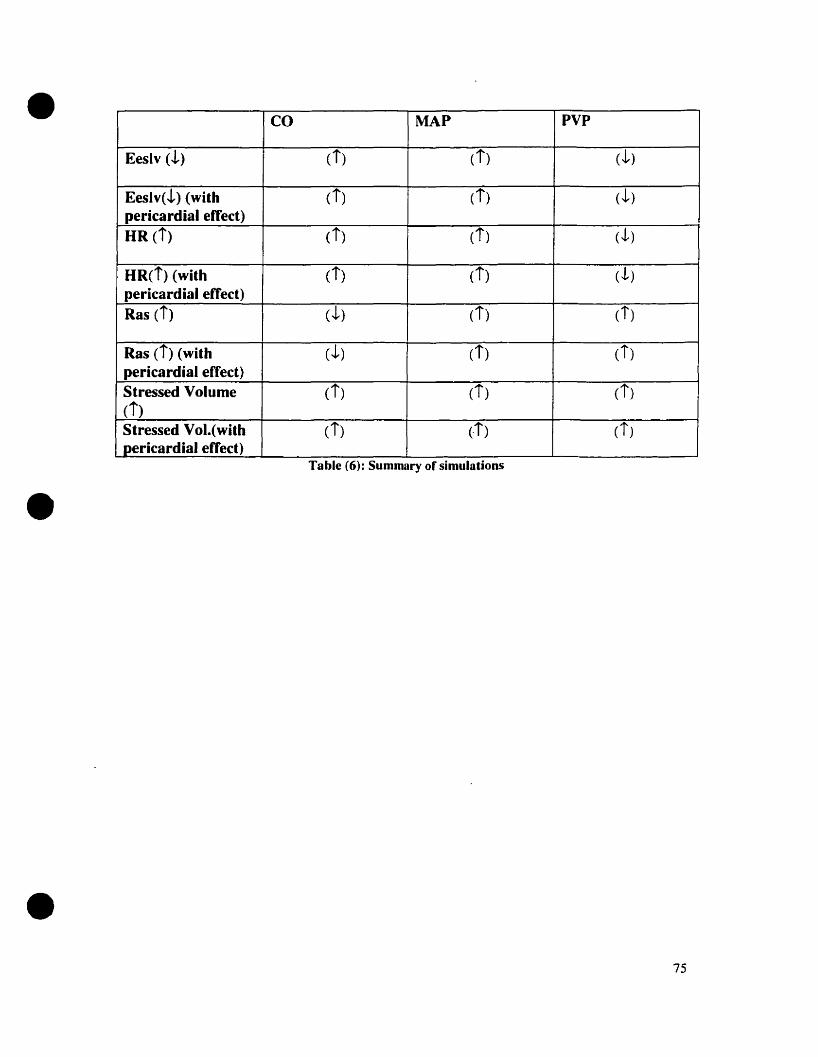
•
•
•
CO MAP PVP
Eeslv (!) (i) (i) (J, )
Eeslv(!) (with (i) (t) (J,)pericardial effect)HR (i) (i) (t) (J, )
HR(i) (with ci) (t) (J, )pericardial effect)Ras (i) CJ,) (i) (i)
Ras (i) (with (J,) (i) (i)pericardial effect)Stressed Volume Ci) (t) (i)(i)Stressed Vol.(with (i) (-i) Ci)pericardial effect)
Table (6): Summary of simulations
75

•
•
•
CHAPTER6
76
•
•
•
CONCLUSIONS AND SUGGESTIONS FOR FUTURE RESEARCH
6.1 Limitations of the model
The model described in this project deals with the circulatory system at the macroscopic
level. The added compartments are lumped. and not ail neurohumoral control
mechanisms are taken into account. Care is taken in choosing the parameters and those
were based on experimental values obtained by Magder [24J. Despite the relative
simplicity, this model of the cardiovascular system behaves in a manner consistent with
clinical and experimental observations in almost every way.
This model does not inc1ude the atria. Atrial contraction enhances ventricular filling so
that ventricular end-diastolic pressure may be greater than PVP at high heart rates. But,
relatively substantial increases in left ventricular filling pressure is ineffective at raising
ventricular diastolic volume, due to the impact of the pericardial constraints. ft is
therefore predicted that the impact of the atria on amplifying cardiac output or lessening
the degree of pulmonary congestion would be minimal. [7]
We assume that blood volume remains constant after venoconstriction. However tluid
can shift to the extravascular from the intravascular space when venous pressure rises. Il
has been argued though that the degree to which this· effect can alter blood volume is
smal!. [7]
77
•
•
6.2 Applications and suggestions for future research
( 1) This model is relatively easy to understand and use. One of its applications could
therefore be as an educational tool for Medical Students studying hemodynamics.
(2) Clinical scenarios other than LVD could be investigated, such as sepsis and heart
failure.
(3) A parallel venous compartment could be added to represent the splanchnic system.
The aim would be ta investigare the impact of changes of peripheral arterial
resistance and splanchnic arterial resistance on CO.
6.3 Summary and Conclusions
This thesis describes a modified version of the cardiovascular model of Burkhoff and
Tyberg [7]. The key modifications include changes in the values of resistance and
compliance. Stressed vascular volume and elastance parameters were also adjusted sa as
ta have the model be representative of the human syst~m. The simulations performed by
Burkhoff and Tyberg were repeated and the effects of the pericardium were also
investigated, along with the effects of changes in the systemic venous resistance. A
sensitivity analysis was performed on each parameter by perturbing independently of the
other parameters and then observing its effects on the system.
The results obtained show that PVP is increased after the onset of LVD as a consequence
not only of changes in stressed volume but also changes in contractile strength, systemic
arterial resistance and heart rate. Whereas increasing stressed volume raised PVP from
• 14.1 to 60 mmHg, contractile strength raised PVP from 9.64 ta 23.8 mmHg and systemic
78
•
•
•
arterial resistance increased PVP from 14.07 to 20.74 mmHg. (Figures 18, 15, 16
respectively). lt was shown that the pericardium acts a limiting factor in the rise of PVP
aftef LVD. With the addition of the pericardial effects, as stressed volume was being
increased, PVP increased from 15.9 (040 mmHg and then plateaued (Figure (18).
This sensitivity analysis contirmed that the choice of the parameter values and their ratios
used in our model are more appropriate than those used by Burkhoff and Tyberg. Our
model was also found to be consistent with both c1inical and experimental observations
made by Dr. S. Magder [24].
79

•
•
•
APPENDICES
80

•
•
•
APPENDIX 1: DICTIONARY LISTINGS (definitions)
Terms (Alphabetical order) Definition
Arteries Vessels that carry blood from the left to theright ventric1es to the lÏssues.
Blood Suspension of cells in tluid plasma. Itscomponents are erythrocytes (RBes),leukocytes (white cells) and platelets(thrombocytes). The average number IS
approximately 5* 106, 10': and 3*10 5 for
each per mm cube, respectively.
Capillary Finest bfood vessels, about 5-6 um indiameter and 0.5 mm In length ln thesystemic circulation
Cardiac Output CO (l/min)= Stroke Volume x Heart rate
Compliance A measure of the ability of a hollowstructure to change its volume. p=V/C(ml/mmHg)
Diastole (Atrial or Ventricular) Resting phase of cardiac cycle
Ejection Fraction EF=Stroke Volume/ End-diastolic LV volume
Elastance reciprocal of compliance (mmHg/ml)
Heart Mammalian heart IS made up of 4chambers namely the right and left atriaand the right and left ventricles. Theauricles are thin walled chambers intowhich blood nows l'rom the veins at lowpressure. Between the auricles andventricles are valves namely the tricuspid(right) and mitral (left). Blood tlows out ofthe ventricles past the valves into thepulmonary artery (right) and aorta (left).Both auricles beat simultaneously shortlybefore the synchronous beat of theventricles.
Inertia Represented by the property of density andIS the force needed to accelerate tluid
81

•
•
•
particles. provided by a pressure gradient.
Laminar Oow Refers to the tluid velocity, which remainsconstant on cylindrical surfaces within thefluid, which are concentric with the axis.The flow is ordered. stable and can beconsidered as individual cylindricallaminae of fluid sliding over each other.
Mean Arterial Pressure{MAP) MAP =Pd +[ 1I3*(Ps-Pd)] where Pd isdiastolic arterial pressure and Ps is Systolicarterial pressure
Mean Circulatory Filling Pressure Pressure measured at aIl pt. ln thecirculatory system if the heart were stoppedsuddenly. In this model, it is approximatedas mean systemic pressure, Pms or Pys.
Peripheral resistance Ratio of the mean pressure drop across acirculatory bed to the mean flow through il.(mmHg.s/ml)
Pressure Measure of force per unit area exerted by atluid (mmHg)
Pressure gradient pressure drop per unit length along a tlowchannel
Stressed blood volume Blood doven through the vasculature. Inthis project only stressed volume is present.(ml)
Stroke Volume Amount of blood pumped out per beut(ml).Stroke Vol. = Volume - End -systolic LVVolume
Systemic circulation Circulation to body excluding thepulmonary circulation
Systole (Atrial or Ventricular) Active part of cardiac cycle
Turbulence Characterized by random fluctuations ofthe fluid motions, which cannat bepredicted ln detail. The tlow IS usuallyunstable.
Unstressed blood volume also known as dead volume that can beplaced in a capacitive vesse! without
82

•
•
•
raising its pressure above OmmHg
Veins Vessels carrying blood from the tissues tathe atria of the heart.
Viscoelasticity Material in which both the strain and rateof strain are functions of the impasedstress.
Viscosity Property af resisting deformatian in a tluid.(Poise)
Windkessel Term used by Otto Frank (1899) tadescribe the elastic reservoir function of theaorta. The systemic bed was modeled as anelastic reservoir connected ta a peripheraIhydraulic resistance in the simplewindkessel theory.
83
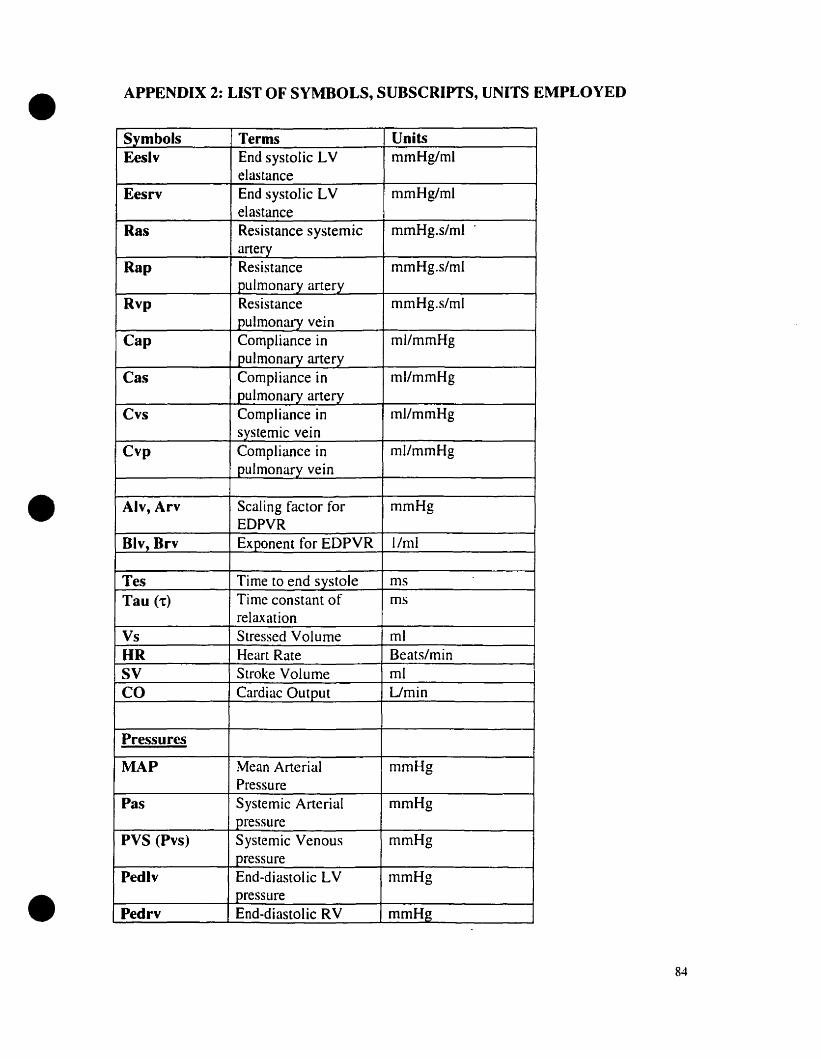
•
•
•
APPENDIX 2: LIST OF SYMBOLS, SUDSCRIPTS, UNITS EMPLOYED
Symbols Terms UoitsEeslv End systolic LV mmHg/ml
elastanceEesrv End systolic LV mmHg/ml
elastanceRas Resistance systemic mmHg.s/ml
arteryRap Resistance mmHg.s/ml
pulmonary arteryRvp Resistance mmHg.s/ml
pulmonary veinCap Compliance in ml/mmHg
pulmonary arteryCas Compliance in ml/mmHg
pulmonary arteryCvs Compliance in ml/mmHg
systemic veinCvp Compliance in ml/mmHg
pulmonary vein
Alv, Arv Scaling factor for mmHgEDPVR
Div, Brv Exponent for EDPYR l/ml
Tes Time to end systole msTau (1:) Time constant of ms
relaxationVs Stressed Volume mlUR Heart Rate Beats/minSV Stroke Volume mlCO Cardiac Output Umin
Pressures
MAP Mean Arterial mmHgPressure
Pas Systemic Arterial mmHgpressure
PVS (Pvs) Systemic Venous mmHgpressure
Pedlv End-diastolic LV mmHgpressure
Pedrv End·diastolic RV mmHg
84

•
•
•
pressurePlv Left ventricular mmHg
pressurePrv Right ventricular mmHg
pressurePVP (Pvp) Pulmonary venous mmHg
pressurePap Pulmonary arterial mmHg
pressure
VolumesVlv LV volume mlVry RV volume mlVap Pul. Arterial vol. mlVas Systemic Arterial vol. mlVvs Systemic venous vol. mlVvp Pul. venous vol. ml
FlowsdVlv Left ventricular tlow --dVrv Right ventricular --
fIowdVas Systemic Arterial --
flowdVap Pulmonary arterial --
flowdVvp Pulmonary venous --
fIowdVvs Systemic venous flow --
a· Elastancec ComplianceF Flowg Gravitational
acceleration1 LengthL Inertancefi Number of g
accelerationP pressureR resistancet timete Time elapsedT periodV Volume
85
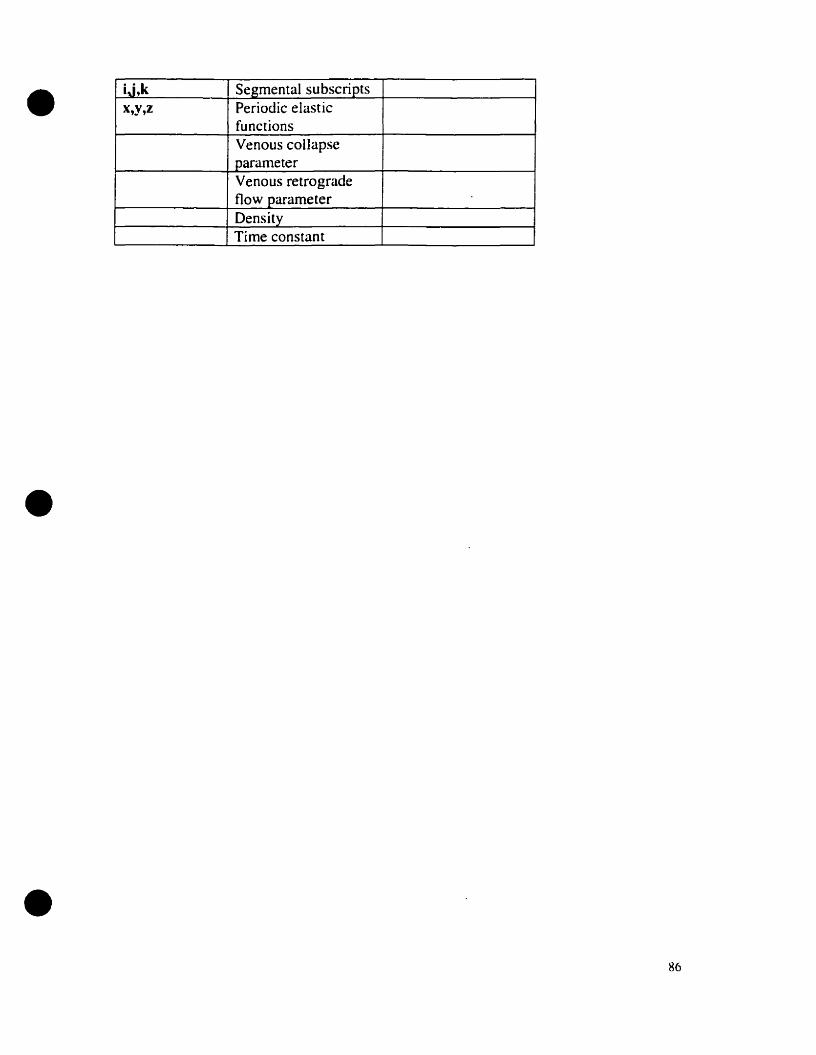
•
•
•
ij,k Segmental subscriptsX,Y,Z Periodic elastic
functionsVenous collapseparameterVenous retrogradeflow parameterDensityTime constant
86
•
•
•
REFERENCES:
[1] Atkins G.L, "Multi-compartmental Madels in Biological Systems", London: Methuen.
1969.
[2] Berne, R .M., Levy, H.N, "Cardiovascular Physiology", St. Louis: Mosby, [997.
[3] Bergel D.H, "Cardiovascular Fluid Dynamics", London, New York, Academie Press.
1972.
[4) Beneken J.E.W and De Wit B, .. A Physical approach te hemodynamic aspects of the
human cardiovaseular system", 1967.
[5] Luetscher J. A, Boyers D. G, Cuthbertson J.G. McMahon D.F, '4A model of the
human circulation. Regulation by autonomie nervous system and renin-angiotensin
system, and influence of blood volume on cardiac output and bload pressure." Circulation
Research. 32:Suppl 1:84-98, 1973.
[6] Bronzino, 44 The Biomedical Engineering Handbook", IEEE Press, 2386-2400, 1997.
[7] Burkhoff D, Tyberg J, "Why does pulmonary venaus pressure rise after anset of LV
dysfunction: a theoretical analysis" Am. J. Physial. 265 H1819-H 1828, 1993
[8] Constantinescu V.N, "Laminar Viscous Flow", New York: Springer, 1995.
(9] Dick, D., E. and Kendrick, J. E., Matson, G. L., RideOut, V. C., "Measurement of
non-linearity in the arterial system of the dog by a new method", Circ. Res. 22, 101-111,
1968
[10] Erwin, F., Idelchik, LE," Flow resistance -A Design Guide for Engineers",
NewYork: Hemisphere Pub. Co, 1989.
[Il] Fardipour P, 44Computer modeling of the cardiovascular system based on relational
analysis" Ph.D. Thesis from City University, 1989.
87

•
•
•
[12] Fitz-Gerald J.M, " The Mechanics of Capillary Blood Flow" In "Cardiovascular
Fluid Dynamics", New York. Academie Press. 1972.
[13] Green J. F, "Fundamental cardiovascular and pulmonary physiology". Philadelphia:
Lea & Febiger, 1987.
[ 14] Guyton. A. C•., Determination of cardiac output by equating venous return curves
with cardiac response curves" Physiol. Rev.. 35, 123-129, 1955
[15] Guyton A.C. ,. Circulation Physiology: Cardiac Output and Its Regulation",
Philadelphia, Saunders, 1973.
[16] Grodins. F., S., "Interactive cardiovascular physiology: a mathematical synthesis of
cardiac and blood vessel hemodynamics", Quart. Rev. Biol., 34. 93-116. 1959
[17] Harreveld, A. Van, Feigen. G. A., Lerman, L. S., 'Hemodynamics of aortic
occlusion", Am. J. Physiology., 157, 168-176.1949.
[18] Helier L., Mohrman D.E. "Cardiovascular Physiology"', New York: McGraw-Hill.
1981.
[19] Hwang N.H.C., Normann N.A." Cardiovascular Flow Dynamics", Baltimore:
University Park Press 1977.
[20] Karakawa M~ Igarashi K, ., A Mathematical Approach to Cardiovascular Disease",
Tokyo: Kokuseido Pub. Co., 1998.
[21] Leaning M. S., Pullen H.E; Carson E.R; Finkelstein L, "Modeling a complex
biological system: the human cardiovascular system-l Methodology and model
description", 1983.
[22] Little R, C, .. Physiology of the Heart & Circulation", Chicago: Year Book Medical
Publishers, 1985.
88

•
•
•
[23] MeDonald D.A. "Blood flow in arteries", London: Edward Arnold. 1974.
[24JMagder S, HVenous mechanics of contraeting gastrocnemius muscle and the muscle
pump theory. 1.Appt. Physiol. 79: 930-1935, 1995.
[25] Naamani, R. S.N.A Hussain. S. Madger, "The mechanical effects of contractions on
muscle blood flow. Eur 1. Appl. Physioi. 71: 102-112, 1995.
[26] Middleman," Transport Phenomena in the cardiovascular system", N.Y.: Wiley
Interscienee, 1972.
[27] Milnor W.R, Il Pulmonary Hemodynamies" in "Cardiovascular Fluid Dynamics",
London, New York, Academie Press. 1972.
[28] Noordergraaf, A., Verdouw, P. D., and Boom, H.B. K, "The use of an analog
computer in a circulation mode}", Progress in Cardiovascular Diseases, 5. 419-439, 1963.
[29] Noordergraaf A. HCirculatory System Dynamics", Cambridge, Mass.: MIT Press.
1978.
[30] 0ldenburger, MacMillan, "Mathematical Engineering Analysis", 1950.
[31] Piene H, Smiseth O.A, Refsum H, Tyberg 1. V, .. Apparent dcpression of right
ventricular function after selective reduction of left ventricular inotropy: an interpretation
of experimental data utilizing a computer- based circulatory mode!", Med & Biol. Eng &
Comput 1983, 21, 548-556
[32J Pullen, H. E., .. Studies 10 the Modeling and simulation of the Human
Cardiovascular System with application ta the effeets of drugs, Ph.D. Thesis, City
University, London, 1983.
[33] Rushmer R.F, H Cardiovascular Dynamics", Philadelphia: Saunders. 1976.
[34] Sagawa H. "Sorne computer models in Cardiovascular research" In "Cardiovascular
Fluid Dynamics". London, New York, Academie Press. 1972.
89

•
•
•
[35] Sagawa K, "The ventricular pressure-volume diagram revisited", Circulation
Research 43(5) Nov 1978 pp. 677-687
[36] Sandquist G M, Olsen D B, Kolff WJ, A comprehensive elementary model of the
mammalian circulatory system''. Annals of Biomed. Eng. IO( 1): 1-33, 1982
[37] Skalak R, "Synthesis of a Complete Circulation" [n "Cardiovascular Fluid
Dynamics", London, New York, Academie Press. 1972.
[38] Shepherd, J.T, Vanhoune, P. M, .. The Human Cardiovascular System, facts and
concepts", Raven Press, 1979.
[39] Smith J.1, Kampine J.P., .. Circularory Physiology-the essenrials", Williams and
Wilkins'- 1990
[40] Taylor, C; Johnson, J.A; Smith, W.R, "Numerical Methods in Laminar and
Turbulent Flow", Swansea: Pineridge Press, 1983.
90