influence of processing on the flavour of australian coffee
TRANSCRIPT

Influence of processing on the flavour of Australian Coffee
A report for the Rural Industries Research and Development Corporation by Dr James Drinnan April 2007 RIRDC Publication No 07/065 RIRDC Project No DAQ 309A

ii
© 2007 Rural Industries Research and Development Corporation. All rights reserved. ISBN 1 74151 462 2 ISSN 1440-6845 The Influence of processing on the flavour of Australian Coffee Publication No. 07/065 Project No. DAQ-309A The information contained in this publication is intended for general use to assist public knowledge and discussion and to help improve the development of sustainable regions. You must not rely on any information contained in this publication without taking specialist advice relevant to your particular circumstances.
While reasonable care has been taken in preparing this publication to ensure that information is true and correct, the Commonwealth of Australia gives no assurance as to the accuracy of any information in this publication.
The Commonwealth of Australia, the Rural Industries Research and Development Corporation (RIRDC), the authors or contributors expressly disclaim, to the maximum extent permitted by law, all responsibility and liability to any person, arising directly or indirectly from any act or omission, or for any consequences of any such act or omission, made in reliance on the contents of this publication, whether or not caused by any negligence on the part of the Commonwealth of Australia, RIRDC, the authors or contributors.
The Commonwealth of Australia does not necessarily endorse the views in this publication.
This publication is copyright. Apart from any use as permitted under the Copyright Act 1968, all other rights are reserved. However, wide dissemination is encouraged. Requests and inquiries concerning reproduction and rights should be addressed to the RIRDC Publications Manager on phone 02 6272 3186.
Researcher Contact Details James Drinnan PO Box 1054, Mareeba 4880 Queensland Department of Primary Industries & Fisheries Phone: 0740484 600 Fax: 0740923 593 Email: [email protected]
In submitting this report, the researcher has agreed to RIRDC publishing this material in its edited form. RIRDC Contact Details Rural Industries Research and Development Corporation Level 2, 15 National Circuit BARTON ACT 2600 PO Box 4776 KINGSTON ACT 2604 Phone: 02 6272 4819 Fax: 02 6272 5877 Email: [email protected]. Web: http://www.rirdc.gov.au Published in April 2007 Printed on environmentally friendly paper by Canprint

iii
Foreword In the 1980s interest in re-establishing an Australian Coffee industry was re-kindled following the development of a machine harvester. Today the industry is quite small compared to world standards but is expanding; there are 700 ha of plantations producing 600 tonnes of high quality coffee. For the industry to expand and remain competitive on the international scene a very high quality must be achieved. This project developed in conjunction with Australian Coffee growers aims to determine the influence of processing on coffee quality. After climatic conditions and the variety, the way in which coffee is processed is the single biggest determinant of quality. An audit of current processing equipment and techniques used by the industry to process coffee was conducted and some alternative processes developed. Coffee samples were then collected from growers and processed in several different ways and evaluated for green bean appearance and liquor quality. The results indicated that the method of processing has a large impact on both the appearance and liquoring quality of the coffee. The green bean colour was best where the mucilage had been removed by fermentation in water and poorest where the fruit dried around the beans. The liquor quality evaluations indicated that coffee pulped but not fermented (i.e. the mucilage is left on the parchment and dried) produced the best quality coffee. Coffee that was dried down in the fruit without pulping produced the poorest quality coffee. In light of this project Australian Coffee growers are likely to consider modifying the way in which they process their coffee to improve its liquoring quality. This project was jointly funded by RIRDC, QDPI&F and the Australian Coffee Growers. This report, an addition to RIRDC’s diverse range of over 1600 research publications, forms part of the New Plant Products R&D program, which aims to facilitate the development of new industries based on plants or plant products that have commercial potential for Australia. Most of our publications are available for viewing, downloading or purchasing on-line through our website: Downloads at www.rirdc.gov.au/fullreports/index.html Purchases at www.rirdc.gov.au/eshop Peter O’Brien Managing Director Rural Industries Research and Development Corporation

iv
Acknowledgements The researcher would like to acknowledge the Australian Coffee Growers for their co-operation and contribution to this project particularly Nick Karen, Ian McLaughlin, John Zentveld, Andrew Ford and Peter Inderbitsen and their farm staff who provided the coffee samples and re-configured their processing plants so that the various samples could be collected during the project. The researcher also gratefully acknowledges the coffee tasters who evaluated the liquoring quality of all the samples collected. These were Insturata, Sunalini, the NSW Coffee growers tasting panel and the North Queensland Coffee Growers Organisation.

v
Contents
Foreword................................................................................................................................ iii Acknowledgements............................................................................................................. iv Contents.................................................................................................................................. v List of Tables ........................................................................................................................ vi List of Figures ..................................................................................................................... vii Executive Summary .......................................................................................................... viii Introduction............................................................................................................................ 1 Literature Review.................................................................................................................. 5
VARIETY ...............................................................................................................................................5 CLIMATE...............................................................................................................................................5 MARKETS .............................................................................................................................................6 CONCLUSION .......................................................................................................................................7
Objectives............................................................................................................................... 8 Methodology .......................................................................................................................... 8 Audit....................................................................................................................................... 11
PROCESSING SYSTEMS .....................................................................................................................11 Harvesting ...................................................................................................................................11 Collection .....................................................................................................................................11 Receival Tank, Sorter, Floater..................................................................................................12 Pulping .........................................................................................................................................12 Demucilage/Fermentation .........................................................................................................12 Drying ...........................................................................................................................................13
GROWERS OBSERVATIONS ...............................................................................................................17 Liquor Quality ...................................................................................................................... 18
GREEN BEAN OBSERVATIONS...........................................................................................................18 ROASTED BEAN OBSERVATIONS.......................................................................................................19 LIQUORING QUALITY..........................................................................................................................19
Acidity and Body.........................................................................................................................26 CONCLUSION .....................................................................................................................................27
Implications.......................................................................................................................... 28 Recommendations ............................................................................................................. 29 Publications ......................................................................................................................... 29 References ........................................................................................................................... 32

vi
List of Tables
Table 1. The seven processing methods assessed..................................................................... 9 Table 2: Green bean observations of samples processed in different ways............................ 18 Table 3: The effect of process method on the liquor quality for the 2004 samples collected
from growers N, MT and L as assessed by the North Queensland Coffee growers. Samples have been ordered from best to worst based on liquor quality......................... 20
Table 4: The effect of process method on the liquor quality for the 2004 samples collected from growers IM, N, MT and Z as assessed by Insturata. Samples have been ordered from best to worst based on liquor quality. .................................................................... 20
Table 5a: The effect of process method on the liquor quality for the 2004 samples collected from growers IM, N, MT and Z as assessed by Sunalini. Samples have been ordered from best to worst based on liquor quality. The acidity, body and liquor quality rating is shown in Table 5b........................................................................................................... 21
Table 5b: The effect of process method on the acidity, body and overall liquor quality rating for the 2004 samples collected from the growers IM, N, MT and L as assessed by Sunalini. .......................................................................................................................... 21
Table 6: Tasters comments from the cupping evaluations from the 2004 samples. ............... 22 Table 7: The effect of process method on the liquor quality for the 2005 samples collected
from growers IM, N, MT and Z as assessed by Insturata. Samples have been ordered from best to worst based on liquor quality. .................................................................... 24
Table 8a: The effect of process method on the liquor quality for the 2005 samples collected from growers IM, N, MT and Z as assessed by the NSW coffee growers tasting panel. Samples have been ordered from best to worst based on liquor quality. The acidity, body, aroma and flavour are shown in Table 8b............................................................. 24
Table 8b: The effect of process method on the acidity, body, aroma and flavour for the 2005 samples collected from the growers IM, N, MT and Z as assessed by the NSW coffee growers tasting panel. ..................................................................................................... 24
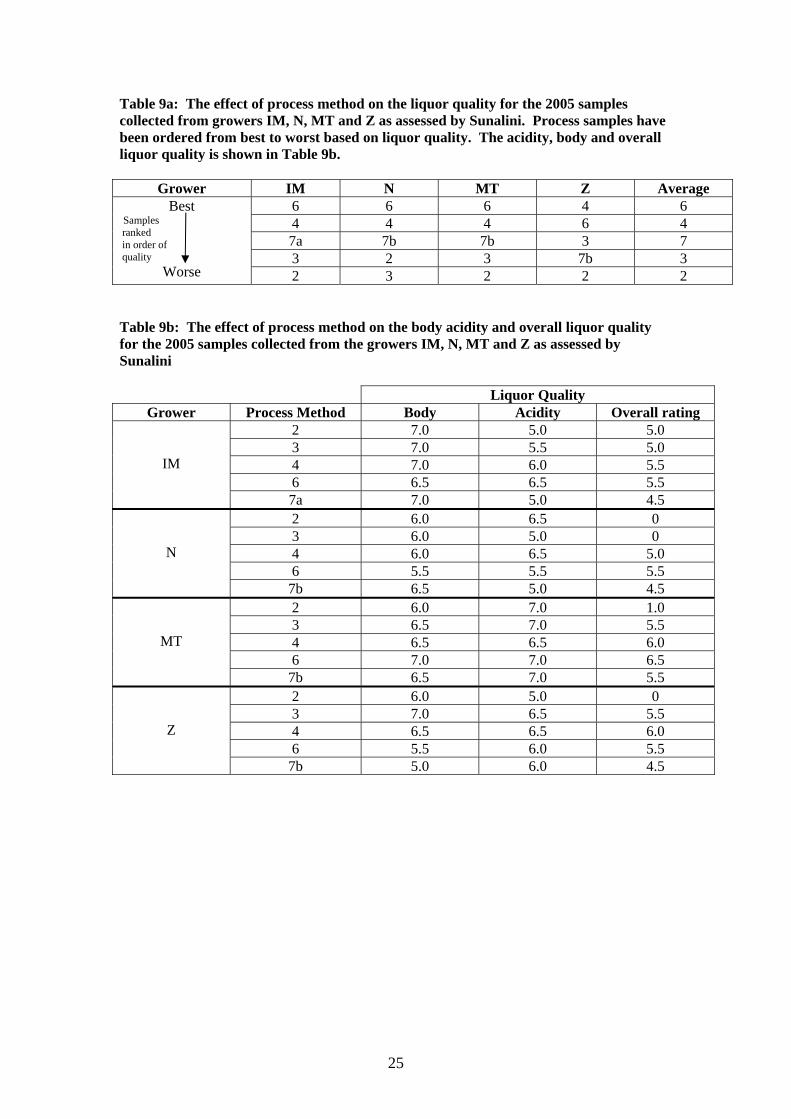
Table 9a: The effect of process method on the liquor quality for the 2005 samples collected from growers IM, N, MT and Z as assessed by Sunalini. Process samples have been ordered from best to worst based on liquor quality. The acidity, body and overall liquor quality is shown in Table 9b. .......................................................................................... 25
Table 9b: The effect of process method on the body acidity and overall liquor quality for the 2005 samples collected from the growers IM, N, MT and Z as assessed by Sunalini.... 25
Table 10: Tasters comments from the cupping evaluations from the 2005 samples. ............. 26 Table 11: Acidity and Body levels for the 2004 samples processed according to method 3, 7
and 6. .............................................................................................................................. 27 Table 12: Acidity and body levels for the 2005 samples processed according to method 3, 7
and 6. .............................................................................................................................. 27

vii
List of Figures
Figure 1: Production Areas for Coffee in Australia ................................................................. 2 Figure 2: Steps Used in Dry Processing Coffee ....................................................................... 3 Figure 3: Steps Used in Wet Processing Coffee....................................................................... 4 Figure 4: Australasian Speciality Coffee Association scoring sheet ...................................... 10 Figure 5: Coffee processing flow diagram ............................................................................. 13 Figure 6: Coffee processing flow diagram ............................................................................. 14 Figure 7: Coffee processing flow diagram ............................................................................. 14 Figure 8: Coffee processing flow diagram ............................................................................. 15 Figure 9: Coffee processing flow diagram ............................................................................. 16

viii
Executive Summary What the report is about? This report documents the results of research into the effect of processing on the quality of Australian Coffee. The research findings are important because they will allow growers to maximise the quality of their coffee which will help them compete more competitively in domestic and international markets. The improved quality will lead to higher prices which should improve industry viability and possibly lead to industry expansion. Who is the report targeted at? This research project was developed in conjunction with the Australian Coffee Growers Association from a need identified in their strategic plan. The findings are targeted at these growers. Background The Australian Coffee Industry has been expanding slowly over the last 10-15 years and more rapidly over the last 5 years. During the early industry development research concentrated on agronomic and production issues such as variety, irrigation and fertiliser requirements and weed control. As the industry has matured and many of the production issues have been resolved, the emphasis for research has changed focus to post harvest and processing issues. As Australian production has increased and the “uniqueness” and “novelty” value in local markets has declined, growers are increasingly having to look for new markets. Very high quality coffee will be required to compete domestically with good quality imported coffees and on the highly competitive international market. Understandably therefore growers are looking to further improve the quality of their coffee by fine tuning their processing systems. Improving the quality will not only make the coffee more competitive but will also lead to higher prices, which in turn will ensure industry viability and continued expansion. Aims/Objectives The project aims to determine the influence of various processing techniques on the green bean appearance and liquoring quality of Australian coffee and determine the best techniques to maximise quality. Through this project the Australian coffee growers have developed an understanding of how different processing equipment and techniques currently used on farms influences the liquoring quality. With this information growers may be able to modify their processing factories to raise the quality of their product and/or tailor their coffee for specific markets. This research will directly benefit the Australian Coffee Growers. Their success will in turn benefit the rural communities in which they are located with employment opportunities and financial contributions. As well consumers are likely to benefit from improved quality of Australian Coffee.

ix
Methods Used An audit of current practices/techniques used by the Australian Industry to process coffee was conducted and some alternative processing techniques developed. Coffee samples were then collected from growers spread across the Australian production area and processed using several different techniques. Samples were then dried, hulled, polished, size graded, colour sorted and assessed for green bean appearance and then sent to a number of professional coffee tasters for evaluation of the liquor quality. Results and Key Findings The audit revealed that although all coffee in Australia is processed using the wet method there is quite a lot of variation in the way this is being achieved across the industry. Growers are using different pieces of equipment set up in different ways in their factories giving different processing techniques. From this audit seven different processing techniques were identified. To avoid the confounding effects of climate, variety and production techniques with the method of processing on the quality of the coffee, coffee from each individual farm was processed in several different ways and comparisons of quality only made within farms and not between the farms. The results indicate that the method of processing does have a large impact on both the appearance of the green bean and the liquoring quality of the coffee. Green bean colour was best (green-blue, no silver skin and clean white centre cut) where the mucilage had been removed by fermentation in water. This was closely followed by samples in which the mucilage was removed mechanically. The poorest appearance was in the beans that were dried in the fruit (i.e. unpulped). These beans were pale yellow-straw colour with a lot of dark brown silver skin attached to the bean and centre cut. It is concluded that removing the pulp and mucilage and soaking, contribute to good bean colour and prevents the silver skin discolouring or adhering to the bean. The liquoring quality evaluations indicate that samples pulped but not fermented (i.e. the mucilage is left on the parchment and dried) produced the best quality coffee with good acidity and body, sweet fruity flavours and smooth balanced pleasant cup. The partially fermented sample also scored well. The fully fermented coffee also scored well as long as the coffee was not over-fermented. The coffee with the poorest quality was from the beans that were dried in the fruit (i.e. with no pulping). This was attributed to the extended period of fermentation in the skin. These coffees were described as being defective, astringent, bitter, sour, over-fermented, rough, medicinal and winey. It is concluded that the presence or absence of the mucilage around the parchment and the amount of fermentation that takes place are the biggest contributors to coffee quality. Implications for Relevant Stakeholders Industry. With the information developed in this project growers are likely to modify their processing factories (where they can) to incorporate some of the findings. This is expected to lead to an overall improvement in the quality of Australian Coffee leading to higher prices and industry expansion. Consumers will also benefit from the improved quality. Communities. Industry expansion in turn will help support rural communities in which coffee is grown by providing financial input and employment opportunities.

x
Policy Makers. Industry expansion will also contribute to the Australian economy with valuable export income and import substitution. Although this industry is small it does contribute to the economic diversity of the horticulture industry and regional employment opportunities. Recommendations The recommendations from this research are targeted at the Australian Coffee Growers who can use the findings to help them improve their quality. Growers should trial processing some of their coffee as pulped naturals where the fruit is pulped but the mucilage is allowed to dry on the parchment. This processing technique consistently produced the best quality coffee. The fully fermented coffees also produced high quality coffees. This would require coffee to be treated in batches in the factory (with fermentation taking 12-24 hrs) but the improvement in quality suggests it is warranted Where fermentation is not used to remove the mucilage aquapulpers produced the next best quality coffee. The very poor quality achieved from red fruit dried down suggests that over-mature samples (floating coffee from the factories) that contain even small amounts of red fruit will produce very poor quality if dry processed. A technique suggested (and practiced to some extent already) is to soak the over-mature/floating sample for long enough that it softens enabling it to pass through pulpers. This will pulp any red fruit in the sample allowing it to dry without fermenting greatly improving its quality

1
Introduction In the 1980’s interest in re-establishing an Australian coffee industry was rekindled following the development of a mechanical harvester. The original Australian industry declined in the early 1900’s for a number of reasons the main ones being the shortage of labour and the high labour costs associated with harvesting. Harvesting costs can be reduced by 90% with the use of mechanical harvesters. Today the Australian industry is still very small compared to world standards but is growing. In 2006 Australia had about 700ha of coffee plantations and produced around 600 tonnes of coffee. The Australian industry is based on producing high quality, high value Arabica coffee for the roast and ground market. At present the world is over supplied with cheap poor quality coffee (mostly Robusta and low quality Arabicas). Therefore for the Australian industry to expand and remain viable, very high quality coffee must be produced and the high value gourmet market where premium prices are paid must be targeted. While production is small and demand outstrips supply, high prices are easy to achieve. As production expands and the small niche high value markets within Australia are satisfied growers will need to expand their markets to the highly competitive international scene. A consistently very high quality will need to be produced in order to distinguish themselves and their product. Premium prices are seen as essential for industry viability. A few of the larger growers have already started to successfully market their coffee internationally, receiving up to four times world prices. With the need for high quality and to be able to distinguish the unique flavour characteristics of Australian coffee internationally this project was developed. This project aims to determine the best way to process Australian coffee to get the best flavour profile and to develop an understanding of how different processing techniques used on farms influences the flavour of Australian coffee. By gaining this understanding it may be possible to further lift the quality of Australian coffee and tailor coffees (with specific quality attributes – acidity, body) for specific markets. Much of the early research work on coffee in Australia concentrated on agronomic practices such as variety evaluation, irrigation and fertiliser requirements, weed and pest control, ideal climatic and soils conditions. Having developed a good understanding of these production issues, the emphasis for research has shifted to post harvest issues such as processing to further lift quality. It is widely acknowledged that after climatic conditions and variety the way in which coffee is processed is the single biggest determinate of coffee quality. The Australian industry is located in 4 main centres along the east coast (Figure 1) between 16 and 23º S of the equator and 0-600m above sea level. The farms range in size from 2-80ha and 95% of the coffee is mechanically harvested. The trees are grown in full sun and intensively managed with high fertiliser and water inputs. Trees are planted on relatively level land in hedge rows 3-4m apart and planted 0.7-1.0m apart within rows (giving plant densities of 2500-5000 plants per hectare) to allow for the efficient operation of the mechanical harvesters. The main varieties grown in Australia are Catuai Rojo, Mundo Novo, Bourbon, K7 and Arusha. Often flowering is manipulated with irrigation scheduling - purposely droughting and then rewatering trees to synchronise flowering which in turn synchronises ripening so that a large proportion of fruit can be harvested ripe at one time with mechanical harvesters. The processing systems used are also designed to separate both immature and over mature coffee from the prime ripe coffee. In this way growers can produce very high quality coffee using relatively unselective machine harvesting (where the harvested sample may contain various amounts of both immature and over-mature coffee).

2
Figure 1: Production Areas for Coffee in Australia Coffee is harvested as mature cherry and processed to green bean ready for roasting which is how it is sold and marketed around the world. This process can be achieved in two ways, 1) dry processing (natural, bundi) so called because it is carried out without water or 2) wet processing (washed) which is carried out with water. In the dry process (Figure 2) coffee is harvested as red cherry or tree dried cherry and dried down either in mechanical driers or in the sun which can take 10-30 days. This process is often used in robusta coffee production and is generally considered to produce a poorer quality product compared with wet processing. Although there are examples of very good quality dry processed coffees from around the world. When dry processing the coffee may develop off tastes – medicinal or rio tastes due to undesirable micro-organisms and moulds growing on the fruit during drying affecting the subsequent flavour (Clifford & Wilson, 1985). Taints may also develop if the fruit rots due to poor drying. The silver skin also adheres to the dry green bean in this process giving the beans a poor greeny-brown appearance.
Tropic of Capricorn
North Queensland
Central Queensland
Northern New South Wales
Brisbane
South-East Queensland

3
In wet processing (Figure 3) coffee is harvested as red cherry which is pulped to separate the skin from the seed. The seed is then fermented usually in water to remove the sticky mucilage layer, this can take 12-24 hours depending on the temperature, the end of fermentation is determined by feel (when the entire sticky layer is removed). The coffee is then rinsed and washed before drying. This process is usually used for better quality Arabica coffees. The process of fermentation is thought to enhance the appearance and flavour of the coffee (Wootton, 1965) although over-fermentation can lead to the development of undesirable micro-organisms, alcohol and acids (lactic, butyric) leading to off flavours (Wootton, 1965, Northmore, 1969, Sivetz, 1972). So the fermentation process needs to be well controlled. In recent years demucilagers and aquapulpers have also been used to remove the mucilage from the beans instead of fermentation. Demucilagers work by friction, with the beans rubbing against one another under pressure to remove the sticky muscilage layer. Aquapulpers on the other hand work using high pressure water to remove the mucilage layer. Another variation on this processing system which has gained popularity recently is drying down the pulped beans without removing any of the mucilage, often called “pulped naturals” or semi-dry. This has been reported to produce a coffee that has liquoring qualities of both dry and wet processed coffee i.e. the body of dry processing and the acidity of the wet processing. In this processing method the beans are very hard to dry because the mucilage is very sticky and hydroscopic. Therefore this method of processing can only be practised where there is a very dry climate or mechanical driers are used. (Annon, 2001)
Harvested Sample 0 – 5% immature green fruit
20 – 25% ripe red fruit 50 – 75% overripe black fruit
Dry in Oven or Sun
Hull and Polish
Green Bean Figure 2: Steps Used in Dry Processing Coffee

4
Harvested Sample
5 – 25% immature green fruit 75 – 95% ripe red fruit
5 – 25% overripe black fruit
Float in Water
Selectively pulp
Remove mucilage Mechanically
or Fermentation
Dry in Oven or Sun
Hull and Polish
Green Bean Figure 3: Steps Used in Wet Processing Coffee In Australia all coffee is processed using the wet method. Early experimentation with dry processing produced inconsistent and inferior quality product. Processing coffee in Australia involves harvesting coffee as ripe cherry. In practice because not all the coffee on the tree is ripe at one time and because the mechanical harvesters are not very selective the harvested sample often includes various percentages of green immature fruit (5-25%) and black over mature fruit (5-25%). The harvested sample is then floated in water to separate the over-mature coffee from the immature and ripe fruit. The sample is then passed through specialised selective pulpers (cherry classifier) or modified conventional pulpers (rubber breast plates and flexible knives) to separate the red ripe coffee fruit from the immature green fruit. This process is achieved by selectively pulping the red fruit but leaving the green immature fruit whole and intact. The ripe coffee can then be separated by sizing screens because the whole green fruit are much larger than the seeds pulped from the ripe fruit. The coffee is then either fermented in water for 12-24 hours to remove the mucilage or the mucilage is removed mechanically using an aquapulper (where high pressure water physically removes the mucilage from the parchment) or a demucilager (where friction of the beans rubbing against one another removes the mucilage from the parchment). The clean parchment is then dried in high airflow mechanical driers at 300C until the coffee reaches 10-12% moisture or in the case of the fermented coffee it is rinsed and washed before drying. The coffee is then stored to cure for 3-6 months before hulling and polishing, size/density grading and colour sorting before the green bean is marketed to processors and roasters. Coffee is traded as dry green bean and prices are paid depending on quality of the sample which is based on the visual appearance of the bean (number of defects, bean size, colour, extraneous matter, broken beans) and the cupping quality.
Overripe black fruit
Immature green fruit and skins of ripe fruit

5
Literature Review After the variety, cultural practices and the growing climate, processing is considered the most important factor affecting the coffee liquoring quality. Careful processing can maximise the inherent quality of the beans while careless processing can lead to faults and taints and seriously down grade quality. The processing system used varies between countries, regions and varieties grown, with different processing methods accentuating different aspects of coffee flavour. A lot of coffee quality research work has compared different processing systems used in different countries and regions, for example comparing dry processed with wet processed coffee (Von Enden, 2002), (Sivetz, 1972) or fermented versus non-fermented coffee, or fermenting verses mechanically removing the mucilage (Wootton, 1965). However, little work has been done on the influence of several different processing systems on the cupping quality of the one sample of coffee from one region. In Australia the early cupping quality work conducted (Lemin and Norris, 1997; Winston and Scudamore-Smith, 1989) was mainly focussed on how the variety, growing climate, location and cherry maturity influenced coffee quality rather than the way in which the samples were processed. The literature generally indicates that the most suitable processing system which develops the best flavour may vary for the country, region, climate, variety or even the targeted market or how the coffee is to be used. So that no single best processing system exists to process coffee and the best methods need to be determined for each set of particular circumstances. Variety The species of coffee grown in different countries may also influence the preferred processing technique. While not always the case it is generally acknowledged that dry processing is most suitable for robusta coffee with its lower moisture content and thinner fruit (Schaefer, 1999, Rothfos 1985, Menzes and Clifford, 1987) while wet processing is most suitable for high quality, high altitude Arabica coffee (Goto Fukanaga, 1985; Clowes et al 1989). Some of the exceptions include the fine Arabica coffees of Brazil and the splendid Arabica coffees of Yemen and Harrar region of Ethiopia which is dry processed. Climate Coffee from different countries have distinct flavour profiles partly due to the climatic and growing conditions but also due to the way in which the coffee is processed. Most of the high quality Arabica coffees from around the world are processed by the classic ferment, wash wet method e.g. Kenya, Costa Rica, Central America, Colombia, Papua New Guinea and Kona. A few like Jamaica Blue Mountain, Colombia and Costa Rica are now processed by removing the mucilage mechanically rather than by fermentation. Some coffees from Brazil, Sumatra and Sulavesi are processed by the semi-dry or pulped naturals method where fruit is pulped and the beans are dried down without removing the mucilage. Only a few of the World’s premium coffees are processed by the dry method e.g. Brazil, Mexico, Yemen, Harrar region of Ethiopia and the moca style coffees (Anon., 2001; Vincent, 1987; Davids, 1996). Producing high quality dry processed coffee may rely on a very dry cherry maturation and dry down period and therefore can only be attained in countries with a very dry climate during ripening and harvesting or possibly with the use of mechanical dryers. Carefully produced dry processed coffee can be as good or even better (with its more complex fruity sweet full

6
bodied flavour) than wet processed coffee. Variable quality has been a criticism of dry processed coffee and some of the faults have been attributed to poor drying in the field during maturation and after harvest leading to moulds and fungal growth tainting the flavour. This has been the experience in Guatemala and here in Australia. As dry processing doesn’t allow any separation of different fruit maturities (as can be done in wet processing), mixed maturities – particularly from immature fruit giving astringent, sour tastes and ripe fruit which dry at different rates and subject to rotting and over-fermentation are believed to compromise the quality of dry processed coffee (Menezes and Clifford, 1987, Lemin and Norris, 1997). Wet processing generally produces a more consistent quality compared to dry processing; however, even wet processing does not guarantee perfect quality as many factors can go wrong if not carefully managed. For example delays in processing after harvest can lead to fermentation within the fruit giving off tastes (VonEnden, 2002). The fermentation process can also enhance or lead to defects in quality. Wootton, (1965) found coffee quality to be affected by the duration and extent of fermentation. He and Rothfos (1985) found the process of fermentation enhances the appearance of the coffee. Where coffee was unfermented or the fermentation was very short the appearance of the bean was poor, being yellowy green with a brown centre cut and silverskin; instead of bluey green with a white cream centre cut. During fermentation the acids which develop have been found to improve the flavour of the coffee however if the coffee is over-fermented further development of acids into vinegar, alcohols and yeasts can lead to “stinker” beans, tainting the flavour (Wrigley, 1988; Northmore, 1969). Lemin and Norris (1997) however found no difference in the quality of coffee produced from a 19 hr vs. a 45 hr fermentation period. Selmar, et al., (2004) believes that the warm wet conditions during fermentation stimulate pre-germination biochemical changes in the coffee seed which leads to the development of acidity and body, this does not occur to the same extent with mechanical removal of the mucilage or during dry processing. The alternative to fermentation is to remove the mucilage from the bean by mechanical means. Aquapulpers and demucilagers have been used for this purpose. These systems are generally acknowledged to produce a coffee with fewer defects and have less opportunity for things to go wrong (unless the parchment is damaged because the machine is set too aggressively) however the flavour is generally considered to be inferior to the flavour developed from full fermentation (Von Eden, 2002). Markets Another confounding factor which comes into play in determining the most suitable processing method to use is the market being targeted and how the coffee is going to be consumed. In the filtered/plunger/dripolator market a coffee with less body, more acidity and a clean crisp taste is preferred. These attributes are generally believed to be more likely to be produced when a coffee is wet processed either with fermentation or better still with mechanical removal of the mucilage (Sivetz, 1972; Davids, 2001; Clarke, 1985). While in the espresso market where a lot of milk is sometimes added and a strong full bodied coffee with lots of crema and less acidity is preferred, dry processing may be more suitable (Sivetz 1972; Davids 2001; Clarke 1985). Davids (2001) found that coffees processed by the dry and semi dry (pulped naturals) methods tend to be the fruitiest, most complex and have the most body owing to the longer contact with fruit residue during drying.

7
Australian growers (pers comm.) are also of the opinion that wet processing, where the mucilage is removed mechanically produces coffees with a consistent clean cup, higher acidity, but which is a bit thin and short on the palette. While using fermentation instead of mechanically removing the mucilage growers believe the flavour increases as well as the body and the coffee develops sweet berry flavours. While dry processing can produce a coffee with more body and more complex fruity flavour with less acidity, occasionally these coffees will be strong and harsh in taste bordering on defective, hence quite variable. Many of these opinions and observations have not been tested and still require trialling/research. Conclusion The conclusion must be that for every region and set of circumstances (variety, growing climate and market) the ideal processing system to get the best flavour profile from your coffee that is desired by both the producer and the consumer is likely to vary and will need to be determined by research.

8
Objectives
• Conduct an audit of the processing equipment and systems currently used by the industry
• Determine the influence of various processing techniques on the flavour profile of
Australian Coffee
• Improve the understanding of coffee growers of the importance of the stages in processing in determining quality.
Methodology The research for this project was carried out in conjunction with the Australian Coffee Growers. During the first year of the project an audit was conducted on the processing equipment and the processing systems being used to process coffee. This involved travelling to different coffee farms across the Australian production area and recording the equipment used and the techniques employed by the industry to process coffee. Information was also collected on growers’ knowledge of processing and how it influences the liquoring quality. This information was used to develop seven different processing systems used in the project. (See Table 1). During the 2004 and 2005 coffee harvesting and processing seasons (July-November) coffee samples processed in different ways (Table 1) were collected from a number of growers. (IM, N, L, MT, Z). These farms were located in Queensland on the Atherton Tablelands inland from Cairns (170S, 400m elevation) and in Northern New South Wales near Byron Bay (230S 100-300m elevation) see Figure 1. In Queensland all samples were collected from the variety Catuai Rojo while in New South Wales the variety K7 was used. On all properties trees were grown intensively in full sun with plentiful water and nutrients supplied, trees were 6-15 years old and mechanically harvested. In 2004, on each of five properties (IM, N, L, MT, Z) coffee samples processed in seven different ways were collected (Table 1). In 2005 (based on the results from 2004) samples were collected from four properties (IM, N, MT, Z) and samples were processed in five different ways (2, 3, 4, 6 and 7 see Table 1). All the samples collected from each property were taken from the same block of trees. By collecting the samples from the same trees at the same time on each property the comparison between samples within a property is an accurate reflection of the differences in the way the coffee has been processed rather than the other factors likely to affect coffee quality (eg climate, soil type, variety, management inputs, elevation). It is not possible to compare processing systems across properties because of these confounding influences. The samples collected allow for a comparison of dry and wet processing, stage of maturity for dry processing, length of fermentation, and mechanical removal of the mucilage verses fermentation. Samples ranged in size from 50-100 kg giving between 5-10kg of dry clean green bean after drying and processing. Once dried, samples were stored and allowed to cure for 3-5 months. Samples were then hulled using a Bental (Africa 10) huller, size graded, colour sorted and packaged ready to be sent to a number of professional tasters. The NSW samples were graded to a size of 18/64th of an inch, while the Queensland samples were graded to a size of 16/64th of an inch. Equipment was thoroughly cleaned between samples to avoid possible

9
contamination between treatments. The appearance of the green bean samples was recorded before being packaged and sent to 4 groups of tasters for assessment of cupping quality.
• Australasian Speciality Coffee Association – Insturata • The NSW Coffee Growers Association tasting panel • The North Queensland Coffee Growers Association • Coffee Lab which tastes for the Indian coffee board – Sunalini.
Samples were roasted (medium/dark, Agtron 65) tasted blind and in duplicate. Samples were prepared using the direct infusion method (8 g/150 ml, course grind). Coffees were allowed to steep for 4 minutes before breaking the crust and recording the aroma. Samples were then cupped and results recorded using the Australasian speciality coffee association scoring sheets (Figure 4). Results were recorded for Acidity, Body, Flavour and Aroma and the sample given an overall score. To simplify the results from the different tasters coffees were ranked from best to worst based on the overall liquoring quality. Table 1. The seven processing methods assessed
1 Red fruit sun dried – this coffee was collected from the harvester. The immature green fruit was removed by hand and over mature black fruit was removed by floating. The remaining ripe red fruit was then spread on shade cloth and allowed to dry in the sun. The sample was regularly turned and took 2-3 weeks to fully dry.
2 Red fruit oven dried – “As Above” except the sample was mechanically dried. The sample took 4-5 days to fully dry.
3 Over mature (“Bundi”) coffee oven dried – this coffee was collected from the trees at the end of the harvesting season predominately as tree dried over mature coffee. The sample was then mechanically dried.
4 Red fruit pulped, fully fermented in water and oven dried – this coffee sample was collected following pulping in the processing factories. The pulped bean was then fermented in water in plastic containers at 20-250C for 12-18 hours until all the mucilage had fermented off the parchment. The sample was then rinsed, washed and mechanically dried.
5 Red fruit pulped partially fermented in water and oven dried – the sample was prepared as for 4 above except the fermentation time was reduced to 3-6 hours so that some of the mucilage remained on the parchment even after rinsing and washing. The sample was then mechanically dried.
6 Red fruit pulped and oven dried - this coffee sample was collected following pulping in the processing factories. The pulped bean was then mechanically dried with the mucilage left on the parchment. This coffee was difficult to dry as it was very sticky and hydroscopic. Often called pulped naturals.
7 (a & b) Red fruit pulped and the mucilage removed mechanically - this sample was collected from the processing factories following the (a) aquapulper or (b) demucilager which both remove the mucilage mechanically as opposed to fermentation. Friction removes the mucilage in the demucilager and high pressure water in the aquapulper. The sample was then mechanically dried.
Footnote: All samples mechanically dried were dried at 320C until the green bean reached 10-12% moisture (usually 2-3 days). Samples were regularly turned during drying.

10
Figure 4: Australasian Speciality Coffee Association scoring sheet
11
Audit Conduct an Audit of the processing equipment and systems currently being employed by the industry. The major equipment companies were: Company Country Equipment Age Penagos Colombia Whole factory Recent Pinhalense Brazil Whole factory No longer manufacturing Palini & Alves Brazil Whole factory Replaced Pinhalense All Coffee Brazil Whole factory New Bendig Costa Rica Separate pieces of equipment
(pulper, classifier) Recent
Bentle England Separate pieces of equipment (pulper (horizontal drum), huller, aquapulper)
Old
John Gordon England Separate pieces of equipment (pulper (vertical drum), huller)
Old
McKinnon India Separate pieces of equipment (pulper (disk) huller)
Old
D’Andrea Brazil Separate pieces of equipment (huller)
No longer manufacturing
Processing Systems Harvesting Harvesting is conducted by hand or machine. Hand harvesting accounts for <5% of industry production and is almost prohibitively expensive. Hand harvesting usually results in almost 100% red cherry allowing for processing using conventional traditional machinery (for example non selective pulpers). Due to the high costs, some growers strip pick and so end up with mixed maturities in the harvested sample as occurs with machine harvesting. With machine harvesting, harvested samples can contain from <5 to 30% immature green fruit and 5 to 50% over mature black fruit depending on the synchronisation of ripening and the selectivity of the harvester. Therefore in the majority of cases factories have been designed to separate red, green and black fruit during processing. This has been achieved with specialized pieces of equipment (cherry classifier) or modifications to more traditional pulpers (Bentle, McKinnon, John Gordon, Penagos). Optimum harvest time varies between growers depending on whether they are trying to maximise the amount of red cherry where multiple selective harvests are used or minimising green cherry in the harvested sample where harvesting is delayed until most of the coffee is red or black. Machine availability (in the case of contract harvesting) and weather conditions during ripening will also influence the harvest time and hence the proportion of red (mature), green (immature) and black fruit (over mature) in the sample. Collection With hand harvesting, fruit is usually collected into picking buckets or bags or picked onto hessian ground sheets. With machine harvesting, either field bins or trailers are used to transport the coffee from the harvester to the factory. Depending on the rate of harvesting and the capacity of the factory there may be 1 – 12 hours delay between harvesting and

12
processing. In some cases coffee has been processed up to several days following harvest with apparently little deterioration in quality. Receival Tank, Sorter, Floater Before coffee is pulped it is usually floated in water to remove over-mature coffee, sticks, leaves and other extraneous matter (the exception might be in selectively hand picked coffee). Depending on the equipment used the coffee is either floated in the receival tank (common in north Queensland) or a continuous flow float separator (e.g. Palini and Alves, common in NSW). The coffee which sinks (red and green cherry) is usually in water for 5 minutes to 2 hours before it is pulped. The floating coffee (mostly over-mature but with some green and some red) is then either discarded (common in NSW), dry processed or soaked (2-24 hours) and wet processed (common in north Queensland). There is quite a bit of difference in opinion as to the usefulness and quality of this processed over-mature coffee. Pulping After the coffee has been floated to separate the over-mature coffee, the sinkers (red and green cherry) are pulped (usually 1 – 4 hours from harvesting). For most growers (except with selective hand picking) this means selectively pulping to separate the green fruit from the red. The red coffee forms the 1st grade and while most growers throw the green coffee away – some have soaked and pulped it, others have dry processed it. The pulpers can be split into two types – traditional pulpers and new generation pulpers. The traditional pulpers (Bentle, McKinnon, John Gordon, Penagos) have to be modified to allow for adequate separation of green cherry (deep groove breast plates, flexible rubber chops, adjustable ground out and slotted breast plates). The success of these techniques in separating the green fruit is variable depending on the percentage of green fruit in the harvested sample. Where the percent of green fruit is less than 10% they work quite well, but when the percent green fruit is greater than 10% they are less successful. Rotary screens are often combined with these pulpers which allow the pulpers to be set less aggressively (doing less bean damage and pulping fewer greens). The greens are then removed using the rotary screens. The new generation pulpers called cherry classifiers (Palini and Alves, Bendig, All Coffee) are designed to selectively pulp the red fruit using water pressure and then screen out the larger unpulped green fruit. Some growers have modified traditional aquapulpers to do this job. These pulpers do not separate the skin from the parchment and therefore require traditional pulpers or screens to follow the classifier to separate the parchment from the skins. Demucilage/Fermentation Usually the mucilage around the parchment following pulping is removed. However, in some overseas countries and in a few instances here, growers have experimented with leaving the mucilage intact and drying (to help improve quality – extra body and sweetness). In Australia, problems in successfully drying and handling this product have been encountered (very hydroscopic and sticky). This may be overcome with some pre-drying or sun drying but has prevented growers from trialling this type of processing to any great extent. Where the mucilage is removed it can be done by fermentation (6-24 hrs), submerged in water or dry; or mechanically using high-pressure water (aquapulper) or by friction and water using a demucilager. The amount of mucilage removed in the demucilager can be adjusted and sometimes a combination of mechanical removal and short fermentation is used or the coffee is dried with a small amount of mucilage intact.

13
Drying Coffee can be dried in the sun or mechanically in driers. Mechanical driers can operate on diesel or gas. Generally for sun drying to be successful a very reliable dry season during harvesting is required or else drying racks need to be able to be covered. The coffee requires constant turning to dry properly. It was generally agreed that sun dried coffee produces a better coloured green bean but because of the uncertainty of the weather, the surface area and the time and labour required to sun dry, mechanical drying is preferred. Some growers believe there are taste differences produced between sun and mechanical drying. During mechanical drying some growers vary the temperature or even turn the drier on and off during drying in an attempt to improve either the colour or taste of the coffee. Others use a combination of sun and mechanical drying. Usually the over mature or floating coffee when dry processed (i.e. without pulping) is sun dried because drier capacity is not able to handle all the coffee. Because this coffee has been wetted during separation it needs to be dried carefully, it can take a long time to dry and can go mouldy. When the over mature coffee is soaked and wet processed (pulped) it is usually dried mechanically. Some of the different processing systems used on Australia Coffee farms are illustrated in the following figures.
Harvesting
Continuous Flow Float Separator
Pulper (modified)
Fermentation (12-24 hrs)
Wash
Dry Figure 5: Coffee processing flow diagram
Discard floaters
Discard greens, skins

14
Harvesting
Continuous Flow Float Separator
Pulper (modified)
Demucilager
Dry Figure 6: Coffee processing flow diagram
Harvesting
Float Tank Sinkers Floaters (12 hrs soaking)
Cherry Classifier
Pulper
Rotary Screen
Demucilager
Fermentation (12 hrs)
Dry
Figure 7: Coffee processing flow diagram
Discard floaters
Discard greens, skins
Discard greens
Greens Skins Discard greens, skins
Discard greens, skins

15
Harvesting
Float Tank Sinkers Floaters (12 hrs soaking)
Aquapulper (pulping)
(fine screen 2-3 mm)
Aquapulper (separating and demucilage)
(course screen 7-8 mm)
Dry Figure 8: Coffee processing flow diagram
Greens Skins Discard greens, skins

16
Harvesting
Float Tank Sinkers Floaters (12 hrs soaking)
Cherry Classifier
Pulper
Channel Grade Large prime Other
Fermentation (12-24 hrs)
Aquapulp
Wash
Dry Dry Figure 9: Coffee processing flow diagram
Discard greens
Discard skins

17
These variations in processing equipment and systems give rise to 5 styles of Australian coffee.
1. Washed – Fruit is pulped and there is complete mechanical removal of the mucilage, i.e. there is no fermentation. This can be achieved with an aquapulper or demucilager.
2. Semi Washed – Fruit is pulped and there is partial removal of the mucilage. This is usually the case when fruit passes through the demucilager. The coffee can then be dried like this or fermented for a short time to remove the last of the mucilage.
3. Unwashed – Fruit is pulped but no mucilage is removed. The coffee is then dried. 4. Natural – Fruit is dried in the flesh (no pulping). This can occur on the tree or after
harvest in the sun, or mechanically. In this case fermentation occurs as the fruit dries. Flesh is removed during hulling.
5. Natural Washed – Fruit that is dried in the flesh (natural) is soaked until soft and then pulped.
Growers Observations
• Immature green cherry is of low or no value and is of inferior quality. A few believe good coffee can be retrieved from the mature green cherry if the skin is left intact during processing and it is dried down
• Red cherry produces the best quality coffee. Red cherry wet processed (pulped) produces a good reliable, quality product
• Over mature coffee produces a variable quality product from very good to very bad (a lot of conflicting views). This is thought to be related to the variable composition of the over-mature coffee (red, green and black fruit). Also varies in size, moisture content, degree of fermentation, stickiness and mouldiness. Some believe the flavours that are sometimes associated with over-mature coffee comes from contamination of the green bean from contact with the skin of the fruit (often mouldy or dirty). This can be reduced if the over-mature coffee is washed or soaked. Wet processing of over-mature coffee (soaking and pulping) helps to produce a more reliable acceptable quality product
• Coffee needs to be dried well and carefully to avoid problems with mould and off flavours
• Growers are unsure of the advantages or disadvantages of using “washed”, “semi washed” or “unwashed” processing techniques on quality. Unwashed coffee is difficult to dry because it is sticky and very hydroscopic so has not been practiced to any large extent. When the mucilage is removed it is uncertain if this is best done by mechanical means (aquapulper or demucilager) or by fermentation. Fermentation is generally considered more risky as more things can go wrong, also with fermentation there cannot be a continuous flow in the factory
• Unsure how to handle over-mature coffee and how to maximise its value • Growers are unsure if over-mature coffee once processed should be kept separate
from the prime red coffee or should it be recombined. Espresso coffee market likes some dry processed coffee (naturals) in their blends
• Coffee should not be heated too much during drying or hulling.

18
Liquor Quality Results indicate that the method of processing following harvesting does have a large impact on the liquor quality and appearance of the green bean. Samples collected from the same trees at the same time can have outstanding liquor quality and appearance processed in one way yet be defective if processed in another way. Green Bean Observations The green bean observations (Table 2) indicate that the bean colour was best (green-blue) in the samples where the mucilage had been removed by fermentation (Process method 4 & 5) closely followed by the sample which had the mucilage removed mechanically either by a demucilager or an aquapulper (Process method 7). All these samples had little silver skin left attached to the bean and the centre cut was a clean white colour. The beans with the poorest appearance were those that were harvested as red cherry and dried down in their skins (Process method 1 & 2). These beans were a pale yellow-straw colour with a lot of silver skin attached to the bean. The silver skin and centre cut on these samples was dark brown in colour. These beans were also rounder and more cupped shaped compared to beans from pulped fruit. The beans from the fruit pulped and dried without fermentation (Process method 6) have a good greeny-blue colour similar to the fermented (Process methods 4 & 5) but with some light brown silver skin attached and a light brown centre cut similar but not as pronounced as in the beans from the fruit dried in their skins. The bean colour was darkest in the beans from the fruit allowed to over mature on the tree. These beans were a dark green-blue in colour and as expected had the most and darkest brown silver skin and centre cut. It is concluded that removing the pulp and mucilage from around the parchment contributes to good clean bean colour and prevents the silver skin from discolouring or adhering to the bean. Leaving the pulp and even the mucilage to some extent around the parchment discolours the silver skin and centre cut and causes the silver skin to adhere to the bean. Table 2: Green bean observations of samples processed in different ways
Process Method Description
1 Pale yellow straw coloured bean, dusty appearance with a lot of silver skin attached. Silver skin and centre cut are dark brown in colour.
2 As above even paler in colour. 3 Beans are very dark green blue in colour with lots of brown silver skin
attached and dark brown centre cut (darker than in 1 & 2).
4 Beans are clean shiny green blue colour with little silver skin attached. The centre cuts are white. Overall these beans have the best appearance.
5 As for 4.
6 Beans are blue green in colour although slightly paler than 4, 5 and 7. They also have slightly more silver skin attached to the bean. The centre cut is light brown in colour.
7 As for 4 although slightly paler in colour, less silver skin left attached to bean and the centre cut is even whiter.

19
Roasted Bean Observations Beans with the best green bean appearance (Process method 4, 5 and 7) where the mucilage was removed by fermentation or mechanically from the parchment also tended to roast the best with an even dark colour, smooth, shiny surface and a clean white centre cut. The beans where the fruit was allowed to dry around the parchment (Process method 1, 2 and 3) often roasted unevenly, were dull in appearance and the centre cut was dark in colour. Liquoring Quality The results from the liquor quality evaluations from the different testers for 2004 and 2005 are presented in the following tables. Some of the results have been presented as rankings in order of quality, from best to worst. Coffee tasting is highly subjective and as such a bit of variation between tasters and tasting groups is expected. Using rankings helps to elevate some of this variation and variation between samples. As the aim of this research was to compare processing methods rather than score coffees from different properties or locations using rankings helps to simplify these comparisons. The results of the liquor quality evaluations were reasonably uniform between tasters and from both years, although occasionally a single sample will be unexpectantly down-graded by one taster. This may occur because the sample has been contaminated prior to or during analysis. Results from 2004 and 2005 across all tasters indicated that samples pulped but not fermented (Process method 6 – sometimes called pulped naturals) consistently scored well with good acidity, sweet fruity flavours, smooth balanced, rounded, pleasant cup with good body (Table 6 & 10). The partially fermented sample (Process method 5) in which some of the mucilage was left on the parchment also scored well. The enhanced quality of these samples would appear to be due to the mucilage layer drying around the parchment without fermenting that does not occur in conventional wet processing (Process method 4 or 7) or dry processing (Process method 1, 2 or 3). When a lot of mucilage is left on the parchment it can be quite difficult to handle in the processing factory because it is very sticky and hydroscopic making drying difficult. Care needs to be taken to avoid fermentation during drying and not to allow the coffee to stick to the dryer and form large clumps. It may be possible to sprinkle a small amount of sawdust or dry parchment over this coffee to stop it from sticking together.

20
Results - 2004 Table 3: The effect of process method on the liquor quality for the 2004 samples collected from growers N, MT and L as assessed by the North Queensland Coffee growers. Samples have been ordered from best to worst based on liquor quality.
Grower N MT L Average 6 6 4 6 5 4 6 4 4 5 7a 7 3 7b 5 5
7b 3 2 3 2 2 3 2
Best
Samples ranked in order of quality
Worst 1 1 1 1
Table 4: The effect of process method on the liquor quality for the 2004 samples collected from growers IM, N, MT and Z as assessed by Insturata. Samples have been ordered from best to worst based on liquor quality.
Grower IM N MT L Z Average 3 6 6 6 6 6 6 5 5 7a 5 5 4 3 3 2 3 3 7a 4 7b 4 4 4 5 2 2 5 7b 2 1 7b 4 1 2 7
Best Samples ranked in order of quality
Worst 2 1 1 3 1 1

21
Table 5a: The effect of process method on the liquor quality for the 2004 samples collected from growers IM, N, MT and Z as assessed by Sunalini. Samples have been ordered from best to worst based on liquor quality. The acidity, body and liquor quality rating is shown in Table 5b.
Grower IM N MT L Average
6 6 3 6 6 7a 4 5 3 3 3 2 6 5 5 5 5 2 4 4 4 1 1 7a 7 2 3 4 2 2
Best
Samples ranked in order of quality
Worst 1 7b 7b 1 1
Table 5b: The effect of process method on the acidity, body and overall liquor quality rating for the 2004 samples collected from the growers IM, N, MT and L as assessed by Sunalini.
Liquor Quality Grower Process Method Body Acidity Overall rating
1 5.5 5.5 3.5 2 5.5 5.5 4.5 3 5.5 6.5 5.5 4 5.5 5.0 5.0 5 5.0 6.0 5.0 6 5.5 5.5 6.0
IM
7 6.0 6.0 6.0 1 5.0 5.0 4.0 2 5.5 5.0 5.0 3 5.0 6.0 2.5 4 6.0 5.0 5.0 5 5.0 5.5 4.5 6 5.5 5.5 6.0
N
7 6.0 5.0 0 1 5.5 5.5 4.0 2 5.5 5.5 4.0 3 6.0 6.0 6.0 4 5.0 7.0 2.0 5 5.5 5.5 5.5 6 5.5 6.5 4.0
MT
7 5.0 6.5 5.0 1 5.5 6.0 2.0 2 5.0 6.5 3.0 3 5.5 5.5 5.5 4 5.5 5.5 4.5 5 5.5 6.0 5.0 6 6.0 5.0 5.5
L
7 5.5 5.0 4.0

22
Table 6: Tasters comments from the cupping evaluations from the 2004 samples. Process Method Comments
1 Over-fermented, defective, over-ripe off notes, bitter 2 Slight sweet, astringent, sour, winey, rio taste, defective 3 Defective, grassy, hemp, lemon acid astringent, sour, over-ripe.
Chocolate, balanced, smooth 4 Slight acid, thin body. Mellow acid low acid sweet buttery (over-fermented) 5 Thin body, flat low body, tangy acid, sweet chocolate, good acidity. 6 Bold acidity, fruity, consistent. Smooth sweet, good acid, good body, balanced
sweetness. Slight body. Rounded brisk very good. 7a) 7b)
Mild acidity, sweet. Plain, little body, sour, acid
The fully fermented coffee (Process method 4) scored well for liquor quality, as long as the coffee was not over-fermented, as occurred in 2004 particularly at the growers MT, Z and IM (see Table 3, 4 & 5a). In these cases coffee was left unintentionally for several (6-12) hours longer than necessary for all the mucilage to have been fermented off the parchment. During this period of over-fermentation undesirable quality attributes are passed to the beans. Acids produced during fermentation change to alcohols and vinegar, giving the coffee a sour taste (Wrigley, 1988). In 2005 the period of fermentation was reduced to 12-18 hours from 18-24 hours used in 2004, and the quality of these fully fermented samples (Process method 4) was greatly improved (Table 7, 8a and 9a). Given the reduction in quality observed from over-fermentation and the superior quality of the samples with some mucilage left on the parchment (Process method 5 & 6) it is recommended to slightly under-ferment rather than risk over-fermenting in processing coffee. The quality of the properly fermented coffee was very good – the flavour described as tangy, sweet balanced with high acidity, bright chocolate with a clean after taste. (Table 10) The two samples which consistently produced the poorest quality coffee were the red fruit dried down in their skins (Process method 1 & 2) see Tables 3, 4 & 5a. This coffee takes several weeks to dry in the sun and even several days in the oven, during which time the fruit starts to rot and the mucilage ferments. This extended period of fermentation and skin rotting obviously imparts very undesirable quality attributes. Von Enden (2002) and Rothfos (1985) found delays in processing leading to over-fermentation resulted in poor liquor quality. Some of the off flavours may also come from the moulds which develop on the fruit as it dries (especially in the sun). Oven drying (Process method 2) does improve the quality but only slightly. These coffees were described as being defective, astringent, sour, bitter, over-fermented, rough, turpey, medicinal and winey (Table 6 & 10). The liquor quality for the sample collected as tree dried over mature coffee produced quite variable results between tasters and between growers. In 2004 the North Queensland tasters scored all the tree dried coffee samples very low (Table 3) whereas Sunalini and Insturata scored some of the samples quite high (Table 4 & 5a). Samples from IM, MT and L (Sunalini only, Table 5a) scored very well while samples from N and L (Insturata, North Queensland, Table 3 & 4) scored poorly. In 2005 with the reduced number of generally better quality samples collected, the results were much more consistent between growers and tasters (Tables 7, 8a & 9a). The tree dried coffee (Process method 3) scoring reasonably well for liquor quality although 2nd lowest in these samples. The two notable differences were the samples from N which was very poor again and the sample from IM (NSW coffee tasters only, Table 8a) which was very good.

23
It is thought that the variation seen in these tree dried coffee samples could be related to 1) Differences in the climate between growers properties during cherry maturation affecting how evenly the fruit dries. In a very dry environment when coffee fruit matures and dries on the tree (Process method 3) the mucilage may dry rather than ferment around the parchment which is likely to give good quality, however, the skin drying around the parchment may change its quality again. 2) The presence or absence of moulds/fungi on the fruit when harvested. 3) The type of moulds/fungi that develop on the fruit when it is drying. 4) The range in the stages of maturity when harvested. As has been shown if any red fruit or not fully tree dried fruit is harvested and dried (as in Process method 1 & 2) the quality of the sample is very poor. The good liquor quality of some of the tree dried samples indicates that the processes going on inside the fruit as the fruit over-matures and dries on the tree are quite different to that which occurs when red fruit are harvested and dried in the sun. On the tree the fruit remains a living organ which gradually dehydrates so the fruit doesn’t rot and the mucilage doesn’t ferment like it does off the tree. Where only fully tree dried coffee is collected from trees and where the fruit dried down gradually and evenly without rehydrating from rain or irrigation the quality is likely to be good. When this sample of tree dried cherry was not tainted the quality was described as having good acidity and body, earthy, balanced and smooth. In the processing factories growers have also experienced variable quality from processing over-mature tree dried coffee. They have overcome some of these problems by soaking the coffee for up to 12 hours and running it through pulpers and cherry classifiers before drying it. This allows separation of any immature coffee in the sample and pulping any coffee that leave is not completely tree dry, allowing it to dry down quickly without fermentation (as in Process method 6), thereby not contaminating the sample. Soaking this coffee and pulping it may also clean the surface of the fruit which some of the growers believe is a source of contamination tainting the flavour of the green bean. In the sample where the mucilage was removed mechanically (Process method 7) the quality varied with the means of removal. Removal using an aquapulper generally resulted in good quality (7a) while removal using a demucilager (7b) resulted in variable quality (Tables 3, 4 & 5a). The reason for this may be due to a small amount of mucilage being left on the parchment after the demucilager which subsequently fermented during drying, or the mucilage may have been forced into the bean through the centre cut or damaged parchment which contaminated the green bean. Von Enden (2002) found that parchment could be damaged in demucilagers and if that occurred it resulted in poor quality. Water quality and machine hygiene may also be important attributes affecting quality in this sample. The coffee produced with the aquapulper was described as sweet, clean, tangy, good acidity, floral and nutty, whereas some of the samples produced with the demucilager were described as harsh, sour, astringent, woody, phenolic with a chemical taint (Table 6 & 10). This finding suggests caution needs to be exercised when using a demucilager and the liquoring quality checked regularly.

24
Results - 2005 Table 7: The effect of process method on the liquor quality for the 2005 samples collected from growers IM, N, MT and Z as assessed by Insturata. Samples have been ordered from best to worst based on liquor quality.
Grower IM N MT Z Average Best
Samples ranked in order of quality
Worst
4 6 7a 3 2
4 6 2
7b 3
4 6 3
7b 2
4 6 3
7b 2
4 6 7 3 2
Table 8a: The effect of process method on the liquor quality for the 2005 samples collected from growers IM, N, MT and Z as assessed by the NSW coffee growers tasting panel. Samples have been ordered from best to worst based on liquor quality. The acidity, body, aroma and flavour are shown in Table 8b.
Grower IM N MT Z Average Best
Samples ranked in order of quality
Worst
7a 3 6 4 2
6 4
7b 2 3
6 7b 3 4 2
6 4
7b 3 2
6 7 4 3 2
Table 8b: The effect of process method on the acidity, body, aroma and flavour for the 2005 samples collected from the growers IM, N, MT and Z as assessed by the NSW coffee growers tasting panel.
Liquor Quality Grower Process Method Body Acidity Aroma Flavour
2 4.6 4.0 4.6 4.0 3 6.5 5.8 6.8 6.3 4 5.6 5.3 5.0 5.0 6 5.6 5.3 6.3 6.0
IM
7a 6.6 6.3 6.0 7.0 2 4.5 3.8 4.5 3.5 3 2.3 1.8 1.5 1.5 4 5.8 5.3 6.3 5.3 6 6.8 6.5 7.3 7.0
N
7b 4.0 3.8 4.8 3.0 2 5.3 5.6 4.6 5.3 3 6.3 6.0 5.6 6.3 4 6.0 6.0 5.3 6.0 6 6.5 7.0 6.8 7.5
MT
7b 6.3 6.6 6.3 6.3 2 3.6 2.6 3.3 2.6 3 6.3 6.0 5.3 5.6 4 6.8 7.0 7.5 7.0 6 6.8 7.0 7.3 7.0
Z
7b 6.8 7.3 6.8 7.0
25
Table 9a: The effect of process method on the liquor quality for the 2005 samples collected from growers IM, N, MT and Z as assessed by Sunalini. Process samples have been ordered from best to worst based on liquor quality. The acidity, body and overall liquor quality is shown in Table 9b.
Grower IM N MT Z Average
6 6 6 4 6 4 4 4 6 4 7a 7b 7b 3 7 3 2 3 7b 3
Best Samples ranked in order of quality
Worse 2 3 2 2 2 Table 9b: The effect of process method on the body acidity and overall liquor quality for the 2005 samples collected from the growers IM, N, MT and Z as assessed by Sunalini
Liquor Quality Grower Process Method Body Acidity Overall rating
2 7.0 5.0 5.0 3 7.0 5.5 5.0 4 7.0 6.0 5.5 6 6.5 6.5 5.5
IM
7a 7.0 5.0 4.5 2 6.0 6.5 0 3 6.0 5.0 0 4 6.0 6.5 5.0 6 5.5 5.5 5.5
N
7b 6.5 5.0 4.5 2 6.0 7.0 1.0 3 6.5 7.0 5.5 4 6.5 6.5 6.0 6 7.0 7.0 6.5
MT
7b 6.5 7.0 5.5 2 6.0 5.0 0 3 7.0 6.5 5.5 4 6.5 6.5 6.0 6 5.5 6.0 5.5
Z
7b 5.0 6.0 4.5

26
Table 10: Tasters comments from the cupping evaluations from the 2005 samples.
Process Method Comments
2 Over-fermented rough pungent, sour turpey medicinal. Unpleasant phenolic. Light/good body. Fruity, earthy, herbal. Defective unclean.
3 Herbal, medicinal astringent, fermented, phenolic, dirty, musty, harsh, sour bland. Baggy, grassy, earthy. Strong, acidic.
4 High acid, flat, tangy sweet, balanced, short/clean after taste, nutty, floral, bit bland. Bright chocolate, pleasant.
6 Fruit, sweet, slight astringent, low acid. Grassy green astringent, chocolate nutty, caramel, fruity. Good body, bright, balanced, pleasant.
7a) 7b)
Sweet, gentle floral, nutty, fruity, acid clean tangy, nutty caramel chocolate. Medicinal harsh fermented. Flat, dull, average.
Acidity and Body The two principle components used to determine coffee quality are the body and the acidity of the coffee. From the literature (Davids, 2001, Wrigley, 1985) and growers’ comments during the audit it was anticipated that the different processing techniques would have resulted in coffees with distinct body or acidity characteristics. It was expected that the acidity levels should be the greatest and the body the least in coffees wet processed and the mucilage removed mechanically (Process method 7a or 7b). While the body should be the greatest and the acidity the lowest in samples dry processed (Process method 3). In the process method where the mucilage was left on the parchment (Process method 6) acidity and body levels around the average were expected. Results for these comparisons are presented in the following Tables (11 & 12). The results indicate that the acidity and body levels are quite similar for all three of these samples. In 2004 the acidity levels were slightly higher in dry processed coffee (Process method 3) but lower in 2005. The body was similar between samples in 2004 but higher in the dry processed coffee in 2005.

27
Table 11: Acidity and Body levels for the 2004 samples processed according to method 3, 7 and 6.
Acidity Body Process Method 3 7 6 Process Method 3 7 6 6.5 6.0 5.5 5.5 6.0 5.5 6.0 5.0 5.5 5.0 6.0 5.5 6.0 6.5 6.5 6.0 5.0 5.5 5.5 5.0 5.0 5.5 5.5 6.0 Average 6.0 5.6 5.6 Average 5.5 5.6 5.6 Table 12: Acidity and body levels for the 2005 samples processed according to method 3, 7 and 6.
Acidity Body Process Method 3 7 6 Process Method 3 7 6 5.5 5.0 6.5 7.0 7.0 6.5 5.0 5.0 5.5 6.0 6.5 5.5 7.0 7.0 7.0 6.5 6.5 7.0 6.5 6.0 6.0 7.0 5.0 5.5 5.8 6.3 5.3 6.5 6.6 5.6 6.0 6.8 7.0 6.3 6.3 6.5 6.0 7.3 7.0 6.3 6.8 6.8 Average 6.0 6.2 6.3 Average 6.5 6.4 6.2 Obviously the differences in acidity and body produced by these different processing methods are quite small compared to the inherent acidity and body levels of this variety growing in this climate under these management regimes. Generally it is concluded from these trials that the best quality samples also have the highest acidity and body levels. Conclusion It is concluded that the presence or absence of the mucilage around the parchment and the amount of fermentation that takes place are the biggest contributors to coffee quality. There appears to be some advantage in terms of liquor quality by leaving the mucilage on the parchment as long as it does not ferment during drying.

28
Implications The method of processing following harvesting has a large impact on the green bean appearance and the coffee liquoring quality. As such growers need to take into consideration how they will process the coffee to maximise its inherent quality. While the climate, growing conditions, variety and agronomic practices all determine the inherent quality of the coffee, the method of processing can alter this dramatically. With the information developed in this project growers are likely to modify their processing factories (where they can), to incorporate some of the findings. Growers are likely to trial samples of pulped naturals where the fruit is pulped but the mucilage is left to dry on the parchment as this consistently produced the best quality coffee. Results suggest fermentation may produce better quality than demucilagers however careful attention needs to be paid to both methods of processing to maximise quality. With fermentation quality deteriorated if samples were over fermented with the acids developed in fermentation turning to alcohols and vinegar. Samples should only be fermented for as long as it takes to remove the mucilage layer and no longer. With demucilagers poor quality may have been linked to parchment damage or incomplete removal of the mucilage which subsequently fermented. Demucilagers must therefore be set aggressively enough to remove all the mucilage but not too aggressively to cause parchment damage. The very poor quality resulting from red fruit dried down in their skins has important implications for processing the tree dried or the floating coffee out of the factory. These samples invariably contain some red fruit and as such must be pulped in order to avoid over-fermentation of these fruits which will contaminate the whole sample. In order to do this the coffee needs to be soaked sufficiently so that it softens and can pass through pulpers. This will pulp any partially dried coffee and greatly improve the quality. The poor quality of the coffee dried down as red fruit also suggests quality maybe adversely affected if there are lengthy delays between harvesting and processing – especially if temperatures are hot and fruit starts to ferment. It is expected that changes incorporated into factories as a result of this project will lead to an improvement in the overall quality of Australian Coffee leading to higher prices which should result in industry expansion.

29
Recommendations Growers should trial processing some of their coffee as pulped naturals where the fruit is pulped but the mucilage is allowed to dry on the parchment. This processing technique consistently produced the best quality coffee. Care needs to be taken drying this coffee because it is very sticky and hydroscopic. It may be necessary to add a small amount of dry material to this sample to start the drying process and prevent the coffee sticking to the drier. The fully fermented coffees also produced high quality coffees. This would require coffee to be treated in batches in the factory (with fermentation taking 12-24 hrs) but the improvement in quality suggests it is warranted. Care needs to be taken not to over-ferment the coffee which results in the acids produced during fermentation converting to vinegar and alcohols reducing quality. Where fermentation is not used to remove the mucilage aquapulpers produced the next best quality coffee. The disadvantage of these pulpers is the large amount of water required for their operation. The variable quality achieved using demucilagers in this trial suggested that care needs to be taken in their set up, machine hygiene and operation. Care needs to be taken that no parchment is damaged and that all the mucilage is removed or if any mucilage is left on the parchment it does not ferment. It is recommended to check the quality output regularly. The very poor quality achieved from red fruit dried down suggests that over-mature samples (floating coffee from the factories) that contain even small amounts of red fruit will produce very poor quality if dry processed. A technique suggested (and practiced to some extent already) is to soak the over-mature/floating sample for long enough that it softens enabling it to pass through pulpers. This will pulp any red fruit in the sample allowing it to dry without fermenting greatly improving its quality.
Publications Drinnan, J.E. The influence of processing systems on the flavour of Australian Coffee –
abstract. International Horticultural Congress, Seoul, Korea, 2006.

30

31
The Influence of Processing Systems on the Flavour of Australian Coffee
James Drinnan Horticulture & Forestry Science, Department of Primary Industries and Fisheries, Mareeba, Queensland, 4880, Australia. [email protected] A research trial is being conducted in conjunction with the Australian Coffee Grower’s to determine the influence of various processing techniques (pulping, fermentation, dry processing) on the flavour profile of Australian coffee. Samples were evaluated by professional tasters using the Australasian specialty coffee association assessment criteria for aroma, acidity, body, flavour and after-taste. Results indicated that the processing style has a large influence on the quality and flavour of coffee. Green bean colour was best where the mucilage was completely removed by fermentation; followed by mechanical removal and the poorest was where mucilage was allowed to dry around the parchment, especially in unpulped fruit. Cupping evaluations indicated that samples pulped, but not fermented, consistently scored well with bold acidity, sweet fruity flavours, good body and aroma. As the level of fermentation increased, quality declined. Red fruit dried in their skins with no pulping produced the poorest quality coffee attributed to the extended fermentation during the drying process. Samples were described as over-fermented, astringent, defective, sour, bitter and over-ripe. When fruit was allowed to over-mature on the trees, over-fermentation was avoided and quality was greatly improved. Mechanically removing the mucilage rather than by fermentation generally resulted in very good quality. However, if all the mucilage was not removed and some fermentation occurred or the parchment was damaged, as occurred in the samples processed using a demucilager, quality was reduced. The presence or removal of mucilage around the parchment, and the amount of fermentation that takes place, are the biggest contributors to coffee quality during processing. Keywords: Coffee, processing, quality.

32
References Anon. 2001 Coffee Research Institute, Coffee Processing. Coffee Research Organisation p1-
10. Clarke, R.J. 1985. Green Coffee processing. In Coffee botany, biochemistry and production
of beans and beverage. Clifford, M.N. & Willson, K.C. Ed. 1985. Clarke, R.J. 1985. The technology of converting green coffee into the beverage. In Coffee
botany, biochemistry and production of beans and beverage. Clifford, M.N. & Willson, K.C. Ed. 1985.
Clowes M.St. J., Nicoll., W.D. and Shelley, R.S. (Eds) 1989. Coffee Manual for Malawi
1989. Tea Research Foundation of Central Africa. Davids, K. 2001. Processing: Flavour and Processing method in Coffee Review, reference
section p1-4. Gibson, A. and Butty, M. (1975). Over-fermented coffee beans “stinkers”. A method for
their detection and elimination in 7th International Colloquium on the Chemistry of Coffee. ASIC. Paris p141-152.
Goto, Y.B. and Fukanaga, E.T. 1985. Extension Circular 359, Hawaii Institute of Tropical
Agriculture. Kulaba, G.W. 1979. Coffee processing research a review Kenya Coffee 44, p23-34 Lemin, C.D. and Norris, C.P., 1997. Mechanisation and improved technology for coffee
processing – commercialisation of the Walkamin Coffee processing system. Final Report, DAQ95A, DAQ160A, RIRDC.
Menezes, H.C. and Clifford, M.N. 1987. The influence of stage of maturity and processing
method on the relation between the different isomers of caffeoilquinic acid in green coffee beans. Twelfth International Scientific Colloquium on Coffee, Monteux. Association Scientifique International du Cafe, 40 p377-381.
Northmore, J.M. 1969. Over-fermented beans and stinkers as defectives of Arabica coffee in
4th International Colloquium on the Chemistry of Coffee. ASIC. Paris p47-54. Oliveira, J.C., Amorim, H.V., Silva, D.M. and Teixeira, A.A. (1979). Effects of the origin,
pulping types and storage of coffee on the polyphenol oxidase activity and beverage quality. Cientifica p79-84.
Rothfos, B. 1985. Coffee Production. Gordian-Max-Rieck GmbH, Hamburg. Schaefer, C. 1999. Cupping: The elements of quality coffee. I need coffee. Selmar, D., Butof, G., Knopp, S.E., Bradbury, A., Wilkens, J. and Becker, R. Biochemical
insights into coffee processing: Quality and nature of green coffees are interconnected with an active seed metabolism. ASIC 2004. 20th international conference on coffee science, Bangalore India, p111-119.
Sivetz (1972). How acidity effects coffee flavour. Food Technology Champaign 26, p70-77.

33
Sutherland, K. 1990. Developments in Coffee Processing. Proceedings of the New South Wales Coffee Marketing Summit, Murwillumbah p51-53.
Vincent, J.C. 1987. Green Coffee Processing. Coffee Volume2: Technology. Eds. Clarke &
Macrae. Elsevier Applied Science, London p1-33. Violley, A., Sauvageot, F., Simatos, D. and Wojcik, G. (1981). Influence of some processing
conditions on the quality of coffee brew. Journal of Food Processing and preservation 5(3), p135-143.
Von Enden, J.C., 2002. Improvement of coffee quality and sustainability of coffee production
in Vietnam. GT2-ppp project. Winston, E.C. and Scudamore-Smith, P.D. 1989. Arabica Coffee Genetic Improvement,
liquoring quality and industry development. Final Report, ASRRC Project. Wrigley, G. 1988. Coffee. Longman Scientific and Technical Ltd., England.