influence of erythrocyte velocity on impedance plethysmographic measurements
TRANSCRIPT

Med. & Biol. Eng, & Comput., 1978, 16, 147-154
Influence of erythrocyte velocity on impedance plethysmographic measurements R . A . Peura B .C . Penney J. Arcur i
Biomedical Engineering Program, Life Sciences Department, Worcester Potytechnic Institute, Massachusetts, USA
F. A . A n d e r s o n J r . H . B . W h e e l e r
Department of Surgery, University of Massachusetts Medical School, Worcester, Massachusetts, USA
Abstract- - Impedance plethysmography has been widely used clinically. However, uncertainty exists concerning the source of the impedance signal. The present study was designed to indicate the relative contributions made by blood volume changes and blood flow changes. An in vi tro f low system containing a pulsatile pump, a bovine carotid artery, a rigid tube, and a terminal resis tance was assembled. Impedance recordings were made on both the expansile artery and the rigid tube. The impedance signal from the rigid tube was taken as the flow-related component. The signal from the expansile artery represented the combined effects of volume changes and flow changes. The recordings were made over the full physiological range of pulse pressures and peak flow values, using both normal saline and blood (haematocrit = 26 +_ 4%). No impedance change was detected in the rigid vessel using saline as the perfusate. When blood was used, the impedance signal from the rigid tube averaged about 10% of that from the expansile vessel and its morphology was different. Changes in erthrocyte velocity produced a small but definite change in the impedance signal recorded from the artery.
Keywords-- lmpedance plethysmography, Blood impedance, Rheography
1 Introduction IMPEDANCE plethysmography has been shown to be useful in evaluating the peripheral vascular system, especially in the detection of deep venous throm- bosis, WHEELER et al. (1975). However, the electrical impedance signal has been subject to question as to its exact nature. Most investigators maintain that the impedance signal primarily reflects blood volume changes (YOUNG et al. 1967; POWERS et aL 1958; NVBOER, 1959) but others suggest that the velocity related red blood cell effect is a significant contributor to the impedance signal (HIRSCH and LIEBMAN, 1974; SWANSON and WEBSTER, 1976). There is a lack of definitive data in the literature supporting either argument. The objective of this investigation was to measure the relative contribution of the blood volume change and the velocity related erythrocyte effect to the impedance signal.
2 Background The electrical impedance of flowing blood
differs from that of stationary blood (SIGMAN et al., 1937; VELIC~ and GORIN, 1940). This phenomenon is due to the red blood cells. For frequencies below 4-5 MHz, these cells are essentially non-conductors when compared with plasma (FRIcKE and MORSE, 1926). The electrical impedance of flowing blood is anisotropic (FREWER, 1972; KANAI et aL, 1973).
Received lOth June 1977
0140-0118/78/0712-0147 $1 �9 5010 �9 IFMBE: 1978
The impedance between longitudinal electrodes decreases when the blood flow is changed from a stationary to a flow state. However, when measured with transverse electrodes, the impedance increases with blood flow.
These, results can be explained in terms of the shape and orientation of the red cell. When the normal geometry of the red cells (biconcave discs) is modified to that of a sphere, by placing the ceils in a hypotonic solution, the impedance measurement is isotropic. In addition, the change in impedance due to flow is greatly reduced (GOLLAN and NAMO~q, 1970; KANA[ et aL, 1976).
In stationary blood the red cells assume a random distribution. Flow causes the plane of the red cells to become oriented parallel to the axis of the flow. The red cells are also subjected to shear forces which elongate the cells in the direction of flow (KANAI et al., 1976). In this way the red cells present mini- mum interference for current flow in an axial direc- tion, due to an end-on profile, and maximum inter- ference results in the transverse direction (TANAr~A et aL, 1970). The fraction of oriented red cells is a function of the blood shear rate. The impedance change is proportional to shear rate for low shear values and saturates at high rates (EDGERTON, 1974). With a hematocrit of 40~o, the impedance saturation value for transverse measurements is about 1 0 ~ greater than that for stationary blood and is reduced by 2 0 ~ in the longitudinal direction (KANAL et al., 1976).
Medical & Biological Engineering & Computing March 1978 147

The measurement of the electrical impedance of flowing blood is unidirectional. This insensitivity of impedance measurements to flow direction is due to the electrical symmetry of forward and reverse red cell motion. Sinusoidal flow, with oscillations about zero, produces a full wave rectification pattern in the electrical impedance signal. As the frequency of the sinusoidal flow is increased, the peak-to-peak impedance change decreases and the mean re- sistivity change increases. The peak-to-peak ira-
pedance change for a sinusoidal blood flow of 5 Hz is about one fifth of that at 0" 3 Hz (KANAI, et al., 1976).
3 Methods
To study the relative contributions of blood volume and blood velocity changes to the im- pedance plethysmographic signal, an in vitro model was set up in which blood was pumped in a pulsatile fashion through a bovine carotid artery and a rigid
O 0 E E
0.0c
. - 0
rn~ l<J
148 Medical & Biological Engineering & Computing March 1978

plastic tube, assembled in series with a variable peripheral resistance. Pressure and flow were measured. Impedance changes were measured both on the artery (which was expansile) and on the rigid plastic tube (which was non-expansile). Volume changes in the artery were recorded with a mercury- in-silastic strain gauge plethysmograph. Volume changes in the rigid tube were assumed to be negligible.
Fig. 1 shows a diagram of the in vitro flow system. Human blood or physiological saline was pumped from a reservoir by a Harvard Apparatus model 1405 pulsatile pump to a series circuit consisting of:
(i) an electromagnetic flow probe, Statham model SP 7518, placed on a bovine carotid artery; (ii) a freshly excised bovine carotid artery; (iii) a specially constructed rigid tube; (iv) a variable peripheral resistance and (v) an outflow reservoir.
Circumference changes in the expansile vessel were measured with a mercury strain gauge, Parks model 270, wrapped two times around the vessel. The strain gauge volume measurement system was calibrated by injecting a known volume of fluid into the expansile vessel. Fluid pressure was determined by means of a side pressure tap on the rigid vessel to which a pressure transducer, Hewlett Packard model 1280, was connected. Glass tubing and plastic connectors were used to connect the components of the series flow circuit together. The variable peri- pheral resistance consisted of a short segment (20 mm) of thick rubber tubing (5 mm i.d. x 15 mm o.d.) A compression clamp was applied to this rubber tube and the flow resistance was adjusted for a normal pulse pressure variation with a near zero minimum (diastolic) value.
The impedance of the expansile vessel was meas- ured using four circumferential electrodes (3" 4 mm wide). The electrodes were glued with epoxy resin to the inner surface of acrylite tubes which were split in half longitudinally. The inner diameter of the tubes (6" 5-9.5 mm) were such that they were slightly smaller than the outer diameter of the bovine carotid artery during minimum pressure. Fig. 2 shows the initial application of the impedance
Fig. 2 Electrodes being applied to bovine carotid artery
Fig. 3 Electrodes fully applied to artery Fig. 4 "Rigid vessel"
Medical & Biological Engineering & Computing March 1978 149
electrodes on the bovine carotid artery and Fig. 3 shows the electrodes completely applied. The electrode-tube system was held in place by a light elastic string which minimally compressed the artery. The inner two electrodes, which were utilised for the voltage pick-up, had a separation from 4 mm to 5 mm. The outer two electrodes were the current drivers, and were placed 25-30mm apart. The impedance change measured for the bovine carotid artery depended on both blood volume and re- sistivity changes with flow rate.
A 'rigid vessel' was employed to eliminate the volume change component of the impedance signal. This consisted of sections of acrylite tubes and copper electrodes (circular rings of copper tubing with a machined collar). The tubing sections were snuggly fit into the collars of the electrodes and glued into place. The result was a smooth inner tubing surface with a diameter of 9.5 mm. The inner surface of each electrode was 0- 8 mm wide and the voltage and current electrode spacing was 3'8 mm and 91 "5 ram, respectively. Fig. 4 shows the rigid vessel. The multiple electrodes allowed for changing the electrode spacing with ease. However, only two pairs were used in these experiments. A Minnesota Impedance Cardiograph model 304A was used for the impedance measurements on the rigid and ex- pansile vessels. Impedance, pressure, flow and vessel volume change were recorded on a Hewlett- Packard model 7754A, 4-channel strip chart recorder.
57 mrn Hg
2t8 m~/min
Pressure
0
Flow
0
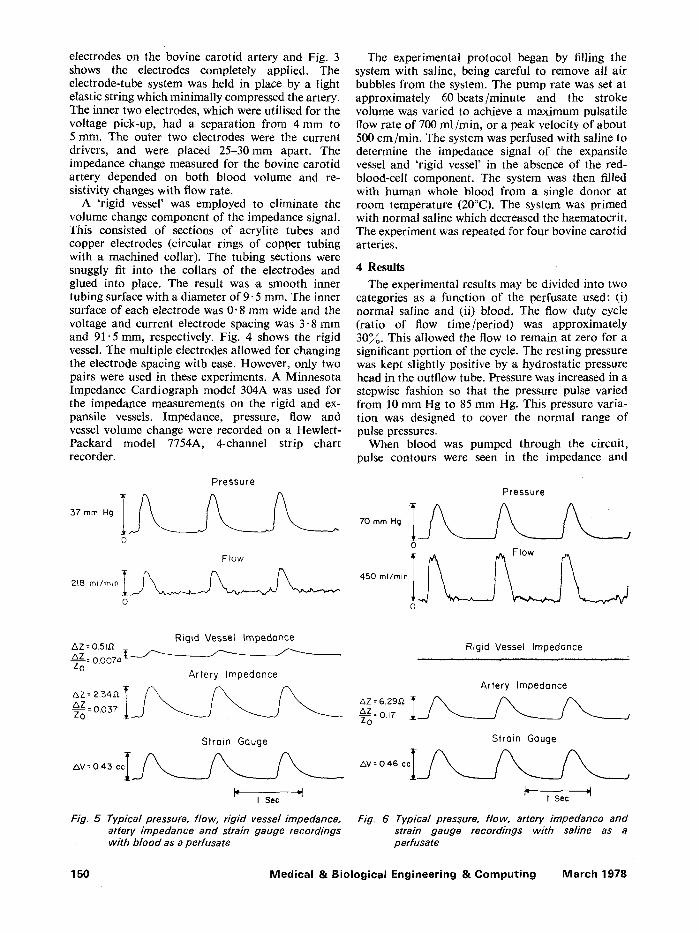
The experimental protocol began by filling the system with saline, being careful to remove all air bubbles from the system. The pump rate was set at approximately 60beats/minute and the stroke volume was varied to achieve a maximum pulsatile flow rate of 700 ml/min, or a peak velocity of about 500 cm/min. The system was perfused with saline to determine the impedance signal of the expansile vessel and 'rigid vessel' in the absence of the red- blood-cell component. The system was then filled with human whole blood from a single donor at room temperature (20~ The system was primed with normal saline which decreased the haematocrit. The experiment was repeated for four bovine carotid arteries.
4 Results
The experimental results may be divided into two categories as a function of the perfusate used: (i) normal saline and (ii) blood. The flow duty cycle (ratio of flow time/period) was approximately 30~. This allowed the flow to remain at zero for a significant portion of the cycle. The resting pressure was kept slightly positive by a hydrostatic pressure head in the outflow tube. Pressure was increased in a stepwise fashion so that the pressure pulse varied from 10 mm Hg to 85 mm Hg. This pressure varia- tion was designed to cover the normal range of pulse pressures.
When blood was pumped through the circuit, pulse contours were seen in the impedance and
Pressure
0
0
Rigid Vessel Impedance AZ = 0.5LG Z&._ZZ = 0.0074 [ ~ ~ ~ - Z0
Artery Impedance
&Z = 2.34.0. ~ / ~ / ~ / ~ ~o Z= 0.057
Strain Gauge
&V = 0"43 c c I ~ I Sec
Fig. 5 Typical pressure, flow, rigid vessel impedance, artery impedance and strain gauge recordings with blood as a perfusate
Rigid Vessel Impedance
Artery Impedance
Z&Z = 6.29,D,
Strain Gauge 3 r ~
AV = 0.46 ccI / ~ . _ / ~ / ~ '
I Sac
Fig. 6 Typical pressure, flow, artery impedance and strain gauge recordings with saline as a perfusate
150 Medical & Biological Engineering & Computing March 1978

mercury strain gauge measurements from the artery. A small, but definite impedance pulse was also recorded from the rigid plastic tube. This was present despite the fact that a volume change could not occur in the rigid tubing. Typical pressure, flow, impedance, and strain gauge waveforms are shown in Fig. 5.
When the same experiment was performed with saline, pulsations were once again recorded from the artery with both impedance and strain gauge plethysmographs. However, no longer was there a detectable impedance pulse from the rigid tube. The effect previously observed with blood did not occur with an electrolyte solution free from red blood cells
Impedance
Strain Gauge
Fig. 7 Comparison of artery impedance and volume pulses with saline as a perfusate. A =maximum amplitude of the artery impedance and B =maximum amplitude of the strain gauge
Rigid Vessel impedance
Artery Impedance
Strain Gouge
Fig. 8 Comparison of rigid vessel impedance, artery impedance and volume pulses with blood as a perfusate. C =maximum amplitude of the rigid vessel impedance, D =maximum ampfi- tude of the artery impedance and E =maximum amplitude of the strain gauge.
(Fig. 6). The strain gauge and impedance waveforms from the artery are essentially identical in shape for normal saline as the perfusate. When blood is used, the waveforms are somewhat different, as seen in Fig. 5.
The above observation can be seen more closely by comparing Figs. 7 and 8, where the maximum, 1/2 maximum and 1/4 maximum amplitude values of the strain gauge (volume) and impedance pulses are designated on the time axis. In Fig. 7, for saline, it can be seen that these amplitude values essentially coincide. When blood is used as the perfusate, these amplitude values do not line up as in the previous case as shown in Fig. 8. The downslope of the volume pulse is relatively rapid, when compared with the impedance signal. The slowest signal to return to the baseline is the rigid vessel impedance. A logical explanation for this is that the morphology of the artery impedance pulse is not only a function of blood volume, but also a red blood cell effect.
Fig. 9 is a plot of normalised impedance change (impedance change/resting baseline impedance in
-~(%)
to -
9 -
8 -
7 -
6 -
5
4
3
2
I
o o
-•-OZ(%) vs Peak Flow Velocity
o
O'
0
o o
o
o o
I �9 = R i g i d Vessel
O 0 0
0 �9 �9 �9 O 0
o ~# o=,�9 �9 ~
i i t
: 260 400 660 Peek Flow Velocity (Cm/Min)
Fig. 9 Normalised impedance change, ~Z/Zo (impedance change/baseline impedance in %) peak flow velocity for four artery experiments with an average hematocrit=26+_4%. The open circles, �9 represent the artery impedance and the closed circles, 0, the "rigid vessel" impedance
Medical & Biological Engineering & Comput ing March 1978 151

~ ) vs. peak blood flow velocity for four individual carotid artery experiments. The blood haematocrit was 26 + 4Yo. The regression equation for the ex- pansile vessel has a slope of 0.015 and a y-intercept of - 0.94 with a correlation coefficient of 0.73. For the 'rigid vessel' the slope is 0.0012, and the y- intercept 0.083, with a correlation coefficient of 0.65.
5 Discussion
Our results show that the velocity-related erythro- cyte component of the impedance signal is a small fraction (in the order of 10~) Of the total im- pedance signal as measured for the in vitro artery model studied here. The magnitude of this erythro- cyte effect is relatively unimportant for gross clinical measurements but may be important when a careful examination of the morphology of the impedance waveform is made. With higher values of haematocrit, than used in these experiments, this erythrocyte velocity effect may contribute a pro- portionately higher amount to the impedance signal. This prediction is based on the fact that the re- sistivity of blood increases proportionately to the haematocrit (GEDDES and DA COSTA, 1973). I t is expected that the velocity related erythrocyte effect on the impedance signal will have particular importance for the arterial pulse contour, as opposed to the slower venous flow variations. The erythrocyte contribution may be even more pronounced in vivo with normal pressure variations and for vessels with high blood velocities.
The velocity related erythrocyte component of the impedance plethysmographic signal appears to contribute a small but measurable port ion to the fast outflow portion on release of venous occlusion and makes a somewhat larger contribution to arterial pulsation measurements, (ANDERSON et al., 1977b). Fig. 10 shows typical impedance and
mercury strain-gauge recordings from the human calf during venous occlusion. As venous pooling occurs, the volume of the extremity increases. Since more blood is present, the impedance de- creases. On release of the cuff, the impedance recording occasionally shows a characteristic 'kick' (or further impedance decrease) and the outflow recording is usually slightly delayed with respect to the strain gauge recording. This outflow pheno- menon may be explained if the velocity related erythrocyte effect is considered. With a release of the venous occlusive cuff the red cell orientation and shape changes abruptly due to increased blood velocity, causing a further decrease in impedance. The superimposition of this red cell component of the impedance signal on that due to volume changes explains the observed phenomenon.
Arterial pulsations as measured on the human calf by impedance plethysmography and mercury strain gauge are slightly dissimilar (Fig. 11). The impedance pulse normally has a faster systolic slope, is wider and the decreasing systolic slope is less than the mercury strain gauge (WHEELER et al., 1978). This phenomenon is similar to those observed in our in vitro bench studies suggesting that the artery impedance signal is due to both a volume and red blood cell component.
Our results compare favourably with other investigators who have studied velocity related erythrocyte effects in vivo. HIRSH and LIEBMAN (1974) showed in a study using rigidly encased segments of cat femoral and carotid arteries that the red blood cell contribution was 2 0 ~ of the total impedance pulse amplitude during control blood flow and increased with increases in cardiac output and decreases in peripheral resistance. SWANSON and WEaSTER (1976) investigated the effect of velocity related erythrocyte effects on the impedance signal by placing a subject's arm in a rigid cylinder filled
Volume (Strain Gouge)
Fig. 10 Comparison of venous occlusion plethFsmogra p h y using impedance and mercury strain gauge
Differential (Volume -Impedance)
152 Medical & Biological Engineering & Computing March 1978

0.02% V
J L
-002% Z j-q_
Volume (Strain Gauge)
Impedance (22 KHz)
Differential (Volume - Impedance)
Doppler (Unidirectional)
Fig. I 1 Comparison o f arterial pulses as measured on the human calf wi th the impedance and mercury strain gauge plethysmo- graphs. ~ Doppler b lood velocity (un id i r e c t i o n a I ) measured on 'the posterior t ib ia l artery at the ankle
with saline with a resistivity equivalent to that of blood. The effect of blood volume changes were considered to be nulled out and thus the red blood cell component of impedance for the segment of the arm between the voltage sensing electrodes (wrist to upper forearm) was found. Data from two subjects showed significant impedance changes not asso- ciated with blood volume. They found that both the shape and magnitude of the impedance pulse may be altered by flow-dependent changes of blood im- pedance, but changes in blood volume are the primary origin of the impedance pulse.
6 Summary
Using an in vitro flow system, the relative con- tribution of the blood volume change and the erythrocyte velocity change to the impedance signal was examined. This component was approximately 109/oo of the total impedance signal (for haematocrits of 26 _+ 4~o) and influenced the morphology of the arterial impedance pulse. These results can be ex- plained in terms of the change in conductivity of f lowing blood due to changes in shape and orienta- tion of the ied blood cells.
Acknowledgments--This work was supported, in part, by a National Science Foundation Grant G 11514, EPP-75- 08986, and a Max C. Fleischmann Foundation Grant. The technical assistance of Charles Keisling is gratefully acknowledged.
References ANDERSON, F. A., Jr., PEURA, R. A., PENNEY, B. C. and
WHEELER, H. B. (1977) Comparison of electrical impedance and mechanical plethysmographic tech- niques in the human calf. Proceedings: Association for the Advancement of Medical Instrumentation 12th Annual Meeting 281.
EDGERTON, R. H. (1974) Conductivity of sheared suspensions of ellipsoid particles with applications to blood flow, IEEE Trans., BME-21, 3343.
FREWER, R. A. (1972) Effect of frequency changes on electrical conductance. Med. & BioL Eng. 10, 734-744.
FRICKE, H. and MORSE, S. (1926) The electric resistance and capacity of blood for frequencies between 87 kHz- 4.5 MHz. J. Gen. Physiol. 9, 153-167.
GEDDES, L. A. and DA COSTA, C. P. 0973) The specific resistance of canine blood at body temperature. IEEE Trans. BME-20, 51-53.
GOLLAN, F. and NAMON, R. (1970) Electrical impedance of pulsatile blood flow in rigid tubes and in isolated organs. Ann. NYAcad. Sci. 170, 2, 568-576.
HIRSCH, E. M. and LIEBMAN, F. M. (1974) A rheographic comparison of electrical conductance in volume- restricted and a volume-unrestricted vascular segment. Federation Proceedings 33, 334.
KANAI, H., NAKAYAMA, K. and ONO, N. (1973) Im- pedance of blood: the effects of the orientation of red blood cells. Digest of the 10th International Conference on Medical and Biological Engineering 328.
KANAI, H., SAKAMOTO, K. and MIKt, i . (1976) Im- pedance of blood; the effects of red cell orientation. Digest of the 11 th International Conference on Medical and Biological Engineering 238-239.
NYBOER, J. Electrical impedance plethysmography. (1959) Charles, C. Thomas, Springfield, Ill.
POWERS, S., SCHAFFER, C., BOBA, A. and NAKAMURA, Y. (1958) Physical and biological factors in impedance plethysmography. Surgery 44, 53-62.
SIGMAN, E., KOL1N, A. and KATZ, L. N. (1937) Effects of motion on electrical conductivity of the blood. Am. J. Physiol. 118, 708-719.
SWANSON, D. K. and WEBSXER, J. G. (1976) Origin of the electrical impedance pulse in the limbs. Proceedings 29th Annual Conference on Engineering in Medicine & Biology 18, 324.
TANAKA, K., KANAI, H., NAKAYAMA, K. and ONO, N. (1970) The impedance of blood: the effects of red cell orientation and its application. Japan J. Med. Electron. & JBioL Rng., 8, 14-21.
Medical & Biological Engineering & Comput ing March 1978 153

VELICI(, S. and GORIN, N. (1940) The electrical conduct- ance of suspensions of ellipsoids and its relation to the study of avian erythrocytes. J. Gen. Physiol. 23, 753-771.
WHEELER, H. B., O'DONNELL, J. A.., ANDERSON, F. A., Jr., PENNEY, B. C., PEURA, R. A., BENEDICT, K., Jr. (1975) Bedside screening for venous thrombosis using impedance phlebography. Angiology, 26, 2, 199-209.
WHEELER, lq[. B., PENNEY, B. C., ANDERSON, F. A. Jr., and PEURA, R. A. 0978) Impedance plethysmography: theoretical and experimental basis in non-invasive diagnostic techniques in vascular disease, in BERNSTEIN, E. F. (Ed.), St Louis, Missouri, C. V. Mosby.
YOUNG, D. G., COX, R. H., STOVER, E. K. and ERDMAN, W. J. II, (1967) Evaluation of quant:,tative impedance ment. III Blood flow determination in vivo. Am. J. Phys. Med. 46, 1450-1457.
Influence de la v61ocit6 6rythrocyte sur les mesures d'imp6dance pl6thysmographiques
Sommaire--L'usage de la pl6thysmographie d'imp6dance est largement r6pandu en clinique. I1 reste toute- fois des doutes au sujet de la provenance du signal d'imp6dance. Cette 6tude vise b. 6tablir les contri- butions apport6es par les changemertts de volume et de circulation du sang. Apr~s construction d'un syst~me de circulation in vitro, compos6 d"une pompe pulsatile, d'une carotide de boeuf, d'un tube rigide et d'une r6sistance terminale, on enregistra l'imp6dance sur l'art~re et le tube. Le signal 6mis par l'art6re souple se r6v61a ~tre une repr6sentation des effets combin6s des changements de volume et de circulation. Les enregistrements furent effectu6s sur toute la gamme physiologique des tensions diff6rentielles et des valeurs de circulation maximale, b. l'aide de saline normale et de sang (hdmato- cr i te=26+ 4~) . Aucun changement d'imp6dance ne fut d6tect6 dans le vaisseau rigide, lors de l'emploi de la saline somme perfusat. Avec le sang, le signal d'imp6dance 6mis par le tube rigide se situait autour de 10~o de celui du vaisseau souple, et sa morphologie 6tait diff6rente. Des change- ments se produisirent 6galement dans la v61ocit6 6rythrocyte, qui entrain~rent un changement 16ger, mais tr~s net, dans le signal d'imp6dance enregistr6 dans l'art~re.
Die Beeinflussung plethysrnographischer Irnpedanzmessungen durch die Erythrocyten- Geschwindigkeit
Zusammenfassung--Widerstandsplethysmographie wird im klinischen Bereich weitverbreitet angewendet. Es besteht jedoch eine gewisse Untersicherheit hinsichtlich der Quelle des lmpedanzsignals. Die vor- liegende Arbeit zielt darauf ab, darzulegen, welche Auswirkungen Veranderungen in Blutvolumen und Blutdurchflul3 hierauf haben. Ein in vitro Durchflu6sytem mit einer Pulsierpumpe, der Hals- schlagader eines Rinds, einem starren Rohr und einem Endwiderstand wurde zusammengebaut. Der Widerstand wurde sowohl an der dehnbaren Arterie wie an dem starren Rohr gemessen. Das Widerstandssignal an dem starren Rohr wurde als durchflul3bezogene Komponente angenommen. Das Signal yon der dehnbaren Arterie stellte die kombinierte Wirkung von Volumen- und Durch- flul3ver/inderungen dar. Es wurde Messungen ftir den gesamten physiologischen Pulsdruckbereich und Spitzendurchflul3werte angestellt, wobei sowohl normale Salzl~sung wie Blut (H~tmatokrit= 26_+ 4~o) verwendet wurde. Im starren Gef~g wurde bei der Verwendung von Salzl/Ssung als Perfusat keinerlei Ver~inderung des Widerstands beobachtet. Wurde Blur verwendet, ergab sich fiir das starre Rohr ein Widerstandssignal, das durchschnittlich bei etwa 10~ des Signals des dehnbaren Gef/ilBes lag und dessen Morphologie unterschiedlich war. Veranderungen in der Erythrocytenge- schwindigkeit ergaben eine kleine, aber definitive Vergnderung des Widerstandssignals bei der Arterie.
154 Medical & Biological Engineering & Computing March 1978