the vibration plethysmographic method of arterial
TRANSCRIPT
PHYSIOLOGICAL RESEARCH • ISSN 0862-8408 (print) • ISSN 1802-9973 (online) © 2014 Institute of Physiology v.v.i., Academy of Sciences of the Czech Republic, Prague, Czech RepublicFax +420 241 062 164, e-mail: [email protected], www.biomed.cas.cz/physiolres
Physiol. Res. 63 (Suppl. 4): S489-S495, 2014
The Vibration Plethysmographic Method of Arterial Compliance Analysis in Dependence on Transmural Pressure
J. MOUDR1, J. SVAČINOVÁ1, E. ZÁVODNÁ2,1, N. HONZÍKOVÁ1
1Department of Physiology, Faculty of Medicine, Masaryk University, Brno, Czech Republic, 2International Clinical Research Center, St. Anne’s University Hospital Brno, Brno, Czech Republic
Received March 14, 2014 Accepted July 28, 2014
Summary The aim of this study was to obtain a detailed analysis of the relationship between the finger arterial compliance C [ml/mm Hg] and the arterial transmural pressure Pt [mm Hg]. We constructed a dynamic plethysmograph enabling us to set up a constant pressure Pcss [mm Hg] and a superimposed fast pressure vibration in the finger cuff (equipped with a source of infra-red light and a photoelectric sensor for the measurement of arterial volume). Pcss could be set on the required time interval in steps ranging between 30 and 170 mm Hg, and on sinusoidal pressure oscillation with an amplitude Pca (2 mm Hg) and a frequency f (20, 25, 30, 35, 40 Hz). At the same time continuous blood pressure BP was measured on the adjacent finger (Portapres). We described the volume dependence of a unitary arterial length on the time-varying transmural pressure acting on the arterial wall (externally Pcss+Pca.sin(2πf), internally BP) by a second-order differential equation for volume. This equation was linearized within a small range of selected BP. In the next step, a Fourier transform was applied to obtain the frequency characteristic in analytic form of a complex linear combination of frequency functions. While series of oscillations [Pca, f] were applied for each Pcss, the corresponding response of the plethysmogram was measured. Amplitude spectra were obtained to estimate coefficients of the frequency characteristic by regression analysis. We determined the absolute value: elastance E, and its inverse value: compliance (C=1/E). Then, C=C(Pt) was acquired by applying sequences of oscillations for different Pcss (and thus Pt) by the above-described procedure. This methodology will be used for the study of finger arterial compliance in different physiological and pathological conditions.
Key words Arterial compliance • Finger arterial pressure • Plethysmography • Transmural arterial pressure • Frequency characteristic
Corresponding author J. Svacinova, Department of Physiology, Faculty of Medicine, Masaryk University, Kamenice 5, CZ-625 00 Brno, Czech Republic. E-mail: [email protected]
Introduction
Arterial compliance is a property of the arterial wall enabling a dampening of the amplitude pulse wave. Compliance is defined as a volume difference induced by the pressure difference. Elastance is a reciprocal value of compliance and it decreases with age. A low compliance is frequently a marker of endothelial dysfunction and of changes in the structure of the arterial wall and results in different pathological states. Most complications are associated with the metabolic syndrome (Neutel et al. 1992).
Arterial compliance becomes impaired at an early stage of hypertension when arterial pressure may be only slightly elevated (Ventura et al. 1984). A low compliance of great arteries as a sign of angiopathy is one of the predictors of cardiovascular risks like an ischemic heart disease, myocardial infarction, or stroke.
The methods of arterial compliance measurement are direct and indirect. Direct methods are based on pulsatile pressure measurement (taken invasively or non-invasively) and pulsatile diameter changes within the artery. The pulsatile diameter of great arteries could be obtained by angiography, echocardiography, magnetic resonance, and an intravascular wall motion detector. The compliance of middle or small arteries was measured by Doppler velocimetry, two-dimensional ultrasound or plethysmography. Intravascular ultrasound is a method
https://doi.org/10.33549/physiolres.932929

S490 Moudr et al. Vol. 63 assessing pulmonary, aortic, coronary and brachial arterial compliance (Nakatani et al. 1995).
Compliance can also be evaluated from the arterial pulse-wave contours obtained intra-arterially together with hemodynamic estimates (Neutel et al. 1992).
Indirect methods reflect non-invasive estimations of the compliance conditions (but not absolute values) of great arteries. Compliance can be estimated by pulse-wave velocity, non-invasive pulse-wave contour analysis (augmentation index, Buckberg index, spectral analysis) (Yasmin and Brown 1999), by Fourier analysis of pressure and flow waveforms, or by the stroke volume/pulse pressure ratio. Structural changes of the arterial wall (mainly aorta and carotids) are visible and measurable by ultrasound as a higher intima-media thickness.
In the last ten years researchers focused on the study of the arterial pressure-volume relationship and the corresponding arterial compliance by photoplethysmo-graphic methods. Finger photoplethysmography is a measurement technique enabling detection of arterial blood volume changes in the finger in relationship to pressure changes in the finger arteries. The finger cuff contains two optoelectronic components: an infrared light source to illuminate the tissue and a photodetector for the measurement of the small variation in light intensity associated with changes in perfusion of finger vessels. The principle of photoplethysmography is used also in continuous blood pressure measurement according to Penaz (e.g. Finapres).
Previously, we developed a new method for studying the viscoelastic properties of finger arteries and we used for this method a term vibration plethysmography (Penaz et al. 1997). In principle, relatively fast vibrations (50 Hz) were superimposed on a slowly changing pressure in the finger cuff and the evoked oscillation changes in vascular volume were measured by a photo-electric sensor as the vibration plethysmogram. This signal was split into two components: the normal photo-electric plethysmogram obtained by filtering out the fast components, and the waveform of dynamic vascular compliance. The continuous blood pressure was measured on an adjacent finger (Finapres 2300). Both cuffs were necessary for transmural pressure computation from differences between blood pressure and applied pressure. The shape and polarity of the dynamic vascular compliance waveform depended upon transmural pressure (blood
pressure – cuff pressure). It was biphasic with maximal value at transmural pressure slightly lower than mean blood pressure, whereas the normal photo-electric plethysmogram was nearly proportional to the transmural pressure.
Similar techniques, i.e. combination of two photoplethysmographic finger cuffs are used in the last decade: One cuff is used for a continual blood pressure measurement from one finger. The other cuff on the adjacent finger is used for estimation of the relationship between the amplitude of volume changes and the pressure changes applied in the cuff expressed as transmural pressure changes (Talts et al. 2006). The estimated values are substituted as parameters in the mathematical pressure-volume model based, for example, on an exponential function (Tanaka et al. 2011) or an asymmetric arctangent function (Talts et al. 2006).
The aim of this study was to develop a new modification of a vibration plethysmographic method of an arterial compliance analysis in dependence on the transmural pressure. Finally, we analyzed the compliance of a group of volunteers. Methods Theoretical background of the dynamic pressure-volume relationship
In summary, the pressures acting on the arterial wall are as follows: blood pressure BP(t) is acting on the inner side of the arterial wall, the applied cuff pressure Pc(t) is acting on the outer side of the arterial wall, and the transmural pressure Pt(t) is the resultant pressure originating from the elastance of the arterial wall in dependence on volume. The pressures are time-varying, therefore we have to consider pressure Pd(t) given by dissipative forces (which act against the moving mass in the viscose environment, mainly against blood flow) and pressure Pi(t) given by inertial forces (caused by acceleration of the moving mass).
From the physical analysis of the problem, we derive the equation for the dynamic equilibrium of pressures acting on the arterial wall during its movement in radial direction, and hence for the volume changes during time. This equation expresses pressures Pi, Pd and Pt as functions of the volume v(t) and derivatives of v(t). ( ) − ( ) = ( ), ( ) + ( ), ( ) + ( )
(1)

2014
Fig. 1. AboveThere is an idifferent Pt andand a responsarterial volumea derivation of
It isdependence transmural prbe expresseapproximated ( ) =
Fig. 2. A (lefvolume vibratiosuitable for sppressure vibravibration. Freqserve to a freq
e: curve of volullustration of ad constant ampse to this prese vibrations at Δf the volume-pre
s known fromof volume oressure Pt is ned by an d by the funct
1 + ( )
ft): an exampleon obtained by pectral analysisation. B (rightquency fm: an equency characte
ume v(Pt) at traa sinusoidal prplitude Pca applissure vibrationsΔv(Pt). Below:essure curve v(P
m many obseof unitary artnon-linear. Th
asymmetric tion:
∙ 1 + (
e of 4 s lastingphotodiode (fil
. B (right) abt) below: specexample at one eristic computati
ansmural pressuressure vibratioed by the finge in the form o compliance C(Pt).
ervations thatterial lengthhis dependence
sigmoid o
)
g recordings. BPtered signal). I
bove: spectrumctrum of volumvibration frequon; see in the t
Vibration Ple
ure Pt. ons at er cuff of the (Pt) as
at the v on e can often
(2)
whev(Pt)funcstart
is ththe e
presFourhavethis form ( forvibrPca aare gin th
P(t): blood presn the frame is
m of applied preme vibration v(tuency. (These atext.)
ethysmographic M
ere A is the mt)). Coefficienction (2). Po dt axis Pt. The d
( ) = ( ) =he complianceelastance (Fig
To compssure-volume rier transforme to linearize eapproach we
m in terms of
( ) ( )⁄a steady-statation pressurearound the pogiven by the
he finger cuff
ssure, Pca(t).sinan example of essure vibrationt), where A(j2πmplitudes at di
Method of Arteria
maximal volumnts a and bdefines the shderivation of v
= 1 ( )⁄e C(Pt) and th. 1).
pute the frequrelationship
m on volume vequation (2) bget the freque
e oscillation e Pca.sin(2πf.t)oint [Pt0, v0] oadjustable co(Fig. 2).
(2πfmt): cuff prone end-diaston; Pca(j2πfm, Pt0πfm, Pt0n) is an fferent frequen
al Compliance An
me (asymptotb describe ahift function rvolume v(Pt)
he reciprocal v
uency charactby the ap
v(t) and pressby a Taylor poency response
excited by tt) with a "smaof function (2
onstant pressu
ressure vibratioolic part of the a
0n) is an amplitamplitude of
ncies and transm
nalysis S491
te of functionsymmetry ofrelative to the
(3)
value E(Pt) is
teristic of thepplication ofsure Pc(t), weolynomial. Bye in analytical
(4)
the harmonicall" amplitude2). Values Pt0
ure values Pcss
on, filtered v(t):analyzed curvestude of appliedarterial volume
mural pressures
1
n f e
)
s
e f e y l
)
c e 0 s
: s d e s

S492 Moudr et al. Vol. 63
The conditions of the steady oscillations mentioned above are relatively well fulfilled for the end of the diastolic pulse curve: for t from the time-interval I = (td − Tp/4, td), where td is a moment of the end-diastolic pressure, and Tp/4 is a quarter of the pulse interval. In this interval, blood pressure changes are the smallest. The duration of I is sufficient for the application of harmonic analysis for the lowest test frequency of pressure vibration (20 Hz), as documented in Figure 2.
Direct components on both sides of the equation of a dynamic balance of pressures are equal within the case of a small volume amplitude Δv(t) around a point [Pt0, v0].
Expressing the pressure vibration and the corresponding volume vibration in complex form, we get the frequency characteristic of the vibration transmitted by the arterial wall: ( 2 , ) = ( 2 , ) ( )⁄ = = 1 ( ( ) − (2 ) + 2 ( ))⁄ (5)
The modulus of F(j2πf, Pt0n) can be expressed as a network of the amplitude frequency characteristics | ( 2 , )| = | ( 2 , )| | ( 2 , )|⁄ (6) for a vector of frequencies [fm], m = 1, 2,…, M of the pressure vibrations transmitted and a vector of transmural pressures [Pt0n], n = 1, 2,…, N. The amplitudes A(j2πfm, Pt0n) are obtained by a fast Fourier transform (FFT) on the observed volume vibrations Δv(t). Pca is slightly influenced by the transmural pressure, therefore the amplitudes Pca(j2πfm,Pt0n) are obtained by an FFT of the Pca(Pt0).sin(2πft) (Fig. 2).
The compliance C(P ) = 1 E(P )⁄ (7)
is a static feature of the arterial wall and can be considered as a frequency characteristic |F(j2πfm,Pt0n)| at frequencies f=0. A reason for this consists in the fact that the amplitudes of transmitted vibrations decrease with increasing vibratory frequency. This is caused by the inertial forces of the moving tissues. To compute C(Pt0), we use a real part of the reciprocal form of a frequency characteristic (5) as a regression function with a vector [fm] as an argument of the predictor ( 2 , ) = ( ) − (2 ) ∙ (8)
The results are the value of the elastance E(Pt0n) and the compliance C(Pt0n) as a reciprocal value of E(Pt0n). Measurement procedures
Measurement conditions and finger cuff setting The resting measurement was carried out at
room temperature (24 °C), in sitting position without movements and at a state of the subject when the fingers were not cold. The volunteers did not take any vasoactive drugs before the measurement. Firstly, values of systolic and diastolic blood pressure were taken by the classic oscillometric method. Then, the finger cuff for continual blood pressure measurement (Portapres) was placed on the middle phalanx of the fourth finger. The occlusion finger cuff for the application of pressure vibration was placed on the middle phalanx of the third finger.
Normalization of the arterial volume The especially modified occlusion finger cuff
was equipped with a source of infrared light and a photoelectric sensor for the measurement of arterial volume. The absorption of infrared light by the finger tissue was dependent on arterial volume. The finger cuff was inflated on a constant pressure Pcss of 30 mm Hg (without vibrations) and the photoelectric signal was measured. This value was considered as 100 % of the maximal arterial volume. After that, the finger cuff was inflated on a pressure Pcss of 170 mm Hg. The arteries were closed at this pressure. The light passing through the tissue at a pressure of 170 mm Hg was considered as 0 % of the maximal arterial volume. By this approach the arterial volume could be indicated in units of % of the maximal volume. As a result we obtain frequency characteristics normalized to the arterial volume.
Measurement protocol The finger cuff operated on the artery at a
pressure Pc(t) = Pcss + Pca.sin(2πf t). The pressure sequentially took 10 values Pcss from 170 to 30 mm Hg. The pressure vibrations Pca.sin(2πf t) of a constant amplitude Pca=2 mm Hg and frequencies f=(20, 25, 30, 35, 40) Hz were sequentially superimposed to each pressure value Pcss. Thus we used 5 x 10 combinations of Pc(t) settings. Each pressure Pc(t) was applied for a time interval lasting 5 seconds. Simultaneously, we recorded the arterial volume vibration v(t) as a response to the pressure vibrations Pc(t). Finally, the frequency
2014
characteristictransmural pr Subjects
Theespecially de6 young hea
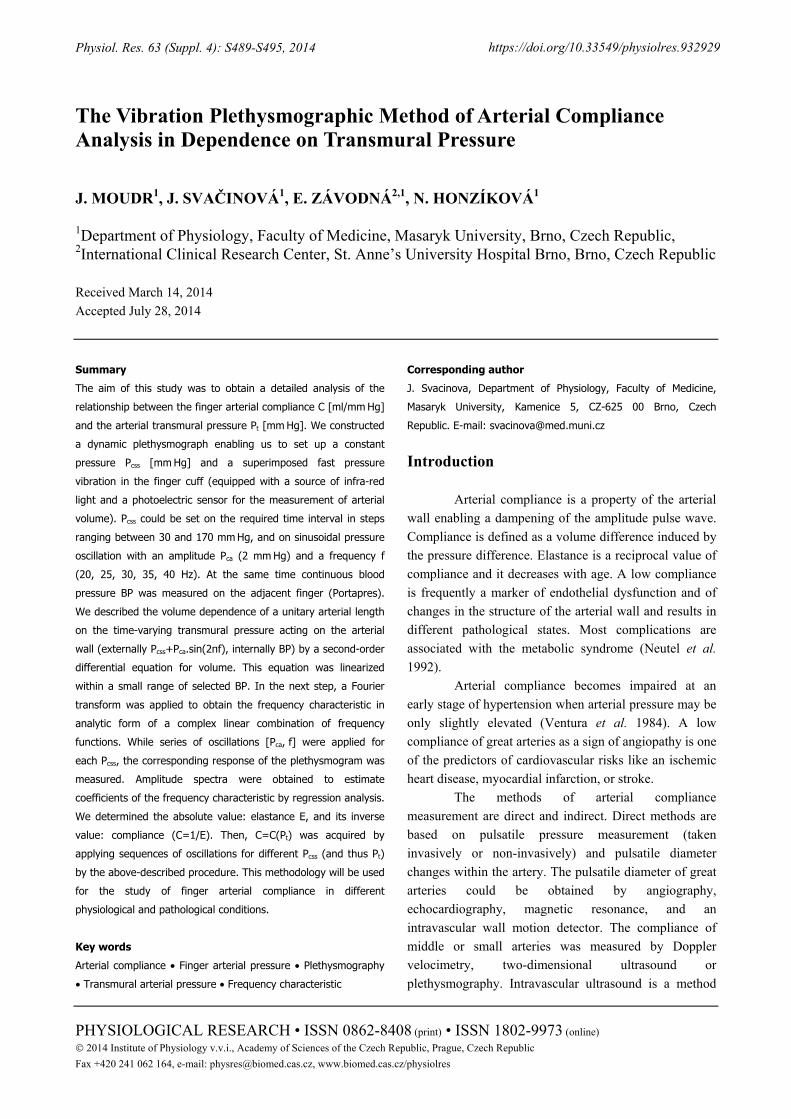
Fig. 3. Networon vibration f(normotensive
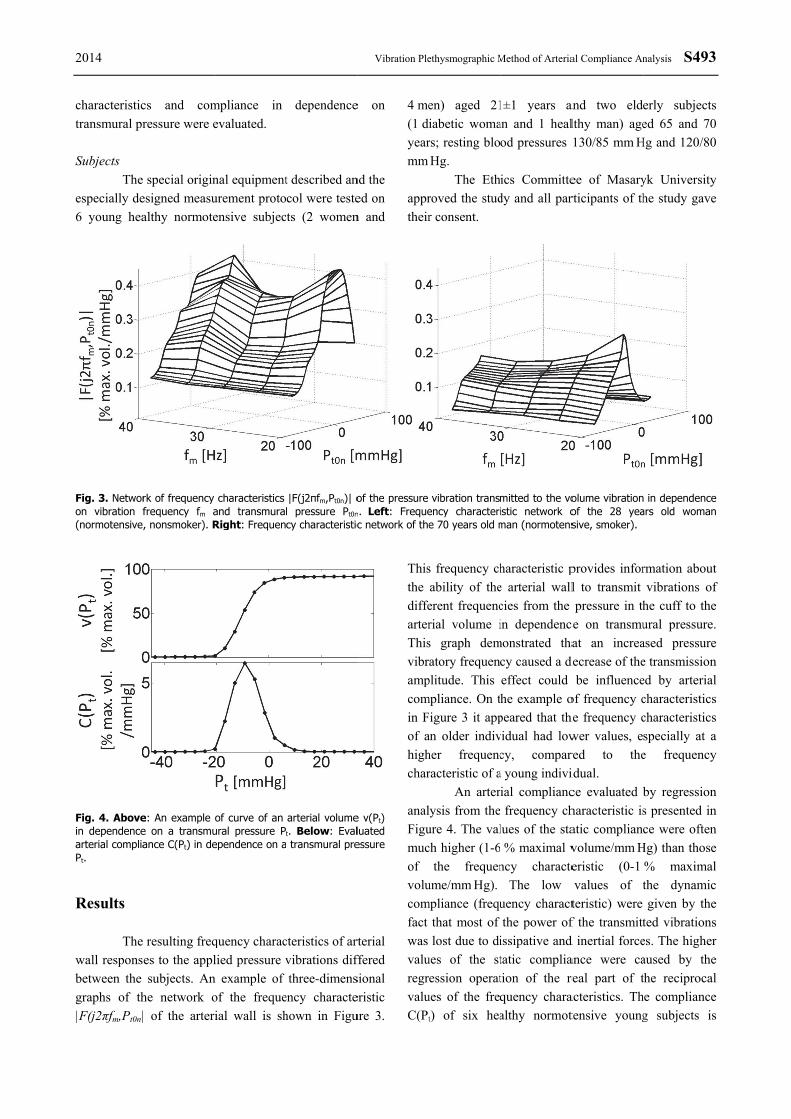
Fig. 4. Abovein dependencearterial compliaPt. Results Thewall responsbetween the graphs of th|F(j2πfm,Pt0n|
cs and comressure were e
special originesigned measualthy normote
rk of frequency frequency fm a, nonsmoker). R
e: An example e on a transmuance C(Pt) in de
resulting freqes to the applsubjects. An
he network o of the arter
mpliance in evaluated.
nal equipmenturement protoensive subjec
characteristics and transmuraRight: Frequen
of curve of an ural pressure Pependence on a
quency characlied pressure v
n example of of the frequeial wall is sh
dependence
t described ancol were teste
cts (2 women
|F(j2πfm,Pt0n)| ol pressure Pt0ncy characteristic
arterial volumet. Below: Eval transmural pre
cteristics of artvibrations difthree-dimens
ency charactehown in Figu
Vibration Ple
e on
nd the ed on n and
4 me(1 diyearmm
apprtheir
of the pressure n. Left: Frequec network of the
e v(Pt) luated essure
rterial ffered sional eristic ure 3.
Thisthe diffearterThisvibrampcomin Fof ahighchar
analFigumucof volucomfact was valuregrvaluC(Pt
ethysmographic M
en) aged 21iabetic womars; resting bloHg.
The Ethroved the studr consent.
vibration transency characterie 70 years old m
s frequency chability of theerent frequencrial volume is graph dematory frequen
plitude. This mpliance. On tFigure 3 it appan older indivher frequencracteristic of a
An arterlysis from theure 4. The valch higher (1-6
the frequenume/mm Hg).
mpliance (frequthat most of lost due to di
ues of the stession operat
ues of the freqt) of six hea
Method of Arteria
1±1 years anan and 1 healod pressures
ics Committedy and all par
mitted to the voistic network oman (normotens
haracteristic pe arterial wallcies from the in dependenc
monstrated thacy caused a deffect could he example o
peared that thvidual had lowcy, compara young indiviial compliancfrequency ch
lues of the sta % maximal vncy characte
The low uency charactthe power of
issipative and tatic compliation of the requency charaalthy normot
al Compliance An
and two eldelthy man) age130/85 mm H
ee of Masaryrticipants of th
olume vibrationof the 28 yeasive, smoker).
provides inforl to transmit pressure in th
ce on transmuat an increa
decrease of thebe influence
of frequency che frequency cwer values, ered to theidual. ce evaluated bharacteristic isatic compliancvolume/mm Heristic (0-1 values of tteristic) were f the transmittd inertial forceance were careal part of tacteristics. Thtensive young
nalysis S493
erly subjectsed 65 and 70
Hg and 120/80
yk Universityhe study gave
in dependencears old woman
rmation aboutvibrations of
he cuff to theural pressure.ased pressuree transmissioned by arterialcharacteristicscharacteristicsspecially at ae frequency
by regressions presented ince were often
Hg) than those% maximalthe dynamicgiven by the
ted vibrationses. The higheraused by thethe reciprocalhe complianceg subjects is
3
s 0 0
y e
e n
t f e . e n l s s a y
n n n e l c e s r e l e s

S494 Moudr presented in compliance dependence o
Fig. 5. An normotensive yvalue of the therefore slighadjusted to 0. Discussion We determinationwhich could under diffe(hypertensionfinger blood results are pr
Sombased on finvolume cha(Talts et ainformation vibrations opressure to aThe changecharacteristicbe monotoniresonant fretransmural presonant fre(directly) anamplitude ofthe blood flofrequency chanalysis for celastance. C
r et al.
Figure 5. Nuprovides a cuon transmural
example of young subjects.occurrence of
ht differences
n
have developn of dynamicserve as a new
erent physioln, diabetes mflow in spec
resented in thime studies enger photopleanges at chaal. 2006). Oon the ability
of different farterial volumee of the dync) with the fric. This is dequency of tressure and thequency is nd the mass f the resonancow (indirectlyharacteristic acomputing the
Compliance is
umeric integraurve of the al pressure.
compliance C(. Graphs are ali
the maximal in the individ
ped a new origc compliance w way to examlogic and pmellitus, imp
cial disorders)is paper. estimated artethysmographangeable tranOur study
y of the arteriafrequencies fe vibrations bnamic complrequency of vdue to the acthe arterial he frequency odetermined b(indirectly) oce depends ony). All reciproare included ie appropriate s the recipro
tion of the artarterial volum
(Pt) of six hegned to the prevalue of the
dual pressures
ginal method oof small arte
mine small artpathologic spaired contro). Our prelimi
terial complihy using presnsmural presadded addital wall to tranfrom the ap
by a different liance (frequ
vibrations maychievement ofwall at a gof vibrations. by the elast
of the artery. n the resistancocal values onto the regreparameter – s
ocal value of
rterial me in
ealthy essure peak, were
of the eries, teries states ol of
minary
iance ssure-sures tional nsmit
pplied gain.
uency y not f the given This
ticity The
ce of of the ssion static f the
elastshowthe comamp
chanagre(Talestiminto 2006comof tr
a shtrans−20asymal. (be ginfluas viA shtransthe comampnegawallcouloscipresdias(Raaextedescvoluand furthfrequ ConTher AckThisEuroFNU
tance competewed that arterfrequency ch
mpliance seemplitude of trans
The shangeable transeement with thlts et al. 2006)mating blood-
a parametric6, Tanaka et
mpliance by thiransmural pres
We obsehift of the cosmural pressumm Hg, a sl
mmetry of the(1997), Talts given by an uenced by theiscoelasticity hift of the cosmural pressu
arterial walmpliance curveplitude of the wative transmurl. Furthermoreld be causellometric fin
ssure pulse amtolic and syamat et al.ensive theoretcribed parameume response dissipative fo
her research uency charact
nflict of Intre is no confli
knowledgems study was opean RegioUSA-ICRC (N
ent for the frerial compliancharacteristic oms to be linke
smitted vibratape of the smural presshe results desc). Most studie-volume param model (Penaal. 2011). W
is model, but assure. rved individu
ompliance curure in the rope of the vcompliance c
et al. (2006).arterial comp
e above mentiand mass of thompliance cuure was proball. The trane peak was dewall vibrationral pressure de, the shift of ed by a pger blood pr
mplitude and systolic blood1999). This ical physical ters determinito pressure vrces. This bac
of compliteristic of the a
terest ict of interest.
ments supported by
onal DevelopNo. CZ.1.05/1.
equency charace influenced
of the arterialed with a detions at higherestimated co
sure was ascribed by othees evaluated cmeters of theaz et al. 1997We were ablealso directly f
ual variability urve peak towrange from
volume-pressucurve, similarl. These obserpliance but aioned physicahe finger, arte
urve peak towably given bynsmural presetermined by
n, which was tdue to the routhe complianc
property of ressure estim
shape affect thd pressure was the reabackground
ing the forcesvibrations as ickground can iance estimaarterial wall.
y MUNI/A/09pment Fund.1.00/02.0123
Vol. 63
acteristic. Wethe shape ofwall. Lower
crease of ther frequencies.ompliance atsymmetric iner researchers
compliance bye artery fitted7, Talts et al.e to evaluatefor each value
of the results:ward negative0 mm Hg to
ure curve andly as Penaz et
rvations couldalso could bel factors such
ery and blood.ward negativey the shape ofssure of the
the maximalthe greatest inunded arterialce curve peaknon-invasive
mation: bloodhe results of ameasurement
ason for ourin which we
s affecting theinertial forcesbe helpful for
ated by the
957/2013 andd – Project).
3
e f r e
t n s y d
e e
: e o d t d e h . e f e l n l k e d a t r e e s r e
d t

2014 Vibration Plethysmographic Method of Arterial Compliance Analysis S495
References CHANG S, WANG JJ, SU HM, LIU CP: On calculating the time-varying elastance curve of a radial artery using a
miniature vibration method. In: 13th International Conference on Biomedical Engineering (ICBME) 2008. Vol. 23. Springer, Berlin – Heidelberg, 2009, pp 540-542.
NAKATANI S, YAMAGISHI M, TAMAI J, GOTO Y, UMENO T, KAWAGUCHI A, YUTANI C, MIYATAKE K: Assessment of coronary artery distensibility by intravascular ultrasound. Application of simultaneous measurements of luminal area and pressure. Circulation 91: 2904-2910, 1995.
NEUTEL JM, SMITH DHG, GRAETTINGER WF, WEBER MA: Dependency of arterial compliance on circulating neuroendocrine and metabolic factors in normal subjects. Am J Cardiol 69: 1340-1344, 1992.
PENAZ J, HONZIKOVA N, JURAK P: Vibration plethysmography: a method for studying the visco-elastic properties of finger arteries. Med Biol Eng Comput 35: 633-637, 1997.
RAAMAT R, TALTS J, JAGOMAGI K, LANSIMIES E: Mathematical modelling of non-invasive oscillometric finger mean blood pressure measurement by maximum oscillation criterion. Med Biol Eng Comput 37: 784-788, 1999.
TALTS J, RAAMAT R, JAGOMAGI K: Asymmetric time-dependent model for the dynamic finger arterial pressure-volume relationship. Med Biol Eng Comput 44: 829-834, 2006.
TANAKA G, YAMAKOSHI K, SAWADA Y, MATSUMURA K, MAEDA K, KATO Y, HORIGUCHI M, OHGURO H: A novel photoplethysmography technique to derive normalized arterial stiffness as a blood pressure independent measure in the finger vascular bed. Physiol Meas 32: 1869-1883, 2011.
VENTURA H, MESSERLI FH, OIGMAN W, SUAREZ DH, DRESLINSKI GR, DUNN FG, FREISIN E, FROHLICH ED: Impaired systemic arterial compliance in borderline hypertension. Am Heart J 108: 132-136, 1984.
YASMIN, BROWN MJ: Similarities and differences between augmentation index and pulse wave velocity in the assessment of arterial stiffness. Quart J Med 92: 595-600, 1999.