industry surveys - california state university, northridge
TRANSCRIPT
Industry SurveysBanking Erik Oja, Regional Banks Analyst
December 11, 2008
CONTACTS: INQUIRIES & CLIENT RELATIONS 800.852.1641 clientrelations@ standardandpoors.com SALES Larry McQuaid 617.530.8214 larry_mcquaid@ standardandpoors.com MEDIA Michael Privitera 212.438.6679 michael_privitera@ standardandpoors.com Replacement copies 800.852.1641 Standard & Poor’s Equity Research Services 55 Water Street New York, NY 10041
Current Environment.............................................................................................. 1
Industry Profile ..................................................................................................... 11
Industry Trends .................................................................................................... 12
How the Industry Operates ................................................................................ 19
Key Industry Ratios and Statistics .................................................................... 28
How to Analyze a Bank ....................................................................................... 29
Industry References ............................................................................................ 36
Comparative Company Analysis...........................................................Appendix
This issue updates the one dated June 5, 2008. The next update of this Survey is scheduled for June 2009.
EXECUTIVE EDITOR: EILEEN M. BOSSONG-MARTINES ASSOCIATE EDITOR: DIANE CAPPADONA STATISTICIAN: SALLY KATHRYN NUTTALL
CLIENT SUPPORT: 1-800-523-4534. COPYRIGHT © 2008 BY STANDARD & POOR’S. ALL RIGHTS RESERVED. ISSN 0196-4666. USPS NO. 517-780.
VISIT THE STANDARD & POOR’S WEB SITE: HTTP://WWW.STANDARDANDPOORS.COM
STANDARD & POOR’S INDUSTRY SURVEYS is published weekly. Annual subscription: $10,500. Please call for special pricing: 1-800-852-1641, option 2. Reproduction in whole or in part (including inputting into a computer) prohibited except by permission of Standard & Poor’s. Executive and Editorial Office: Standard & Poor’s, 55 Water Street, New York, NY 10041. Standard & Poor’s is a division of The McGraw-Hill Companies. Officers of The McGraw-Hill Companies, Inc.: Harold McGraw III, Chairman, President, and Chief Executive Officer; Kenneth M. Vittor, Executive Vice President and General Counsel; Robert J. Bahash, Executive Vice President and Chief Financial Officer; John Weisenseel, Senior Vice President, Treasury Operations. Periodicals postage paid at New York, NY 10004 and additional mailing offices. Postmaster: Send address changes to Standard & Poor’s, Industry Surveys, Attn: Mail Prep, 55 Water Street, New York, NY 10041. Information has been obtained by Standard & Poor’s INDUSTRY SURVEYS from sources believed to be reliable. However, because of the possibility of human or mechanical error by our sources, INDUSTRY SURVEYS, or others, INDUSTRY SURVEYS does not guarantee the accuracy, adequacy, or completeness of any information and is not responsible for any errors or omissions or for the results obtained from the use of such information. Volume 176, No. 50, Section 1. This issue of Industry Surveys includes 1 section.
Standard & Poor’s Industry Surveys 55 Water Street, New York, NY 10041
Topics Covered by Industry Surveys
Aerospace & Defense Airlines Alcoholic Beverages & Tobacco Apparel & Footwear: Retailers & Brands Autos & Auto Parts Banking Biotechnology Broadcasting, Cable & Satellite Chemicals Communications Equipment Computers: Commercial Services Computers: Consumer Services & the Internet Computers: Hardware Computers: Software Computers: Storage & Peripherals Electric Utilities
Environmental & Waste Management Financial Services: Diversified Foods & Nonalcoholic Beverages Healthcare: Facilities Healthcare: Managed Care Healthcare: Pharmaceuticals Healthcare: Products & Supplies Heavy Equipment & Trucks Homebuilding Household Durables Household Nondurables Industrial Machinery Insurance: Life & Health Insurance: Property-Casualty Investment Services Lodging & Gaming Metals: Industrial Movies & Home Entertainment
Natural Gas Distribution Oil & Gas: Equipment & Services Oil & Gas: Production & Marketing Paper & Forest Products Publishing REITs Restaurants Retailing: General Retailing: Specialty Savings & Loans Semiconductor Equipment Semiconductors Supermarkets & Drugstores Telecommunications: Wireless Telecommunications: Wireline Transportation: Commercial
Global Industry Surveys
Advertising Aerospace & Defense Airlines Autos & Auto Parts Banking Biotechnology Broadcasting, Cable & Satellite Chemicals Communications Equipment Computers: Hardware
Construction & Engineering Consumer Electronics Electric Utilities Foods & Nonalcoholic Beverages Healthcare: Pharmaceuticals Healthcare: Products & Supplies Industrial Machinery Insurance: Life & Health Insurance: Property-Casualty
Investment Services Oil & Gas: Production & Marketing Publishing Real Estate Retailing: Specialty Supermarkets & Drugstores Telecommunications: Wireless Transportation: Commercial
INDUSTRY SURVEYS BANKING / DECEMBER 11, 2008 1
CURRENT ENVIRONMENT
Gingerly feeling for the bottom, with a strong helping hand
While we think that most US regional banks continue to face severe challenges to their profitability, we also see that earlier challenges to their very existence may likely have receded due to recent government initiatives, most recently the Troubled Assets Relief Program (TARP) and the associated Capital Purchase Program. (This Industry Survey focuses on US regional banks, a group that includes US banks, except the top five US commercial and consumer lenders, which are covered in the Financial Services: Diversified Industry Survey; thrift-chartered housing lenders, which are covered in Savings & Loans, and other financial intermediaries, which are covered in Investment Services.)
The current crisis entered a new and very dangerous mode in 2008, with the toppling of The Bear Stearns Companies Inc. (in March), the seizure of Indy Mac Bank by the FDIC (July), the government takeover of mortgage giants Fannie Mae and Freddie Mac, the bankruptcy of Lehman Brothers, and the FDIC seizure of Washington Mutual, the emergency sale of Wachovia, and the federal takeover of AIG (all in September).
Given these dramatic developments, the US government took decisive action to save the commercial banking system. The Federal Reserve continued cutting interest rates, driving the federal funds rate back to 1.00%, from 5.25% in September 2007 when the rate-cutting began. In addition, the Federal Reserve opened the discount window to investment banks in March 2008, the first time this facility had been made available to nonmember financial institutions. The Federal Reserve also initiated programs to purchase commercial paper.
US government to purchase distressed assets, stock in financial institutions Keen to avoid a further domino-style collapse of the US financial system, as happened in 1930, the Administration and the US Treasury Department created a plan to buy financial firms’ distressed assets, and persuaded the US Congress to approve a line of credit of up to $700 billion. This program, which was passed as H.R. 1424 and named the Emergency Economic Stabilization Act of 2008, is commonly known as TARP, an acronym for the Troubled Assets Relief Program.
The TARP stipulated that $250 billion was available to the Treasury for immediate use, that an additional $100 billion would be available if the US President certified that it was needed. The remaining $350 billion would be subject to additional Congressional approvals.
A further extension of TARP is the Capital Purchase Program (CPP), which provided for the US Treasury to purchase preferred stock in nine of the largest US financial institutions, for a 5.0% annual coupon, and to receive warrants that could be exercised into common shares of each bank. The Treasury intended for banks to use the funds to build their reserves and capital levels, so that they would be in a position to resume lending. The CPP was subsequently expanded from the original nine large banks to many of the banks that comprise the US regional banking industry. The Treasury Department has elected to have each regional bank publicly announce their applications to and acceptances into the program.
As of November 14, 2008, $290 billion had been allocated as follows: $125 billion to the nine largest financial institutions, $125 billion to an approved group of US regional banks, and a $40 billion equity infusion into insurer American International Group.
The way the program works is as follows. The Treasury Department purchases newly issued preferred stock in each participating bank. This preferred stock pays a cash dividend of 5.0%
2 BANKING / DECEMBER 11, 2008 INDUSTRY SURVEYS
annually for five years and 9.0% thereafter, and is not convertible into bonds or shares. The Treasury Department also receives 10-year warrants to purchase common shares of each participating bank. On Friday, November 14, the Treasury Dept disbursed the funds to the participating banks.
The CPP will reduce earnings by the amount that banks have to pay for the 5.0% coupon, net of taxes. The funds received in exchange for the preferred stock may go towards reserves or acquisitions, or used to make loans. If the banks use the money to make loans, that should boost net interest income, partly offsetting the interest cost of the warrants. Clearly, the government would like the banks to make more loans, rather than hoarding the money. Since not all of the money will be used for loans, however, earnings may be slightly negatively affected in the near term by the CPP, as banks must pay 5.0% on the CPP funds. Also, if the government elects to exercise the warrants, that would likely lead to a dilutive issuance of common stock, further reducing earnings per share. However, the banks receive the benefit of having higher capital ratios that may avoid future capital-raising activities at higher rates.
Treasury Secretary Hank Paulson indicated on November 13 that the original aim of TARP, to purchase and help re-create a market for mortgage securities, would be superseded by the CPP, which is the infusion of capital directly into banks. Secretary Paulson indicated that the remaining TARP funds (totaling some $410 billion) would be directed toward reviving the securitization markets for consumer credit, while many in Congress wanted some of the funds to go toward US automakers.
The ultimate success of the Fed’s many initiatives and rate cuts, the TARP, and the CPP will be seen when the credit markets fully thaw out, and loan growth resumes in all sectors and lines of business. Though some Federal Reserve lending statistics indicate that banks never really stopped lending, it is also clear from recent news reports that many kinds of businesses across the nation, such as some automobile dealers, have had their lines of credit cut and have gone out of business. In addition, the London Interbank Offered Rate (Libor), a key measure of international lending, remains at elevated levels, indicating a freeze in inter-bank lending.
BANK STOCK PERFORMANCE REFLECTS INDUSTRY TURMOIL
After several years of relatively benign credit conditions and relatively high bank earnings, the S&P 1500 SuperComposite Regional Banks stock price index peaked on February 20, 2007. A few days later, however, UBS AG reported large housing-related fixed-income losses — an event considered by many industry observers to be the first evidence of the housing, credit, and banking crises that have affected most world economies since then.
When Bear Stearns reported large losses in two of its hedge funds in July 2007, it became apparent that the credit problems reported by many banks were not confined to subprime loans and mortgage-backed securities. In response, the S&P Regional Banks subindex began to fall sharply: from its peak in February 2007 to the end of the year, it declined 29.5%.
In mid-January 2008, the Federal Reserve made a 75-basis-point rate cut, announced the availability of enhanced credit-lending facilities, and followed shortly with another rate cut of 50 basis points. In response, the bank stock index rallied through the end of January.
However, by mid-March 2008, the bank stock index had been pulled down to levels that were new lows at the time, by further concerns about a US recession and the bailout of Bear Stearns by the Federal Reserve and JPMorgan Chase & Co. The Federal Reserve announced another 75-basis-point rate cut at this time. The central bank also expanded the use of the discount window to include investment banks (traditionally, only Federal Deposit Insurance Corporation member banks, which are regulated by the FDIC, had this privilege). From the beginning of 2008 through April 30, the S&P Regional Banks subindex fell only 6.2%.
INDUSTRY SURVEYS BANKING / DECEMBER 11, 2008 3
On April 30, the Fed announced its fourth rate cut of 2008, a 25-basis-point reduction. From April 30 to July 15, the bank stock index fell a significant 42.6%, and reached its lowest point of the entire financial crisis. This decline was precipitated by investor’s fears that multiple failures of large banks would occur — a fear that was partly realized on July 11, when the FDIC seized IndyMac Bancorp, a large California-based home lender. Cumulatively, from February 20, 2007, to July 15, 2008, the S&P Regional Banks subindex declined 62.0%.
However, the July 15 lows were quickly seen by investors as an excellent buying opportunity. Despite the anticipated government seizure of Fannie Mae and Freddie Mac, which finally occurred on September 7, investors purchased regional bank stocks, driving the bank stock index upward. On September 18, 2008, the US Treasury announced the TARP program, and on September 19, a temporary short-selling prohibition was enacted. From July 15 to September 19, 2008, the banking index rose 93.4%.
Subsequently, however, investors became concerned that the US recession might be deep and could spread globally; the bank stock index fell 35.2% from September 19 to October 24. During this period, Washington Mutual and Wachovia, two of the nation’s largest banks, declined sharply in value and were sold for prices that were very low relative to historical levels. As of the end of October 2008, the bank stock index was down 46.1% since its peak on February 20, 2007, and down 23.5% since the start of 2008.
In comparison, during the 12-month period from October 1989 to October 1990, the last banking industry meltdown to approximate the current one, several of the largest US banks suffered major share price declines of as much as 70%. The Nasdaq Bank Index fell 52% from its August 1989 high to its November 1990 low, a decline that approximately matches the current decline. By Janu-ary 1991, however, tensions suddenly eased, setting the stage for a strong bull market. Standard & Poor’s believes that a positive catalyst — such as the sudden easing of global tensions, which con-tributed to the sharp rally that began in 1991 — is missing or muted today. Therefore, the prospects for a large, sustained rally in bank stocks may be lower today than in 1991, in our opinion.
HOW DO OTHER DOWNTURNS COMPARE WITH THIS ONE?
There have been five notable banking industry downturns in the US since the start of the 1980s. They were precipitated by the Latin American debt crisis in the early- and mid-1980s; the savings & loan crisis of the late 1980s to the early 1990s; the recession of 1990 to 1991; the demise of hedge fund Long-Term Capital Management, Russian debt defaults, and the Asian financial crisis in 1997–98; and the bear market following the bursting of the tech bubble in 2000 to 2002. Although each of the five downturns was markedly different, the current financial turmoil borrows a little bit from each of them, and adds a few wrinkles of its own.
Although the US banking industry seems to face a severe financial crisis every few years, the current one is exceptional for the size and type of the losses inflicted, the complexity of the financial instru-ments involved in the losses, the large range of financial companies affected, and its geographical breadth. The current financial crisis, which began in February 2007 and gathered force in July of that year in the midst of a housing market decline, has been two-fold in nature. It is a housing-re-lated credit decline, combined with a capital market liquidity crisis that has affected the valuation of many investment vehicles.
Who’s feeling the pain. The range of financial companies affected has been much greater in the current crisis than in previous ones. This time around, all kinds of financial firms worldwide — from brokerage companies to mortgage lenders to banks — have been affected.
Geographical reach. Like the Latin American debt crisis of the 1980s, the 1997 Asian financial crisis, and the 1998 Russian debt defaults, the current US banking crisis extends internationally.
4 BANKING / DECEMBER 11, 2008 INDUSTRY SURVEYS
However, US regional banks, the focus of this Survey, generally avoid international lending exposure: their commercial and consumer lending is focused on the United States.
Nevertheless, regional banks are not immune. The global nature of the current financial turmoil has created a credit crunch that has affected the ability of US regional banks to borrow at the wholesale level to fund the loans they would like to underwrite in the US. It has also led to liquidity issues that have hurt these banks’ ability to buy and sell investment securities, which are an integral part of their balance sheet management strategies.
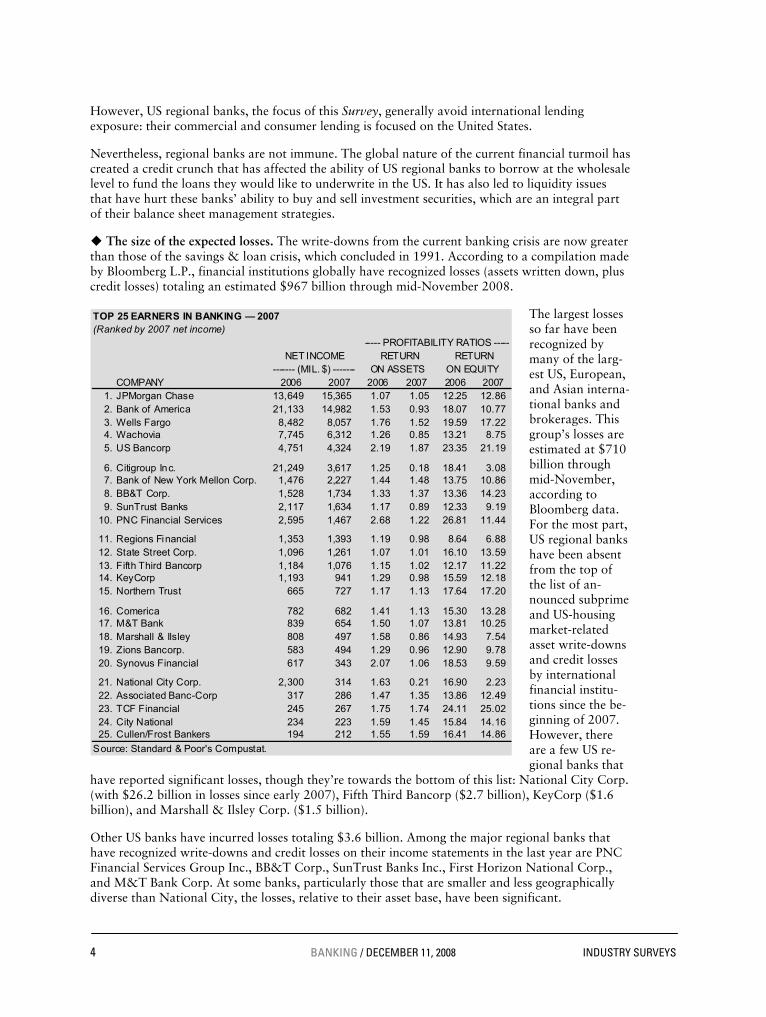
The size of the expected losses. The write-downs from the current banking crisis are now greater than those of the savings & loan crisis, which concluded in 1991. According to a compilation made by Bloomberg L.P., financial institutions globally have recognized losses (assets written down, plus credit losses) totaling an estimated $967 billion through mid-November 2008.
The largest losses so far have been recognized by many of the larg-est US, European, and Asian interna-tional banks and brokerages. This group’s losses are estimated at $710 billion through mid-November, according to Bloomberg data. For the most part, US regional banks have been absent from the top of the list of an-nounced subprime and US-housing market-related asset write-downs and credit losses by international financial institu-tions since the be-ginning of 2007. However, there are a few US re-gional banks that
have reported significant losses, though they’re towards the bottom of this list: National City Corp. (with $26.2 billion in losses since early 2007), Fifth Third Bancorp ($2.7 billion), KeyCorp ($1.6 billion), and Marshall & Ilsley Corp. ($1.5 billion).
Other US banks have incurred losses totaling $3.6 billion. Among the major regional banks that have recognized write-downs and credit losses on their income statements in the last year are PNC Financial Services Group Inc., BB&T Corp., SunTrust Banks Inc., First Horizon National Corp., and M&T Bank Corp. At some banks, particularly those that are smaller and less geographically diverse than National City, the losses, relative to their asset base, have been significant.
B22 top earners in banking
TOP 25 EARNERS IN BANKING — 2007(Ranked by 2007 net income)
----- PROFITABILITY RATIOS -----NET INCOME RETURN RETURN
------- (MIL. $) ------- ON ASSETS ON EQUITY COMPANY 2006 2007 2006 2007 2006 2007
1. JPMorgan Chase 13,649 15,365 1.07 1.05 12.25 12.862. Bank of America 21,133 14,982 1.53 0.93 18.07 10.773. Wells Fargo 8,482 8,057 1.76 1.52 19.59 17.224. Wachovia 7,745 6,312 1.26 0.85 13.21 8.755. US Bancorp 4,751 4,324 2.19 1.87 23.35 21.19
6. Citigroup Inc. 21,249 3,617 1.25 0.18 18.41 3.087. Bank of New York Mellon Corp. 1,476 2,227 1.44 1.48 13.75 10.868. BB&T Corp. 1,528 1,734 1.33 1.37 13.36 14.239. SunTrust Banks 2,117 1,634 1.17 0.89 12.33 9.19
10. PNC Financial Services 2,595 1,467 2.68 1.22 26.81 11.44
11. Regions Financial 1,353 1,393 1.19 0.98 8.64 6.8812. State Street Corp. 1,096 1,261 1.07 1.01 16.10 13.5913. Fifth Third Bancorp 1,184 1,076 1.15 1.02 12.17 11.2214. KeyCorp 1,193 941 1.29 0.98 15.59 12.1815. Northern Trust 665 727 1.17 1.13 17.64 17.20
16. Comerica 782 682 1.41 1.13 15.30 13.2817. M&T Bank 839 654 1.50 1.07 13.81 10.2518. Marshall & Ilsley 808 497 1.58 0.86 14.93 7.5419. Zions Bancorp. 583 494 1.29 0.96 12.90 9.7820. Synovus Financial 617 343 2.07 1.06 18.53 9.59
21. National City Corp. 2,300 314 1.63 0.21 16.90 2.2322. Associated Banc-Corp 317 286 1.47 1.35 13.86 12.4923. TCF Financial 245 267 1.75 1.74 24.11 25.0224. City National 234 223 1.59 1.45 15.84 14.1625. Cullen/Frost Bankers 194 212 1.55 1.59 16.41 14.86
Source: Standard & Poor's Compustat.
INDUSTRY SURVEYS BANKING / DECEMBER 11, 2008 5
Mortgages are key. The kinds of losses seen in the current banking crisis are similar to those seen in the late 1980s’ thrift crisis: credit quality declines resulted from mortgages made on properties that turned out to have been appraised at inflated values. This time, however, due to the ingenuity of modern finance, the kinds of securities created and used for investments were much more varied and complicated. It now seems that the complexity of some of these securities meant that banks did not fully understand the risks of holding them.
Of course, not all US regional banks invested in these securities. Indeed, many carefully limited their securities investments to US government- and agency-backed securities, thus saving themselves large write-downs.
Credit crunch in wholesale markets. The current crisis is similar to the one that accompanied the recession of 1990 to 1991 in that it has led to a freeze-up of the wholesale markets that banks must use in order to fund the loans they make. In addition, the lack of liquidity means that banks cannot readily trade the investment securities they keep on their balance sheets. Several banks have opted to wait for more market liquidity to develop before attempting to sell their securities; instead, they have opted to write down the values of these securities, in accordance with accounting rules.
REVIEW OF RECENT RESULTS
Regional banks’ earnings results for the third quarter of 2008 indicated a darkening economic picture. Most banks reported another consecutive quarter of relatively large loan loss provisions primarily related to the low credit quality of many of the residential real estate construction loans they made in the last few years, plus a weakening outlook for consumer and commercial lending growth and credit quality. In many areas of the US, particularly Michigan and Ohio, the economy is clearly in a slowdown, with increasing unemployment, and most bank managements are hesitant to increase lending that might lead to further credit losses. The scattered slowdowns in lending, in turn, contributed to a further worsening of economic conditions, as many businesses, even healthy ones, found they could not get financing for day-to-day business needs.
Many banks noted the continuing impact of housing price declines in many areas of the US on their residential mortgage portfolios and residential real estate construction lending businesses. Few, if any, banks noted that housing conditions are improving, and many have cautioned that any further economic downturn may quickly necessitate additional large loan loss provisioning expenses. In addition, a few major banks — particularly those with lending in California and Arizona — have continued to take large loan loss provisions and have cut their dividends to conserve capital.
One key metric in assessing whether credit quality is worsening is the sequential (quarter-to-quarter) rate of change in the total amount of nonperforming loans. In the second quarter of 2008, the median sequential increase was about 30%, according to calculations by Standard & Poor’s Equity Research. Though the third quarter was worse in many ways, one silver lining in the clouds was that the sequential rate of increase in total nonperforming loans appeared to have slowed to about 18%, according to our calculations.
Worsening loans affect a bank in many ways. As loans are charged off (written off), they reduce the reserve for loan losses. In turn, the reserve may require replenishment from loan loss provisions, which reduces net income. In addition, as reserves decline, a bank’s capital level may decrease. If a decline is too rapid to be replenished by quarterly loan loss provisioning, a bank may need to issue more equity or preferred shares, or cut its dividend.
Nonperforming loans also affect a bank’s net interest margin: even loans that are not earning interest still need to be financed with deposits, which require interest payments. The reverse holds true: should nonperforming loans begin to decline, net interest margin expansion may accelerate.
6 BANKING / DECEMBER 11, 2008 INDUSTRY SURVEYS
While some US regional banks still appear to have loan loss provisioning expenses under control, dividends that are secure, and adequate capital levels, most had shown by mid-2008 that they did not. This led to the sudden creation of the TARP in September 2008. A few large regional banks suffered damage serious enough to require capital infusions, dividend cuts, common and preferred stock issuances, and other forms of balance sheet restructurings. We think some smaller banks that lack geographical diversity and may have made too many lending commitments to housing developers in regions with significant declines in housing prices may have to close.
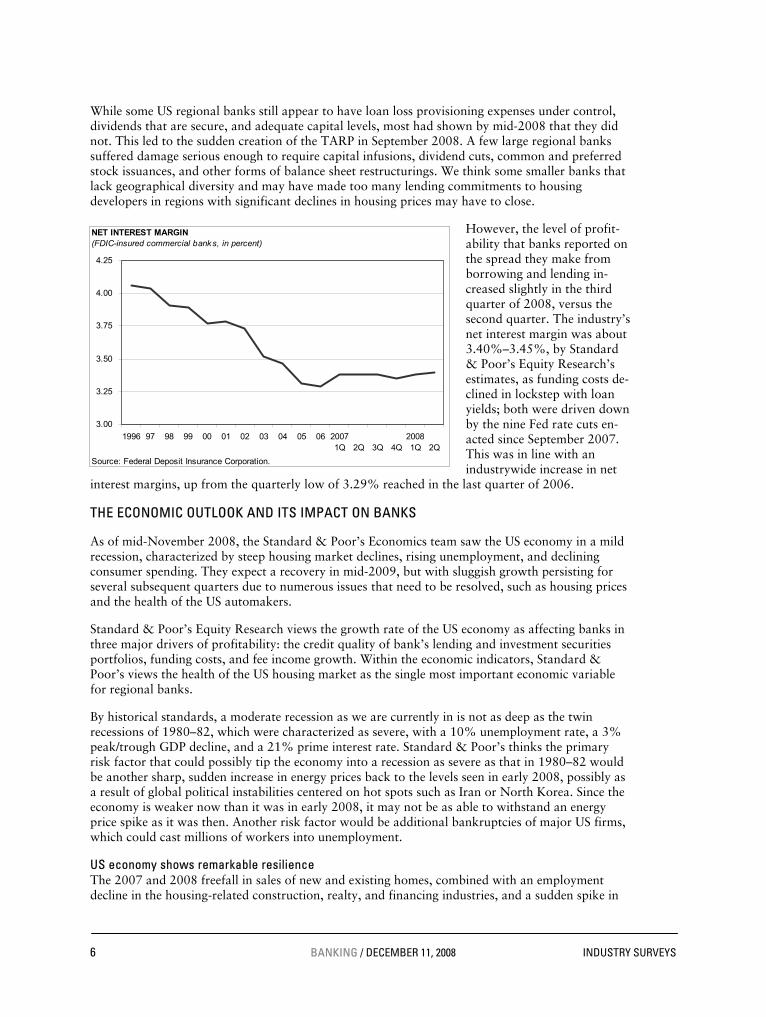
However, the level of profit-ability that banks reported on the spread they make from borrowing and lending in-creased slightly in the third quarter of 2008, versus the second quarter. The industry’s net interest margin was about 3.40%–3.45%, by Standard & Poor’s Equity Research’s estimates, as funding costs de-clined in lockstep with loan yields; both were driven down by the nine Fed rate cuts en-acted since September 2007. This was in line with an industrywide increase in net
interest margins, up from the quarterly low of 3.29% reached in the last quarter of 2006.
THE ECONOMIC OUTLOOK AND ITS IMPACT ON BANKS
As of mid-November 2008, the Standard & Poor’s Economics team saw the US economy in a mild recession, characterized by steep housing market declines, rising unemployment, and declining consumer spending. They expect a recovery in mid-2009, but with sluggish growth persisting for several subsequent quarters due to numerous issues that need to be resolved, such as housing prices and the health of the US automakers.
Standard & Poor’s Equity Research views the growth rate of the US economy as affecting banks in three major drivers of profitability: the credit quality of bank’s lending and investment securities portfolios, funding costs, and fee income growth. Within the economic indicators, Standard & Poor’s views the health of the US housing market as the single most important economic variable for regional banks.
By historical standards, a moderate recession as we are currently in is not as deep as the twin recessions of 1980–82, which were characterized as severe, with a 10% unemployment rate, a 3% peak/trough GDP decline, and a 21% prime interest rate. Standard & Poor’s thinks the primary risk factor that could possibly tip the economy into a recession as severe as that in 1980–82 would be another sharp, sudden increase in energy prices back to the levels seen in early 2008, possibly as a result of global political instabilities centered on hot spots such as Iran or North Korea. Since the economy is weaker now than it was in early 2008, it may not be as able to withstand an energy price spike as it was then. Another risk factor would be additional bankruptcies of major US firms, which could cast millions of workers into unemployment.
US economy shows remarkable resilience The 2007 and 2008 freefall in sales of new and existing homes, combined with an employment decline in the housing-related construction, realty, and financing industries, and a sudden spike in
[Insert Graph H10 Net Interest Margin, here]
3.00
3.25
3.50
3.75
4.00
4.25
1996 97 98 99 00 01 02 03 04 05 06 20071Q
2Q
3Q
4Q
20081Q
2Q
NET INTEREST MARGIN (FDIC-insured commercial banks, in percent)
Source: Federal Deposit Insurance Corporation.
INDUSTRY SURVEYS BANKING / DECEMBER 11, 2008 7
energy prices, were expected to hurt US economic growth sooner than later. Instead, due to strength of US exports, which were helped by a weak dollar that made US goods cheaper to foreign buyers, the US economy continued to grow in the first half of 2008.
US real GDP growth was 0.9% in the first quarter of 2008, an improvement from a slight contrac-tion in the fourth quarter of 2007. The first-quarter figure was bolstered by government spending and inventory builds, partly offset by weakness in consumer spending, commercial construction, and housing. Strong growth in export industries, technology, agriculture, and healthcare, combined with Federal Reserve rate cuts and a February round of stimulus checks, kept the US economy from worsening. At 5.1% in March, unemployment was low relative to historical levels and up only slightly from the lowest level of 2008 (4.8%), reached in February.
In the second quarter of 2008, real GDP growth was first reported at 1.9%, revised up to 3.3% on the strength of high export growth, and later revised down to a final figure of 2.8%, as higher energy costs affected consumer spending. By the end of the second quarter, however, clouds were gathering again: the Reuters/University of Michigan US consumer sentiment index fell to 56.4 in June, the lowest since 1980 and down substantially from a relatively high 85.6 for full-year 2007.
By the third quarter, it was becoming clear that the US slowdown had resulted in negative GDP growth. Preliminary estimates of third-quarter GDP, released in October, showed a decrease of 0.3% (annual rate). Negative factors included declines in personal consumption expenditures, residential fixed investment, and software outlays, partly offset by higher federal, state, and local government spending, continued strength in export industries, and private inventory investment.
Unemployment rose in September to 6.1%, significantly higher than the 4.7% rate a year earlier. Retail sales also fell in September by 0.3%, and the declines accelerated with the October and November reports: –1.2%, and –2.8%, respectively. (Excluding autos, the declines were 0.9%, 0.6% and 2.2%, respectively.) The consumer sentiment index for November was 57.9, only a bit higher than the low reported for June.
The initial reports for the fourth quarter of 2008 are not encouraging. Unemployment in October climbed to 6.5%, which represents a sizable increase from the recent low of 4.4%, reached at the end of 2006. (The previous peak was 6.3% in June 2003.) Standard & Poor’s expects fourth-quarter real GDP to be down 1.5% (annualized rate).
In addition, it appears from the third-quarter earnings reports of many US technology companies that the slowdown has hit the tech sector. Consumer demand has fallen as consumers seek to pre-serve their funds, while the credit crunch has hurt financing of corporate purchases of big-ticket items. While the tech sector accounts for only about 4% of US employment, about half of all capital spending by corporations is for technology products, suggesting that companies have dramatically reduced capital spending.
For 2009, Standard & Poor’s expects a decline in the first half, with first- and second-quarter real GDP declines of 1.6% and 0.1%, respectively, followed by a recovery in the second half of 2009, for a full-year decline of 0.5%.
HOUSING CRITICAL TO REGIONAL BANKS
Nothing is more directly important to regional banks than the state of the US housing industry. As of June 30, 2008, FDIC-insured banks held nearly $2.15 trillion in one- to four-family residential loans, the largest category of loans held by banks. In addition, other loans secured by real estate (including home equity loans of $647 billion, and real estate construction and development loans totaling $627 billion) accounted for nearly $4.8 trillion of loans secured by real estate, or almost 60% of total loans held by US banks.
8 BANKING / DECEMBER 11, 2008 INDUSTRY SURVEYS
In terms of total assets, loans secured by real estate account for about 36% of the $13.3 trillion in total assets held by US banks as of June 30, 2008. Investment securities, which are often backed by mortgages, account for another $2.02 trillion, or about 15% of total banking assets, at mid-year 2008.
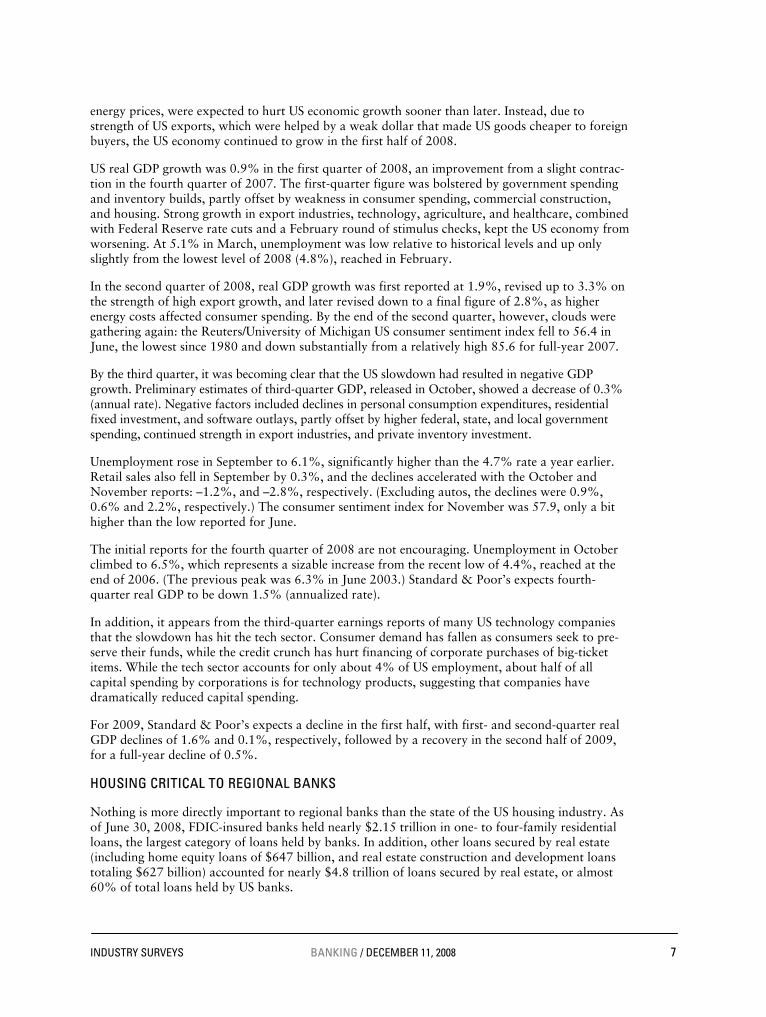
Prices of existing homes financed by Fannie Mae or Freddie Mac conforming mortgages peaked in April 2007, according to the Office of Federal Housing Enterprise Oversight (OFHEO) and are
down 6.5% since then. However, the more volatile S&P/Case-Shiller home price index for 20 major metropolitan areas is down 20.3% from its peak in January 2007. Standard & Poor’s estimates that housing prices may cease falling in 2009.
As home prices have declined, banks have been affected by nonperforming loans made to housing developers, particularly in areas of Florida, Georgia, Arizona, Nevada, and Southern California, where it appears that overbuilding may have been rampant due to cheap land and abundant credit. Home prices have dropped the most sharply in Phoenix (down 36.3% from June 2006
through August 2008), followed closely by Las Vegas (down 35.9% since peaking in August 2006), and Miami (down 34.7% since peaking in December 2006).
However, home prices in many areas of the country, particularly in areas that benefit from high oil prices, such as Texas, or strong agriculture prices, have held steady. Charlotte, Dallas, and Denver have experienced much less steep declines than the national Case-Shiller index (2.8% to 5.4% from peak levels) through August 2008. Portland, Atlanta, and Seattle saw home price declines in the 7.8% to 8.9% range from peak levels. Cleveland, New York, Boston, and Chicago, while seeing home price declines from peak levels in a range of 10.5% to 11.3%, are also well below the national Case-Shiller
decline from peak rates.
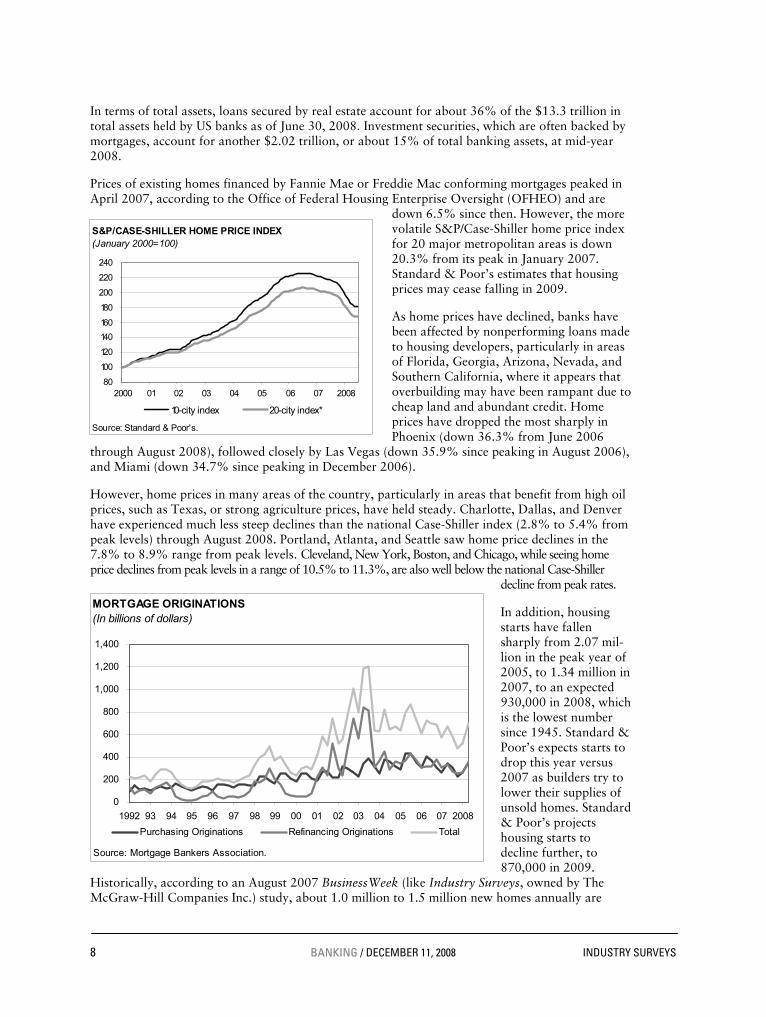
In addition, housing starts have fallen sharply from 2.07 mil-lion in the peak year of 2005, to 1.34 million in 2007, to an expected 930,000 in 2008, which is the lowest number since 1945. Standard & Poor’s expects starts to drop this year versus 2007 as builders try to lower their supplies of unsold homes. Standard & Poor’s projects housing starts to decline further, to 870,000 in 2009.
Historically, according to an August 2007 BusinessWeek (like Industry Surveys, owned by The McGraw-Hill Companies Inc.) study, about 1.0 million to 1.5 million new homes annually are
[Insert new Graph H06 Case-Shiller, here]
80
100
120
140
160
180
200
220
240
2000 01 02 03 04 05 06 07 2008
10-city index 20-city index*
S&P/CASE-SHILLER HOME PRICE INDEX(January 2000=100)
Source: Standard & Poor's.
[Insert Graph H05 Mortgage Originations, here]
MORTGAGE ORIGINATIONS(In billions of dollars)
0
200
400
600
800
1,000
1,200
1,400
1992 93 94 95 96 97 98 99 00 01 02 03 04 05 06 07 2008
Purchasing Originations Refinancing Originations Total
Source: Mortgage Bankers Association.
INDUSTRY SURVEYS BANKING / DECEMBER 11, 2008 9
needed to house the growing US population, which grows about 1.1% annually, an annual increase of about 3.4 million people. However, the glut of unsold homes created in boom times will take several quarters to digest.
Banks with loans outstanding to residential developers may continue to experience declines in the credit quality of their loan portfolios. In addition, a significant part of banks’ noninterest income has come from mortgage banking and loan origination fees, which are tied to the housing industry. These kinds of fee income continued to grow at many banks through mid-2007, but fell off sharply as the year progressed. For 2009, Standard & Poor’s Equity Research expects poor growth for these kinds of fee-generating activities. Moreover, with consumers increasingly under stress, home equity loans may be vulnerable, and could lead to further declines in bank’s credit quality.
To a lesser extent for regional banks, credit card lending may be vulnerable, too. Credit cards are a smaller business for regional banks than are home equity loans. While many US regional banks issue credit cards, they often focus on their existing customers, whose loan repayment history they know well. According to statistics compiled by Congress, 80% of credit cards are issued by five financial companies — Discover Financial Services LLC, Bank of America Corp., Citigroup Inc., JPMorgan Chase & Co., and Capital One Financial Corp. — none of which are regional banks.
Standard & Poor’s thinks it may be likely that strapped consumers, particularly those facing foreclosure, have been using their credit cards for monthly expenditures, thus running large balances, which may later prove to be unpayable. Some evidence to support this theory is that credit card lending balances — $396 billion as of June 30, 2008, at FDIC-insured banks — were up 5.9% from a year earlier.
Other evidence to support this view comes from other credit card lenders that have noted signs of stress, in terms of nonperforming loans, in their credit card portfolios. Target Corp., the second largest US discount retailer, announced on November 17, 2008, that 7.7% of its balances outstanding were over 30 days due, which is significantly above the industry average (currently 4.4%, also an elevated figure). Capital One Financial Corp. has also noted significant increases in the levels of nonperforming credit card loans.
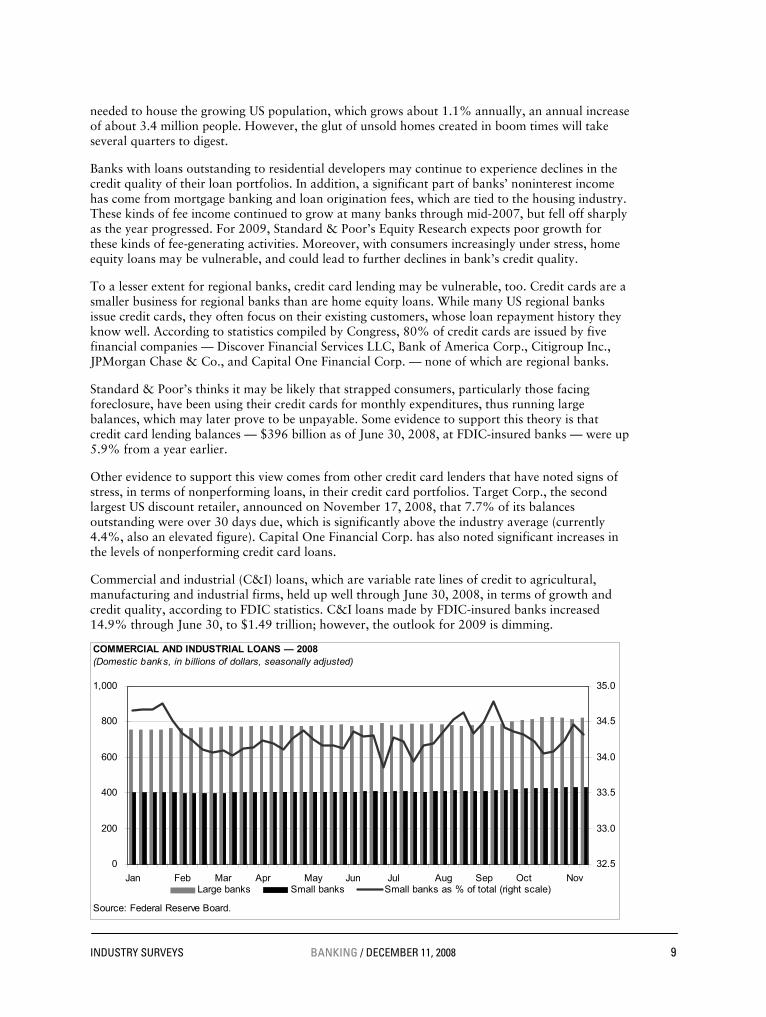
Commercial and industrial (C&I) loans, which are variable rate lines of credit to agricultural, manufacturing and industrial firms, held up well through June 30, 2008, in terms of growth and credit quality, according to FDIC statistics. C&I loans made by FDIC-insured banks increased 14.9% through June 30, to $1.49 trillion; however, the outlook for 2009 is dimming.
[Insert Chart H03 Loans Weekly, here]
0
200
400
600
800
1,000
Jan Feb Mar Apr May Jun Jul Aug Sep Oct Nov
32.5
33.0
33.5
34.0
34.5
35.0
Large banks Small banks Small banks as % of total (right scale)
COMMERCIAL AND INDUSTRIAL LOANS — 2008(Domestic banks, in billions of dollars, seasonally adjusted)
Source: Federal Reserve Board.
10 BANKING / DECEMBER 11, 2008 INDUSTRY SURVEYS
Nonresidential construction is softening this year, as office construction slows. Standard & Poor’s expects nonresidential construction activity to increase 3.4% in 2008, and fall 6.8% in 2009.
After numerous attempts by the Federal Reserve, the US Treasury, and European and Asian central banks to unfreeze the financial markets, evidence that the credit crisis may be ending remains elusive. As of November 17, 2008, the difference between the rate on US dollar–denominated loans in London, and the three-month US Treasury bill remained relatively high at 215 basis points.
Finally, the election of a new US President and Democratic majorities in the House and Senate will most likely lead to some fairly significant changes in Federal spending. In addition, some federal changes, such as tax rate increases, will happen automatically, unless Congress acts.
BANKING INDUSTRY OUTLOOK
Standard & Poor’s Equity Research projects that loan loss provisioning expenses will be relatively high for the rest of 2008 and likely in 2009 as well. Most of the decline in large regional banks’ credit quality through the end of the third quarter of 2008 was centered on loans made to residen-tial developers; in contrast, first mortgages, home equity loans, car loans, credit cards, and commer-cial and industrial lending generally did not deteriorate nearly to the same extent as housing con-struction loans. While large regional banks are likely adequately reserved for loans made to residen-tial developers, the other loan categories mentioned above may now be vulnerable and could require additional loan loss provisioning should the US economy deteriorate further. Moreover, current bank stock valuations might not fully discount this possibility.
The credit-related challenges facing US regional banks may take several more quarters before they are resolved. Because many banks have reserve levels well below what current elevated net charge-off levels require, loan loss provisioning expenses will likely remain high relative to historical trends as banks replenish their reserves.
In addition, many regional banks have continued to experience difficulties in funding their loan portfolios, despite Federal Reserve rate cuts and other actions taken by the Fed to inject liquidity into the banking system. Many banks noted in their third-quarter earnings calls that they would like to grow loans at a faster pace, but are not able to fund this growth. They are unwilling to compete for deposits with newer or more aggressive financial institutions that are advertising, in their service territories, relatively high rates for deposits. Moreover, the emergence of many new large banks from the recent conversions of Morgan Stanley, Goldman Sachs, and American Express to FDIC-regulated banks will likely intensify competition for deposits in the coming quarters.
Several upcoming legislative initiatives on credit cards, mortgage modifications, and home foreclo-sures, may impose severe restrictions on bank profitability and growth. In addition, merger and ac-quisition activity (not counting rescue situations) has been muted in the last year, as potential acquirers remain cautious. Such activity may resume in 2009, as credit quality for loans and securi-ties improves and financing issues ease.
Finally, the recent extension of the TARP to regional banks should provide some benefits. Banks will have access to relatively inexpensive capital that has no significant restrictions on its use. Such capital can allow them to build loan loss reserves; increase Tier 1, total, equity, and leverage ratios; or make selective acquisitions of weaker rivals.
INDUSTRY SURVEYS BANKING / DECEMBER 11, 2008 11
INDUSTRY PROFILE
A consolidating and modernizing industry
Compared with the banking systems of most developed countries, such as Canada, where six banks effectively control the entire banking industry, the US banking industry is quite fragmented, with thousands of banks. At June 30, 2008, the Federal Deposit Insurance Corporation (FDIC) insured 7,203 commercial banks and 1,248 savings institutions, for a total of 8,451 banks. Legions of smaller community and regional banks across the nation compete with industry leaders in service and pricing.
Deregulation gathered force in the 1980s, as Depression–era laws and court decisions concerning the industry were updated or replaced. Some regulations, such as caps on rates paid to depositors, and restrictions on interstate banking, had simply outlived whatever usefulness their creators had intended decades back. Other restrictions, such as banning banks from underwriting securities or offering insurance services, were seen by many as excessively harsh reactions to long-ago abuses.
In 1994, federal restrictions on interstate banking mergers were dropped. This, combined with banks’ drive to expand market share, enhance geographic coverage, increase the number of products and services offered, and improve efficiency, has led to significant consolidation.
Due to mergers and bankruptcies, the number of commercial banks insured by the FDIC has declined steadily since the 1970s. In 1975, there were 14,628 commercial banks in the US; by 1984, that total had fallen to 14,500. Declines continued in subsequent decades,
to 10,451 in 1994 and 7,630 in 2004; by year-end 2007, there were 7,282 commercial banks in the US. At June 30, 2008, the number stood at 7,203.
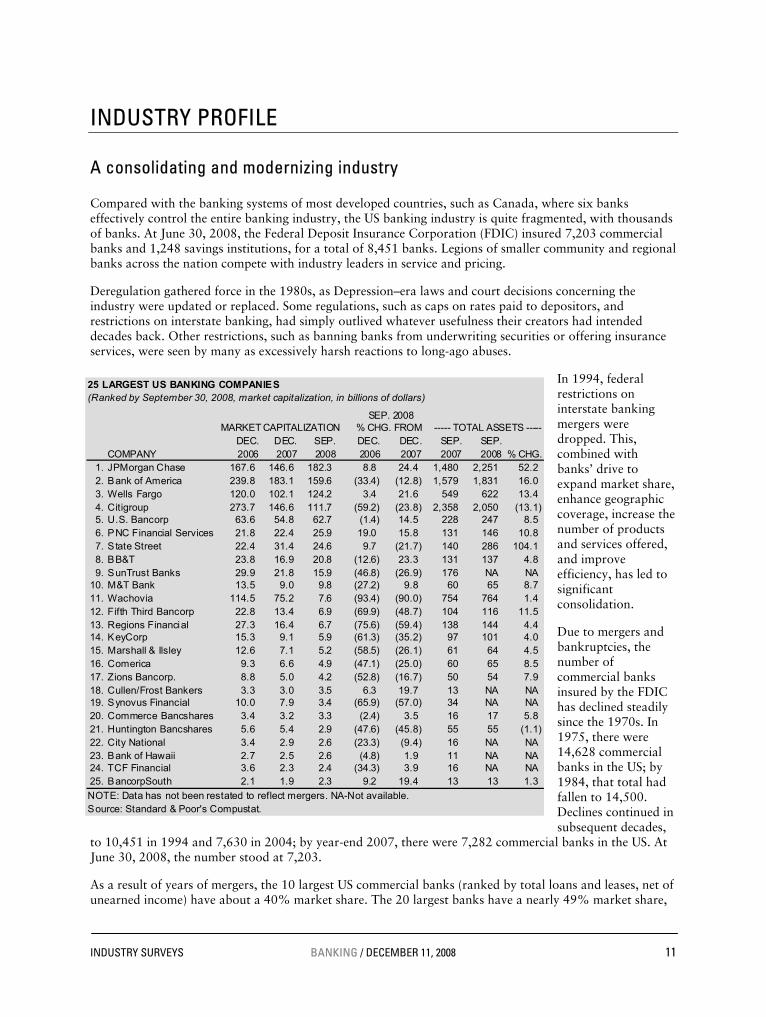
As a result of years of mergers, the 10 largest US commercial banks (ranked by total loans and leases, net of unearned income) have about a 40% market share. The 20 largest banks have a nearly 49% market share,
[Insert Table B08 25 Largest Banking Companies, here]
25 LARGEST US BANKING COMPANIES(Ranked by September 30, 2008, market capitalization, in billions of dollars)
SEP. 2008 MARKET CAPITALIZATION % CHG. FROM ----- TOTAL ASSETS -----
DEC. DEC. SEP. DEC. DEC. SEP. SEP.COMPANY 2006 2007 2008 2006 2007 2007 2008 % CHG.
1. JPMorgan Chase 167.6 146.6 182.3 8.8 24.4 1,480 2,251 52.22. Bank of America 239.8 183.1 159.6 (33.4) (12.8) 1,579 1,831 16.03. Wells Fargo 120.0 102.1 124.2 3.4 21.6 549 622 13.44. Citigroup 273.7 146.6 111.7 (59.2) (23.8) 2,358 2,050 (13.1)5. U.S. Bancorp 63.6 54.8 62.7 (1.4) 14.5 228 247 8.56. PNC Financial Services 21.8 22.4 25.9 19.0 15.8 131 146 10.87. State Street 22.4 31.4 24.6 9.7 (21.7) 140 286 104.18. BB&T 23.8 16.9 20.8 (12.6) 23.3 131 137 4.89. SunTrust Banks 29.9 21.8 15.9 (46.8) (26.9) 176 NA NA
10. M&T Bank 13.5 9.0 9.8 (27.2) 9.8 60 65 8.711. Wachovia 114.5 75.2 7.6 (93.4) (90.0) 754 764 1.412. Fifth Third Bancorp 22.8 13.4 6.9 (69.9) (48.7) 104 116 11.513. Regions Financial 27.3 16.4 6.7 (75.6) (59.4) 138 144 4.414. KeyCorp 15.3 9.1 5.9 (61.3) (35.2) 97 101 4.015. Marshall & Ilsley 12.6 7.1 5.2 (58.5) (26.1) 61 64 4.516. Comerica 9.3 6.6 4.9 (47.1) (25.0) 60 65 8.517. Zions Bancorp. 8.8 5.0 4.2 (52.8) (16.7) 50 54 7.918. Cullen/Frost Bankers 3.3 3.0 3.5 6.3 19.7 13 NA NA 19. Synovus Financial 10.0 7.9 3.4 (65.9) (57.0) 34 NA NA 20. Commerce Bancshares 3.4 3.2 3.3 (2.4) 3.5 16 17 5.821. Huntington Bancshares 5.6 5.4 2.9 (47.6) (45.8) 55 55 (1.1)22. City National 3.4 2.9 2.6 (23.3) (9.4) 16 NA NA 23. Bank of Hawaii 2.7 2.5 2.6 (4.8) 1.9 11 NA NA 24. TCF Financial 3.6 2.3 2.4 (34.3) 3.9 16 NA NA 25. BancorpSouth 2.1 1.9 2.3 9.2 19.4 13 13 1.3
NOTE: Data has not been restated to reflect mergers. NA-Not available.Source: Standard & Poor's Compustat.

12 BANKING / DECEMBER 11, 2008 INDUSTRY SURVEYS
the 25 largest banks have a 50% market share, and the 100 largest have more than 64% market share. (Note: All of our calculations in this section are based on data from the FDIC and Highline Data.)
At June 30, 2008, the 10 largest banks in the United States held about 36% of domestic deposits, and nearly 44% of total deposits; the 20 largest held more than 44% of domestic deposits and nearly 53% of total deposits. The 100 largest banks hold more than 60% of domestic deposits, and more than 67% of total deposits. Half of the market share of domestic deposits is held by 32 banks, while 50% of total deposits is held by only 16 banks.
The five largest US bank holding companies, ranked by assets at June 30, 2008, were Citigroup Inc. ($2.1 trillion), JPMorgan Chase & Co. ($1.8 trillion), Bank of America Corp. ($1.7 trillion), Wachovia Corp. ($812 billion), and Wells Fargo & Co. ($609 billion). Together, they control nearly 53% of industry assets of $13.3 trillion. At June 30, 2008, 17 FDIC-insured institutions operating in the United States had assets of more than $100 billion each; their aggregate assets totaled $6.93 trillion, or 52.1% of industry assets of $13.3 trillion.
Eighty-seven commercial and savings banks (including the 17 banks previously mentioned) had assets of more than $10 billion each at June 30, 2008; their aggregate assets were $9.13 trillion, equal to 68.6% of total industry assets. When the 561 commercial and savings banks with assets of more than $1 billion each are added in, the asset total rises to $10.4 trillion, or 78.1% of industry assets.
While some banking regulations have been dropped over the years, federal, state, and local legislatures and courts across the US have stepped up regulation of the banking industry in other ways. Though banks are now allowed to merge across state lines, pay whatever they want on deposits, and engage in nonbanking services such as insurance, they now face greater reporting requirements, laws regarding how quickly customer funds must be made available, stronger consumer protection laws, and so on. In addition, recent government initiatives, including the Troubled Asset Relief Program (TARP) and the associated Capital Purchase Program (CPP), will likely increase the concentration of the industry, and will subject it to more oversight.
INDUSTRY TRENDS
A number of important and interrelated banking industry trends are covered in this section. We focus on the financial health of the banking industry, consolidation, customer convenience initiatives, and regulatory change.
THE FINANCIAL CONDITION OF THE US BANKING SYSTEM
Several areas of weakness have emerged since mid-2007. A number of major indicators of banking industry health — such as the number of problem banks, bank failures, the loan delinquency rate, the level of charge-offs, and the level of loan loss reserves — have deteriorated in this time. Other measures of industry financial strength have also worsened, such as the percentage of banks that are not profitable, industry net income growth, and return on equity (ROE).
Bank failures on the rise As of June 30, 2008, the FDIC classified 117 insured institutions, with combined assets of $78.3 billion, as “problem institutions” — those having financial, operational, or managerial weaknesses that threaten their viability. Although this figure is above the low level of 50 institutions at December 31, 2006, it is still below the level reached in 2002, when the figure stood at 136. To place these recent figures in a larger historical context, at year-end 1991, 1,426 banks with $819 billion in assets were classified as problem institutions.
The FDIC does not release the names of the institutions on the problem list, but investors and analysts who follow the banking industry closely can often unofficially ascertain whether a particular institution may be
INDUSTRY SURVEYS BANKING / DECEMBER 11, 2008 13
on the list. This can be done by projecting cumulative write-offs of troubled loans, and gauging the effect on a bank’s capital levels.
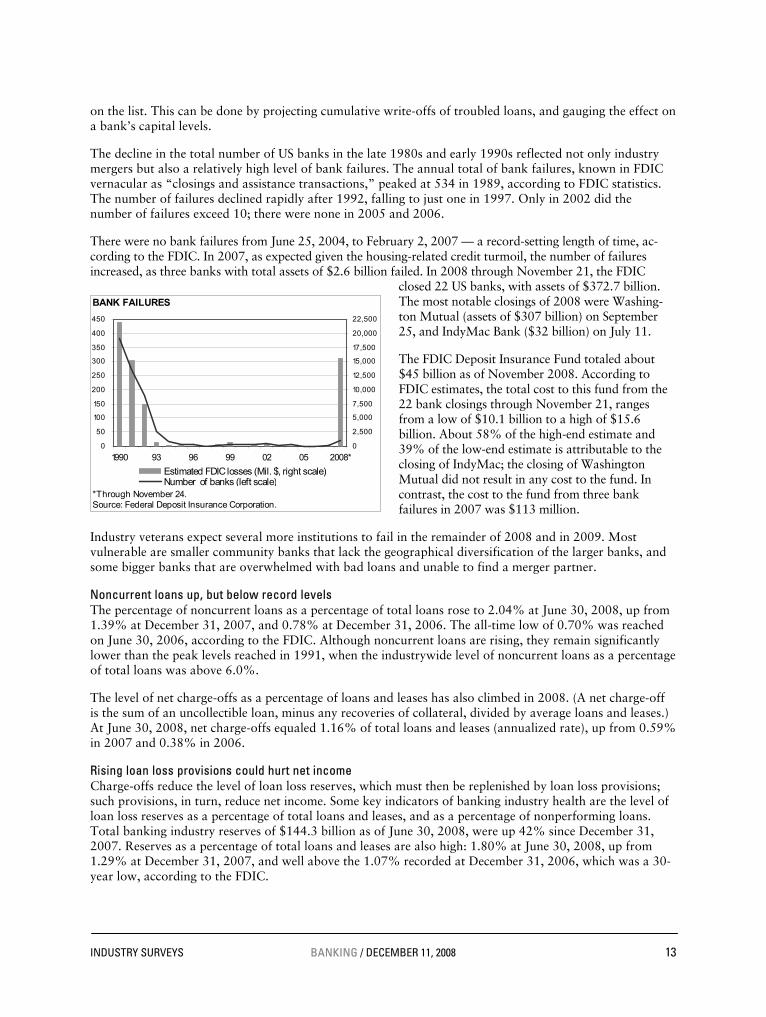
The decline in the total number of US banks in the late 1980s and early 1990s reflected not only industry mergers but also a relatively high level of bank failures. The annual total of bank failures, known in FDIC vernacular as “closings and assistance transactions,” peaked at 534 in 1989, according to FDIC statistics. The number of failures declined rapidly after 1992, falling to just one in 1997. Only in 2002 did the number of failures exceed 10; there were none in 2005 and 2006.
There were no bank failures from June 25, 2004, to February 2, 2007 — a record-setting length of time, ac-cording to the FDIC. In 2007, as expected given the housing-related credit turmoil, the number of failures increased, as three banks with total assets of $2.6 billion failed. In 2008 through November 21, the FDIC
closed 22 US banks, with assets of $372.7 billion. The most notable closings of 2008 were Washing-ton Mutual (assets of $307 billion) on September 25, and IndyMac Bank ($32 billion) on July 11.
The FDIC Deposit Insurance Fund totaled about $45 billion as of November 2008. According to FDIC estimates, the total cost to this fund from the 22 bank closings through November 21, ranges from a low of $10.1 billion to a high of $15.6 billion. About 58% of the high-end estimate and 39% of the low-end estimate is attributable to the closing of IndyMac; the closing of Washington Mutual did not result in any cost to the fund. In contrast, the cost to the fund from three bank failures in 2007 was $113 million.
Industry veterans expect several more institutions to fail in the remainder of 2008 and in 2009. Most vulnerable are smaller community banks that lack the geographical diversification of the larger banks, and some bigger banks that are overwhelmed with bad loans and unable to find a merger partner.
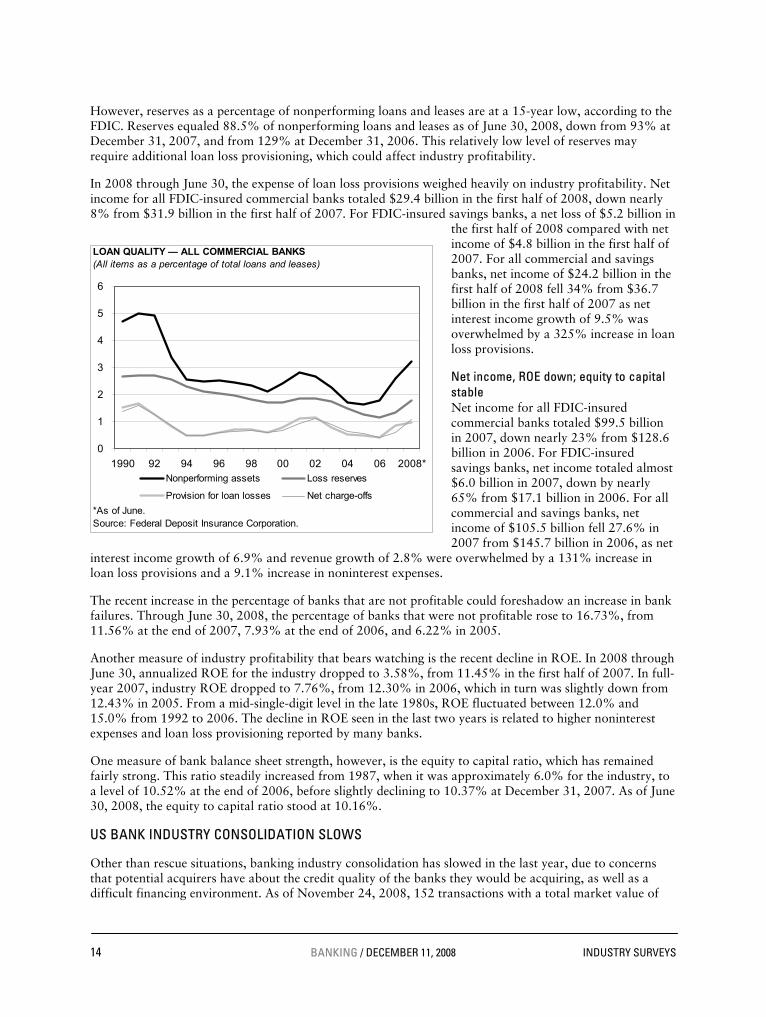
Noncurrent loans up, but below record levels The percentage of noncurrent loans as a percentage of total loans rose to 2.04% at June 30, 2008, up from 1.39% at December 31, 2007, and 0.78% at December 31, 2006. The all-time low of 0.70% was reached on June 30, 2006, according to the FDIC. Although noncurrent loans are rising, they remain significantly lower than the peak levels reached in 1991, when the industrywide level of noncurrent loans as a percentage of total loans was above 6.0%.
The level of net charge-offs as a percentage of loans and leases has also climbed in 2008. (A net charge-off is the sum of an uncollectible loan, minus any recoveries of collateral, divided by average loans and leases.) At June 30, 2008, net charge-offs equaled 1.16% of total loans and leases (annualized rate), up from 0.59% in 2007 and 0.38% in 2006.
Rising loan loss provisions could hurt net income Charge-offs reduce the level of loan loss reserves, which must then be replenished by loan loss provisions; such provisions, in turn, reduce net income. Some key indicators of banking industry health are the level of loan loss reserves as a percentage of total loans and leases, and as a percentage of nonperforming loans. Total banking industry reserves of $144.3 billion as of June 30, 2008, were up 42% since December 31, 2007. Reserves as a percentage of total loans and leases are also high: 1.80% at June 30, 2008, up from 1.29% at December 31, 2007, and well above the 1.07% recorded at December 31, 2006, which was a 30-year low, according to the FDIC.
[Insert new Graph on bank failures per year, since 1980, here]
0
50
100
150
200
250
300
350
400
450
1990 93 96 99 02 05 2008*0
2,500
5,000
7,500
10,000
12,500
15,000
17,500
20,000
22,500
Estimated FDIC losses (Mil. $, right scale)Number of banks (left scale)
BANK FAILURES
*Through November 24.Source: Federal Deposit Insurance Corporation.
14 BANKING / DECEMBER 11, 2008 INDUSTRY SURVEYS
However, reserves as a percentage of nonperforming loans and leases are at a 15-year low, according to the FDIC. Reserves equaled 88.5% of nonperforming loans and leases as of June 30, 2008, down from 93% at December 31, 2007, and from 129% at December 31, 2006. This relatively low level of reserves may require additional loan loss provisioning, which could affect industry profitability.
In 2008 through June 30, the expense of loan loss provisions weighed heavily on industry profitability. Net income for all FDIC-insured commercial banks totaled $29.4 billion in the first half of 2008, down nearly 8% from $31.9 billion in the first half of 2007. For FDIC-insured savings banks, a net loss of $5.2 billion in
the first half of 2008 compared with net income of $4.8 billion in the first half of 2007. For all commercial and savings banks, net income of $24.2 billion in the first half of 2008 fell 34% from $36.7 billion in the first half of 2007 as net interest income growth of 9.5% was overwhelmed by a 325% increase in loan loss provisions.
Net income, ROE down; equity to capital stable Net income for all FDIC-insured commercial banks totaled $99.5 billion in 2007, down nearly 23% from $128.6 billion in 2006. For FDIC-insured savings banks, net income totaled almost $6.0 billion in 2007, down by nearly 65% from $17.1 billion in 2006. For all commercial and savings banks, net income of $105.5 billion fell 27.6% in 2007 from $145.7 billion in 2006, as net
interest income growth of 6.9% and revenue growth of 2.8% were overwhelmed by a 131% increase in loan loss provisions and a 9.1% increase in noninterest expenses.
The recent increase in the percentage of banks that are not profitable could foreshadow an increase in bank failures. Through June 30, 2008, the percentage of banks that were not profitable rose to 16.73%, from 11.56% at the end of 2007, 7.93% at the end of 2006, and 6.22% in 2005.
Another measure of industry profitability that bears watching is the recent decline in ROE. In 2008 through June 30, annualized ROE for the industry dropped to 3.58%, from 11.45% in the first half of 2007. In full-year 2007, industry ROE dropped to 7.76%, from 12.30% in 2006, which in turn was slightly down from 12.43% in 2005. From a mid-single-digit level in the late 1980s, ROE fluctuated between 12.0% and 15.0% from 1992 to 2006. The decline in ROE seen in the last two years is related to higher noninterest expenses and loan loss provisioning reported by many banks.
One measure of bank balance sheet strength, however, is the equity to capital ratio, which has remained fairly strong. This ratio steadily increased from 1987, when it was approximately 6.0% for the industry, to a level of 10.52% at the end of 2006, before slightly declining to 10.37% at December 31, 2007. As of June 30, 2008, the equity to capital ratio stood at 10.16%.
US BANK INDUSTRY CONSOLIDATION SLOWS
Other than rescue situations, banking industry consolidation has slowed in the last year, due to concerns that potential acquirers have about the credit quality of the banks they would be acquiring, as well as a difficult financing environment. As of November 24, 2008, 152 transactions with a total market value of
[Insert Graph H16 Loan Quality, here]
0
1
2
3
4
5
6
1990 92 94 96 98 00 02 04 06 2008*Nonperforming assets Loss reserves
Provision for loan losses Net charge-offs
LOAN QUALITY — ALL COMMERCIAL BANKS (All items as a percentage of total loans and leases)
*As of June.Source: Federal Deposit Insurance Corporation.
INDUSTRY SURVEYS BANKING / DECEMBER 11, 2008 15
almost $83 billion had been announced. If transactions continued at this pace for the full year, the total would be 169 transactions with a market value of $92 billion. We consider this to be fairly low and point to recent merger statistics for a contrast. During the seven years from 2001 to 2007, an average of 280 US bank acquisitions were announced annually. In 2004, there was a total of $130.5 billion in announced transactions, which was the highest level of value of any year in that period.
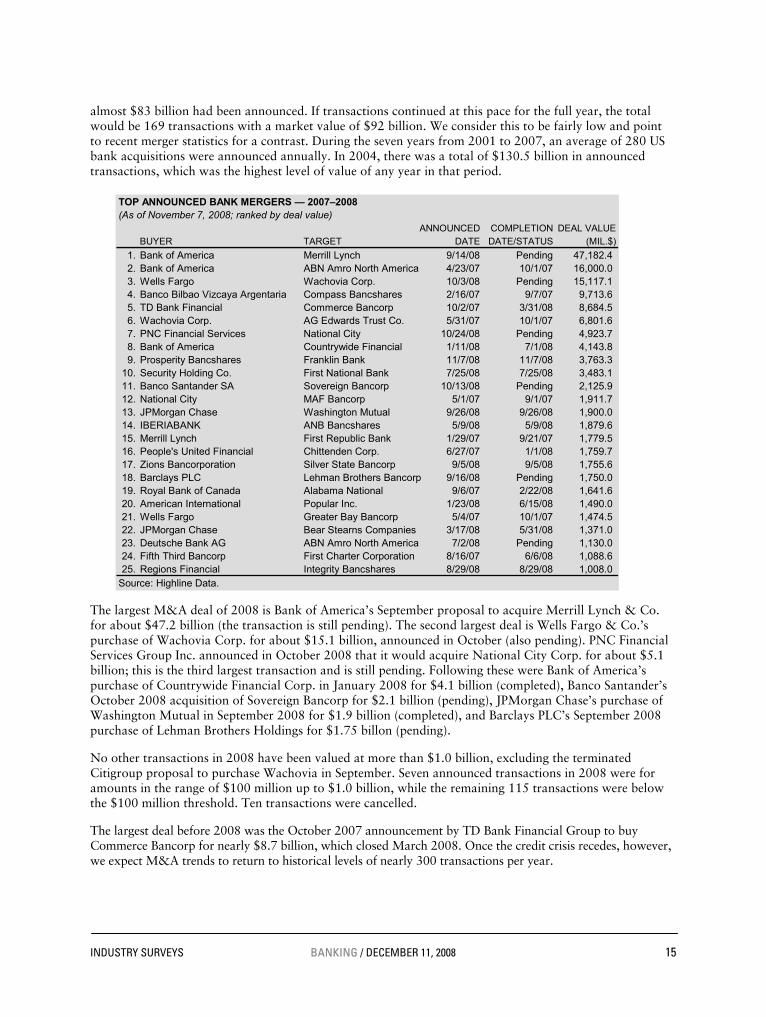
The largest M&A deal of 2008 is Bank of America’s September proposal to acquire Merrill Lynch & Co. for about $47.2 billion (the transaction is still pending). The second largest deal is Wells Fargo & Co.’s purchase of Wachovia Corp. for about $15.1 billion, announced in October (also pending). PNC Financial Services Group Inc. announced in October 2008 that it would acquire National City Corp. for about $5.1 billion; this is the third largest transaction and is still pending. Following these were Bank of America’s purchase of Countrywide Financial Corp. in January 2008 for $4.1 billion (completed), Banco Santander’s October 2008 acquisition of Sovereign Bancorp for $2.1 billion (pending), JPMorgan Chase’s purchase of Washington Mutual in September 2008 for $1.9 billion (completed), and Barclays PLC’s September 2008 purchase of Lehman Brothers Holdings for $1.75 billon (pending).
No other transactions in 2008 have been valued at more than $1.0 billion, excluding the terminated Citigroup proposal to purchase Wachovia in September. Seven announced transactions in 2008 were for amounts in the range of $100 million up to $1.0 billion, while the remaining 115 transactions were below the $100 million threshold. Ten transactions were cancelled.
The largest deal before 2008 was the October 2007 announcement by TD Bank Financial Group to buy Commerce Bancorp for nearly $8.7 billion, which closed March 2008. Once the credit crisis recedes, however, we expect M&A trends to return to historical levels of nearly 300 transactions per year.
[Insert Table B09 Merger & acquisition, here]
TOP ANNOUNCED BANK MERGERS — 2007–2008(As of November 7, 2008; ranked by deal value)
ANNOUNCED COMPLETION DEAL VALUEBUYER TARGET DATE DATE/STATUS (MIL.$)
1. Bank of America Merrill Lynch 9/14/08 Pending 47,182.42. Bank of America ABN Amro North America 4/23/07 10/1/07 16,000.03. Wells Fargo Wachovia Corp. 10/3/08 Pending 15,117.14. Banco Bilbao Vizcaya Argentaria Compass Bancshares 2/16/07 9/7/07 9,713.65. TD Bank Financial Commerce Bancorp 10/2/07 3/31/08 8,684.56. Wachovia Corp. AG Edwards Trust Co. 5/31/07 10/1/07 6,801.67. PNC Financial Services National City 10/24/08 Pending 4,923.78. Bank of America Countrywide Financial 1/11/08 7/1/08 4,143.89. Prosperity Bancshares Franklin Bank 11/7/08 11/7/08 3,763.3
10. Security Holding Co. First National Bank 7/25/08 7/25/08 3,483.111. Banco Santander SA Sovereign Bancorp 10/13/08 Pending 2,125.912. National City MAF Bancorp 5/1/07 9/1/07 1,911.713. JPMorgan Chase Washington Mutual 9/26/08 9/26/08 1,900.014. IBERIABANK ANB Bancshares 5/9/08 5/9/08 1,879.615. Merrill Lynch First Republic Bank 1/29/07 9/21/07 1,779.516. People's United Financial Chittenden Corp. 6/27/07 1/1/08 1,759.717. Zions Bancorporation Silver State Bancorp 9/5/08 9/5/08 1,755.618. Barclays PLC Lehman Brothers Bancorp 9/16/08 Pending 1,750.019. Royal Bank of Canada Alabama National 9/6/07 2/22/08 1,641.620. American International Popular Inc. 1/23/08 6/15/08 1,490.021. Wells Fargo Greater Bay Bancorp 5/4/07 10/1/07 1,474.522. JPMorgan Chase Bear Stearns Companies 3/17/08 5/31/08 1,371.023. Deutsche Bank AG ABN Amro North America 7/2/08 Pending 1,130.024. Fifth Third Bancorp First Charter Corporation 8/16/07 6/6/08 1,088.625. Regions Financial Integrity Bancshares 8/29/08 8/29/08 1,008.0
Source: Highline Data.
16 BANKING / DECEMBER 11, 2008 INDUSTRY SURVEYS
HISTORICAL CONSOLIDATION TRENDS
In the late 1980s, against a backdrop of concerns about banks’ credit quality, M&As became common, as strong banks took over weak or failing institutions. M&A activity accelerated in the 1990s before slowing in late 2007. Consolidation may continue over the long term, as banks move to compete more efficiently in a less regulated environment.
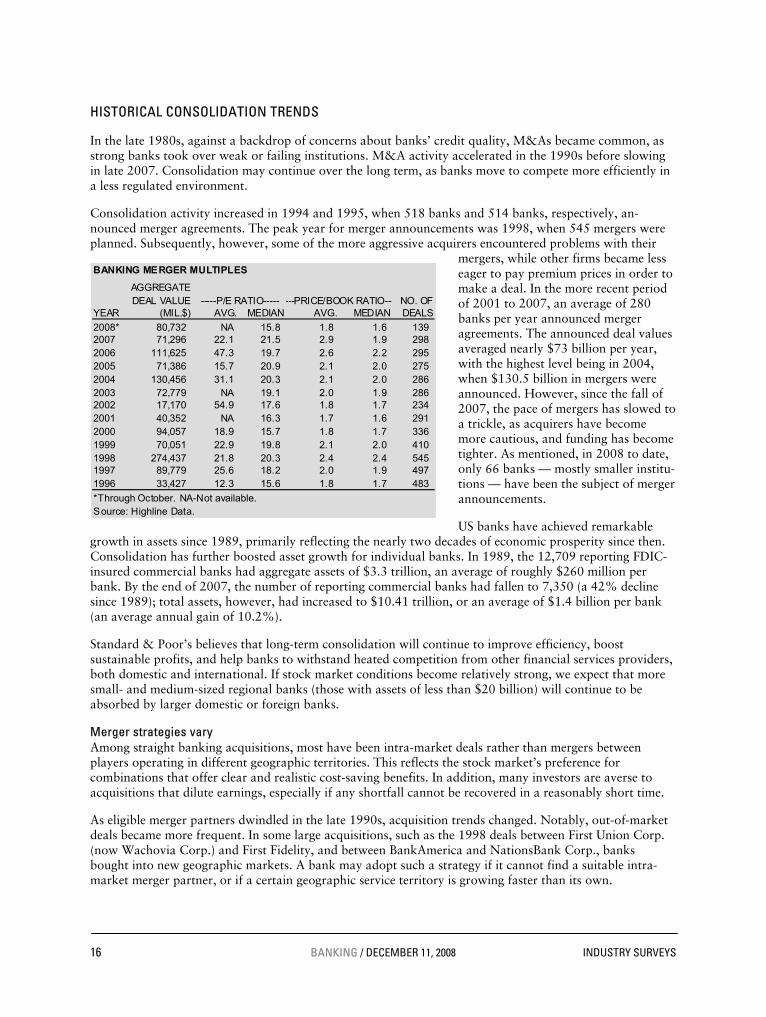
Consolidation activity increased in 1994 and 1995, when 518 banks and 514 banks, respectively, an-nounced merger agreements. The peak year for merger announcements was 1998, when 545 mergers were planned. Subsequently, however, some of the more aggressive acquirers encountered problems with their
mergers, while other firms became less eager to pay premium prices in order to make a deal. In the more recent period of 2001 to 2007, an average of 280 banks per year announced merger agreements. The announced deal values averaged nearly $73 billion per year, with the highest level being in 2004, when $130.5 billion in mergers were announced. However, since the fall of 2007, the pace of mergers has slowed to a trickle, as acquirers have become more cautious, and funding has become tighter. As mentioned, in 2008 to date, only 66 banks — mostly smaller institu-tions — have been the subject of merger announcements.
US banks have achieved remarkable growth in assets since 1989, primarily reflecting the nearly two decades of economic prosperity since then. Consolidation has further boosted asset growth for individual banks. In 1989, the 12,709 reporting FDIC-insured commercial banks had aggregate assets of $3.3 trillion, an average of roughly $260 million per bank. By the end of 2007, the number of reporting commercial banks had fallen to 7,350 (a 42% decline since 1989); total assets, however, had increased to $10.41 trillion, or an average of $1.4 billion per bank (an average annual gain of 10.2%).
Standard & Poor’s believes that long-term consolidation will continue to improve efficiency, boost sustainable profits, and help banks to withstand heated competition from other financial services providers, both domestic and international. If stock market conditions become relatively strong, we expect that more small- and medium-sized regional banks (those with assets of less than $20 billion) will continue to be absorbed by larger domestic or foreign banks.
Merger strategies vary Among straight banking acquisitions, most have been intra-market deals rather than mergers between players operating in different geographic territories. This reflects the stock market’s preference for combinations that offer clear and realistic cost-saving benefits. In addition, many investors are averse to acquisitions that dilute earnings, especially if any shortfall cannot be recovered in a reasonably short time.
As eligible merger partners dwindled in the late 1990s, acquisition trends changed. Notably, out-of-market deals became more frequent. In some large acquisitions, such as the 1998 deals between First Union Corp. (now Wachovia Corp.) and First Fidelity, and between BankAmerica and NationsBank Corp., banks bought into new geographic markets. A bank may adopt such a strategy if it cannot find a suitable intra-market merger partner, or if a certain geographic service territory is growing faster than its own.
[Insert Table B07 Merger Multiples, here]
BANKING MERGER MULTIPLES
AGGREGATEDEAL VALUE NO. OF
YEAR (MIL.$) AVG. MEDIAN AVG. MEDIAN DEALS
2008* 80,732 NA 15.8 1.8 1.6 1392007 71,296 22.1 21.5 2.9 1.9 2982006 111,625 47.3 19.7 2.6 2.2 2952005 71,386 15.7 20.9 2.1 2.0 2752004 130,456 31.1 20.3 2.1 2.0 2862003 72,779 NA 19.1 2.0 1.9 2862002 17,170 54.9 17.6 1.8 1.7 2342001 40,352 NA 16.3 1.7 1.6 2912000 94,057 18.9 15.7 1.8 1.7 3361999 70,051 22.9 19.8 2.1 2.0 4101998 274,437 21.8 20.3 2.4 2.4 5451997 89,779 25.6 18.2 2.0 1.9 4971996 33,427 12.3 15.6 1.8 1.7 483
*Through October. NA-Not available.Source: Highline Data.
-----P/E RATIO----- ---PRICE/BOOK RATIO---
INDUSTRY SURVEYS BANKING / DECEMBER 11, 2008 17
At that time, the industry began to favor acquisitions of nonbank financial institutions, which had something to offer other than traditional retail branch networks. Banks appeared to be more willing than before to acquire customer bases for high-margin lines (such as credit cards) or for businesses that give them a national brand-name presence. The trend toward diversification may have been dampened in 2001 and 2002 by tighter regulation, weakness in capital markets, and credit quality concerns. In recent years, the industry has seen a number of spin-offs and divestitures as banks have returned to a focus on core lending operations. Looking forward, however, we expect that banks seeking external growth may focus on wealth management companies and consumer finance companies.
Motives for merging The primary factor favoring further consolidation is competition, which has intensified pressure on banks to expand market share, increase geographic presence and diversification, improve efficiency, and offer a broader range of financial products. Consolidation can help banks to fend off competition from other commercial banks as well as from nonbank providers of financial services.
Banks contend that they become financially stronger following a merger because they can reduce the acquired bank’s noninterest (operating) costs. Savings are especially noticeable in intra-market deals, in which duplication of bank infrastructure is high. Combining back-office operations and closing branches in overlapping service territories can cut the combined banks’ costs by 20% or more. Normally, if the integration process goes smoothly, only a small portion of the acquired bank’s business is lost to competitors when branch offices are sold or closed. Often, branches are sold to satisfy antitrust regulators or because a bank does not want to be in a certain area.
Other benefits of consolidation include expanded delivery networks and product diversification. We believe that, for consumers, consolidation stands to bring lower banking costs, broader products, and greater convenience. The promise of greater efficiency has generated an “acquire or be acquired” mentality among bank managers. For a bank to remain independent, it must maintain strong earnings and an above-average growth rate.
Trends in merger activity According to Highline Data, the total purchase price of announced and completed bank acquisitions was $40.3 billion in 2001, $17.2 billion in 2002, $72.8 billion in 2003, $130.4 billion in 2004, $71.3 billion in 2005, and $114.5 billion in 2006. In 2007, the total of all announced purchase prices was $64.6 billion; the largest of these transactions was ABN AMRO Holding NV, for $16 billion, which was one of 11 transactions worth more than $1 billion.
Median acquisition prices increased in 2003, 2004, 2005, and 2006 to about 2.0, 2.1, 2.2, and 2.6 times book value, respectively. In 2007, the median acquisition price fell to 2.1 times book. (See the “Top Announced Bank Mergers” table for the largest deals in 2007 and 2008 through November) To put this into a historical context, the median takeover price in 1998 was 2.4 times book, up from 1.6 times book in 1995.
In 2007, 321 FDIC-insured institutions were absorbed through mergers or other consolidation moves, compared with 342 mergers or consolidations in 2006, 315 in 2005, 322 in 2004, 275 in 2003, 297 in 2002, 357 in 2001, 453 in 2000, and 606 in 1995. The number of banks involved in deals per year has been relatively steady since the start of 2002, with a low of 275 in 2003 and a high of 342 in 2006.
Inducing efficiency By reducing operating costs, consolidation has helped the banking industry become more efficient. The relatively low US inflation rate has helped banks exercise tight control over expense items, particularly salaries and other personnel-related costs. Restructurings that involved workforce reductions and branch consolidations were common among large banks in the mid- to late-1990s period.
Efficiency, however, cannot come at the expense of customer satisfaction. Banks run the risk of losing customers if their efforts to cut costs lead to perceived reductions in service levels. To satisfy both fiscal and

18 BANKING / DECEMBER 11, 2008 INDUSTRY SURVEYS
quality requirements, technological improvements have helped banks control expenses while providing better service. Electronic banking, automated teller machines, and the Internet improve customer service by offering 24-hour banking capabilities at convenient locations. The costs of completing such transactions remain well below the more labor-intensive operations at bank branches.
Banks’ concerted efforts to control their expense levels in recent periods have shown up in their efficiency ratios. The efficiency ratio is defined as the ratio of noninterest expense to total revenues; the lower the efficiency ratio, the better. In the early 1990s, the banking industry strove for an efficiency ratio of about 60%. By the late 1990s, the most efficient banks were achieving ratios in the low- to mid-50% range. The efficiency ratio for the industry as a whole was 59.4% in 2007, up from 2006, when it was 56.8%.
The efficiency ratio is related to the size of a bank, and to its level of fee generating activities. In 2007, the largest banks (those with more than $10 billion in assets) maintained an average efficiency ratio of 58.43%. The most efficient banks, however, were those with assets in the $1 billon to $10 billion range. These banks had efficiency ratios of 55.57% in 2007. Smaller banks (assets of $100 million to $1 billion) had efficiency ratios of nearly 66.10%, while banks with less than $100 million in assets had efficiency ratios of 76.03%.
The efficiency ratio tracks closely with the level of fee income–generating businesses that a bank maintains. The banking industry generated about 39.8% of revenues from noninterest income in 2007, down from 42.1% in 2006, a level that may more accurately reflect historical trends. Banks that generate a lower percentage of their revenues from fee income, such as those that do not offer brokerage services, insurance brokerage, or credit cards, often have efficiency ratios significantly lower than the 2007 industry average of 59.4% — as low as the mid-30% area.
Likewise, banks with significant levels of customer services, such as seven day per week branch hours, waivers of ATM and other fees, free coin counting machines, and lavish branch offices in high rent business districts, may have efficiency ratios nearing 75%. Investors should examine more closely those banks that have a relatively low percentage of revenues from fee income, without a corresponding reduction in their efficiency ratios. These banks may have inefficiencies in their cost structures, which may hamper their profitability.
CUSTOMER SERVICE AND CONVENIENCE REMAIN A FOCUS FOR BANKS
Customer service and convenience have taken on a new importance in the banking industry. Many banks now offer extended hours, prime locations, customer-friendly products, Internet banking, reduced fees, and faster, more personalized customer service. In the highly competitive environment of major metropolitan areas, it is increasingly important for banks to differentiate themselves. There has been a growing trend toward extending branch hours and offering good customer service. Several banks now waive ATM fees and offer more interaction between customers and associates. A number of banks use the customer-associate interaction to offer cross-selling opportunities for additional products and services (e.g., insurance).
Much of this competition has been brought on by several key players offering above-average service and establishing themselves in new markets at a rapid rate, mainly through de novo branch building. (De novo branches are built from scratch, rather than acquired through mergers and acquisitions.) These branches tend to have prime locations, with several additional offices within reasonable proximity. Several banks have also started determining their expansion plans based on their existing customer bases. For example, a few banks with locations in New England have expanded into Florida; they know that many past customers have retired to Florida, and some current customers have vacation homes there. In addition, Florida has a rapidly growing population, making it even more attractive.
NEW REGULATIONS RAISING COSTS
For the past several years, the US banking industry has focused on regulatory issues, such as the corporate governance provisions of the Sarbanes-Oxley Act (enacted in 2002) and the banking-related parts of the
INDUSTRY SURVEYS BANKING / DECEMBER 11, 2008 19
USA Patriot Act (enacted in 2001). These provisions are now beginning to have an impact. Smaller community banks have contended that it is difficult for them to comply with certain Sarbanes-Oxley provisions, such as the requirement that audit committees be composed entirely of independent directors and that companies have a “financial expert” on the board of directors. The provisions of the USA Patriot Act require increased investments in technology, although many in the industry have questioned the effectiveness of these investments in preventing the funding of terrorist groups or activities.
New regulations are driving banks to an additional level of accuracy and disclosure in a number of other reporting areas. The Basel Committee on Banking Supervision, an agency of the Bank for International Settlements, released its framework for new international capital standards — known as the Basel II Capital Accord — in June 2004. The rules will govern how much capital banks will be required to hold.
US regulators were expected to issue compliance requirements for US banks in 2007, with implementation projected by year-end 2007, but there were several delays; it is now uncertain when this will happen. When the Basel II Capital Accord goes into effect, all top US banks must be in compliance, with risk management systems in place to align their risk measurement and risk capital with their regulatory capital. Under Basel II, banking companies will be required to accurately report transaction positions, marked to the market, almost daily. Achieving compliance appears to be a complicated process that will demand significant technical and organizational changes.
HOW THE INDUSTRY OPERATES
Commercial banks serve as intermediaries between customers who save money and customers who borrow it. Their principal activities are collecting deposits and disbursing loans.
Individual commercial banks may diverge widely in terms of markets served and earnings sources, as we discuss in this section. Other industry concerns that we consider are: costs related to obtaining and maintaining adequate funding sources; the inherent risks in financing at a given interest rate; Federal Reserve policies and their effect on interest rates; and competitive influences on the retail (consumer) and commercial strategies of regional and money center banks.
BUSINESS TYPE
Although mergers and the consolidation of business activities have blurred the lines of distinction in recent years, most banks fall into one of these categories: money center banks, diversified financial services, regional banks, home lenders (also known as savings & loans or thrifts), and local community banks.
Money center banks tend to be headquartered in major US financial centers and are typically involved in a wide range of activities, from commercial lending, auto loans, credit cards, to international lending and foreign currency operations. Money center banks, which are covered in our Financial Services: Diversified Survey, are JP Morgan Chase, Wells Fargo, Bank of America, Citigroup, US Bancorp, and Wachovia (which is planning to complete a merger with Wells Fargo at the end of 2008).
Diversified financial services companies include Capital One, Northern Trust, Bank of New York/Mellon Corp, and State Street Financial, all of which offer banking, as part of a wide range of financial services. These firms are also covered in our Financial Services: Diversified Survey.
Enter the super-regional Regional banks, which are covered in this Survey, tend to be located in one or a few geographic areas or states, where their lending and deposit activities are generally focused. However, the merger of several large regional banks in the 1980s and 1990s following the relaxation of interstate banking regulations spurred the creation of a new kind of regional bank, the so-called super-regional. Such banks operate across many states or geographic areas and can be national in scope. The largest super-regionals in the US, ranked by
20 BANKING / DECEMBER 11, 2008 INDUSTRY SURVEYS
loans outstanding, are SunTrust Banks Inc. (based in Atlanta), National City Corp. (Columbus, Ohio), Regions Financial Corp. (Birmingham, Alabama), BB&T Corp. (Winston-Salem, North Carolina), Fifth Third Bancorp (Cincinnati), KeyCorp (Cleveland), and PNC Financial Services Group Inc. (Pittsburgh).
Large regionals, super community banks are other groups Following this group of super-regional banks are the large regional banks. They are Comerica Inc. (Dallas), M&T Bank Corp. (Buffalo, New York), Marshall & Ilsley Corp., (Milwaukee), Zions Bancorp (Salt Lake City), and Huntington Bancshares Inc. (Columbus, Ohio). In addition, some large regional banks operate as the US subsidiary of a foreign bank, such as Citizens Financial Group, Inc., the eighth largest US bank, by assets, which is owned by Edinburgh-based Royal Bank of Scotland Group Plc. Another prominent example is Commerce Bancorp, which was acquired in 2007 by Toronto-based TD Bank NA.
Another kind of regional bank utilizes the “super community bank” model, in which several small chains of local banks keep their names and identities, but are owned and operated by one holding company. A good example of this is Fulton Financial Corp. of Lancaster, Pennsylvania.
Thrifts and independent community banks Banks that operate primarily as home lenders are termed thrifts or savings & loans. They operate with a thrift charter, which mandates that a majority of their lending be directed towards housing and housing construction. In return for this requirement, these banks are entitled to borrow from the Federal Home Loan Bank network. Now that Countrywide Financial has been acquired and IndyMac has been seized by the FDIC, the largest remaining thrifts are Washington Mutual (which will be merging with JPMorgan Chase), and Sovereign Bancorp (which will be merging with Madrid-based Banco Santander). The largest independent thrifts are Astoria Financial and Hudson City Bancorp, both based in New York. The thrift industry is covered in our Savings & Loans Industry Survey.
Finally, thousands of small, independent community banks exist in all US cities, small towns and rural areas. These banks operate independently, or in small chains, under thrift, state, or federal charters.
The Federal Deposit Insurance Corporation (FDIC) classifies all banks according to the geographic regions in which they operate. The six regions, identified by their major banking centers, are New York, Atlanta, Chicago, San Francisco, Dallas, and Kansas City. As of June 30, 2008, 8,451 FDIC institutions existed, of which 7,203 were commercial banks, with total commercial banking assets of $11.426 trillion. Atlanta had 1,069 banks (with $3.13 trillion in assets); Chicago, 1,434 banks ($2.79 trillion); San Francisco, 712 banks ($2.13 trillion); New York, 540 banks ($1.79 trillion); Kansas City, 1,853 banks ($948 billion); and Dallas, 1,595 banks ($635 billion).
BANK ASSETS
A commercial bank’s earnings are derived from a variety of sources. These sources, or “earning assets,” include loans (commercial, consumer, and real estate) and securities (investment and trading account).
Loans According to FDIC statistics, aggregate loans outstanding were valued at $8.0 trillion on June 30, 2008. Loans secured by real estate accounted for about 60% of that sum, followed by commercial and industrial (C&I) loans (almost 19%), consumer loans (13%), and other loans (about 8%).
Real estate loans. Commercial and residential real estate loans, secured by customers’ property, are generally long-term installment mortgages. Prime residential mortgages generate a predictable cash flow and are usually the least risky type of loan. However, an increasing percentage of residential loans made in recent years have strayed from the traditional, long-term, fixed-rate type of mortgage. These loans, which are often highly risky for the lending institution that makes them, now come in many flavors, and may feature adjustable interest rates, borrower’s paying options (termed negative amortization mortgages), and often have much lower income verification requirements. Finally, commercial real estate and interim construction loans are medium-term loans that generate high yields but also can carry large risks.
INDUSTRY SURVEYS BANKING / DECEMBER 11, 2008 21
Commercial and industrial loans. C&I loans come in many variations, ranging from variable rate lines of credit, up to 15-year fixed-rate loans, and may be either secured or unsecured. Often the lowest yielding of a bank’s loans, C&I loans usually include compensating balance requirements, commitment fees, or both, although these requirements are becoming less common in today’s intensely competitive environment. Processing costs are relatively low for C&I loans, and pricing (i.e., interest rates and fees) is flexible.
Consumer loans. Consumer loans, comprising installment and credit card lending, are usually medium-term in maturity, with predictable principal and interest payments that reliably generate cash flow. Credit risk and processing costs are generally higher than for business loans, and yields are subject to usury ceilings in some states.
Securities Banks purchase securities as investments, with some 95% of their securities portfolios typically invested in fixed-income securities, and the remainder in other securities, such as bank stocks. A fixed-income security’s value depends on the interest rate it carries, and the security’s value fluctuates with the market level of interest rates. Securities may be taxable (such as US government bonds and other securities) or tax-exempt (such as state and local government securities). The maturities of these financial instruments vary widely.
Banks purchase securities as a means of earning interest on assets while maintaining the liquidity they need to meet deposit withdrawals or to satisfy sudden increases in loan demand. In addition, securities diversify a bank’s risk, improve the overall quality of its earning assets portfolio, and help the bank manage interest rate risk.
Investment securities are an important source of a bank’s earnings, particularly when lending is weak but funds for investing are plentiful. US banks are major participants in the bond market. Municipal bonds generally have longer terms and less liquidity than US government and Treasury bonds, but their tax-exempt feature is attractive in that it reduces taxable income.
Trading account securities are interest-bearing securities held primarily for realizing capital gains. Because their trading performance is affected by interest rate trends, and market liquidity, they may carry a higher risk than investment securities. According to the FDIC, banks had aggregate securities of $2.017 trillion at June 30, 2008, up from $1.954 trillion at December 31, 2007.
BANK LIABILITIES
A bank’s principal liabilities consist of deposits, debt, and shareholders’ equity. Deposits include consumer demand and time deposits, corporate demand and time deposits, foreign deposits and borrowings, and negotiable certificates of deposit (jumbo CDs, usually sold in denominations of $100,000 or more). Debt includes federal funds and other short-term borrowings (such as commercial paper), as well as long-term debt.
Consumer savings plans with commercial banks consist of demand deposits (such as checking accounts) and time deposits (negotiable order of withdrawal accounts and six-month money market certificates). These sources of funds, which usually account for about 70% of bank liabilities, have historically proven to be stable and important for banks. The interest rates that they command vary with overall money market interest rates or the duration of the time deposit, and they must be competitive in order to attract and keep depositors.
In the late 1990s, low deposit interest rates (in the range of 2% to 4%) resulted in annual deposit growth in the low single-digits, as consumers sought investments with higher rates of return, such as mutual funds. The stock market’s malaise in 2001 and 2002 led to a “flight to safety,” with more investment dollars going into bank accounts. As equity markets strengthened from 2003 to 2006, deposits grew at a high-single-digit pace, most likely attracted by increasing rates. Even though equity markets began to deteriorate in 2007, deposit growth remained strong. According to the FDIC, deposits held in domestic offices (US offices of all banks, whether foreign or domestic) grew 7.9% in 2001, 7.6% in 2002, 6.2% in 2003, 10.6% in 2004, 8.8% in 2005, 9.6% in 2006, and 7.5% in 2007. However, deposit growth slowed to 1.9% in the first half of 2008, despite a falling stock market, as interest rates fell and depositors became worried about bank failures.
22 BANKING / DECEMBER 11, 2008 INDUSTRY SURVEYS
INTEREST RATE RISKS
Assets and liabilities can mature or be re-priced to current market rates daily, monthly, annually, or even less frequently, depending on the terms of the assets or liabilities. Many assets and liabilities mature in less than one year, and most do not extend beyond 10 years (this includes long-term mortgages, which are often paid off or refinanced well before their full term). Interest rate risk occurs when a liability matures or is re-priced at a time that is not synchronized with the asset that it is funding.
Banks usually do not match assets and liabilities on a one-to-one basis. Instead, assets and liabilities are grouped together into specific time frames, such as overnight, 30 days, 90 days, one year, and the like. Thus, within a given period, banks can determine their interest rate sensitivity.
If more of its liabilities than assets reach maturity or are re-priced to current rates, a bank is said to be liability-sensitive or to have a negative gap. If more assets mature than liabilities, the bank is said to be asset-sensitive, or to have a positive gap. If a bank’s assets and liabilities are evenly matched, it is said to be balanced. In a period of falling interest rates, a bank with a negative gap (liability-sensitive) will see net interest margins widen. Conversely, a bank with a positive gap (asset-sensitive) will benefit during a period of rising rates.
The banking industry’s concern with limiting its interest rate risk has grown since 1979, when bank policy changes by the Federal Reserve resulted in high and extremely volatile interest rates. As a result, many bank loans, particularly commercial lines of credit, now come with variable rates. Consequently, in many cases, interest rate risk has been shifted from the lender to the borrower. On the funding side, many of the debts, deposits, and preferred stock dividends also carry variable rates, which shifts some risk back to the bank.
Because techniques for managing assets and liabilities have become highly sophisticated, banks are generally well hedged against interest rate risks. For example, interest rate hedging (with futures, options, and swaps) and the use of “Macaulay duration” matching (which involves balancing liabilities and assets) have been widely adopted.
BANK INDUSTRY REGULATORS
Banks in the United States are regulated by a combination of state banking regulators, the Federal Deposit Insurance Corporation (FDIC), the Federal Reserve Board (FRB), the Office of the Comptroller of the Currency (OCC), or the Office of Thrift Supervision (OTS), depending on the kind of banking charter held. All US commercial banks fall into one of three distinct categories. Nationally chartered banks are supervised by the FRB, the OCC, and the FDIC, while state-chartered banks that are members of the Federal Reserve System are supervised by the FRB, the FDIC, and the states. State-chartered banks that are not members of the Federal Reserve System are regulated by the states and the FDIC. With few exceptions, federal banking statues and regulations issued by federal regulators often pre-empt state laws and regulations.
The Federal Reserve System The Federal Reserve System, created in 1913 to stem the numerous banking panics that swept across the US in the 19th and early 20th centuries, functions as the central bank of the United States. One of the primary roles of the Federal Reserve from its founding has been to function as a payment clearing system: to ensure that checks received by customers of one bank would be cleared (or paid) by the corresponding bank from which the checks were drawn. The Federal Reserve also provides financial services to depository institutions, the US government, and foreign countries. To insure its independence from Wall Street, the power and authority of the Federal Reserve shifted to Washington, DC, from New York City in 1935.
Over time, the authority of the Federal Reserve grew to include the goals of stable prices, maximum employment, and low long-term interest rates. Today’s Federal Reserve is a government entity comprising the Board of Governors of the Federal Reserve System, the Federal Open Market Committee, 12 regional
INDUSTRY SURVEYS BANKING / DECEMBER 11, 2008 23
Federal Reserve Districts (each with a Federal Reserve Bank), and various advisory councils. All large US banks are member banks of the Federal Reserve and hold stock of their district’s Federal Reserve Bank.
The Federal Reserve (Fed) can influence long and short-term interest rates, as well as the money supply, and prices, through several tools that it has at its disposal. The Fed can raise or lower the discount rate and the fed funds rate target. (The discount rate is the interest rate that the Fed charges member banks for loans to bolster their reserves, while the federal funds rate is the cost of reserves loaned by one bank to another, typically overnight, to cover a shortfall in reserve requirements or to profit from excess reserve.) Although individuals cannot borrow at the discount rate or the fed funds rate, member banks of the Federal Reserve System usually benchmark their prime lending rate to the current fed funds rate. Currently, most commercial banks maintain their prime lending rate at 0.75% above the fed funds rate, and usually change their prime lending rate on the same day that the Fed changes the fed funds rate.
A second tool used by the Fed is conducting open-market operations, such as buying and selling Treasury bills. The Fed can increase the money supply by buying Treasury bills from its member banks and paying them with newly created money, which they can use as reserves. Typically, these transactions are conducted electronically, since today most money and reserves exist electronically as the sum of debits and credits in each member bank’s account with the Fed. Conversely, the Fed can decrease the money supply by selling Treasury bills on the open market or to member banks, and in return lowering the amount of reserves that the member bank has on account at the Fed.
The Fed’s third tool to control money supply is the ability to raise or lower banks’ reserve requirements on deposits. Reserves are the funds that banks must keep on hand, as a percentage of what they have loaned out. For example, if a bank has loaned out $1.0 million and has a 5.0% reserve requirement, $50,000 in reserves must be held at the bank and not loaned out. If the reserve requirement is raised to 10%, and the bank has $50,000 in reserves, then only $500,000 in loans can be outstanding. In recent decades, however, this tool has been used very rarely.
Some of the Fed’s regulations, such as Truth in Lending (Regulation Z), Equal Credit Opportunity (Regulation B), the Home Mortgage Disclosure Act, apply to all banks in the banking system; other regulations apply only to member banks. Federal Reserve member banks include all nationally chartered banks and most state-chartered banks. The remaining state-chartered banks are supervised by the Federal Deposit Insurance Corporation.
Office of Thrift Supervision (OTS) The OTS is an independent bureau of the US Treasury Department established in 1989 to regulate federal sav-ings institutions, a category that includes federal savings banks and federal savings & loans. The OTS also supervises some state-chartered institutions and provides regulatory oversight of the financial arms of compa-nies such as General Electric. The OTS was created in the midst of the savings & loan crisis at the end of the 1980s. It is the successor institution to the now-defunct Federal Home Loan Bank Board.
The Federal Deposit Insurance Corporation (FDIC) This US government corporation was created by the Banking Act of 1933 and was made into a permanent government corporation in 1935, as a response to numerous banking panics of the 19th and early 20th centuries. These panics, which were accompanied by bank runs, wiped out depositors’ entire accounts, leaving them without any recourse. Today, almost every bank in the US has its deposits insured by the FDIC, though there are a handful of state-charted banks whose deposits are not FDIC-insured.
Through the Bank Insurance Fund (BIF), the FDIC provided commercial banks with deposit insurance, which guaranteed the safety of savings and checking accounts. Thrifts and home lenders were covered by the Federal Savings and Loan Insurance Corporation (FSLIC). The FSLIC, which became insolvent in 1989 as a result of the savings & loan crisis, was merged into the FDIC and became the Savings Association Insurance Fund (SAIF).

24 BANKING / DECEMBER 11, 2008 INDUSTRY SURVEYS
In 2006, the SAIF and the BIF were merged into a single fund, named the Deposit Insurance Fund (DIF). Deposits are currently insured up to a level of $250,000, recently increased from the $100,000 maximum that stood since 1980. The FDIC maintains the levels of the DIF by assessing each depository institution a premium that is based on the level of risk that the institutions poses to the DIF, as well as the amount of deposits controlled by that institution. The FDIC has the power to declare insolvent any insured bank that it deems to be under-capitalized: when this happens, the FDIC either runs the bank or sells it to a well-capitalized institution of its choosing.
The Office of the Comptroller of the Currency (OCC) The OCC is a US federal agency that operates as an independent bureau of the US Treasury Department. The National Bank Act of 1863 established a system of nationally chartered banks and created the OCC to serve as their primary regulator. All national banks are supervised by the OCC, the FDIC, and, since they are all members of the Federal Reserve System, they are also regulated by the Fed. Today, the OCC supervises more than 1,600 national banks and about 50 foreign banks with operations in the US.
According to the OCC, national banks represent about 23% of all insured commercial banks in the US, holding about 68% of the assets of the banking system The national banks fund the OCC through assessments paid by the banks based on their assets and fees they pay for special services.
State regulatory agencies Many US banks are state chartered. These banks are regulated by the Department of Financial Institutions of the state in which their headquarters are located. In addition, state banks that are members of the Federal Reserve are regulated by the Federal Reserve; non-member state banks are regulated by the FDIC. Therefore, almost every state bank has both a state and federal regulator.
BANK INDUSTRY REGULATORY/LEGISLATIVE MILESTONES
Federal and state regulation of the US banking industry gathered momentum in the early years of the Great Depression, following the failure of hundreds of banks across the US in the waning months of President Hoover’s administration in 1932 and 1933. Through a series of legislative acts, many of the regulatory agencies we are familiar with today were born or acquired meaningful powers. The creators of these earlier legislative acts were aiming to protect depositors’ savings, restrict what kinds of nonbanking businesses a bank could engage in, provide for a central clearinghouse for checking transactions, and create a better system for financing mortgages. More recent legislation aimed to bolster consumers’ rights, ensure fair lending standards, offer consumer credit and mortgages to more people, and to roll back some of the excesses of earlier legislation.
The Banking Act of 1933 (Glass-Steagall) Sponsored by Senator Carter Glass and Representative Henry Steagall, the Banking Act of 1933 was commonly known by the names of its co-sponsors. Glass-Steagall, which was signed into law by President Franklin Roosevelt in 1933 in the depths of the Great Depression, created the Federal Deposit Insurance Corporation (FDIC) as a temporary government corporation, authorized deposit insurance, and restricted depository institutions’ ability to engage in debt and securities underwriting.
The National Housing Act of 1934 This act created the Federal Housing Administration (FHA) and the Federal Savings and Loan Insurance Corporation (FSLIC). The FHA insured home mortgages, and regulated the terms and rate of interest on the mortgages that it insured. Before the FHA was created, home mortgages were of very short duration (three to five years) and could be called by the lender at any time, resulting in large waves of foreclosures. After the creation of the FHA, the home mortgage market expanded greatly, because millions of potential homebuyers were able to afford long-term, fixed rate mortgages. In 1965, the FHA was incorporated into the US Department of Housing and Urban Development (HUD). The FSLIC operated until 1989, when it was incorporated into the FDIC.
INDUSTRY SURVEYS BANKING / DECEMBER 11, 2008 25
The Banking Act of 1935 The Banking Act of 1935 established the FDIC as a permanent agency of the US government and provided for deposit insurance of up to $5,000 per insured savings account.
The Federal Insurance Deposit Act of 1950 This legislation raised the deposit insurance limit to $10,000, and gave the FDIC the authority to examine FDIC-insured national and state banks.
Bank Holding Company Act of 1956 This law specified that the Federal Reserve Board must approve the establishment of a bank holding company, and it prohibited bank holding companies headquartered in one state from acquiring a bank in another state. The law generally prohibited a bank holding company from engaging in most non-banking activities or acquiring voting securities of certain companies that are not banks. The interstate restrictions of the Bank Holding Company act were repealed by the Riegle-Neal Interstate Banking and Branching Efficiency Act of 1994.
Truth in Lending Act (1968) This legislation was designed to protect consumers in credit transactions by requiring clear disclosure of key terms of the lending arrangement and all costs. The statute is contained in the Consumer Credit Protection Act; the regulations implementing the statute are known as “Regulation Z.”
The Community Reinvestment Act (1977) Congress enacted the Community Reinvestment Act (CRA) in 1977 to encourage federally insured banks and thrifts to help meet the credit needs of their entire community, including low- and moderate-income neighborhoods, consistent with safe and sound operations. The CRA requires each federal bank regulatory agency to assess each federally insured institution’s record of compliance. The four federal bank regulatory agencies responsible for enforcing the CRA include the FDIC, the Federal Reserve System, the Office of the Comptroller of the Currency, and the Office of Thrift Supervision.
In 1995, CRA regulations were substantially revised to put greater emphasis on performance as opposed to process, and to establish different evaluation tests for different kinds of institutions: large institutions, small institutions, and wholesale and limited-purpose institutions. Streamlined procedures with an emphasis on lending were adopted for small institutions, while large banks are evaluated under a three-part lending, service, and investment test. Wholesale and limited-purpose banks are evaluated under a community development test.
Depository Institutions Deregulation and Monetary Control Act (1980) Passed in 1980, this US federal financial statute gave the Federal Reserve greater control over non-member banks by requiring all US banks to abide by many of the Fed’s regulations. It also removed the power of the Federal Reserve Board of Governors under the Glass-Steagall Act and Regulation Q to set the interest rates of savings accounts, and it allowed credit unions and savings & loans to offer checkable deposits. This act also raised the deposit insurance of US banks and credit unions from $40,000 to $100,000.
The Garn–St. Germain Depository Institutions Act (1982) This legislation, which passed with wide support in Congress, was intended to strengthen the savings & loan industry by broadening the kinds of businesses they could be involved in. Following passage of this act, savings & loans were permitted to make commercial loans, rather than just housing loans. Since commercial lending usually carries a higher risk, industry observers trace many of the causes of the savings & loan crisis of the 1980s to this legislation. In addition, Garn–St. Germain allowed for the creation of adjustable rate mortgages (ARMs). Since ARMs have played a role in the current housing and banking crisis, many analysts also partially blame this act for the current mortgage crisis.
Revisions to the Glass-Steagall Act (1987) The 1987 revision to the Glass-Steagall Act allowed commercial banks to engage in specific securities activities, subject to limitations. Specifically, the provision authorized banks to earn up to 5% of their revenues (raised to 10% in 1989 and 25% in 1996) from securities underwriting by letting bank holding

26 BANKING / DECEMBER 11, 2008 INDUSTRY SURVEYS
companies establish separate units for that purpose. Concurrent with the 1987 revision, investment banks were permitted to enter commercial banks’ traditional turf by offering such services as check writing.
Financial Institutions Reform, Recovery and Enforcement Act (FIRREA, 1989) This legislation was signed into law to counter the savings & loan crisis of the 1980s. It established the Resolution Trust Corporation (RTC) to close insolvent savings & loans, and paid back insured deposits. It also created the Office of Thrift Supervision (OTS) as a bureau within the US Treasury Department.
Riegle-Neal Interstate Banking and Branching Efficiency Act of 1994 This legislation repealed the interstate restrictions of the Bank Holding Company Act of 1956. It allowed interstate mergers between adequately capitalized and managed banks, subject to concentration limits, state laws, and the Community Reinvestment Act.
Gramm-Leach-Bliley Financial Services Modernization Act (1999) This act repealed many of the remaining portions of Glass-Steagall. Gramm-Leach-Bliley allowed the creation of a new kind of financial holding company that was permitted to expand into a variety of financial services. These activities include the underwriting and selling of insurance and securities, commercial and merchant banking, investing in and development of real estate, and other complementary activities. As a result of this act, commercial banks entered the fields of investment management, mutual funds, insurance, municipal finance, and corporate investment banking.
Some of the new businesses in which banks are now permitted to invest, most notably insurance, are not viewed as particularly enticing. For example, Citigroup Inc. was formed in October 1998 through the merger of a bank (Citicorp) and an insurance company (Travelers Group), which would not have been permitted under the old law. However, Travelers was involved in several businesses other than insurance — most importantly, investment banking, through its Salomon Smith Barney subsidiary. Indeed, in August 2002, Citigroup spun off Travelers’ property-casualty business.
Banks may be tempted to purchase an insurance operation to become more vertically integrated, or to add an insurance company’s sizable investment portfolio to its own. However, many insurance lines, such as property-casualty, are actually quite volatile and potentially high in risk, and their investment returns can be lower than those of traditional banking businesses.
Compared with property-casualty, life insurance would seem to be a better fit with banks’ appetite for risk and return. Furthermore, banks do have some potential synergies with insurance companies: notably, banks’ large distribution networks and broad customer lists create opportunities for the cross-selling of products and services. Many banks have become active agents of insurance companies by selling annuities and other insurance products.
The industry has seen some melding of corporate banking and investment banking and brokerage operations, including the merger of the retail brokerage forces of Wachovia and Prudential Financial Inc. in July 2003. However, issues surrounding the independence of stock research, allocation of initial public offerings, and unique financing arrangements got a number of larger diversified banks into trouble and caused a widespread loss of investor confidence. Following Senate hearings in 2002 and actions by the Securities and Exchange Commission and other regulators, these incidents have led to greater regulatory oversight and may have deterred commercial banks’ forays into investment banking activities, at least temporarily.
Sarbanes-Oxley Act (2002) The formal name of this act is the Public Company Accounting Reform and Investor Protection Act of 2002. This act requires the boards, accounting firms, and management of publicly traded firms to adhere to a higher set of financial recording and reporting standards. The reporting requirements of this act are seen by many companies to be quite far-reaching and difficult.

INDUSTRY SURVEYS BANKING / DECEMBER 11, 2008 27
INTEREST RATES: A FACTOR IN PROFITS
The outlook for interest rates has important implications for bank profits. Because banks derive most of their profits from net interest income (the interest income received on loans minus the interest expense for borrowed funds), interest rates influence how much money a bank can make.
The net interest margin (a bank’s net interest income divided by its average earning assets) is a common measure of a bank’s profitability. Net interest margins widen or narrow depending on the direction of interest rates, the mix of funding sources underlying the loans, and the duration (or time period until expiration) of the investment portfolio.
Declining interest rates have a positive effect on banks for several reasons. They can make net interest margins expand, at least in the short term; while banks are still earning a higher-than-market yield on loans, the cost of funds goes down more quickly in response to the lower rates. Second, declining rates enhance the value of a bank’s fixed-rate investment portfolio, since fixed rate bonds become more valuable as prevailing rates drop. Furthermore, falling rates lower the cost of credit, which often stimulates loan demand and reduces delinquency rates.
Of course, rate decreases do not affect all banks equally. Liability-sensitive banks — those that rely more heavily on borrowed funds than on customer deposits to fund loan growth — typically reap greater benefits.
In the broadest sense, banks are inherently asset-sensitive because they derive a significant portion of their funding from essentially free sources, such as equity issues or demand deposits. This is especially true of the smaller regional banks that focus on garnering retail (consumer) deposits and that have limited access to the purchased money markets. Unless they work to reduce their asset sensitivity, they tend to do better in periods of rising interest rates.
Money center banks, however, rely heavily on borrowed funds, and have a small retail deposit base relative to their asset size. Thus, they tend to be liability-sensitive and their lending operations benefit most during periods of falling rates.
Fluctuations in interest rates, while important, do not have an absolute influence over the net interest margins of commercial banks, primarily because banks are able to adjust to such fluctuations. In theory, banks can match the maturities of their assets (loans and investments) and liabilities (deposits and borrowings) so that rates earned and rates paid move more or less in tandem, while net interest margins remain relatively stable. In addition, banks can make use of hedging techniques to reduce their sensitivity to interest rates. In practice, however, banks generally deviate from a perfectly balanced position.
INFRASTRUCTURE AND OPERATING COSTS
Banks’ physical capital requirements mainly include constructing and maintaining branch offices (which are either owned or leased), and buying and maintaining computers and other machines used in the course of providing services. Banks try to economize their infrastructure costs by having branch locations within similar geographic regions.
As in most industries, other large cost components consist of salary and benefits, supplies, and insurance. Most expense line items tend to rise over time with inflation. In recent years, a low inflationary environment has allowed banks to restrain cost increases. In addition, technological improvements — including the introduction of online banking and automated teller machines (ATMs) — have provided for the replacement of certain labor-intensive functions with computers or other forms of automation, allowing increased productivity and a related improvement in the salary and benefits cost structure. Separately, mergers and internal consolidation measures have led to substantial gains in overall efficiency.
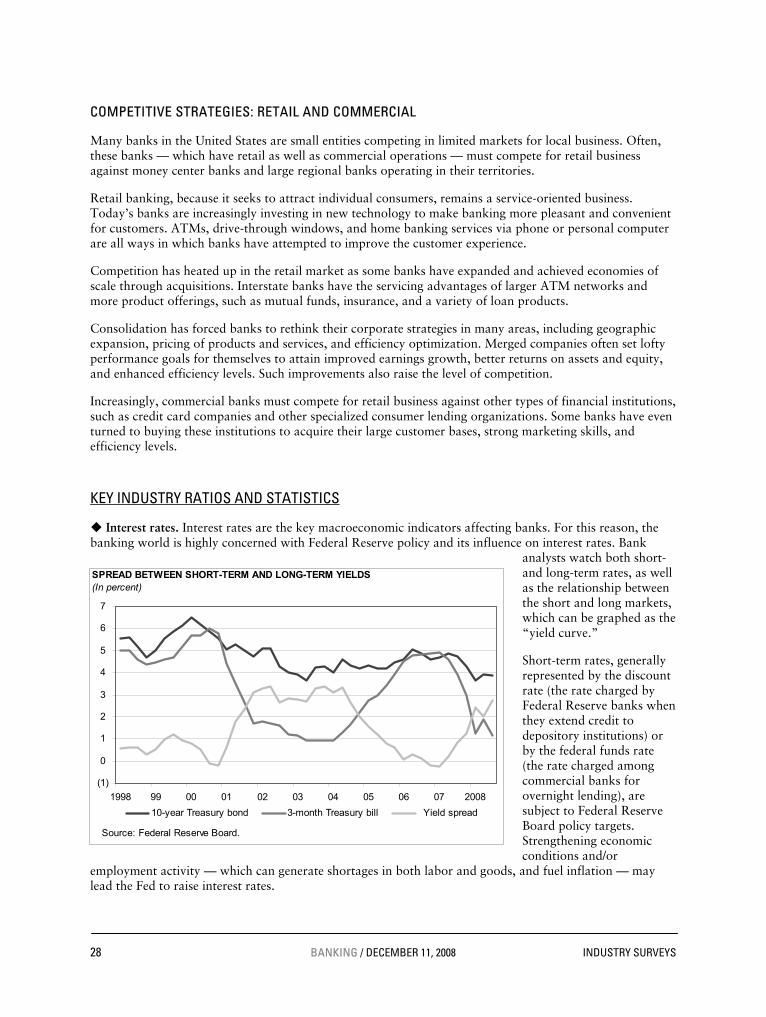
28 BANKING / DECEMBER 11, 2008 INDUSTRY SURVEYS
COMPETITIVE STRATEGIES: RETAIL AND COMMERCIAL
Many banks in the United States are small entities competing in limited markets for local business. Often, these banks — which have retail as well as commercial operations — must compete for retail business against money center banks and large regional banks operating in their territories.
Retail banking, because it seeks to attract individual consumers, remains a service-oriented business. Today’s banks are increasingly investing in new technology to make banking more pleasant and convenient for customers. ATMs, drive-through windows, and home banking services via phone or personal computer are all ways in which banks have attempted to improve the customer experience.
Competition has heated up in the retail market as some banks have expanded and achieved economies of scale through acquisitions. Interstate banks have the servicing advantages of larger ATM networks and more product offerings, such as mutual funds, insurance, and a variety of loan products.
Consolidation has forced banks to rethink their corporate strategies in many areas, including geographic expansion, pricing of products and services, and efficiency optimization. Merged companies often set lofty performance goals for themselves to attain improved earnings growth, better returns on assets and equity, and enhanced efficiency levels. Such improvements also raise the level of competition.
Increasingly, commercial banks must compete for retail business against other types of financial institutions, such as credit card companies and other specialized consumer lending organizations. Some banks have even turned to buying these institutions to acquire their large customer bases, strong marketing skills, and efficiency levels.
KEY INDUSTRY RATIOS AND STATISTICS
Interest rates. Interest rates are the key macroeconomic indicators affecting banks. For this reason, the banking world is highly concerned with Federal Reserve policy and its influence on interest rates. Bank
analysts watch both short- and long-term rates, as well as the relationship between the short and long markets, which can be graphed as the “yield curve.”
Short-term rates, generally represented by the discount rate (the rate charged by Federal Reserve banks when they extend credit to depository institutions) or by the federal funds rate (the rate charged among commercial banks for overnight lending), are subject to Federal Reserve Board policy targets. Strengthening economic conditions and/or
employment activity — which can generate shortages in both labor and goods, and fuel inflation — may lead the Fed to raise interest rates.
[Insert Graph H26 Interest Spreads, here]
(1)
0
1
2
3
4
5
6
7
1998 99 00 01 02 03 04 05 06 07 2008
10-year Treasury bond 3-month Treasury bill Yield spread
SPREAD BETWEEN SHORT-TERM AND LONG-TERM YIELDS (In percent)
Source: Federal Reserve Board.
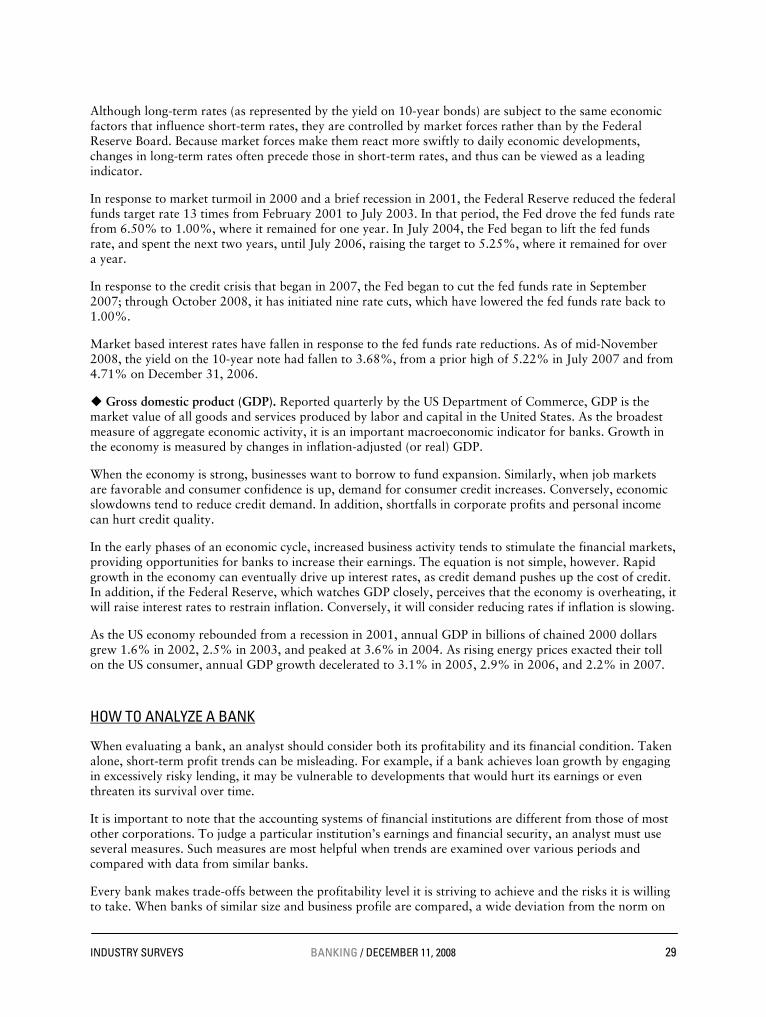
INDUSTRY SURVEYS BANKING / DECEMBER 11, 2008 29
Although long-term rates (as represented by the yield on 10-year bonds) are subject to the same economic factors that influence short-term rates, they are controlled by market forces rather than by the Federal Reserve Board. Because market forces make them react more swiftly to daily economic developments, changes in long-term rates often precede those in short-term rates, and thus can be viewed as a leading indicator.
In response to market turmoil in 2000 and a brief recession in 2001, the Federal Reserve reduced the federal funds target rate 13 times from February 2001 to July 2003. In that period, the Fed drove the fed funds rate from 6.50% to 1.00%, where it remained for one year. In July 2004, the Fed began to lift the fed funds rate, and spent the next two years, until July 2006, raising the target to 5.25%, where it remained for over a year.
In response to the credit crisis that began in 2007, the Fed began to cut the fed funds rate in September 2007; through October 2008, it has initiated nine rate cuts, which have lowered the fed funds rate back to 1.00%.
Market based interest rates have fallen in response to the fed funds rate reductions. As of mid-November 2008, the yield on the 10-year note had fallen to 3.68%, from a prior high of 5.22% in July 2007 and from 4.71% on December 31, 2006.
Gross domestic product (GDP). Reported quarterly by the US Department of Commerce, GDP is the market value of all goods and services produced by labor and capital in the United States. As the broadest measure of aggregate economic activity, it is an important macroeconomic indicator for banks. Growth in the economy is measured by changes in inflation-adjusted (or real) GDP.
When the economy is strong, businesses want to borrow to fund expansion. Similarly, when job markets are favorable and consumer confidence is up, demand for consumer credit increases. Conversely, economic slowdowns tend to reduce credit demand. In addition, shortfalls in corporate profits and personal income can hurt credit quality.
In the early phases of an economic cycle, increased business activity tends to stimulate the financial markets, providing opportunities for banks to increase their earnings. The equation is not simple, however. Rapid growth in the economy can eventually drive up interest rates, as credit demand pushes up the cost of credit. In addition, if the Federal Reserve, which watches GDP closely, perceives that the economy is overheating, it will raise interest rates to restrain inflation. Conversely, it will consider reducing rates if inflation is slowing.
As the US economy rebounded from a recession in 2001, annual GDP in billions of chained 2000 dollars grew 1.6% in 2002, 2.5% in 2003, and peaked at 3.6% in 2004. As rising energy prices exacted their toll on the US consumer, annual GDP growth decelerated to 3.1% in 2005, 2.9% in 2006, and 2.2% in 2007.
HOW TO ANALYZE A BANK
When evaluating a bank, an analyst should consider both its profitability and its financial condition. Taken alone, short-term profit trends can be misleading. For example, if a bank achieves loan growth by engaging in excessively risky lending, it may be vulnerable to developments that would hurt its earnings or even threaten its survival over time.
It is important to note that the accounting systems of financial institutions are different from those of most other corporations. To judge a particular institution’s earnings and financial security, an analyst must use several measures. Such measures are most helpful when trends are examined over various periods and compared with data from similar banks.
Every bank makes trade-offs between the profitability level it is striving to achieve and the risks it is willing to take. When banks of similar size and business profile are compared, a wide deviation from the norm on
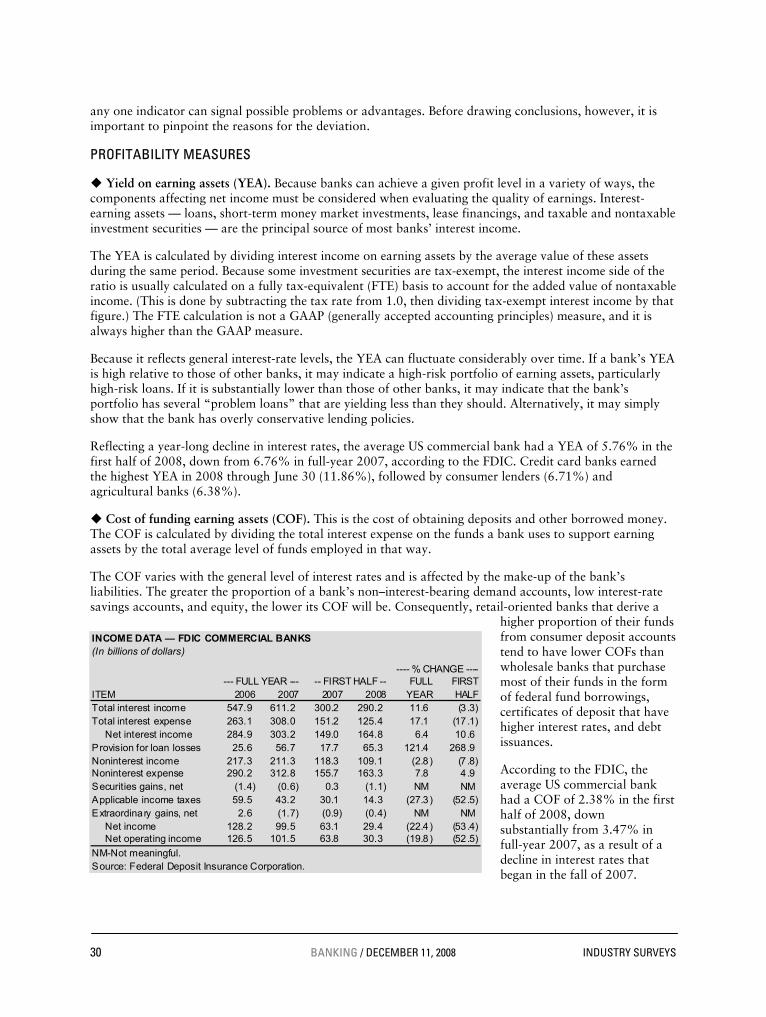
30 BANKING / DECEMBER 11, 2008 INDUSTRY SURVEYS
any one indicator can signal possible problems or advantages. Before drawing conclusions, however, it is important to pinpoint the reasons for the deviation.
PROFITABILITY MEASURES
Yield on earning assets (YEA). Because banks can achieve a given profit level in a variety of ways, the components affecting net income must be considered when evaluating the quality of earnings. Interest-earning assets — loans, short-term money market investments, lease financings, and taxable and nontaxable investment securities — are the principal source of most banks’ interest income.
The YEA is calculated by dividing interest income on earning assets by the average value of these assets during the same period. Because some investment securities are tax-exempt, the interest income side of the ratio is usually calculated on a fully tax-equivalent (FTE) basis to account for the added value of nontaxable income. (This is done by subtracting the tax rate from 1.0, then dividing tax-exempt interest income by that figure.) The FTE calculation is not a GAAP (generally accepted accounting principles) measure, and it is always higher than the GAAP measure.
Because it reflects general interest-rate levels, the YEA can fluctuate considerably over time. If a bank’s YEA is high relative to those of other banks, it may indicate a high-risk portfolio of earning assets, particularly high-risk loans. If it is substantially lower than those of other banks, it may indicate that the bank’s portfolio has several “problem loans” that are yielding less than they should. Alternatively, it may simply show that the bank has overly conservative lending policies.
Reflecting a year-long decline in interest rates, the average US commercial bank had a YEA of 5.76% in the first half of 2008, down from 6.76% in full-year 2007, according to the FDIC. Credit card banks earned the highest YEA in 2008 through June 30 (11.86%), followed by consumer lenders (6.71%) and agricultural banks (6.38%).
Cost of funding earning assets (COF). This is the cost of obtaining deposits and other borrowed money. The COF is calculated by dividing the total interest expense on the funds a bank uses to support earning assets by the total average level of funds employed in that way.
The COF varies with the general level of interest rates and is affected by the make-up of the bank’s liabilities. The greater the proportion of a bank’s non–interest-bearing demand accounts, low interest-rate savings accounts, and equity, the lower its COF will be. Consequently, retail-oriented banks that derive a
higher proportion of their funds from consumer deposit accounts tend to have lower COFs than wholesale banks that purchase most of their funds in the form of federal fund borrowings, certificates of deposit that have higher interest rates, and debt issuances.
According to the FDIC, the average US commercial bank had a COF of 2.38% in the first half of 2008, down substantially from 3.47% in full-year 2007, as a result of a decline in interest rates that began in the fall of 2007.
INCOME DATA — FDIC COMMERCIAL BANKS
INCOME DATA — FDIC COMMERCIAL BANKS(In billions of dollars)
---- % CHANGE ------- FULL YEAR --- -- FIRST HALF -- FULL FIRST
ITEM 2006 2007 2007 2008 YEAR HALFTotal interest income 547.9 611.2 300.2 290.2 11.6 (3 .3)Total interest expense 263.1 308.0 151.2 125.4 17.1 (17.1)
Net interest income 284.9 303.2 149.0 164.8 6.4 10.6Provision for loan losses 25.6 56.7 17.7 65.3 121.4 268.9Noninterest income 217.3 211.3 118.3 109.1 (2.8) (7 .8)Noninterest expense 290.2 312.8 155.7 163.3 7.8 4.9Securities gains, net (1.4) (0.6) 0.3 (1.1) NM NM Applicable income taxes 59.5 43.2 30.1 14.3 (27.3) (52.5)Extraordinary gains, net 2.6 (1.7) (0.9) (0.4) NM NM
Net income 128.2 99.5 63.1 29.4 (22.4) (53.4)Net operating income 126.5 101.5 63.8 30.3 (19.8) (52.5)
NM-Not meaningful.Source: Federal Deposit Insurance Corporation.

INDUSTRY SURVEYS BANKING / DECEMBER 11, 2008 31
Net interest spread (NIS). The NIS is simply the YEA minus the COF. As of June 30, 2008, the banking industry’s NIS was 3.37%, a slight increase from 3.29% in full-year 2007 and 3.31% in full-year 2006.
Net interest margin (NIM). The NIM is calculated by dividing the FTE net interest income by average earning assets. (Tax-equivalent net interest income is calculated by subtracting interest expense from tax-equivalent interest income.)
A NIM of less than 3% is generally considered low; more than 5% is very high. This range is only a rough guideline, however, because the NIM can vary with the particular business mix of individual banks. The NIM tends to be higher at small retail banks, credit card banks, and consumer lenders than at large wholesale banks, international banks, and mortgage lenders.
A widening NIM is a sign of successful management of assets and liabilities, while a narrowing NIM indicates a profit squeeze. According to the FDIC, the industry’s average NIM was 3.35% in the first half of 2008, up from 3.29% in the first half of 2007.
Provision for loan losses. The provision for loan losses should be considered along with the NIM when evaluating the quality of a bank’s financial performance. The provision, which appears on the income statement, is a quarterly charge taken against earnings; the charge then goes into a cumulative reserve to cover possible loan losses. (The loss reserve is a balance sheet item that is discussed later in this section under the heading “Measures of financial condition.”)
The provision’s size as a percentage of total loans reflects the success or failure of the bank’s credit evaluation procedures and the risk inherent in the bank’s loan portfolio. Over the short term, risky, high-interest loans may boost a bank’s YEA and, hence, its NIM. However, when a bank makes a greater number of high-risk loans, it needs to increase its provision for loan losses in the long term.
For any given bank, the provision for loan losses rises over time to reflect growing loan portfolios and increases in the dollar level of charge-offs; however, the provision for loan losses can vary greatly from quarter to quarter and from year to year. In recessionary times, when corporate clients find it hard to service their debts, bank managers usually raise the provision for loan losses; they generally keep it at high levels until well after an economic recovery has begun.
Although Financial Accounting Standards (FAS 5, “Accounting for Contingencies,” and FAS 114, “Accounting by Creditors for Impairment of a Loan”) govern loan loss provisioning, a bank’s managers can exercise some discretion in establishing the provision for loan losses. Hence, this provision should be examined in conjunction with the bank’s reserve for loan losses, charge-off experience, and level of nonperforming loans, to see whether management is making adequate provisions or is simply using the charge to manipulate reported earnings
Noninterest income. Noninterest income includes service charges on deposit accounts, along with trust, mortgage banking, insurance commissions, and other fees. In addition, gains or losses from securities transactions, once reported separately, have been included under noninterest income since 1982.
The proportion of noninterest income to total income has risen for a number of banks. For most banks, noninterest income now constitutes more than 30% of total revenues (total interest income plus noninterest income). In the first half of 2008, the industry ratio was 38.8%, down from 42.8% in the comparable year-earlier period. In 2007, the industry ratio was 39.8%, down from 42.1% in 2006. In general, large banks tend to have a greater proportion of their total income attributable to non–interest-bearing sources than do smaller banks. This reflects large banks’ involvement in currency and bond trading, trust services, mortgage banking, capital markets activities, corporate finance, credit cards, and other fee-based financial services.
Noninterest expenses and the efficiency ratio. Noninterest expenses represent all expenses incurred in operations, including such items as personnel and occupancy costs. To calculate the efficiency ratio, add back foreclosure and repossession expenses, amortization of intangibles, and impairment of goodwill to
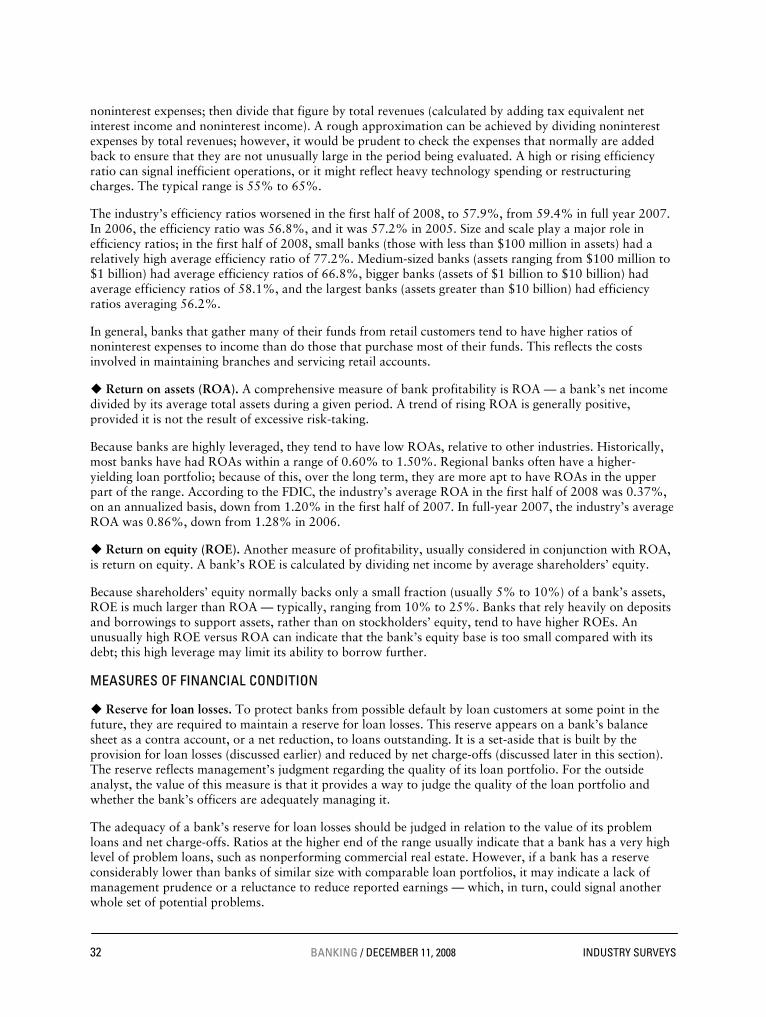
32 BANKING / DECEMBER 11, 2008 INDUSTRY SURVEYS
noninterest expenses; then divide that figure by total revenues (calculated by adding tax equivalent net interest income and noninterest income). A rough approximation can be achieved by dividing noninterest expenses by total revenues; however, it would be prudent to check the expenses that normally are added back to ensure that they are not unusually large in the period being evaluated. A high or rising efficiency ratio can signal inefficient operations, or it might reflect heavy technology spending or restructuring charges. The typical range is 55% to 65%.
The industry’s efficiency ratios worsened in the first half of 2008, to 57.9%, from 59.4% in full year 2007. In 2006, the efficiency ratio was 56.8%, and it was 57.2% in 2005. Size and scale play a major role in efficiency ratios; in the first half of 2008, small banks (those with less than $100 million in assets) had a relatively high average efficiency ratio of 77.2%. Medium-sized banks (assets ranging from $100 million to $1 billion) had average efficiency ratios of 66.8%, bigger banks (assets of $1 billion to $10 billion) had average efficiency ratios of 58.1%, and the largest banks (assets greater than $10 billion) had efficiency ratios averaging 56.2%.
In general, banks that gather many of their funds from retail customers tend to have higher ratios of noninterest expenses to income than do those that purchase most of their funds. This reflects the costs involved in maintaining branches and servicing retail accounts.
Return on assets (ROA). A comprehensive measure of bank profitability is ROA — a bank’s net income divided by its average total assets during a given period. A trend of rising ROA is generally positive, provided it is not the result of excessive risk-taking.
Because banks are highly leveraged, they tend to have low ROAs, relative to other industries. Historically, most banks have had ROAs within a range of 0.60% to 1.50%. Regional banks often have a higher-yielding loan portfolio; because of this, over the long term, they are more apt to have ROAs in the upper part of the range. According to the FDIC, the industry’s average ROA in the first half of 2008 was 0.37%, on an annualized basis, down from 1.20% in the first half of 2007. In full-year 2007, the industry’s average ROA was 0.86%, down from 1.28% in 2006.
Return on equity (ROE). Another measure of profitability, usually considered in conjunction with ROA, is return on equity. A bank’s ROE is calculated by dividing net income by average shareholders’ equity.
Because shareholders’ equity normally backs only a small fraction (usually 5% to 10%) of a bank’s assets, ROE is much larger than ROA — typically, ranging from 10% to 25%. Banks that rely heavily on deposits and borrowings to support assets, rather than on stockholders’ equity, tend to have higher ROEs. An unusually high ROE versus ROA can indicate that the bank’s equity base is too small compared with its debt; this high leverage may limit its ability to borrow further.
MEASURES OF FINANCIAL CONDITION
Reserve for loan losses. To protect banks from possible default by loan customers at some point in the future, they are required to maintain a reserve for loan losses. This reserve appears on a bank’s balance sheet as a contra account, or a net reduction, to loans outstanding. It is a set-aside that is built by the provision for loan losses (discussed earlier) and reduced by net charge-offs (discussed later in this section). The reserve reflects management’s judgment regarding the quality of its loan portfolio. For the outside analyst, the value of this measure is that it provides a way to judge the quality of the loan portfolio and whether the bank’s officers are adequately managing it.
The adequacy of a bank’s reserve for loan losses should be judged in relation to the value of its problem loans and net charge-offs. Ratios at the higher end of the range usually indicate that a bank has a very high level of problem loans, such as nonperforming commercial real estate. However, if a bank has a reserve considerably lower than banks of similar size with comparable loan portfolios, it may indicate a lack of management prudence or a reluctance to reduce reported earnings — which, in turn, could signal another whole set of potential problems.
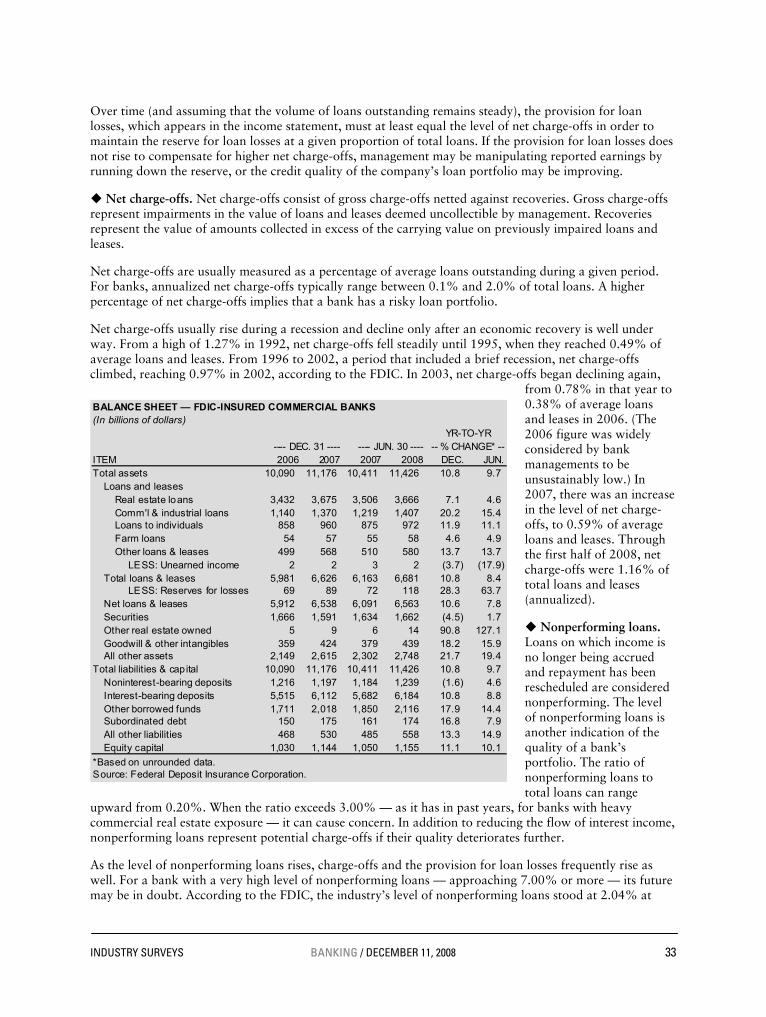
INDUSTRY SURVEYS BANKING / DECEMBER 11, 2008 33
Over time (and assuming that the volume of loans outstanding remains steady), the provision for loan losses, which appears in the income statement, must at least equal the level of net charge-offs in order to maintain the reserve for loan losses at a given proportion of total loans. If the provision for loan losses does not rise to compensate for higher net charge-offs, management may be manipulating reported earnings by running down the reserve, or the credit quality of the company’s loan portfolio may be improving.
Net charge-offs. Net charge-offs consist of gross charge-offs netted against recoveries. Gross charge-offs represent impairments in the value of loans and leases deemed uncollectible by management. Recoveries represent the value of amounts collected in excess of the carrying value on previously impaired loans and leases.
Net charge-offs are usually measured as a percentage of average loans outstanding during a given period. For banks, annualized net charge-offs typically range between 0.1% and 2.0% of total loans. A higher percentage of net charge-offs implies that a bank has a risky loan portfolio.
Net charge-offs usually rise during a recession and decline only after an economic recovery is well under way. From a high of 1.27% in 1992, net charge-offs fell steadily until 1995, when they reached 0.49% of average loans and leases. From 1996 to 2002, a period that included a brief recession, net charge-offs climbed, reaching 0.97% in 2002, according to the FDIC. In 2003, net charge-offs began declining again,
from 0.78% in that year to 0.38% of average loans and leases in 2006. (The 2006 figure was widely considered by bank managements to be unsustainably low.) In 2007, there was an increase in the level of net charge-offs, to 0.59% of average loans and leases. Through the first half of 2008, net charge-offs were 1.16% of total loans and leases (annualized).
Nonperforming loans. Loans on which income is no longer being accrued and repayment has been rescheduled are considered nonperforming. The level of nonperforming loans is another indication of the quality of a bank’s portfolio. The ratio of nonperforming loans to total loans can range
upward from 0.20%. When the ratio exceeds 3.00% — as it has in past years, for banks with heavy commercial real estate exposure — it can cause concern. In addition to reducing the flow of interest income, nonperforming loans represent potential charge-offs if their quality deteriorates further.
As the level of nonperforming loans rises, charge-offs and the provision for loan losses frequently rise as well. For a bank with a very high level of nonperforming loans — approaching 7.00% or more — its future may be in doubt. According to the FDIC, the industry’s level of nonperforming loans stood at 2.04% at
BALANCE SHEET — FDIC-INSURED COMMERCIAL BANKS
BALANCE SHEET — FDIC-INSURED COMMERCIAL BANKS(In billions of dollars)
YR-TO-YR ---- DEC. 31 ---- ---- JUN. 30 ---- -- % CHANGE* --
ITEM 2006 2007 2007 2008 DEC. JUN.Total assets 10,090 11,176 10,411 11,426 10.8 9.7
Loans and leasesReal estate loans 3,432 3,675 3,506 3,666 7.1 4.6Comm'l & industrial loans 1,140 1,370 1,219 1,407 20.2 15.4Loans to individuals 858 960 875 972 11.9 11.1Farm loans 54 57 55 58 4.6 4.9Other loans & leases 499 568 510 580 13.7 13.7
LESS: Unearned income 2 2 3 2 (3.7) (17.9)Total loans & leases 5,981 6,626 6,163 6,681 10.8 8.4
LESS: Reserves for losses 69 89 72 118 28.3 63.7Net loans & leases 5,912 6,538 6,091 6,563 10.6 7.8Securities 1,666 1,591 1,634 1,662 (4.5) 1.7Other real estate owned 5 9 6 14 90.8 127.1Goodwill & other intangibles 359 424 379 439 18.2 15.9All other assets 2,149 2,615 2,302 2,748 21.7 19.4
Total liabilities & capital 10,090 11,176 10,411 11,426 10.8 9.7Noninterest-bearing deposits 1,216 1,197 1,184 1,239 (1.6) 4.6Interest-bearing deposits 5,515 6,112 5,682 6,184 10.8 8.8Other borrowed funds 1,711 2,018 1,850 2,116 17.9 14.4Subordinated debt 150 175 161 174 16.8 7.9All other liabilities 468 530 485 558 13.3 14.9Equity capital 1,030 1,144 1,050 1,155 11.1 10.1
*Based on unrounded data.Source: Federal Deposit Insurance Corporation.
34 BANKING / DECEMBER 11, 2008 INDUSTRY SURVEYS
June 30, 2008, up from 1.39% at the end of 2007 and 0.78% at the end of 2006. At June 30, 2006, the level of nonperforming loans stood at 0.70% — the lowest level recorded in the 24 years that this data has been collected.
Capital levels. The Federal Reserve System has established two basic measures of capital adequacy with which bank holding companies must comply: a risk-based measure and a leverage measure.
Risk-based standards consider differences in the risk profiles among banks to account for off–balance-sheet exposure and to encourage banks to hold liquid assets. Assets and off–balance-sheet items are assigned to broad risk categories, each representing various weightings. Capital ratios represent capital as a percentage of total risk-weighted assets. The minimum guideline for the ratio of total capital to risk-weighted assets is 8.0%. At least half of total capital must consist of Tier 1 capital: common equity and certain preferred stock, less goodwill and other intangible assets.
The Fed’s minimum leverage ratio guidelines for bank holding companies provide for a 3.0% minimum ratio of Tier 1 capital to average assets, less goodwill and certain intangible assets. Bank holding companies making acquisitions are expected to maintain capital positions substantially above the minimum supervisory level.
To meet the regulatory requirement to be classified as “well capitalized,” the financial institution must have a leverage capital ratio exceeding 5%, a Tier 1 risk-based capital ratio exceeding 6%, and a total risk-based capital ratio exceeding 10%.
In general, the higher the percentage for either of these measures, the more conservative the bank is. A high capital ratio also indicates the ability to grow through either internal means or acquisitions. Failure to meet capital guidelines could subject a bank to a variety of enforcement actions, including the termination of deposit insurance by the FDIC and restrictions on the bank’s business by the FDIC or the Federal Reserve.
A bank that falls shy of minimum capital requirements is considered by the FDIC to be a “problem” institution. As of June 30, 2008, the FDIC’s problem-bank list had 117 institutions, with a total of $78.3 billion in assets, out of a total of 8,451 commercial and savings banks insured by the FDIC. This figure is up from the low of 47 institutions, at September 30, 2006, but well below the high of 136 institutions in 2002.
In 2007, three FDIC-insured banks failed; these were the first failures since June 2004, breaking a nearly three-year stretch in which no FDIC-insured institutions failed.
Debt leverage. Banks incur debt when they invest in productive capacity — whether expanding their facilities or borrowing money to make additional loans for which they do not have sufficient deposits.
The extent of a bank’s financial leverage says something about its relative risk profile. One measure of leverage is long-term debt divided by the sum of equity and total debt. For banks, a figure of 45% is generally the upper limit. Banks with lower debt levels have more room to borrow should the need arise.
Liquidity. A low debt level contributes to a bank’s liquidity (its ability to raise funds for lending and other purposes). One gauge of liquidity is the proportion of loans outstanding to total assets. A bank that is “loaned up” has a high ratio of loans to assets; 65% or more is considered high, or illiquid. In contrast, a liquid bank has a smaller proportion of its assets in loans, and more in short-term money market investments and investment securities, both of which can be quickly converted into funds and loaned out.
Derivatives. Derivatives are financial instruments, designed to transfer risk between parties, with values derived from the level of an underlying instrument, index, or interest rate level, which can include equity or debt securities, currencies, interest rates, commodities, and even things as abstract as whether or not a company defaults on its debt. Some derivative contracts are traded on exchanges; other derivative contracts can be directly negotiated between parties, and still others can be arranged through a third party.

INDUSTRY SURVEYS BANKING / DECEMBER 11, 2008 35
Banks generally use derivatives to hedge a variety of risks, including interest rate changes. As a result of such hedging, many banks have become less interest rate–sensitive.
One type of derivative commonly used by banks is an interest rate swap. A bank that receives a fixed interest rate for a particular asset may want to protect against future rate changes, since a majority of a bank’s funding is derived from floating rate sources. As a result, the bank will want to convert this fixed interest rate into a floating rate. The bank will find a party that may prefer to receive a fixed rate instead of a floating rate over time and enter into a swap agreement. The counter party may be an investor holding a floating-rate debt instrument. Such an investor may decide to convert the current floating rate into a fixed rate, thus locking in future interest payments related to that investment. As a result, the bank would receive payments that change as interest rates change from the counter party and make payments to the counter party at the agreed upon fixed rate. Of course, only the net difference between the payments would change hands between the parties.
Derivatives pose inherent risks if they are not used for hedging purposes, as there is the chance that the bet will not go in the direction that one hopes. Most derivatives contain counter-party credit risk, in which a counter party may fail to fulfill an obligation specified by the derivative contract terms.
Credit exposure is assessed by the cost to replace a contract at current market rates. Many banks try to limit counter-party credit risk in one or more ways. They can deal with derivatives dealers that are national market makers with strong credit ratings in their derivatives activities. They can subject counter parties to credit reviews and approvals similar to those used in making loans and other extensions of credit. Finally, they can require counter parties to provide cash collateral when their unsecured loss positions exceed certain negotiated limits.

36 BANKING / DECEMBER 11, 2008 INDUSTRY SURVEYS
INDUSTRY REFERENCES
PERIODICALS ABA Banking Journal http://www.ababj.com Monthly journal of the American Bankers Association; focuses on regulatory developments and compliance issues. American Banker http://www.americanbanker.com Daily newspaper reporting on a broad range of legislative, product, and financial developments affecting depository institutions. Federal Reserve Bulletin http://www.federalreserve.gov/publications.htm Monthly bulletin with data and articles covering banking and economic developments. Quarterly Banking Profile http://www4.fdic.gov/QBP/index.asp Quarterly bulletin with earnings and balance-sheet data for FDIC-insured institutions. REGULATORY AND OTHER FEDERAL AGENCIES Federal Deposit Insurance Corp. (FDIC) http://www.fdic.gov Independent deposit insurance agency created by Congress to maintain stability and public confidence in the US banking system by identifying, monitoring, and addressing risks to insured depository institutions. Federal Reserve System, Board of Governors http://www.federalreserve.gov Founded by Congress in 1913, the Federal Reserve System supervises and regulates banks; maintains the stability of the financial system; conducts US monetary policy by influencing money and credit conditions; and provides certain financial services to the US government, the public, financial institutions, and foreign official institutions. US Department of Justice (DOJ) Antitrust Division http://www.usdoj.gov/atr/index.html As enforcer of antitrust rules, the DOJ reviews bank mergers for compliance with the Clayton Act, which prohibits mergers or acquisitions that are likely to reduce competition.
TRADE ASSOCIATIONS American Bankers Association http://www.aba.com Largest banking trade association; represents all categories of banking institutions, including community, regional, and money center banks. American Bankruptcy Institute http://www.abiworld.org A multidisciplinary, nonpartisan organization founded in 1982 to provide Congress and the public with analysis of bankruptcy issues. Membership includes 7,500 attorneys, auctioneers, bankers, judges, professors, turnaround specialists, accountants, and other bankruptcy professionals. America’s Community Bankers http://www.acbankers.org National trade association for community banks; sponsors conferences, meetings, and education programs, and maintains research resources. Mortgage Bankers Association http://www.mortgagebankers.org A national association representing the real estate finance industry. Over 3,000 member companies include mortgage companies, mortgage brokers, commercial banks, thrifts, life insurance companies, and others in the mortgage lending field. MARKET RESEARCH FIRMS Highline Data http://www.highlinedata.com A financial information and research firm that collects, standardizes, and disseminates corporate, financial, market, and merger and acquisition data, plus news on banking and other industries. SNL Financial http://www.snl.com A financial information and research firm that collects, standardizes, and disseminates corporate, financial, market, and merger and acquisition data, plus news and analytics on banking and other industries.
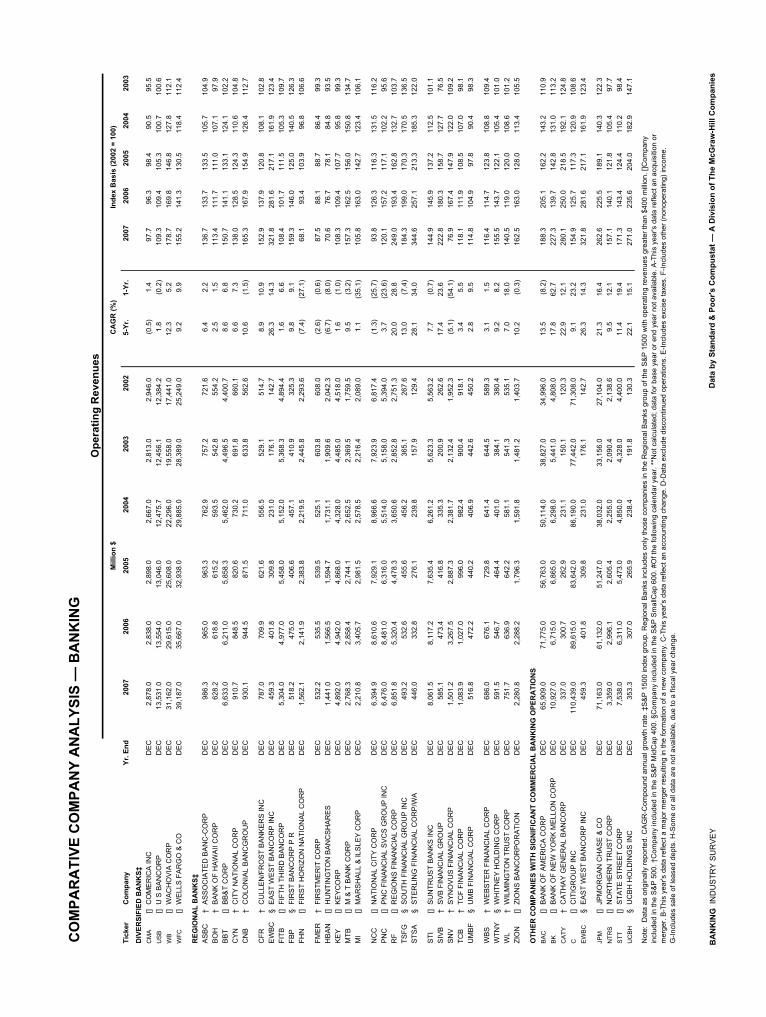
CO
MPA
RA
TIVE
CO
MPA
NY
AN
ALY
SIS
— B
AN
KIN
G
O
pera
ting
Rev
enue
sM
illio
n $
CA
GR
(%)
Inde
x B
asis
(200
2 =
100)
Tick
erC
ompa
nyYr
. End
2007
2006
2005
2004
2003
2002
5-Yr
.1-
Yr.
2007
2006
2005
2004
2003
DIV
ERSI
FIED
BA
NK
S‡C
MA
[]C
OM
ER
ICA
INC
DE
C2,
878.
02,
838.
02,
898.
02,
667.
02,
813.
02,
946.
0(0
.5)
1.4
97.7
96.3
98.4
90.5
95.5
US
B[]
U S
BA
NC
OR
PD
EC
13,5
31.0
13,5
54.0
13,0
46.0
12,4
75.7
12,4
56.1
12,3
84.2
1.8
(0.2
)10
9.3
109.
410
5.3
100.
710
0.6
WB
[]W
AC
HO
VIA
CO
RP
DE
C31
,162
.029
,615
.025
,608
.022
,296
.019
,558
.017
,441
.012
.35.
217
8.7
169.
814
6.8
127.
811
2.1
WFC
[]W
ELL
S F
AR
GO
& C
OD
EC
39,1
87.0
35,6
67.0
32,9
38.0
29,8
85.0
28,3
89.0
25,2
49.0
9.2
9.9
155.
214
1.3
130.
511
8.4
112.
4
REG
ION
AL
BA
NK
S‡A
SB
C†
AS
SO
CIA
TED
BA
NC
-CO
RP
DE
C98
6.3
965.
096
3.3
762.
975
7.2
721.
66.
42.
213
6.7
133.
713
3.5
105.
710
4.9
BO
H†
BA
NK
OF
HA
WA
II C
OR
PD
EC
628.
261
8.8
615.
259
3.5
542.
855
4.2
2.5
1.5
113.
411
1.7
111.
010
7.1
97.9
BB
T[]
BB
&T
CO
RP
DE
C6,
633.
06,
211.
05,
858.
35,
462.
04,
496.
54,
400.
78.
66.
815
0.7
141.
113
3.1
124.
110
2.2
CY
N†
CIT
Y N
ATI
ON
AL
CO
RP
DE
C91
0.7
848.
582
0.6
730.
269
1.8
660.
16.
67.
313
8.0
128.
512
4.3
110.
610
4.8
CN
B†
CO
LON
IAL
BA
NC
GR
OU
PD
EC
930.
194
4.5
871.
571
1.0
633.
856
2.6
10.6
(1.5
)16
5.3
167.
915
4.9
126.
411
2.7
CFR
†C
ULL
EN
/FR
OS
T B
AN
KE
RS
INC
DE
C78
7.0
709.
962
1.6
556.
552
9.1
514.
78.
910
.915
2.9
137.
912
0.8
108.
110
2.8
EW
BC
§E
AS
T W
ES
T B
AN
CO
RP
INC
DE
C45
9.3
401.
830
9.8
231.
017
6.1
142.
726
.314
.332
1.8
281.
621
7.1
161.
912
3.4
FITB
[]FI
FTH
TH
IRD
BA
NC
OR
PD
EC
5,30
4.0
4,97
7.0
5,45
8.0
5,15
2.0
5,36
8.3
4,89
4.4
1.6
6.6
108.
410
1.7
111.
510
5.3
109.
7FB
P§
FIR
ST
BA
NC
OR
P P
RD
EC
518.
247
5.0
406.
645
7.1
410.
932
5.3
9.8
9.1
159.
314
6.0
125.
014
0.5
126.
3FH
N[]
FIR
ST
HO
RIZ
ON
NA
TIO
NA
L C
OR
PD
EC
1,56
2.1
2,14
1.9
2,38
3.8
2,21
9.5
2,44
5.8
2,29
3.6
(7.4
)(2
7.1)
68.1
93.4
103.
996
.810
6.6
FME
R†
FIR
STM
ER
IT C
OR
PD
EC
532.
253
5.5
539.
552
5.1
603.
860
8.0
(2.6
)(0
.6)
87.5
88.1
88.7
86.4
99.3
HB
AN
[]H
UN
TIN
GTO
N B
AN
CS
HA
RE
SD
EC
1,44
1.0
1,56
6.5
1,59
4.7
1,73
1.1
1,90
9.6
2,04
2.3
(6.7
)(8
.0)
70.6
76.7
78.1
84.8
93.5
KE
Y[]
KE
YC
OR
PD
EC
4,89
2.0
4,94
2.0
4,86
8.0
4,32
8.0
4,48
5.0
4,51
8.0
1.6
(1.0
)10
8.3
109.
410
7.7
95.8
99.3
MTB
[]M
& T
BA
NK
CO
RP
DE
C2,
768.
32,
858.
42,
744.
12,
652.
52,
369.
51,
759.
59.
5(3
.2)
157.
316
2.5
156.
015
0.8
134.
7M
I[]
MA
RS
HA
LL &
ILS
LEY
CO
RP
DE
C2,
210.
83,
405.
72,
981.
52,
578.
52,
216.
42,
089.
01.
1(3
5.1)
105.
816
3.0
142.
712
3.4
106.
1
NC
C[]
NA
TIO
NA
L C
ITY
CO
RP
DE
C6,
394.
98,
610.
67,
929.
18,
966.
67,
923.
96,
817.
4(1
.3)
(25.
7)93
.812
6.3
116.
313
1.5
116.
2P
NC
[]P
NC
FIN
AN
CIA
L S
VC
S G
RO
UP
INC
DE
C6,
476.
08,
481.
06,
316.
05,
514.
05,
158.
05,
394.
03.
7(2
3.6)
120.
115
7.2
117.
110
2.2
95.6
RF
[]R
EG
ION
S F
INA
NC
IAL
CO
RP
DE
C6,
851.
85,
320.
44,
478.
33,
650.
62,
852.
82,
751.
320
.028
.824
9.0
193.
416
2.8
132.
710
3.7
TSFG
§S
OU
TH F
INA
NC
IAL
GR
OU
P IN
CD
EC
493.
253
2.6
455.
645
6.2
365.
126
7.6
13.0
(7.4
)18
4.3
199.
017
0.3
170.
513
6.5
STS
A§
STE
RLI
NG
FIN
AN
CIA
L C
OR
P/W
AD
EC
446.
033
2.8
276.
123
9.8
157.
912
9.4
28.1
34.0
344.
625
7.1
213.
318
5.3
122.
0
STI
[]S
UN
TRU
ST
BA
NK
S IN
CD
EC
8,06
1.5
8,11
7.2
7,63
5.4
6,26
1.2
5,62
3.3
5,56
3.2
7.7
(0.7
)14
4.9
145.
913
7.2
112.
510
1.1
SIV
B†
SV
B F
INA
NC
IAL
GR
OU
PD
EC
585.
147
3.4
416.
833
5.3
200.
926
2.6
17.4
23.6
222.
818
0.3
158.
712
7.7
76.5
SN
V†
SY
NO
VU
S F
INA
NC
IAL
CO
RP
DE
C1,
501.
23,
267.
52,
887.
32,
381.
72,
132.
41,
952.
3(5
.1)
(54.
1)76
.916
7.4
147.
912
2.0
109.
2TC
B†
TCF
FIN
AN
CIA
L C
OR
PD
EC
1,08
3.9
1,02
7.0
996.
098
2.4
900.
491
8.1
3.4
5.5
118.
111
1.9
108.
510
7.0
98.1
UM
BF
§U
MB
FIN
AN
CIA
L C
OR
PD
EC
516.
847
2.2
440.
240
6.9
442.
645
0.2
2.8
9.5
114.
810
4.9
97.8
90.4
98.3
WB
S†
WE
BS
TER
FIN
AN
CIA
L C
OR
PD
EC
686.
067
6.1
729.
864
1.4
644.
558
9.3
3.1
1.5
116.
411
4.7
123.
810
8.8
109.
4W
TNY
§W
HIT
NE
Y H
OLD
ING
CO
RP
DE
C59
1.5
546.
746
4.4
401.
038
4.1
380.
49.
28.
215
5.5
143.
712
2.1
105.
410
1.0
WL
†W
ILM
ING
TON
TR
US
T C
OR
PD
EC
751.
763
6.9
642.
258
1.1
541.
353
5.1
7.0
18.0
140.
511
9.0
120.
010
8.6
101.
2ZI
ON
[]ZI
ON
S B
AN
CO
RP
OR
ATI
ON
DE
C2,
280.
82,
288.
21,
796.
31,
591.
81,
481.
21,
403.
710
.2(0
.3)
162.
516
3.0
128.
011
3.4
105.
5
OTH
ER C
OM
PAN
IES
WIT
H S
IGN
IFIC
AN
T C
OM
MER
CIA
L B
AN
KIN
G O
PER
ATI
ON
SB
AC
[]B
AN
K O
F A
ME
RIC
A C
OR
PD
EC
65,9
09.0
71,7
75.0
56,7
63.0
50,1
14.0
38,8
27.0
34,9
96.0
13.5
(8.2
)18
8.3
205.
116
2.2
143.
211
0.9
BK
[]B
AN
K O
F N
EW
YO
RK
ME
LLO
N C
OR
PD
EC
10,9
27.0
6,71
5.0
6,86
5.0
6,29
8.0
5,44
1.0
4,80
8.0
17.8
62.7
227.
313
9.7
142.
813
1.0
113.
2C
ATY
†C
ATH
AY
GE
NE
RA
L B
AN
CO
RP
DE
C33
7.0
300.
726
2.9
231.
115
0.1
120.
322
.912
.128
0.1
250.
021
8.5
192.
112
4.8
C[]
CIT
IGR
OU
P IN
CD
EC
110,
439.
089
,615
.083
,642
.086
,190
.077
,442
.071
,308
.09.
123
.215
4.9
125.
711
7.3
120.
910
8.6
EW
BC
§E
AS
T W
ES
T B
AN
CO
RP
INC
DE
C45
9.3
401.
830
9.8
231.
017
6.1
142.
726
.314
.332
1.8
281.
621
7.1
161.
912
3.4
JPM
[]JP
MO
RG
AN
CH
AS
E &
CO
DE
C71
,163
.061
,132
.051
,247
.038
,032
.033
,156
.027
,104
.021
.316
.426
2.6
225.
518
9.1
140.
312
2.3
NTR
S[]
NO
RTH
ER
N T
RU
ST
CO
RP
DE
C3,
359.
02,
996.
12,
605.
42,
255.
02,
090.
42,
138.
69.
512
.115
7.1
140.
112
1.8
105.
497
.7S
TT[]
STA
TE S
TRE
ET
CO
RP
DE
C7,
538.
06,
311.
05,
473.
04,
850.
04,
328.
04,
400.
011
.419
.417
1.3
143.
412
4.4
110.
298
.4U
CB
H§
UC
BH
HO
LDIN
GS
INC
DE
C35
3.3
307.
026
5.9
238.
419
1.8
130.
322
.115
.127
1.0
235.
620
4.0
182.
914
7.1
Not
e: D
ata
as o
rigin
ally
repo
rted.
CA
GR
-Com
poun
d an
nual
gro
wth
rate
. ‡S
&P
150
0 in
dex
grou
p. R
egio
nal B
anks
incl
udes
onl
y th
ose
com
pani
es in
the
Reg
iona
l Ban
ks g
roup
of t
he S
&P
150
0 w
ith o
pera
ting
reve
nues
gre
ater
than
$40
0 m
illio
n. []
Com
pany
incl
uded
in th
e S
&P
500
. †C
ompa
ny in
clud
ed in
the
S&
P M
idC
ap 4
00. §
Com
pany
incl
uded
in th
e S
&P
Sm
allC
ap 6
00. #
Of t
he fo
llow
ing
cale
ndar
yea
r. **
Not
cal
cula
ted;
dat
a fo
r bas
e ye
ar o
r end
yea
r not
ava
ilabl
e. A
-Thi
s ye
ar's
dat
a re
flect
an
acqu
isiti
on o
r
mer
ger.
B-T
his
year
's d
ata
refle
ct a
maj
or m
erge
r res
ultin
g in
the
form
atio
n of
a n
ew c
ompa
ny. C
-Thi
s ye
ar's
dat
a re
flect
an
acco
untin
g ch
ange
. D-D
ata
excl
ude
disc
ontin
ued
oper
atio
ns. E
-Incl
udes
exc
ise
taxe
s. F
-Incl
udes
oth
er (n
onop
erat
ing)
inco
me.
G-In
clud
es s
ale
of le
ased
dep
ts. H
-Som
e or
all
data
are
not
ava
ilabl
e, d
ue to
a fi
scal
yea
r cha
nge.
BA
NK
ING
IN
DU
STR
Y S
UR
VE
YD
ata
by S
tand
ard
& P
oor's
Com
pust
at —
A D
ivis
ion
of T
he M
cGra
w-H
ill C
ompa
nies

Net
Inco
me
Mill
ion
$C
AG
R (%
)In
dex
Bas
is (1
997
= 10
0)
Tick
erC
ompa
nyYr
. End
2007
2006
2005
2004
2003
2002
1997
10-Y
r.5-
Yr.
1-Yr
.20
0720
0620
0520
0420
03
DIV
ERSI
FIED
BA
NK
S‡C
MA
[]C
OM
ER
ICA
INC
DE
C68
2.0
782.
086
1.0
757.
066
1.0
601.
053
0.5
2.5
2.6
(12.
8)12
914
716
214
312
5U
SB
[]U
S B
AN
CO
RP
DE
C4,
324.
04,
751.
04,
489.
04,
166.
83,
710.
13,
326.
419
4.8
36.3
5.4
(9.0
)2,
220
2,43
92,
305
2,14
01,
905
WB
[]W
AC
HO
VIA
CO
RP
DE
C6,
312.
07,
745.
06,
429.
05,
214.
04,
247.
03,
579.
01,
896.
012
.812
.0(1
8.5)
333
408
339
275
224
WFC
[]W
ELL
S F
AR
GO
& C
OD
EC
8,05
7.0
8,48
2.0
7,67
1.0
7,01
4.0
6,20
2.0
5,71
0.0
1,35
1.0
19.6
7.1
(5.0
)59
662
856
851
945
9
REG
ION
AL
BA
NK
S‡A
SB
C†
AS
SO
CIA
TED
BA
NC
-CO
RP
DE
C28
5.8
316.
632
0.2
258.
322
8.7
210.
752
.418
.56.
3(9
.8)
546
605
611
493
437
BO
H†
BA
NK
OF
HA
WA
II C
OR
PD
EC
183.
718
0.4
181.
617
3.3
135.
212
1.2
139.
52.
88.
71.
913
212
913
012
497
BB
T[]
BB
&T
CO
RP
DE
C1,
734.
01,
528.
01,
653.
81,
558.
41,
064.
91,
293.
235
9.9
17.0
6.0
13.5
482
425
459
433
296
CY
N†
CIT
Y N
ATI
ON
AL
CO
RP
DE
C22
2.7
233.
523
4.7
206.
318
6.7
183.
180
.110
.84.
0(4
.6)
278
291
293
257
233
CN
B†
CO
LON
IAL
BA
NC
GR
OU
PD
EC
180.
926
5.8
228.
517
2.9
149.
914
0.9
77.2
8.9
5.1
(31.
9)23
434
429
622
419
4
CFR
†C
ULL
EN
/FR
OS
T B
AN
KE
RS
INC
DE
C21
2.1
193.
616
5.4
141.
313
0.5
122.
263
.512
.811
.69.
533
430
526
122
320
6E
WB
C§
EA
ST
WE
ST
BA
NC
OR
P IN
CD
EC
161.
214
3.4
108.
478
.059
.048
.711
.030
.827
.012
.41,
464
1,30
298
470
953
6FI
TB[]
FIFT
H T
HIR
D B
AN
CO
RP
DE
C1,
076.
01,
184.
01,
549.
01,
525.
01,
721.
61,
634.
740
1.2
10.4
(8.0
)(9
.1)
268
295
386
380
429
FBP
§FI
RS
T B
AN
CO
RP
P R
DE
C68
.184
.611
4.6
177.
315
2.3
108.
047
.53.
7(8
.8)
(19.
5)14
317
824
137
332
1FH
N[]
FIR
ST
HO
RIZ
ON
NA
TIO
NA
L C
OR
PD
EC
(174
.9)
250.
844
1.1
454.
447
3.3
376.
519
7.5
NM
NM
NM
(89)
127
223
230
240
FME
R†
FIR
STM
ER
IT C
OR
PD
EC
123.
094
.913
0.5
103.
212
1.7
154.
486
.43.
6(4
.4)
29.6
142
110
151
120
141
HB
AN
[]H
UN
TIN
GTO
N B
AN
CS
HA
RE
SD
EC
75.2
461.
241
2.1
398.
938
5.7
323.
729
2.7
(12.
7)(2
5.3)
(83.
7)26
158
141
136
132
KE
Y[]
KE
YC
OR
PD
EC
941.
01,
193.
01,
129.
095
4.0
903.
097
6.0
919.
00.
2(0
.7)
(21.
1)10
213
012
310
498
MTB
[]M
& T
BA
NK
CO
RP
DE
C65
4.3
839.
278
2.2
722.
557
3.9
485.
117
6.2
14.0
6.2
(22.
0)37
147
644
441
032
6M
I[]
MA
RS
HA
LL &
ILS
LEY
CO
RP
DE
C49
6.9
807.
872
7.5
627.
154
4.1
480.
324
5.1
7.3
0.7
(38.
5)20
333
029
725
622
2
NC
C[]
NA
TIO
NA
L C
ITY
CO
RP
DE
C31
4.0
2,29
9.8
1,98
5.2
2,77
9.9
2,11
7.1
1,59
3.6
807.
4(9
.0)
(27.
7)(8
6.3)
3928
524
634
426
2P
NC
[]P
NC
FIN
AN
CIA
L S
VC
S G
RO
UP
INC
DE
C1,
467.
02,
595.
01,
325.
01,
197.
01,
029.
01,
200.
01,
052.
03.
44.
1(4
3.5)
139
247
126
114
98R
F[]
RE
GIO
NS
FIN
AN
CIA
L C
OR
PD
EC
1,39
3.2
1,35
3.1
1,00
0.5
823.
865
1.8
619.
929
9.7
16.6
17.6
3.0
465
452
334
275
218
TSFG
§S
OU
TH F
INA
NC
IAL
GR
OU
P IN
CD
EC
73.3
112.
970
.212
0.0
95.1
60.6
14.3
17.7
3.9
(35.
1)51
178
749
083
766
3S
TSA
§S
TER
LIN
G F
INA
NC
IAL
CO
RP
/WA
DE
C93
.373
.961
.256
.334
.925
.69.
625
.529
.526
.296
876
763
558
436
2
STI
[]S
UN
TRU
ST
BA
NK
S IN
CD
EC
1,63
4.0
2,11
7.5
1,98
7.2
1,57
2.9
1,33
2.3
1,33
1.8
667.
39.
44.
2(2
2.8)
245
317
298
236
200
SIV
B†
SV
B F
INA
NC
IAL
GR
OU
PD
EC
123.
689
.292
.563
.912
.053
.427
.716
.118
.338
.644
732
233
423
143
SN
V†
SY
NO
VU
S F
INA
NC
IAL
CO
RP
DE
C34
2.9
616.
951
6.4
437.
038
8.9
365.
316
5.2
7.6
(1.3
)(4
4.4)
208
373
313
264
235
TCB
†TC
F FI
NA
NC
IAL
CO
RP
DE
C26
6.8
244.
926
5.1
255.
021
5.9
232.
914
5.1
6.3
2.8
8.9
184
169
183
176
149
UM
BF
§U
MB
FIN
AN
CIA
L C
OR
PD
EC
74.2
59.8
56.3
42.8
58.9
57.2
61.7
1.9
5.4
24.2
120
9791
6995
WB
S†
WE
BS
TER
FIN
AN
CIA
L C
OR
PD
EC
110.
713
3.8
185.
915
3.8
163.
216
0.0
33.8
12.6
(7.1
)(1
7.3)
328
396
550
455
483
WTN
Y§
WH
ITN
EY
HO
LDIN
G C
OR
PD
EC
151.
114
4.6
102.
397
.198
.595
.352
.211
.29.
64.
428
927
719
618
618
9W
L†
WIL
MIN
GTO
N T
RU
ST
CO
RP
DE
C18
2.0
143.
817
3.0
141.
913
4.4
133.
210
6.0
5.6
6.4
26.6
172
136
163
134
127
ZIO
N[]
ZIO
NS
BA
NC
OR
PO
RA
TIO
ND
EC
493.
758
3.1
480.
140
6.0
339.
631
7.1
122.
415
.09.
3(1
5.3)
404
477
392
332
278
OTH
ER C
OM
PAN
IES
WIT
H S
IGN
IFIC
AN
T C
OM
MER
CIA
L B
AN
KIN
G O
PER
ATI
ON
SB
AC
[]B
AN
K O
F A
ME
RIC
A C
OR
PD
EC
14,9
82.0
21,1
33.0
16,4
65.0
14,1
43.0
10,8
10.0
9,24
9.0
3,07
7.0
17.2
10.1
(29.
1)48
768
753
546
035
1B
K[]
BA
NK
OF
NE
W Y
OR
K M
ELL
ON
CO
RP
DE
C2,
227.
01,
476.
01,
571.
01,
440.
01,
157.
090
2.0
1,10
4.0
7.3
19.8
50.9
202
134
142
130
105
CA
TY†
CA
THA
Y G
EN
ER
AL
BA
NC
OR
PD
EC
125.
511
7.6
104.
186
.855
.648
.720
.120
.120
.86.
762
458
551
843
227
6C
[]C
ITIG
RO
UP
INC
DE
C3,
617.
021
,249
.019
,806
.017
,046
.017
,853
.013
,448
.03,
104.
01.
5(2
3.1)
(83.
0)11
768
563
854
957
5E
WB
C§
EA
ST
WE
ST
BA
NC
OR
P IN
CD
EC
161.
214
3.4
108.
478
.059
.048
.711
.030
.827
.012
.41,
464
1,30
298
470
953
6
JPM
[]JP
MO
RG
AN
CH
AS
E &
CO
DE
C15
,365
.013
,649
.08,
483.
04,
466.
06,
719.
01,
663.
03,
708.
015
.356
.012
.641
436
822
912
018
1N
TRS
[]N
OR
THE
RN
TR
US
T C
OR
PD
EC
726.
966
5.4
584.
450
4.8
423.
344
7.1
309.
48.
910
.29.
223
521
518
916
313
7S
TT[]
STA
TE S
TRE
ET
CO
RP
DE
C1,
261.
01,
096.
094
5.0
798.
072
2.0
1,01
5.0
380.
012
.74.
415
.133
228
824
921
019
0U
CB
H§
UC
BH
HO
LDIN
GS
INC
DE
C10
2.3
100.
997
.885
.664
.638
.9N
AN
A21
.31.
4**
****
**N
A
Not
e: D
ata
as o
rigin
ally
repo
rted.
CA
GR
-Com
poun
d an
nual
gro
wth
rate
. ‡S
&P
150
0 in
dex
grou
p. R
egio
nal B
anks
incl
udes
onl
y th
ose
com
pani
es in
the
Reg
iona
l Ban
ks g
roup
of t
he S
&P
150
0 w
ith o
pera
ting
reve
nues
gre
ater
than
$40
0 m
illio
n. []
Com
pany
incl
uded
in th
e S
&P
500
. †C
ompa
ny in
clud
ed in
the
S&
P M
idC
ap 4
00. §
Com
pany
incl
uded
in th
e S
&P
Sm
allC
ap 6
00. #
Of t
he fo
llow
ing
cale
ndar
yea
r. **
Not
cal
cula
ted;
dat
a fo
r bas
e ye
ar o
r end
yea
r not
ava
ilabl
e.
BA
NK
ING
IN
DU
STR
Y S
UR
VE
YD
ata
by S
tand
ard
& P
oor's
Com
pust
at —
A D
ivis
ion
of T
he M
cGra
w-H
ill C
ompa
nies
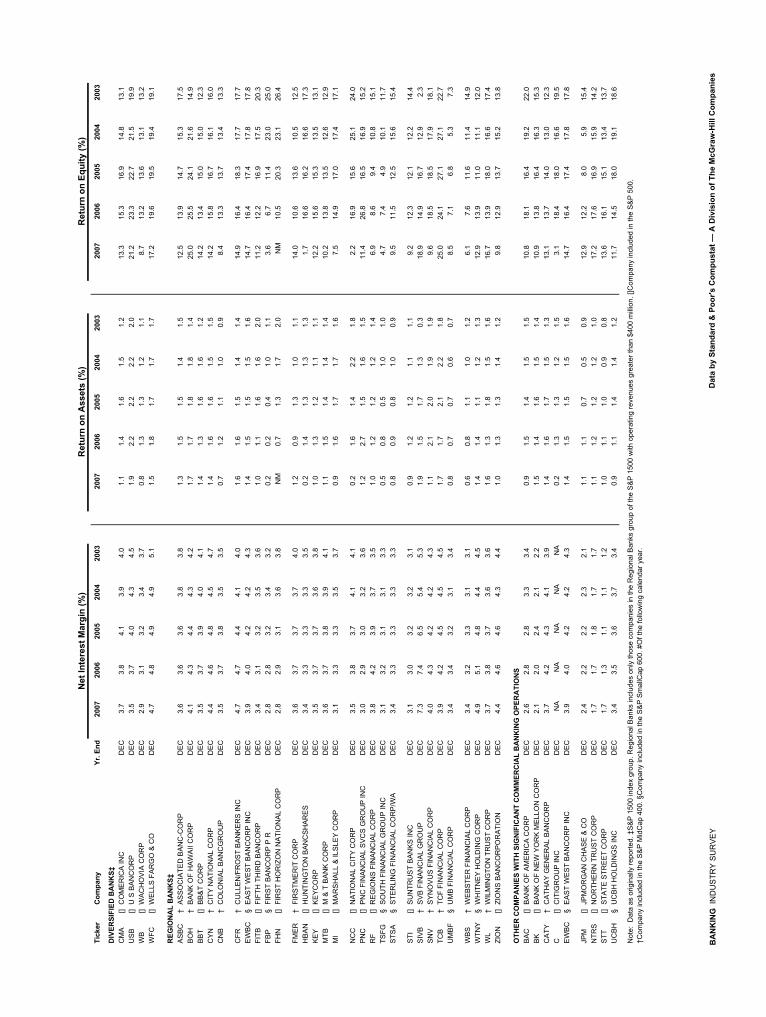
Net
Inte
rest
Mar
gin
(%)
Ret
urn
on A
sset
s (%
)R
etur
n on
Equ
ity (%
)Ti
cker
Com
pany
Yr. E
nd20
0720
0620
0520
0420
0320
0720
0620
0520
0420
0320
0720
0620
0520
0420
03
DIV
ERSI
FIED
BA
NK
S‡C
MA
[]C
OM
ER
ICA
INC
DE
C3.
73.
84.
13.
94.
01.
11.
41.
61.
51.
213
.315
.316
.914
.813
.1U
SB
[]U
S B
AN
CO
RP
DE
C3.
53.
74.
04.
34.
51.
92.
22.
22.
22.
021
.223
.322
.721
.519
.9W
B[]
WA
CH
OV
IA C
OR
PD
EC
2.9
3.1
3.2
3.4
3.7
0.8
1.3
1.3
1.2
1.1
8.7
13.2
13.6
13.1
13.2
WFC
[]W
ELL
S F
AR
GO
& C
OD
EC
4.7
4.8
4.9
4.9
5.1
1.5
1.8
1.7
1.7
1.7
17.2
19.6
19.5
19.4
19.1
REG
ION
AL
BA
NK
S‡A
SB
C†
AS
SO
CIA
TED
BA
NC
-CO
RP
DE
C3.
63.
63.
63.
83.
81.
31.
51.
51.
41.
512
.513
.914
.715
.317
.5B
OH
†B
AN
K O
F H
AW
AII
CO
RP
DE
C4.
14.
34.
44.
34.
21.
71.
71.
81.
81.
425
.025
.524
.121
.614
.9B
BT
[]B
B&
T C
OR
PD
EC
3.5
3.7
3.9
4.0
4.1
1.4
1.3
1.6
1.6
1.2
14.2
13.4
15.0
15.0
12.3
CY
N†
CIT
Y N
ATI
ON
AL
CO
RP
DE
C4.
44.
64.
84.
54.
71.
41.
61.
61.
51.
514
.215
.816
.716
.116
.0C
NB
†C
OLO
NIA
L B
AN
CG
RO
UP
DE
C3.
53.
73.
83.
53.
50.
71.
21.
11.
00.
98.
413
.313
.713
.413
.3
CFR
†C
ULL
EN
/FR
OS
T B
AN
KE
RS
INC
DE
C4.
74.
74.
44.
14.
01.
61.
61.
51.
41.
414
.916
.418
.317
.717
.7E
WB
C§
EA
ST
WE
ST
BA
NC
OR
P IN
CD
EC
3.9
4.0
4.2
4.2
4.3
1.4
1.5
1.5
1.5
1.6
14.7
16.4
17.4
17.8
17.8
FITB
[]FI
FTH
TH
IRD
BA
NC
OR
PD
EC
3.4
3.1
3.2
3.5
3.6
1.0
1.1
1.6
1.6
2.0
11.2
12.2
16.9
17.5
20.3
FBP
§FI
RS
T B
AN
CO
RP
P R
DE
C2.
82.
83.
23.
43.
20.
20.
20.
41.
01.
13.
66.
711
.423
.025
.0FH
N[]
FIR
ST
HO
RIZ
ON
NA
TIO
NA
L C
OR
PD
EC
2.8
2.9
3.1
3.6
3.8
NM
0.7
1.3
1.7
2.0
NM
10.5
20.3
23.1
26.4
FME
R†
FIR
STM
ER
IT C
OR
PD
EC
3.6
3.7
3.7
3.7
4.0
1.2
0.9
1.3
1.0
1.1
14.0
10.6
13.6
10.5
12.5
HB
AN
[]H
UN
TIN
GTO
N B
AN
CS
HA
RE
SD
EC
3.4
3.3
3.3
3.3
3.5
0.2
1.4
1.3
1.3
1.3
1.7
16.6
16.2
16.6
17.3
KE
Y[]
KE
YC
OR
PD
EC
3.5
3.7
3.7
3.6
3.8
1.0
1.3
1.2
1.1
1.1
12.2
15.6
15.3
13.5
13.1
MTB
[]M
& T
BA
NK
CO
RP
DE
C3.
63.
73.
83.
94.
11.
11.
51.
41.
41.
410
.213
.813
.512
.612
.9M
I[]
MA
RS
HA
LL &
ILS
LEY
CO
RP
DE
C3.
13.
33.
33.
53.
70.
91.
61.
71.
71.
67.
514
.917
.017
.417
.1
NC
C[]
NA
TIO
NA
L C
ITY
CO
RP
DE
C3.
53.
83.
74.
14.
10.
21.
61.
42.
21.
82.
216
.915
.625
.124
.0P
NC
[]P
NC
FIN
AN
CIA
L S
VC
S G
RO
UP
INC
DE
C3.
02.
93.
03.
23.
61.
22.
71.
51.
61.
511
.426
.816
.516
.915
.2R
F[]
RE
GIO
NS
FIN
AN
CIA
L C
OR
PD
EC
3.8
4.2
3.9
3.7
3.5
1.0
1.2
1.2
1.2
1.4
6.9
8.6
9.4
10.8
15.1
TSFG
§S
OU
TH F
INA
NC
IAL
GR
OU
P IN
CD
EC
3.1
3.2
3.1
3.1
3.3
0.5
0.8
0.5
1.0
1.0
4.7
7.4
4.9
10.1
11.7
STS
A§
STE
RLI
NG
FIN
AN
CIA
L C
OR
P/W
AD
EC
3.4
3.3
3.3
3.3
3.3
0.8
0.9
0.8
1.0
0.9
9.5
11.5
12.5
15.6
15.4
STI
[]S
UN
TRU
ST
BA
NK
S IN
CD
EC
3.1
3.0
3.2
3.2
3.1
0.9
1.2
1.2
1.1
1.1
9.2
12.3
12.1
12.2
14.4
SIV
B†
SV
B F
INA
NC
IAL
GR
OU
PD
EC
7.3
7.4
6.5
5.4
5.3
1.9
1.5
1.7
1.3
0.3
18.9
14.9
16.7
12.9
2.3
SN
V†
SY
NO
VU
S F
INA
NC
IAL
CO
RP
DE
C4.
04.
34.
24.
24.
31.
12.
12.
01.
91.
99.
618
.518
.517
.918
.1TC
B†
TCF
FIN
AN
CIA
L C
OR
PD
EC
3.9
4.2
4.5
4.5
4.5
1.7
1.7
2.1
2.2
1.8
25.0
24.1
27.1
27.1
22.7
UM
BF
§U
MB
FIN
AN
CIA
L C
OR
PD
EC
3.4
3.4
3.2
3.1
3.4
0.8
0.7
0.7
0.6
0.7
8.5
7.1
6.8
5.3
7.3
WB
S†
WE
BS
TER
FIN
AN
CIA
L C
OR
PD
EC
3.4
3.2
3.3
3.1
3.1
0.6
0.8
1.1
1.0
1.2
6.1
7.6
11.6
11.4
14.9
WTN
Y§
WH
ITN
EY
HO
LDIN
G C
OR
PD
EC
4.9
5.1
4.8
4.4
4.5
1.4
1.4
1.1
1.2
1.3
12.9
13.9
11.0
11.1
12.0
WL
†W
ILM
ING
TON
TR
US
T C
OR
PD
EC
3.7
3.8
3.7
3.6
3.6
1.6
1.3
1.8
1.5
1.6
16.7
13.9
18.0
16.6
17.4
ZIO
N[]
ZIO
NS
BA
NC
OR
PO
RA
TIO
ND
EC
4.4
4.6
4.6
4.3
4.4
1.0
1.3
1.3
1.4
1.2
9.8
12.9
13.7
15.2
13.8
OTH
ER C
OM
PAN
IES
WIT
H S
IGN
IFIC
AN
T C
OM
MER
CIA
L B
AN
KIN
G O
PER
ATI
ON
SB
AC
[]B
AN
K O
F A
ME
RIC
A C
OR
PD
EC
2.6
2.8
2.8
3.3
3.4
0.9
1.5
1.4
1.5
1.5
10.8
18.1
16.4
19.2
22.0
BK
[]B
AN
K O
F N
EW
YO
RK
ME
LLO
N C
OR
PD
EC
2.1
2.0
2.4
2.1
2.2
1.5
1.4
1.6
1.5
1.4
10.9
13.8
16.4
16.3
15.3
CA
TY†
CA
THA
Y G
EN
ER
AL
BA
NC
OR
PD
EC
3.7
4.2
4.3
4.1
3.9
1.4
1.6
1.7
1.5
1.3
13.1
13.7
14.0
13.0
12.3
C[]
CIT
IGR
OU
P IN
CD
EC
NA
NA
NA
NA
NA
0.2
1.3
1.3
1.2
1.5
3.1
18.4
18.0
16.6
19.5
EW
BC
§E
AS
T W
ES
T B
AN
CO
RP
INC
DE
C3.
94.
04.
24.
24.
31.
41.
51.
51.
51.
614
.716
.417
.417
.817
.8
JPM
[]JP
MO
RG
AN
CH
AS
E &
CO
DE
C2.
42.
22.
22.
32.
11.
11.
10.
70.
50.
912
.912
.28.
05.
915
.4N
TRS
[]N
OR
THE
RN
TR
US
T C
OR
PD
EC
1.7
1.7
1.8
1.7
1.7
1.1
1.2
1.2
1.2
1.0
17.2
17.6
16.9
15.9
14.2
STT
[]S
TATE
STR
EE
T C
OR
PD
EC
1.7
1.3
1.1
1.1
1.2
1.0
1.1
1.0
0.9
0.8
13.6
16.1
15.1
13.4
13.7
UC
BH
§U
CB
H H
OLD
ING
S IN
CD
EC
3.4
3.5
3.6
3.7
3.4
0.9
1.1
1.4
1.4
1.2
11.7
14.5
18.0
19.1
18.6
Not
e: D
ata
as o
rigin
ally
repo
rted.
‡S
&P
150
0 in
dex
grou
p. R
egio
nal B
anks
incl
udes
onl
y th
ose
com
pani
es in
the
Reg
iona
l Ban
ks g
roup
of t
he S
&P
150
0 w
ith o
pera
ting
reve
nues
gre
ater
than
$40
0 m
illio
n. []
Com
pany
incl
uded
in th
e S
&P
500
.
†Com
pany
incl
uded
in th
e S
&P
Mid
Cap
400
. §C
ompa
ny in
clud
ed in
the
S&
P S
mal
lCap
600
. #O
f the
follo
win
g ca
lend
ar y
ear.
BA
NK
ING
IN
DU
STR
Y S
UR
VE
YD
ata
by S
tand
ard
& P
oor's
Com
pust
at —
A D
ivis
ion
of T
he M
cGra
w-H
ill C
ompa
nies
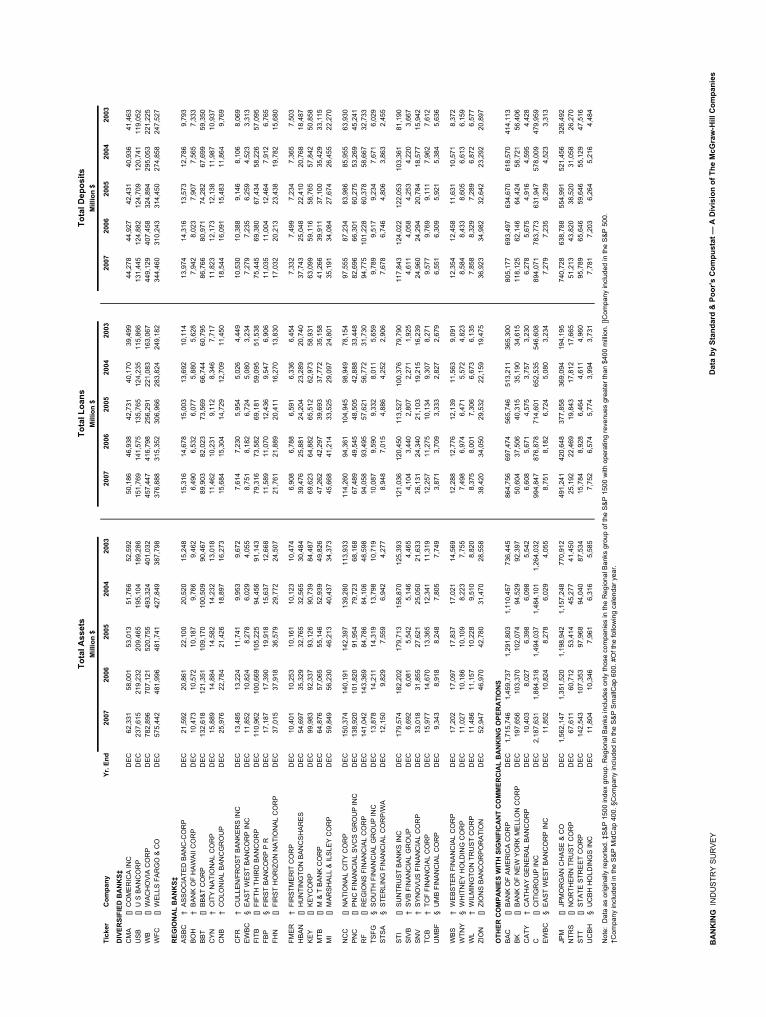
Mill
ion
$M
illio
n $
Mill
ion
$
Tick
erC
ompa
nyYr
. End
2007
2006
2005
2004
2003
2007
2006
2005
2004
2003
2007
2006
2005
2004
2003
DIV
ERSI
FIED
BA
NK
S‡C
MA
[]C
OM
ER
ICA
INC
DE
C62
,331
58
,001
53
,013
51
,766
52
,592
50
,186
46,9
38
42
,731
40,1
70
39
,499
44,2
78
44
,927
42,4
31
40
,936
41,4
63
U
SB
[]U
S B
AN
CO
RP
DE
C23
7,61
5
219,
232
20
9,46
5
195,
104
18
9,28
6
151,
769
14
1,57
5
135,
765
12
4,23
5
115,
866
13
1,44
5
124,
882
12
4,70
9
120,
741
11
9,05
2
WB
[]W
AC
HO
VIA
CO
RP
DE
C78
2,89
6
707,
121
52
0,75
5
493,
324
40
1,03
2
457,
447
41
6,79
8
256,
291
22
1,08
3
163,
067
44
9,12
9
407,
458
32
4,89
4
295,
053
22
1,22
5
WFC
[]W
ELL
S F
AR
GO
& C
OD
EC
575,
442
48
1,99
6
481,
741
42
7,84
9
387,
798
37
6,88
8
315,
352
30
6,96
6
283,
824
24
9,18
2
344,
460
31
0,24
3
314,
450
27
4,85
8
247,
527
REG
ION
AL
BA
NK
S‡A
SB
C†
AS
SO
CIA
TED
BA
NC
-CO
RP
DE
C21
,592
20
,861
22
,100
20
,520
15
,248
15
,316
14,6
78
15
,003
13,6
92
10
,114
13,9
74
14
,316
13,5
73
12
,786
9,79
3
BO
H†
BA
NK
OF
HA
WA
II C
OR
PD
EC
10,4
73
10,5
72
10,1
87
9,76
6
9,
462
6,49
0
6,53
2
6,07
7
5,88
0
5,62
8
7,94
2
8,02
3
7,90
7
7,56
5
7,33
3
BB
T[]
BB
&T
CO
RP
DE
C13
2,61
8
121,
351
10
9,17
0
100,
509
90
,467
89
,903
82,0
23
73
,569
66,7
44
60
,795
86,7
66
80
,971
74,2
82
67
,699
59,3
50
C
YN
†C
ITY
NA
TIO
NA
L C
OR
PD
EC
15,8
89
14,8
84
14,5
82
14,2
32
13,0
18
11,4
62
10
,231
9,11
2
8,34
6
7,71
7
11,8
23
12
,173
12,1
38
11
,987
10,9
37
C
NB
†C
OLO
NIA
L B
AN
CG
RO
UP
DE
C25
,976
22
,784
21
,426
18
,897
16
,273
15
,684
15,3
04
14
,729
12,7
09
11
,450
18,5
44
16
,091
15,4
83
11
,864
9,76
9
CFR
†C
ULL
EN
/FR
OS
T B
AN
KE
RS
INC
DE
C13
,485
13
,224
11
,741
9,
953
9,67
2
7,
614
7,
230
5,
954
5,
026
4,
449
10
,530
10,3
88
9,
146
8,
106
8,
069
E
WB
C§
EA
ST
WE
ST
BA
NC
OR
P IN
CD
EC
11,8
52
10,8
24
8,27
8
6,
029
4,05
5
8,
751
8,
182
6,
724
5,
080
3,
234
7,
279
7,
235
6,
259
4,
523
3,
313
FI
TB[]
FIFT
H T
HIR
D B
AN
CO
RP
DE
C11
0,96
2
100,
669
10
5,22
5
94,4
56
91,1
43
79,3
16
73
,582
69,1
81
59
,095
51,5
38
75
,445
69,3
80
67
,434
58,2
26
57
,095
FBP
§FI
RS
T B
AN
CO
RP
P R
DE
C17
,187
17
,390
19
,918
15
,637
12
,668
11
,589
11,0
70
12
,436
9,54
7
6,90
6
11,0
35
11
,004
12,4
64
7,
912
6,
765
FH
N[]
FIR
ST
HO
RIZ
ON
NA
TIO
NA
L C
OR
PD
EC
37,0
15
37,9
18
36,5
79
29,7
72
24,5
07
21,7
61
21
,889
20,4
11
16
,270
13,8
30
17
,032
20,2
13
23
,438
19,7
82
15
,680
FME
R†
FIR
STM
ER
IT C
OR
PD
EC
10,4
01
10,2
53
10,1
61
10,1
23
10,4
74
6,90
8
6,78
8
6,59
1
6,33
6
6,45
4
7,33
2
7,49
9
7,23
4
7,36
5
7,50
3
HB
AN
[]H
UN
TIN
GTO
N B
AN
CS
HA
RE
SD
EC
54,6
97
35,3
29
32,7
65
32,5
65
30,4
84
39,4
76
25
,881
24,2
04
23
,289
20,7
40
37
,743
25,0
48
22
,410
20,7
68
18
,487
KE
Y[]
KE
YC
OR
PD
EC
99,9
83
92,3
37
93,1
26
90,7
39
84,4
87
69,6
23
64
,882
65,5
12
62
,973
58,9
31
63
,099
59,1
16
58
,765
57,8
42
50
,858
MTB
[]M
& T
BA
NK
CO
RP
DE
C64
,876
57
,065
55
,146
52
,939
49
,826
47
,262
42,2
97
39
,693
37,7
72
35
,158
41,2
66
39
,911
37,1
00
35
,429
33,1
15
M
I[]
MA
RS
HA
LL &
ILS
LEY
CO
RP
DE
C59
,849
56
,230
46
,213
40
,437
34
,373
45
,668
41,2
14
33
,525
29,0
97
24
,801
35,1
91
34
,084
27,6
74
26
,455
22,2
70
NC
C[]
NA
TIO
NA
L C
ITY
CO
RP
DE
C15
0,37
4
140,
191
14
2,39
7
139,
280
11
3,93
3
114,
260
94
,361
104,
945
98
,949
78,1
54
97
,555
87,2
34
83
,986
85,9
55
63
,930
PN
C[]
PN
C F
INA
NC
IAL
SV
CS
GR
OU
P IN
CD
EC
138,
920
10
1,82
0
91,9
54
79,7
23
68,1
68
67,4
89
49
,545
48,5
05
42
,888
33,4
48
82
,696
66,3
01
60
,275
53,2
69
45
,241
RF
[]R
EG
ION
S F
INA
NC
IAL
CO
RP
DE
C14
1,04
2
143,
369
84
,786
84
,106
48
,598
94
,058
93,4
95
57
,621
56,7
72
31
,730
94,7
75
10
1,22
8
60,3
78
58
,667
32,7
33
TS
FG§
SO
UTH
FIN
AN
CIA
L G
RO
UP
INC
DE
C13
,878
14
,211
14
,319
13
,798
10
,719
10
,087
9,59
0
9,33
2
8,01
1
5,65
9
9,78
9
9,51
7
9,23
4
7,67
1
6,02
9
STS
A§
STE
RLI
NG
FIN
AN
CIA
L C
OR
P/W
AD
EC
12,1
50
9,82
9
7,
559
6,94
2
4,
277
8,94
8
7,01
5
4,88
6
4,25
2
2,90
6
7,67
8
6,74
6
4,80
6
3,86
3
2,45
5
STI
[]S
UN
TRU
ST
BA
NK
S IN
CD
EC
179,
574
18
2,20
2
179,
713
15
8,87
0
125,
393
12
1,03
6
120,
450
11
3,52
7
100,
376
79
,790
117,
843
12
4,02
2
122,
053
10
3,36
1
81,1
90
S
IVB
†S
VB
FIN
AN
CIA
L G
RO
UP
DE
C6,
692
6,08
1
5,
542
5,14
6
4,
465
4,10
4
3,44
0
2,80
7
2,27
1
1,92
5
4,61
1
4,05
8
4,25
3
4,22
0
3,66
7
SN
V†
SY
NO
VU
S F
INA
NC
IAL
CO
RP
DE
C33
,018
31
,855
27
,621
25
,050
21
,633
26
,131
24,3
40
21
,103
19,2
15
16
,239
24,9
60
24
,294
20,7
84
18
,577
15,9
42
TC
B†
TCF
FIN
AN
CIA
L C
OR
PD
EC
15,9
77
14,6
70
13,3
65
12,3
41
11,3
19
12,2
57
11
,275
10,1
34
9,
307
8,
271
9,
577
9,
769
9,
111
7,
962
7,
612
U
MB
F§
UM
B F
INA
NC
IAL
CO
RP
DE
C9,
343
8,91
8
8,
248
7,80
5
7,
749
3,87
1
3,70
9
3,33
3
2,82
7
2,67
9
6,55
1
6,30
9
5,92
1
5,38
4
5,63
6
WB
S†
WE
BS
TER
FIN
AN
CIA
L C
OR
PD
EC
17,2
02
17,0
97
17,8
37
17,0
21
14,5
69
12,2
88
12
,776
12,1
39
11
,563
9,09
1
12,3
54
12
,458
11,6
31
10
,571
8,37
2
WTN
Y§
WH
ITN
EY
HO
LDIN
G C
OR
PD
EC
11,0
27
10,1
86
10,1
09
8,22
3
7,
755
7,49
8
6,97
4
6,47
1
5,57
2
4,82
3
8,58
4
8,43
3
8,60
5
6,61
3
6,15
9
WL
†W
ILM
ING
TON
TR
US
T C
OR
PD
EC
11,4
86
11,1
57
10,2
28
9,51
0
8,
820
8,37
5
8,00
1
7,30
6
6,67
3
6,13
5
7,85
8
8,32
9
7,28
9
6,87
2
6,57
7
ZIO
N[]
ZIO
NS
BA
NC
OR
PO
RA
TIO
ND
EC
52,9
47
46,9
70
42,7
80
31,4
70
28,5
58
38,4
20
34
,050
29,5
32
22
,159
19,4
75
36
,923
34,9
82
32
,642
23,2
92
20
,897
OTH
ER C
OM
PAN
IES
WIT
H S
IGN
IFIC
AN
T C
OM
MER
CIA
L B
AN
KIN
G O
PER
ATI
ON
SB
AC
[]B
AN
K O
F A
ME
RIC
A C
OR
PD
EC
1,71
5,74
6
1,
459,
737
1,29
1,80
3
1,
110,
457
736,
445
86
4,75
6
697,
474
56
5,74
6
513,
211
36
5,30
0
805,
177
69
3,49
7
634,
670
61
8,57
0
414,
113
B
K[]
BA
NK
OF
NE
W Y
OR
K M
ELL
ON
CO
RP
DE
C19
7,65
6
103,
370
10
2,07
4
94,5
29
92,3
97
50,6
04
37
,506
40,3
15
35
,190
34,6
15
11
8,12
5
62,1
46
64
,424
58,7
21
56
,406
CA
TY†
CA
THA
Y G
EN
ER
AL
BA
NC
OR
PD
EC
10,4
03
8,02
7
6,
398
6,09
8
5,
542
6,60
8
5,67
1
4,57
5
3,75
7
3,23
0
6,27
8
5,67
5
4,91
6
4,59
5
4,42
8
C[]
CIT
IGR
OU
P IN
CD
EC
2,18
7,63
1
1,
884,
318
1,49
4,03
7
1,
484,
101
1,26
4,03
2
99
4,84
7
876,
878
71
4,60
1
652,
535
54
6,60
8
894,
071
78
3,77
3
631,
947
57
8,00
9
479,
959
E
WB
C§
EA
ST
WE
ST
BA
NC
OR
P IN
CD
EC
11,8
52
10,8
24
8,27
8
6,
029
4,05
5
8,
751
8,
182
6,
724
5,
080
3,
234
7,
279
7,
235
6,
259
4,
523
3,
313
JPM
[]JP
MO
RG
AN
CH
AS
E &
CO
DE
C1,
562,
147
1,35
1,52
0
1,
198,
942
1,15
7,24
8
77
0,91
2
491,
241
42
0,64
8
377,
858
36
9,09
4
194,
195
74
0,72
8
638,
788
55
4,99
1
521,
456
32
6,49
2
NTR
S[]
NO
RTH
ER
N T
RU
ST
CO
RP
DE
C67
,611
60
,712
53
,414
45
,277
41
,450
25
,192
22,4
69
19
,843
17,8
12
17
,665
51,2
13
43
,820
38,5
20
31
,058
26,2
70
S
TT[]
STA
TE S
TRE
ET
CO
RP
DE
C14
2,54
3
107,
353
97
,968
94
,040
87
,534
15
,784
8,92
8
6,46
4
4,61
1
4,96
0
95,7
89
65
,646
59,6
46
55
,129
47,5
16
U
CB
H§
UC
BH
HO
LDIN
GS
INC
DE
C11
,804
10
,346
7,
961
6,31
6
5,
585
7,75
2
6,57
4
5,77
4
3,99
4
3,73
1
7,78
1
7,20
3
6,26
4
5,21
6
4,48
4
Not
e: D
ata
as o
rigin
ally
repo
rted.
‡S
&P
150
0 in
dex
grou
p. R
egio
nal B
anks
incl
udes
onl
y th
ose
com
pani
es in
the
Reg
iona
l Ban
ks g
roup
of t
he S
&P
150
0 w
ith o
pera
ting
reve
nues
gre
ater
than
$40
0 m
illio
n. []
Com
pany
incl
uded
in th
e S
&P
500
.
†Com
pany
incl
uded
in th
e S
&P
Mid
Cap
400
. §C
ompa
ny in
clud
ed in
the
S&
P S
mal
lCap
600
. #O
f the
follo
win
g ca
lend
ar y
ear.
Tota
l Ass
ets
Tota
l Loa
nsTo
tal D
epos
its
BA
NK
ING
IN
DU
STR
Y S
UR
VE
YD
ata
by S
tand
ard
& P
oor's
Com
pust
at —
A D
ivis
ion
of T
he M
cGra
w-H
ill C
ompa
nies
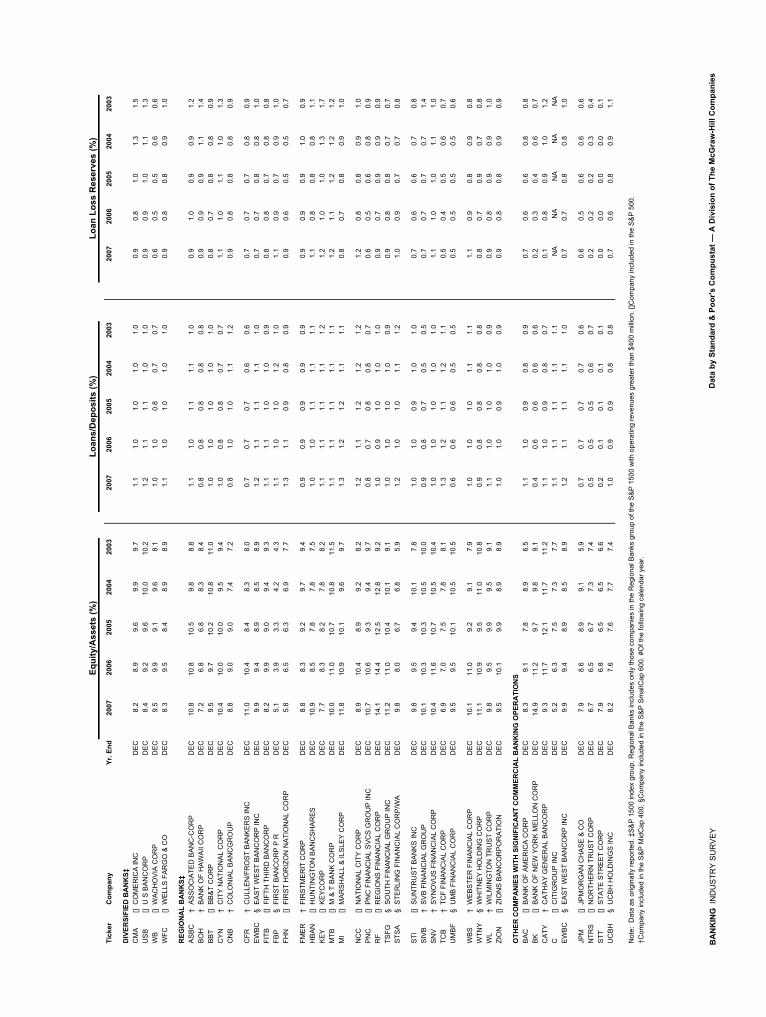
Loan
s/D
epos
its (%
)Lo
an L
oss
Res
erve
s (%
)
Tick
erC
ompa
nyYr
. End
2007
2006
2005
2004
2003
2007
2006
2005
2004
2003
2007
2006
2005
2004
2003
DIV
ERSI
FIED
BA
NK
S‡C
MA
[]C
OM
ER
ICA
INC
DE
C8.
28.
99.
69.
99.
71.
11.
01.
01.
01.
00.
90.
81.
01.
31.
5U
SB
[]U
S B
AN
CO
RP
DE
C8.
49.
29.
610
.010
.21.
21.
11.
11.
01.
00.
90.
91.
01.
11.
3W
B[]
WA
CH
OV
IA C
OR
PD
EC
9.5
9.9
9.1
9.6
8.1
1.0
1.0
0.8
0.7
0.7
0.6
0.5
0.5
0.6
0.6
WFC
[]W
ELL
S F
AR
GO
& C
OD
EC
8.3
9.5
8.4
8.9
8.9
1.1
1.0
1.0
1.0
1.0
0.9
0.8
0.8
0.9
1.0
REG
ION
AL
BA
NK
S‡A
SB
C†
AS
SO
CIA
TED
BA
NC
-CO
RP
DE
C10
.810
.810
.59.
88.
81.
11.
01.
11.
11.
00.
91.
00.
90.
91.
2B
OH
†B
AN
K O
F H
AW
AII
CO
RP
DE
C7.
26.
86.
88.
38.
40.
80.
80.
80.
80.
80.
90.
90.
91.
11.
4B
BT
[]B
B&
T C
OR
PD
EC
9.5
9.7
10.2
10.8
11.0
1.0
1.0
1.0
1.0
1.0
0.8
0.7
0.8
0.8
0.9
CY
N†
CIT
Y N
ATI
ON
AL
CO
RP
DE
C10
.410
.010
.09.
59.
41.
00.
80.
80.
70.
71.
11.
01.
11.
01.
3C
NB
†C
OLO
NIA
L B
AN
CG
RO
UP
DE
C8.
89.
09.
07.
47.
20.
81.
01.
01.
11.
20.
90.
80.
80.
80.
9
CFR
†C
ULL
EN
/FR
OS
T B
AN
KE
RS
INC
DE
C11
.010
.48.
48.
38.
00.
70.
70.
70.
60.
60.
70.
70.
70.
80.
9E
WB
C§
EA
ST
WE
ST
BA
NC
OR
P IN
CD
EC
9.9
9.4
8.9
8.5
8.9
1.2
1.1
1.1
1.1
1.0
0.7
0.7
0.8
0.8
1.0
FITB
[]FI
FTH
TH
IRD
BA
NC
OR
PD
EC
8.2
9.9
9.0
9.4
9.3
1.1
1.1
1.0
1.0
0.9
0.8
0.8
0.7
0.8
0.8
FBP
§FI
RS
T B
AN
CO
RP
P R
DE
C5.
13.
93.
34.
24.
31.
11.
01.
01.
21.
01.
10.
90.
70.
91.
0FH
N[]
FIR
ST
HO
RIZ
ON
NA
TIO
NA
L C
OR
PD
EC
5.8
6.5
6.3
6.9
7.7
1.3
1.1
0.9
0.8
0.9
0.9
0.6
0.5
0.5
0.7
FME
R†
FIR
STM
ER
IT C
OR
PD
EC
8.8
8.3
9.2
9.7
9.4
0.9
0.9
0.9
0.9
0.9
0.9
0.9
0.9
1.0
0.9
HB
AN
[]H
UN
TIN
GTO
N B
AN
CS
HA
RE
SD
EC
10.9
8.5
7.8
7.8
7.5
1.0
1.0
1.1
1.1
1.1
1.1
0.8
0.8
0.8
1.1
KE
Y[]
KE
YC
OR
PD
EC
7.7
8.3
8.2
7.8
8.2
1.1
1.1
1.1
1.1
1.2
1.2
1.0
1.0
1.3
1.7
MTB
[]M
& T
BA
NK
CO
RP
DE
C10
.011
.010
.710
.811
.51.
11.
11.
11.
11.
11.
21.
11.
21.
21.
2M
I[]
MA
RS
HA
LL &
ILS
LEY
CO
RP
DE
C11
.810
.910
.19.
69.
71.
31.
21.
21.
11.
10.
80.
70.
80.
91.
0
NC
C[]
NA
TIO
NA
L C
ITY
CO
RP
DE
C8.
910
.48.
99.
28.
21.
21.
11.
21.
21.
21.
20.
80.
80.
91.
0P
NC
[]P
NC
FIN
AN
CIA
L S
VC
S G
RO
UP
INC
DE
C10
.710
.69.
39.
49.
70.
80.
70.
80.
80.
70.
60.
50.
60.
80.
9R
F[]
RE
GIO
NS
FIN
AN
CIA
L C
OR
PD
EC
14.1
14.4
12.5
12.8
9.2
1.0
0.9
1.0
1.0
1.0
0.9
0.7
0.9
0.9
0.9
TSFG
§S
OU
TH F
INA
NC
IAL
GR
OU
P IN
CD
EC
11.2
11.0
10.4
10.1
9.1
1.0
1.0
1.0
1.0
0.9
0.9
0.8
0.8
0.7
0.7
STS
A§
STE
RLI
NG
FIN
AN
CIA
L C
OR
P/W
AD
EC
9.8
8.0
6.7
6.8
5.9
1.2
1.0
1.0
1.1
1.2
1.0
0.9
0.7
0.7
0.8
STI
[]S
UN
TRU
ST
BA
NK
S IN
CD
EC
9.8
9.5
9.4
10.1
7.8
1.0
1.0
0.9
1.0
1.0
0.7
0.6
0.6
0.7
0.8
SIV
B†
SV
B F
INA
NC
IAL
GR
OU
PD
EC
10.1
10.3
10.3
10.5
10.0
0.9
0.8
0.7
0.5
0.5
0.7
0.7
0.7
0.7
1.4
SN
V†
SY
NO
VU
S F
INA
NC
IAL
CO
RP
DE
C10
.411
.610
.710
.510
.41.
01.
01.
01.
01.
01.
11.
01.
01.
11.
0TC
B†
TCF
FIN
AN
CIA
L C
OR
PD
EC
6.9
7.0
7.5
7.8
8.1
1.3
1.2
1.1
1.2
1.1
0.5
0.4
0.5
0.6
0.7
UM
BF
§U
MB
FIN
AN
CIA
L C
OR
PD
EC
9.5
9.5
10.1
10.5
10.5
0.6
0.6
0.6
0.5
0.5
0.5
0.5
0.5
0.5
0.6
WB
S†
WE
BS
TER
FIN
AN
CIA
L C
OR
PD
EC
10.1
11.0
9.2
9.1
7.9
1.0
1.0
1.0
1.1
1.1
1.1
0.9
0.8
0.9
0.8
WTN
Y§
WH
ITN
EY
HO
LDIN
G C
OR
PD
EC
11.1
10.9
9.5
11.0
10.8
0.9
0.8
0.8
0.8
0.8
0.8
0.7
0.9
0.7
0.8
WL
†W
ILM
ING
TON
TR
US
T C
OR
PD
EC
9.8
9.5
9.9
9.5
9.1
1.1
1.0
1.0
1.0
0.9
0.9
0.8
0.9
0.9
1.0
ZIO
N[]
ZIO
NS
BA
NC
OR
PO
RA
TIO
ND
EC
9.5
10.1
9.9
8.9
8.9
1.0
1.0
0.9
1.0
0.9
0.9
0.8
0.8
0.9
0.9
OTH
ER C
OM
PAN
IES
WIT
H S
IGN
IFIC
AN
T C
OM
MER
CIA
L B
AN
KIN
G O
PER
ATI
ON
SB
AC
[]B
AN
K O
F A
ME
RIC
A C
OR
PD
EC
8.3
9.1
7.8
8.9
6.5
1.1
1.0
0.9
0.8
0.9
0.7
0.6
0.6
0.8
0.8
BK
[]B
AN
K O
F N
EW
YO
RK
ME
LLO
N C
OR
PD
EC
14.9
11.2
9.7
9.8
9.1
0.4
0.6
0.6
0.6
0.6
0.2
0.3
0.4
0.6
0.7
CA
TY†
CA
THA
Y G
EN
ER
AL
BA
NC
OR
PD
EC
9.3
11.7
12.1
11.7
11.2
1.1
1.0
0.9
0.8
0.7
0.1
0.8
0.9
1.0
1.2
C[]
CIT
IGR
OU
P IN
CD
EC
5.2
6.3
7.5
7.3
7.7
1.1
1.1
1.1
1.1
1.1
NA
NA
NA
NA
NA
EW
BC
§E
AS
T W
ES
T B
AN
CO
RP
INC
DE
C9.
99.
48.
98.
58.
91.
21.
11.
11.
11.
00.
70.
70.
80.
81.
0
JPM
[]JP
MO
RG
AN
CH
AS
E &
CO
DE
C7.
98.
68.
99.
15.
90.
70.
70.
70.
70.
60.
60.
50.
60.
60.
6N
TRS
[]N
OR
THE
RN
TR
US
T C
OR
PD
EC
6.7
6.5
6.7
7.3
7.4
0.5
0.5
0.5
0.6
0.7
0.2
0.2
0.2
0.3
0.4
STT
[]S
TATE
STR
EE
T C
OR
PD
EC
7.9
6.8
6.5
6.5
6.6
0.2
0.1
0.1
0.1
0.1
0.0
0.0
0.0
0.0
0.1
UC
BH
§U
CB
H H
OLD
ING
S IN
CD
EC
8.2
7.6
7.6
7.7
7.4
1.0
0.9
0.9
0.8
0.8
0.7
0.6
0.8
0.9
1.1
Not
e: D
ata
as o
rigin
ally
repo
rted.
‡S
&P
150
0 in
dex
grou
p. R
egio
nal B
anks
incl
udes
onl
y th
ose
com
pani
es in
the
Reg
iona
l Ban
ks g
roup
of t
he S
&P
150
0 w
ith o
pera
ting
reve
nues
gre
ater
than
$40
0 m
illio
n. []
Com
pany
incl
uded
in th
e S
&P
500
.
†Com
pany
incl
uded
in th
e S
&P
Mid
Cap
400
. §C
ompa
ny in
clud
ed in
the
S&
P S
mal
lCap
600
. #O
f the
follo
win
g ca
lend
ar y
ear.
Equi
ty/A
sset
s (%
)
BA
NK
ING
IN
DU
STR
Y S
UR
VE
YD
ata
by S
tand
ard
& P
oor's
Com
pust
at —
A D
ivis
ion
of T
he M
cGra
w-H
ill C
ompa
nies
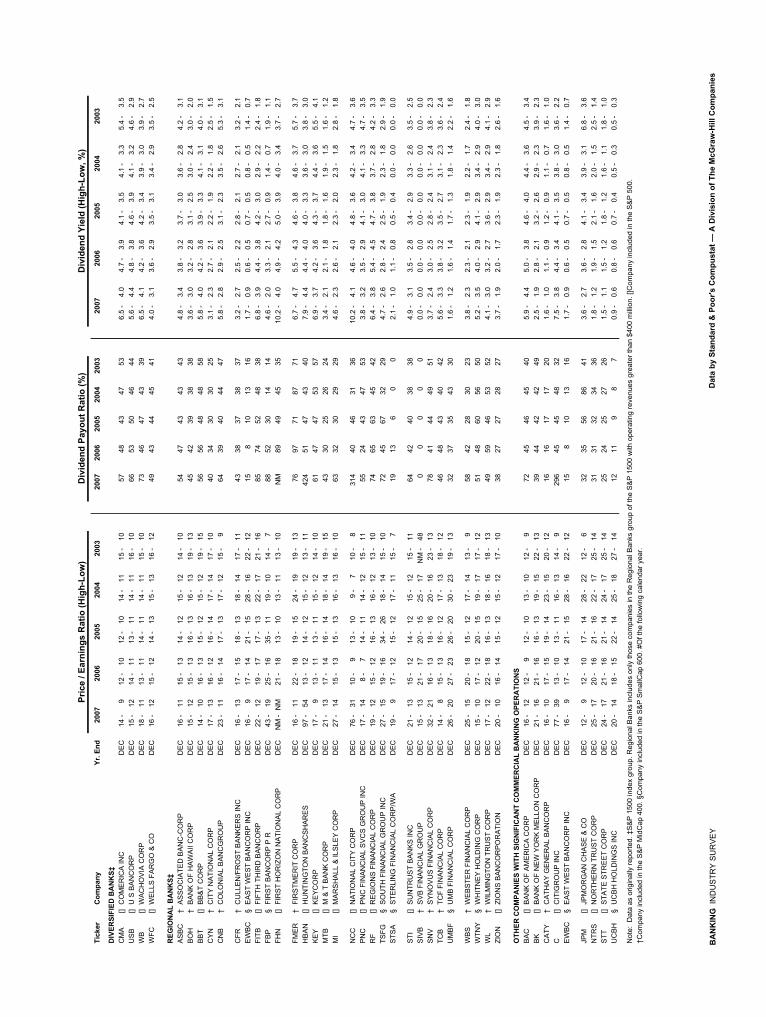
Pric
e / E
arni
ngs
Rat
io (H
igh-
Low
)D
ivid
end
Payo
ut R
atio
(%)
Div
iden
d Yi
eld
(Hig
h-Lo
w, %
)Ti
cker
Com
pany
Yr. E
nd20
0720
0620
0520
0420
0320
0720
0620
0520
0420
03
DIV
ERSI
FIED
BA
NK
S‡C
MA
[]C
OM
ER
ICA
INC
DE
C14
-9
12-
1012
-10
14-
1115
-10
5748
4347
536.
5-
4.0
4.7
-3.
94.
1-
3.5
4.1
-3.
35.
4-
3.5
US
B[]
U S
BA
NC
OR
PD
EC
15-
1214
-11
13-
1114
-11
16-
1066
5350
4644
5.6
-4.
44.
8-
3.8
4.6
-3.
94.
1-
3.2
4.6
-2.
9W
B[]
WA
CH
OV
IA C
OR
PD
EC
18-
1113
-11
14-
1114
-11
15-
1073
4647
4339
6.5
-4.
14.
2-
3.6
4.2
-3.
43.
9-
3.0
3.9
-2.
7W
FC[]
WE
LLS
FA
RG
O &
CO
DE
C16
-12
15-
1214
-13
15-
1316
-12
4943
4445
414.
0-
3.1
3.6
-2.
93.
5-
3.1
3.4
-2.
93.
5-
2.5
REG
ION
AL
BA
NK
S‡A
SB
C†
AS
SO
CIA
TED
BA
NC
-CO
RP
DE
C16
-11
15-
1314
-12
15-
1214
-10
5447
4343
434.
8-
3.4
3.8
-3.
23.
7-
3.0
3.6
-2.
84.
2-
3.1
BO
H†
BA
NK
OF
HA
WA
II C
OR
PD
EC
15-
1215
-13
16-
1316
-13
19-
1345
4239
3838
3.6
-3.
03.
2-
2.8
3.1
-2.
53.
0-
2.4
3.0
-2.
0B
BT
[]B
B&
T C
OR
PD
EC
14-
1016
-13
15-
1215
-12
19-
1556
5648
4858
5.8
-4.
04.
2-
3.6
3.9
-3.
34.
1-
3.1
4.0
-3.
1C
YN
†C
ITY
NA
TIO
NA
L C
OR
PD
EC
17-
1316
-12
16-
1417
-14
17-
1040
3430
3025
3.1
-2.
32.
7-
2.1
2.2
-1.
92.
2-
1.8
2.5
-1.
5C
NB
†C
OLO
NIA
L B
AN
CG
RO
UP
DE
C23
-11
16-
1417
-13
17-
1215
-9
6439
4044
475.
8-
2.8
2.9
-2.
53.
1-
2.3
3.5
-2.
65.
3-
3.1
C
FR†
CU
LLE
N/F
RO
ST
BA
NK
ER
S IN
CD
EC
16-
1317
-15
18-
1318
-14
17-
1143
3837
3837
3.2
-2.
72.
5-
2.2
2.8
-2.
12.
7-
2.1
3.2
-2.
1E
WB
C§
EA
ST
WE
ST
BA
NC
OR
P IN
CD
EC
16-
917
-14
21-
1528
-16
22-
1215
810
1316
1.7
-0.
90.
6-
0.5
0.7
-0.
50.
8-
0.5
1.4
-0.
7FI
TB[]
FIFT
H T
HIR
D B
AN
CO
RP
DE
C22
-12
19-
1717
-13
22-
1721
-16
8574
5248
386.
8-
3.9
4.4
-3.
84.
2-
3.0
2.9
-2.
22.
4-
1.8
FBP
§FI
RS
T B
AN
CO
RP
P R
DE
C43
-19
25-
1635
-11
19-
1014
-7
8852
3014
144.
6-
2.0
3.3
-2.
12.
7-
0.9
1.4
-0.
71.
9-
1.1
FHN
[]FI
RS
T H
OR
IZO
N N
ATI
ON
AL
CO
RP
DE
CN
M-
NM
21-
1813
-10
13-
1113
-10
NM
8949
4535
10.2
-4.
04.
9-
4.2
5.0
-3.
94.
0-
3.4
3.7
-2.
7
FME
R†
FIR
STM
ER
IT C
OR
PD
EC
16-
1122
-18
19-
1524
-19
19-
1376
9771
8771
6.7
-4.
75.
5-
4.3
4.6
-3.
84.
6-
3.7
5.7
-3.
7H
BA
N[]
HU
NTI
NG
TON
BA
NC
SH
AR
ES
DE
C97
-54
13-
1214
-12
15-
1213
-11
424
5147
4340
7.9
-4.
44.
4-
4.0
4.0
-3.
33.
6-
3.0
3.8
-3.
0K
EY
[]K
EY
CO
RP
DE
C17
-9
13-
1113
-11
15-
1214
-10
6147
4753
576.
9-
3.7
4.2
-3.
64.
3-
3.7
4.4
-3.
65.
5-
4.1
MTB
[]M
& T
BA
NK
CO
RP
DE
C21
-13
17-
1416
-14
18-
1419
-15
4330
2526
243.
4-
2.1
2.1
-1.
81.
8-
1.6
1.9
-1.
51.
6-
1.2
MI
[]M
AR
SH
ALL
& IL
SLE
Y C
OR
PD
EC
27-
1415
-13
15-
1316
-13
16-
1063
3230
2929
4.6
-2.
32.
6-
2.1
2.3
-2.
02.
3-
1.8
2.8
-1.
8
NC
C[]
NA
TIO
NA
L C
ITY
CO
RP
DE
C76
-31
10-
913
-10
9-
710
-8
314
4046
3136
10.2
-4.
14.
6-
4.0
4.8
-3.
64.
2-
3.4
4.7
-3.
6P
NC
[]P
NC
FIN
AN
CIA
L S
VC
S G
RO
UP
INC
DE
C17
-14
8-
714
-11
14-
1215
-11
5524
4347
533.
8-
3.2
3.5
-2.
94.
1-
3.0
4.1
-3.
34.
7-
3.5
RF
[]R
EG
ION
S F
INA
NC
IAL
CO
RP
DE
C19
-12
15-
1216
-13
16-
1213
-10
7465
6345
426.
4-
3.8
5.4
-4.
54.
7-
3.8
3.7
-2.
84.
2-
3.3
TSFG
§S
OU
TH F
INA
NC
IAL
GR
OU
P IN
CD
EC
27-
1519
-16
34-
2618
-14
15-
1072
4567
3229
4.7
-2.
62.
8-
2.4
2.5
-1.
92.
3-
1.8
2.9
-1.
9S
TSA
§S
TER
LIN
G F
INA
NC
IAL
CO
RP
/WA
DE
C19
-9
17-
1215
-12
17-
1115
-7
1913
60
02.
1-
1.0
1.1
-0.
80.
5-
0.4
0.0
-0.
00.
0-
0.0
STI
[]S
UN
TRU
ST
BA
NK
S IN
CD
EC
21-
1315
-12
14-
1215
-12
15-
1164
4240
3838
4.9
-3.
13.
5-
2.8
3.4
-2.
93.
3-
2.6
3.5
-2.
5S
IVB
†S
VB
FIN
AN
CIA
L G
RO
UP
DE
C15
-13
21-
1720
-15
25-
17N
M-
480
00
00
0.0
-0.
00.
0-
0.0
0.0
-0.
00.
0-
0.0
0.0
-0.
0S
NV
†S
YN
OV
US
FIN
AN
CIA
L C
OR
PD
EC
32-
2116
-13
18-
1620
-16
23-
1378
4144
4951
3.7
-2.
43.
0-
2.5
2.8
-2.
43.
1-
2.4
3.8
-2.
3TC
B†
TCF
FIN
AN
CIA
L C
OR
PD
EC
14-
815
-13
16-
1217
-13
18-
1246
4843
4042
5.6
-3.
33.
8-
3.2
3.5
-2.
73.
1-
2.3
3.6
-2.
4U
MB
F§
UM
B F
INA
NC
IAL
CO
RP
DE
C26
-20
27-
2326
-20
30-
2319
-13
3237
3543
301.
6-
1.2
1.6
-1.
41.
7-
1.3
1.8
-1.
42.
2-
1.6
WB
S†
WE
BS
TER
FIN
AN
CIA
L C
OR
PD
EC
25-
1520
-18
15-
1217
-14
13-
958
4228
3023
3.8
-2.
32.
3-
2.1
2.3
-1.
92.
2-
1.7
2.4
-1.
8W
TNY
§W
HIT
NE
Y H
OLD
ING
CO
RP
DE
C15
-10
17-
1220
-15
19-
1717
-12
5148
6056
505.
2-
3.5
4.0
-2.
94.
1-
2.9
3.4
-2.
94.
0-
3.0
WL
†W
ILM
ING
TON
TR
US
T C
OR
PD
EC
17-
1222
-18
16-
1318
-16
18-
1349
5946
5352
4.1
-3.
03.
2-
2.7
3.6
-2.
93.
4-
2.9
4.1
-2.
9ZI
ON
[]ZI
ON
S B
AN
CO
RP
OR
ATI
ON
DE
C20
-10
16-
1415
-12
15-
1217
-10
3827
2728
273.
7-
1.9
2.0
-1.
72.
3-
1.9
2.3
-1.
82.
6-
1.6
OTH
ER C
OM
PAN
IES
WIT
H S
IGN
IFIC
AN
T C
OM
MER
CIA
L B
AN
KIN
G O
PER
ATI
ON
SB
AC
[]B
AN
K O
F A
ME
RIC
A C
OR
PD
EC
16-
1212
-9
12-
1013
-10
12-
972
4546
4540
5.9
-4.
45.
0-
3.8
4.6
-4.
04.
4-
3.6
4.5
-3.
4B
K[]
BA
NK
OF
NE
W Y
OR
K M
ELL
ON
CO
RP
DE
C21
-16
21-
1616
-13
19-
1522
-13
3944
4242
492.
5-
1.9
2.8
-2.
13.
2-
2.6
2.9
-2.
33.
9-
2.3
CA
TY†
CA
THA
Y G
EN
ER
AL
BA
NC
OR
PD
EC
16-
1017
-15
19-
1423
-15
20-
1216
1617
1720
1.6
-1.
01.
1-
0.9
1.2
-0.
91.
1-
0.7
1.6
-1.
0C
[]C
ITIG
RO
UP
INC
DE
C77
-39
13-
1013
-11
16-
1314
-9
296
4545
4832
7.5
-3.
84.
4-
3.4
4.1
-3.
53.
8-
3.0
3.6
-2.
2E
WB
C§
EA
ST
WE
ST
BA
NC
OR
P IN
CD
EC
16-
917
-14
21-
1528
-16
22-
1215
810
1316
1.7
-0.
90.
6-
0.5
0.7
-0.
50.
8-
0.5
1.4
-0.
7
JPM
[]JP
MO
RG
AN
CH
AS
E &
CO
DE
C12
-9
12-
1017
-14
28-
2212
-6
3235
5686
413.
6-
2.7
3.6
-2.
84.
1-
3.4
3.9
-3.
16.
8-
3.6
NTR
S[]
NO
RTH
ER
N T
RU
ST
CO
RP
DE
C25
-17
20-
1621
-16
22-
1725
-14
3131
3234
361.
8-
1.2
1.9
-1.
52.
1-
1.6
2.0
-1.
52.
5-
1.4
STT
[]S
TATE
STR
EE
T C
OR
PD
EC
24-
1721
-16
21-
1424
-17
25-
1425
2425
2726
1.5
-1.
11.
5-
1.2
1.8
-1.
21.
6-
1.1
1.8
-1.
0U
CB
H§
UC
BH
HO
LDIN
GS
INC
DE
C20
-14
18-
1522
-14
25-
1827
-14
1211
98
70.
9-
0.6
0.8
-0.
60.
7-
0.4
0.5
-0.
30.
5-
0.3
Not
e: D
ata
as o
rigin
ally
repo
rted.
‡S
&P
150
0 in
dex
grou
p. R
egio
nal B
anks
incl
udes
onl
y th
ose
com
pani
es in
the
Reg
iona
l Ban
ks g
roup
of t
he S
&P
150
0 w
ith o
pera
ting
reve
nues
gre
ater
than
$40
0 m
illio
n. []
Com
pany
incl
uded
in th
e S
&P
500
.
†Com
pany
incl
uded
in th
e S
&P
Mid
Cap
400
. §C
ompa
ny in
clud
ed in
the
S&
P S
mal
lCap
600
. #O
f the
follo
win
g ca
lend
ar y
ear.
2003
2007
2006
2005
2004
BA
NK
ING
IN
DU
STR
Y S
UR
VE
YD
ata
by S
tand
ard
& P
oor's
Com
pust
at —
A D
ivis
ion
of T
he M
cGra
w-H
ill C
ompa
nies
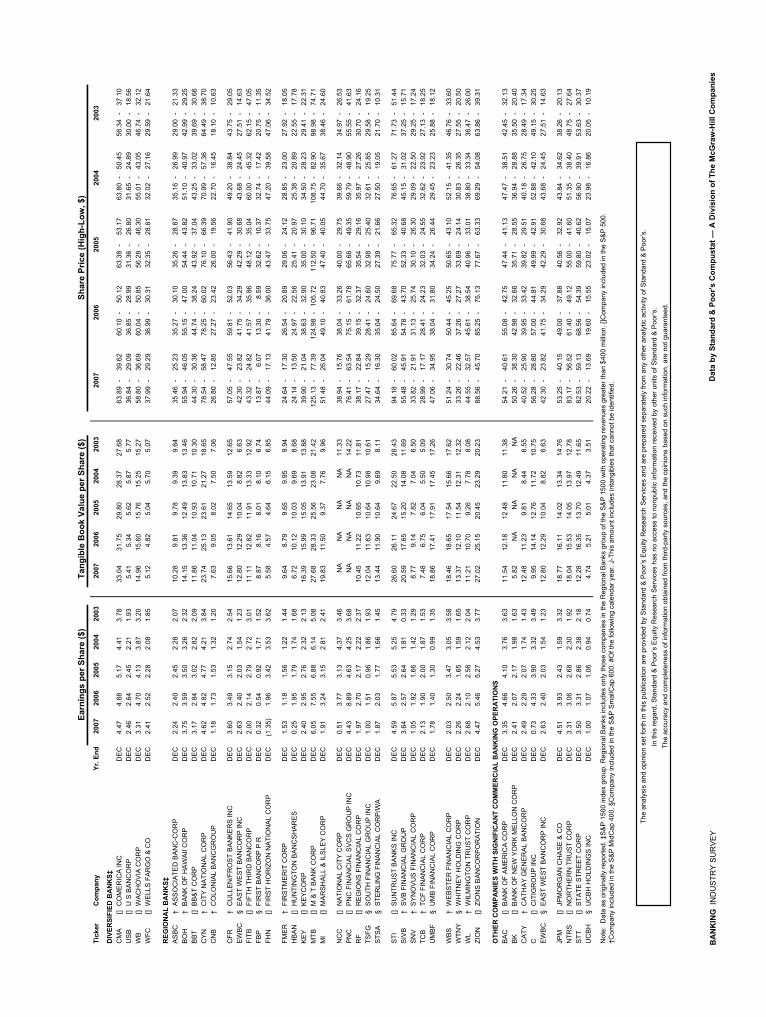
Earn
ings
per
Sha
re ($
)Ta
ngib
le B
ook
Valu
e pe
r Sha
re ($
) Sh
are
Pric
e (H
igh-
Low
, $)
Tick
erC
ompa
nyYr
. End
2007
2006
2005
2004
2003
2007
2006
2005
2004
2003
2007
2006
2005
2004
2003
DIV
ERSI
FIED
BA
NK
S‡C
MA
[]C
OM
ER
ICA
INC
DE
C4.
474.
885.
174.
413.
7833
.04
31.7
529
.80
28.3
727
.68
63.8
9-
39.6
260
.10
-50
.12
63.3
8-
53.1
763
.80
-50
.45
56.3
4-
37.1
0U
SB
[]U
S B
AN
CO
RP
DE
C2.
462.
642.
452.
211.
935.
415.
345.
625.
875.
7736
.84
-29
.09
36.8
5-
28.9
931
.36
-26
.80
31.6
5-
24.8
930
.00
-18
.56
WB
[]W
AC
HO
VIA
CO
RP
DE
C3.
314.
704.
133.
873.
2014
.96
15.6
015
.76
15.2
515
.27
58.8
0-
36.6
960
.04
-50
.85
56.2
8-
46.3
055
.01
-43
.05
46.7
4-
32.1
2W
FC[]
WE
LLS
FA
RG
O &
CO
DE
C2.
412.
522.
282.
081.
855.
124.
825.
045.
705.
0737
.99
-29
.29
36.9
9-
30.3
132
.35
-28
.81
32.0
2-
27.1
629
.59
-21
.64
REG
ION
AL
BA
NK
S‡A
SB
C†
AS
SO
CIA
TED
BA
NC
-CO
RP
DE
C2.
242.
402.
452.
282.
0710
.28
9.81
9.78
9.39
9.64
35.4
6-
25.2
335
.27
-30
.10
35.2
6-
28.8
735
.16
-26
.99
29.0
0-
21.3
3B
OH
†B
AN
K O
F H
AW
AII
CO
RP
DE
C3.
753.
593.
503.
262.
3214
.15
13.3
612
.49
13.8
313
.46
55.9
4-
46.0
555
.15
-47
.00
54.4
4-
43.8
251
.10
-40
.97
42.9
9-
29.2
5B
BT
[]B
B&
T C
OR
PD
EC
3.17
2.84
3.02
2.82
2.09
11.8
611
.04
10.9
310
.71
10.3
044
.30
-30
.36
44.7
4-
38.2
443
.92
-37
.04
43.2
5-
33.0
239
.69
-30
.66
CY
N†
CIT
Y N
ATI
ON
AL
CO
RP
DE
C4.
624.
824.
774.
213.
8423
.74
25.1
323
.61
21.2
718
.65
78.5
4-
58.4
778
.25
-60
.02
76.1
0-
66.3
970
.99
-57
.36
64.4
9-
38.7
0C
NB
†C
OLO
NIA
L B
AN
CG
RO
UP
DE
C1.
181.
731.
531.
321.
207.
639.
058.
027.
507.
0626
.80
-12
.85
27.2
7-
23.4
226
.00
-19
.56
22.7
0-
16.4
518
.10
-10
.63
CFR
†C
ULL
EN
/FR
OS
T B
AN
KE
RS
INC
DE
C3.
603.
493.
152.
742.
5415
.66
13.6
114
.65
13.5
912
.65
57.0
5-
47.5
559
.81
-52
.03
56.4
3-
41.9
049
.20
-38
.84
43.7
5-
29.0
5E
WB
C§
EA
ST
WE
ST
BA
NC
OR
P IN
CD
EC
2.63
2.40
2.03
1.54
1.23
12.8
012
.29
10.0
48.
826.
6342
.30
-23
.82
41.7
5-
34.2
942
.29
-30
.68
43.6
8-
24.4
527
.51
-14
.63
FITB
[]FI
FTH
TH
IRD
BA
NC
OR
PD
EC
2.00
2.14
2.79
2.72
3.01
11.1
112
.82
11.9
113
.33
12.9
243
.32
-24
.82
41.5
7-
35.8
648
.12
-35
.04
60.0
0-
45.3
262
.15
-47
.05
FBP
§FI
RS
T B
AN
CO
RP
P R
DE
C0.
320.
540.
921.
711.
528.
878.
168.
018.
106.
7413
.87
-6.
0713
.30
-8.
5932
.62
-10
.37
32.7
4-
17.4
220
.75
-11
.35
FHN
[]FI
RS
T H
OR
IZO
N N
ATI
ON
AL
CO
RP
DE
C(1
.35)
1.96
3.42
3.53
3.62
5.58
4.57
4.64
6.15
6.85
44.0
9-
17.1
341
.79
-36
.00
43.4
7-
33.7
547
.20
-39
.58
47.0
6-
34.5
2
FME
R†
FIR
STM
ER
IT C
OR
PD
EC
1.53
1.18
1.56
1.22
1.44
9.64
8.79
9.65
9.95
9.94
24.6
4-
17.3
026
.54
-20
.89
29.0
6-
24.1
228
.85
-23
.00
27.9
2-
18.0
5H
BA
N[]
HU
NTI
NG
TON
BA
NC
SH
AR
ES
DE
C0.
251.
951.
791.
741.
686.
7210
.12
10.0
39.
698.
6824
.14
-13
.50
24.9
7-
22.5
625
.41
-20
.97
25.3
8-
20.8
922
.55
-17
.78
KE
Y[]
KE
YC
OR
PD
EC
2.40
2.95
2.76
2.32
2.13
16.3
915
.99
15.0
513
.91
13.8
839
.90
-21
.04
38.6
3-
32.9
035
.00
-30
.10
34.5
0-
28.2
329
.41
-22
.31
MTB
[]M
& T
BA
NK
CO
RP
DE
C6.
057.
556.
886.
145.
0827
.68
28.3
325
.56
23.0
821
.42
125.
13-
77.3
912
4.98
-10
5.72
112.
50-
96.7
110
8.75
-82
.90
98.9
8-
74.7
1M
I[]
MA
RS
HA
LL &
ILS
LEY
CO
RP
DE
C1.
913.
243.
152.
812.
4119
.83
11.5
09.
377.
769.
9651
.48
-26
.04
49.1
0-
40.8
347
.40
-40
.05
44.7
0-
35.6
738
.46
-24
.60
NC
C[]
NA
TIO
NA
L C
ITY
CO
RP
DE
C0.
513.
773.
134.
373.
46N
AN
AN
AN
A11
.33
38.9
4-
15.7
638
.04
-33
.26
40.0
0-
29.7
539
.66
-32
.14
34.9
7-
26.5
3P
NC
[]P
NC
FIN
AN
CIA
L S
VC
S G
RO
UP
INC
DE
C4.
438.
894.
634.
253.
68N
AN
AN
AN
A14
.22
76.4
1-
63.5
475
.15
-61
.78
65.6
6-
49.3
559
.79
-48
.90
55.5
5-
41.6
3R
F[]
RE
GIO
NS
FIN
AN
CIA
L C
OR
PD
EC
1.97
2.70
2.17
2.22
2.37
10.4
511
.22
10.6
510
.73
11.8
138
.17
-22
.84
39.1
5-
32.3
735
.54
-29
.16
35.9
7-
27.2
630
.70
-24
.16
TSFG
§S
OU
TH F
INA
NC
IAL
GR
OU
P IN
CD
EC
1.00
1.51
0.96
1.86
1.93
12.0
411
.63
10.6
410
.98
10.6
127
.47
-15
.29
28.4
1-
24.6
032
.98
-25
.40
32.6
1-
25.8
529
.58
-19
.25
STS
A§
STE
RLI
NG
FIN
AN
CIA
L C
OR
P/W
AD
EC
1.87
2.03
1.77
1.66
1.45
13.4
411
.90
10.6
49.
698.
1134
.64
-16
.30
35.0
4-
24.5
027
.39
-21
.66
27.5
0-
19.0
521
.70
-10
.31
STI
[]S
UN
TRU
ST
BA
NK
S IN
CD
EC
4.59
5.87
5.53
5.25
4.79
26.6
026
.11
24.6
722
.50
28.4
394
.18
-60
.02
85.6
4-
69.6
875
.77
-65
.32
76.6
5-
61.2
771
.73
-51
.44
SIV
B†
SV
B F
INA
NC
IAL
GR
OU
PD
EC
3.64
2.57
2.64
1.81
0.33
20.5
917
.65
15.2
014
.08
11.6
955
.48
-45
.91
54.7
8-
43.7
052
.33
-40
.68
45.1
5-
31.0
237
.25
-15
.71
SN
V†
SY
NO
VU
S F
INA
NC
IAL
CO
RP
DE
C1.
051.
921.
661.
421.
298.
779.
147.
827.
046.
5033
.82
-21
.91
31.1
3-
25.7
430
.10
-26
.30
29.0
9-
22.5
029
.25
-17
.24
TCB
†TC
F FI
NA
NC
IAL
CO
RP
DE
C2.
131.
902.
001.
871.
537.
486.
756.
045.
505.
0928
.99
-17
.17
28.4
1-
24.2
332
.03
-24
.55
32.6
2-
23.9
227
.13
-18
.25
UM
BF
§U
MB
FIN
AN
CIA
L C
OR
PD
EC
1.78
1.40
1.30
0.99
1.35
18.8
617
.41
17.9
117
.45
17.2
647
.06
-34
.95
38.0
4-
31.8
034
.24
-26
.44
29.4
5-
23.2
325
.88
-18
.12
WB
S†
WE
BS
TER
FIN
AN
CIA
L C
OR
PD
EC
2.03
2.50
3.47
3.05
3.58
18.4
618
.65
17.5
415
.66
17.6
251
.24
-30
.74
50.4
4-
45.2
550
.65
-43
.10
52.1
5-
41.3
546
.76
-33
.60
WTN
Y§
WH
ITN
EY
HO
LDIN
G C
OR
PD
EC
2.26
2.24
1.65
1.59
1.65
13.3
712
.10
11.5
412
.31
12.3
233
.26
-22
.46
37.2
6-
27.2
733
.69
-24
.14
30.8
3-
26.3
527
.55
-20
.50
WL
†W
ILM
ING
TON
TR
US
T C
OR
PD
EC
2.68
2.10
2.56
2.12
2.04
11.2
110
.70
9.26
7.78
8.08
44.5
5-
32.5
745
.61
-38
.54
40.9
6-
33.0
138
.80
-33
.34
36.4
7-
26.0
0ZI
ON
[]ZI
ON
S B
AN
CO
RP
OR
ATI
ON
DE
C4.
475.
465.
274.
533.
7727
.02
25.1
520
.45
23.2
920
.23
88.5
6-
45.7
085
.25
-75
.13
77.6
7-
63.3
369
.29
-54
.08
63.8
6-
39.3
1
OTH
ER C
OM
PAN
IES
WIT
H S
IGN
IFIC
AN
T C
OM
MER
CIA
L B
AN
KIN
G O
PER
ATI
ON
SB
AC
[]B
AN
K O
F A
ME
RIC
A C
OR
PD
EC
3.35
4.66
4.10
3.76
3.63
11.5
412
.18
12.4
811
.80
11.3
854
.21
-40
.61
55.0
8-
42.7
547
.44
-41
.13
47.4
7-
38.5
142
.45
-32
.13
BK
[]B
AN
K O
F N
EW
YO
RK
ME
LLO
N C
OR
PD
EC
2.41
2.07
2.17
1.98
1.63
5.82
NA
NA
NA
NA
50.2
6-
38.3
042
.98
-32
.66
35.7
1-
28.5
536
.94
-28
.88
35.5
0-
20.4
0C
ATY
†C
ATH
AY
GE
NE
RA
L B
AN
CO
RP
DE
C2.
492.
292.
071.
741.
4312
.48
11.2
39.
818.
446.
5540
.52
-25
.90
39.9
5-
33.4
239
.82
-29
.51
40.1
8-
26.7
528
.49
-17
.34
C[]
CIT
IGR
OU
P IN
CD
EC
0.73
4.33
3.90
3.32
3.49
9.95
14.1
412
.76
11.7
210
.75
56.2
8-
28.8
057
.00
-44
.81
49.9
9-
42.9
152
.88
-42
.10
49.1
5-
30.2
5E
WB
C§
EA
ST
WE
ST
BA
NC
OR
P IN
CD
EC
2.63
2.40
2.03
1.54
1.23
12.8
012
.29
10.0
48.
826.
6342
.30
-23
.82
41.7
5-
34.2
942
.29
-30
.68
43.6
8-
24.4
527
.51
-14
.63
JPM
[]JP
MO
RG
AN
CH
AS
E &
CO
DE
C4.
513.
932.
431.
593.
3218
.77
16.1
114
.02
13.3
414
.76
53.2
5-
40.1
549
.00
-37
.88
40.5
6-
32.9
243
.84
-34
.62
38.2
6-
20.1
3N
TRS
[]N
OR
THE
RN
TR
US
T C
OR
PD
EC
3.31
3.06
2.68
2.30
1.92
18.0
415
.53
14.0
513
.97
12.7
883
.17
-56
.52
61.4
0-
49.1
255
.00
-41
.60
51.3
5-
38.4
048
.75
-27
.64
STT
[]S
TATE
STR
EE
T C
OR
PD
EC
3.50
3.31
2.86
2.38
2.18
12.2
816
.35
13.7
012
.49
11.6
582
.53
-59
.13
68.5
6-
54.3
959
.80
-40
.62
56.9
0-
39.9
153
.63
-30
.37
UC
BH
§U
CB
H H
OLD
ING
S IN
CD
EC
1.00
1.07
1.06
0.94
0.74
4.74
5.21
5.01
4.37
3.51
20.2
2-
13.6
919
.60
-15
.55
23.0
2-
15.0
723
.98
-16
.86
20.0
5-
10.1
9
Not
e: D
ata
as o
rigin
ally
repo
rted.
‡S
&P
150
0 in
dex
grou
p. R
egio
nal B
anks
incl
udes
onl
y th
ose
com
pani
es in
the
Reg
iona
l Ban
ks g
roup
of t
he S
&P
150
0 w
ith o
pera
ting
reve
nues
gre
ater
than
$40
0 m
illio
n. []
Com
pany
incl
uded
in th
e S
&P
500
.
†Com
pany
incl
uded
in th
e S
&P
Mid
Cap
400
. §C
ompa
ny in
clud
ed in
the
S&
P S
mal
lCap
600
. #O
f the
follo
win
g ca
lend
ar y
ear.
J-Th
is a
mou
nt in
clud
es in
tang
ible
s th
at c
anno
t be
iden
tifie
d.
The
anal
ysis
and
opi
nion
set
forth
in th
is p
ublic
atio
n ar
e pr
ovid
ed b
y S
tand
ard
& P
oor’s
Equ
ity R
esea
rch
Ser
vice
s an
d ar
e pr
epar
ed s
epar
atel
y fro
m a
ny o
ther
ana
lytic
act
ivity
of S
tand
ard
& P
oor’s
.In
this
rega
rd, S
tand
ard
& P
oor’s
Equ
ity R
esea
rch
Ser
vice
s ha
s no
acc
ess
to n
onpu
blic
info
rmat
ion
rece
ived
by
othe
r uni
ts o
f Sta
ndar
d &
Poo
r’s.
The
accu
racy
and
com
plet
enes
s of
info
rmat
ion
obta
ined
from
third
-par
ty s
ourc
es, a
nd th
e op
inio
ns b
ased
on
such
info
rmat
ion,
are
not
gua
rant
eed.
BA
NK
ING
IN
DU
STR
Y S
UR
VE
YD
ata
by S
tand
ard
& P
oor's
Com
pust
at —
A D
ivis
ion
of T
he M
cGra
w-H
ill C
ompa
nies