industrials insight - raymond james financial · pdf filethe vanguard group, inc.: 8.0% ......
TRANSCRIPT

INDUSTRIALS INSIGHT
©2017 Raymond James & Associates, Inc., member New York Stock Exchange/SIPC
INDUSTRIALS INSIGHT
2
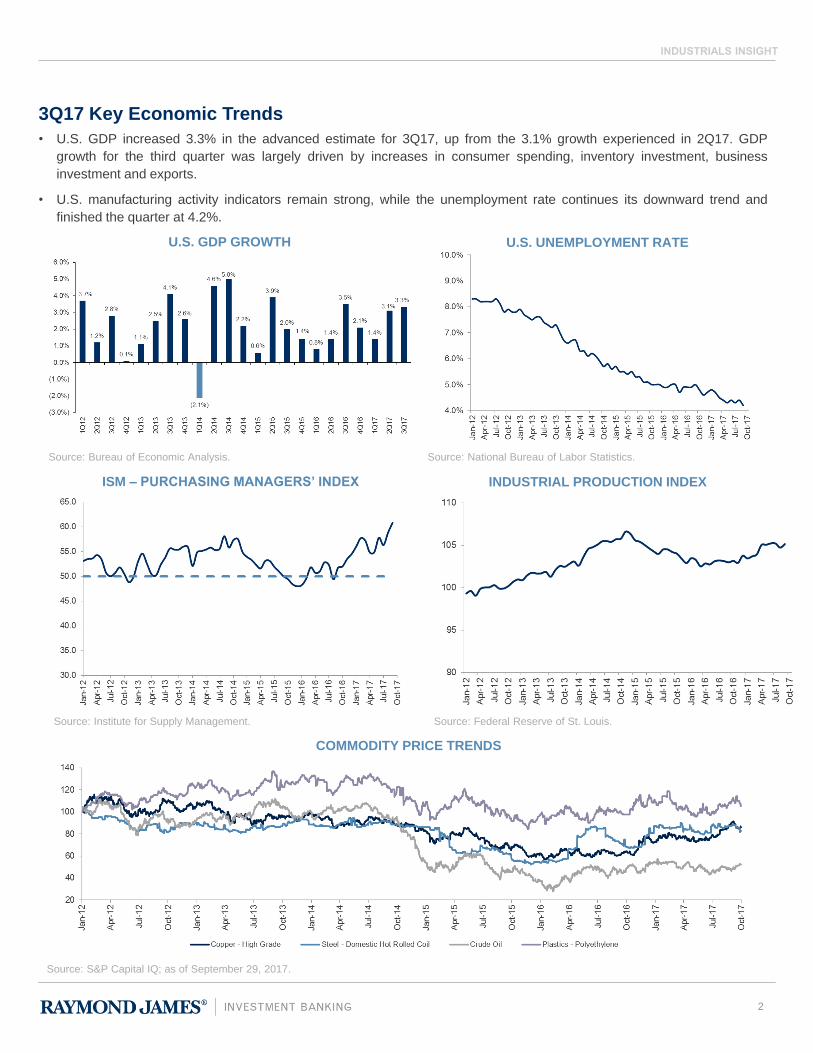
3Q17 Key Economic Trends
U.S. GDP GROWTH U.S. UNEMPLOYMENT RATE
Source: Bureau of Economic Analysis. Source: National Bureau of Labor Statistics.
ISM – PURCHASING MANAGERS’ INDEX INDUSTRIAL PRODUCTION INDEX
COMMODITY PRICE TRENDS
Source: Institute for Supply Management. Source: Federal Reserve of St. Louis.
Source: S&P Capital IQ; as of September 29, 2017.
• U.S. GDP increased 3.3% in the advanced estimate for 3Q17, up from the 3.1% growth experienced in 2Q17. GDP
growth for the third quarter was largely driven by increases in consumer spending, inventory investment, business
investment and exports.
• U.S. manufacturing activity indicators remain strong, while the unemployment rate continues its downward trend and
finished the quarter at 4.2%.
INDUSTRIALS INSIGHT
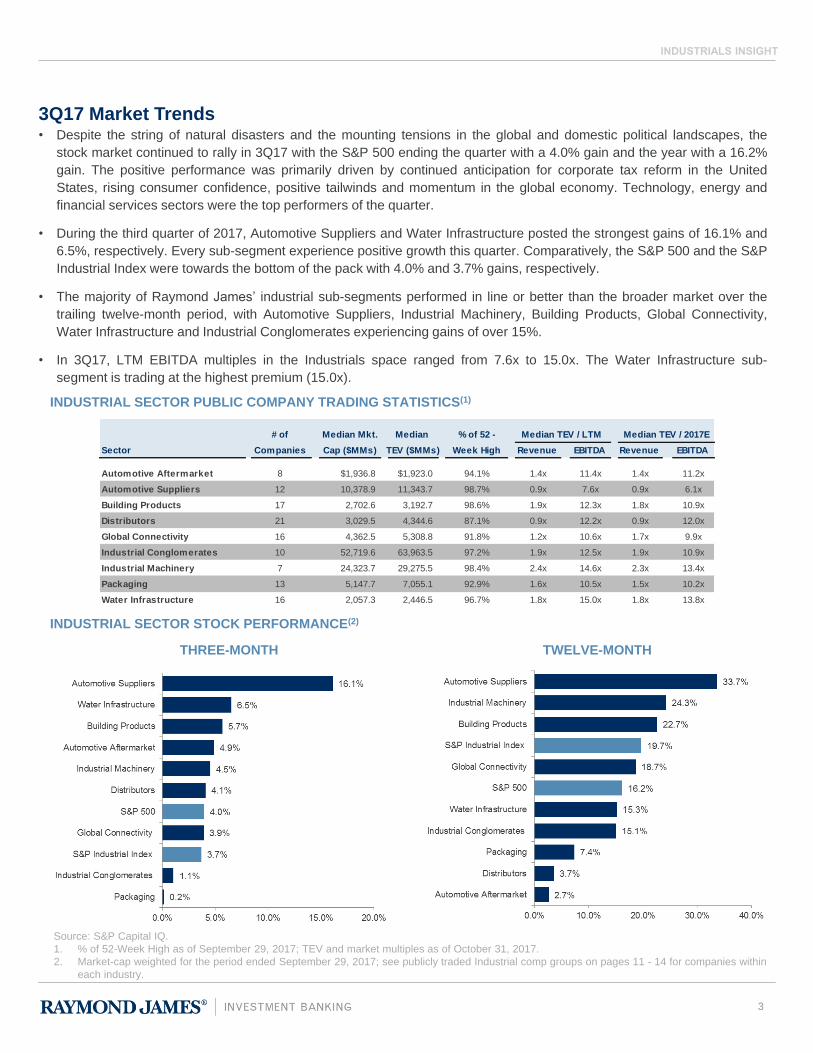
# of Median Mkt. Median % of 52 - Median TEV / LTM Median TEV / 2017E
Sector Companies Cap ($MMs) TEV ($MMs) Week High Revenue EBITDA Revenue EBITDA
Automotive Aftermarket 8 $1,936.8 $1,923.0 94.1% 1.4x 11.4x 1.4x 11.2x
Automotive Suppliers 12 10,378.9 11,343.7 98.7% 0.9x 7.6x 0.9x 6.1x
Building Products 17 2,702.6 3,192.7 98.6% 1.9x 12.3x 1.8x 10.9x
Distributors 21 3,029.5 4,344.6 87.1% 0.9x 12.2x 0.9x 12.0x
Global Connectivity 16 4,362.5 5,308.8 91.8% 1.2x 10.6x 1.7x 9.9x
Industrial Conglomerates 10 52,719.6 63,963.5 97.2% 1.9x 12.5x 1.9x 10.9x
Industrial Machinery 7 24,323.7 29,275.5 98.4% 2.4x 14.6x 2.3x 13.4x
Packaging 13 5,147.7 7,055.1 92.9% 1.6x 10.5x 1.5x 10.2x
Water Infrastructure 16 2,057.3 2,446.5 96.7% 1.8x 15.0x 1.8x 13.8x
3Q17 Market Trends
INDUSTRIAL SECTOR PUBLIC COMPANY TRADING STATISTICS(1)
THREE-MONTH TWELVE-MONTH
Source: S&P Capital IQ.
1. % of 52-Week High as of September 29, 2017; TEV and market multiples as of October 31, 2017.
2. Market-cap weighted for the period ended September 29, 2017; see publicly traded Industrial comp groups on pages 11 - 14 for companies within
each industry.
• Despite the string of natural disasters and the mounting tensions in the global and domestic political landscapes, the
stock market continued to rally in 3Q17 with the S&P 500 ending the quarter with a 4.0% gain and the year with a 16.2%
gain. The positive performance was primarily driven by continued anticipation for corporate tax reform in the United
States, rising consumer confidence, positive tailwinds and momentum in the global economy. Technology, energy and
financial services sectors were the top performers of the quarter.
• During the third quarter of 2017, Automotive Suppliers and Water Infrastructure posted the strongest gains of 16.1% and
6.5%, respectively. Every sub-segment experience positive growth this quarter. Comparatively, the S&P 500 and the S&P
Industrial Index were towards the bottom of the pack with 4.0% and 3.7% gains, respectively.
• The majority of Raymond James’ industrial sub-segments performed in line or better than the broader market over the
trailing twelve-month period, with Automotive Suppliers, Industrial Machinery, Building Products, Global Connectivity,
Water Infrastructure and Industrial Conglomerates experiencing gains of over 15%.
• In 3Q17, LTM EBITDA multiples in the Industrials space ranged from 7.6x to 15.0x. The Water Infrastructure sub-
segment is trading at the highest premium (15.0x).
INDUSTRIAL SECTOR STOCK PERFORMANCE(2)
3
INDUSTRIALS INSIGHT
Building
Products
Industrial
Machinery
Automotive
SuppliersPackaging
Automotive
Aftermarket
Global
Connectivity
Industrial
Conglomerates
Water
InfrastructureDistributors S&P 500
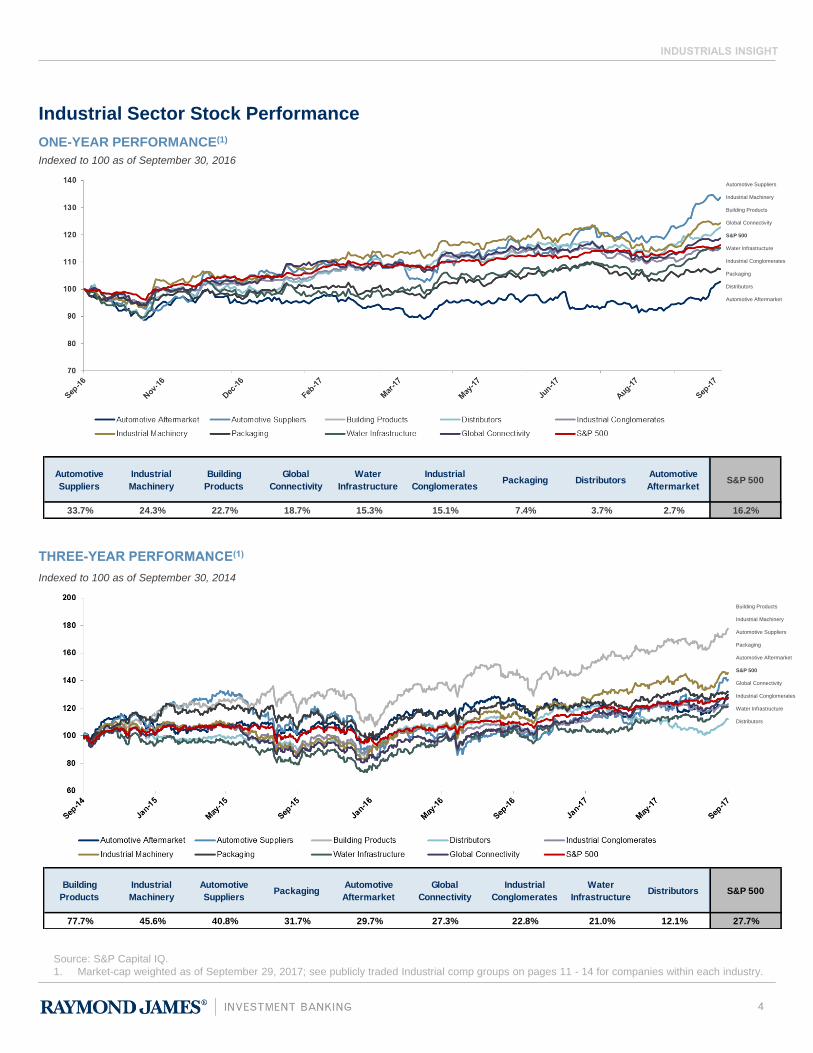
77.7% 45.6% 40.8% 31.7% 29.7% 27.3% 22.8% 21.0% 12.1% 27.7%
Automotive
Suppliers
Industrial
Machinery
Building
Products
Global
Connectivity
Water
Infrastructure
Industrial
Conglomerates Packaging Distributors
Automotive
AftermarketS&P 500
33.7% 24.3% 22.7% 18.7% 15.3% 15.1% 7.4% 3.7% 2.7% 16.2%
Industrial Sector Stock Performance
ONE-YEAR PERFORMANCE(1)
Indexed to 100 as of September 30, 2016
Automotive Suppliers
Industrial Machinery
Building Products
Global Connectivity
S&P 500
Water Infrastructure
Industrial Conglomerates
Packaging
Distributors
Automotive Aftermarket
THREE-YEAR PERFORMANCE(1)
Indexed to 100 as of September 30, 2014
Building Products
Industrial Machinery
Automotive Suppliers
Packaging
Automotive Aftermarket
S&P 500
Global Connectivity
Industrial Conglomerates
Water Infrastructure
Distributors
Source: S&P Capital IQ.
1. Market-cap weighted as of September 29, 2017; see publicly traded Industrial comp groups on pages 11 - 14 for companies within each industry.
4
INDUSTRIALS INSIGHT
5
COMPANY STATISTICSBeacon Roofing Supply, Inc. (“Beacon” or the “Company”) is the largest publicly
traded distributor of residential and non-residential roofing materials in the United
States and Canada. Beacon also distributes complimentary building products,
including siding, windows, specialty exterior building products, insulation and
waterproofing systems for residential and non-residential building exteriors. The
Company serves as a critical link between suppliers and a highly fragmented
customer base, purchasing products from a large number of manufacturers and
distributing these goods to a customer base consisting of contractors, home
builders, retailers and building material suppliers. Beacon operates 383 branches
in 48 states throughout the United States and six provinces in Canada.
In 3Q17, the Company marked a quarterly record with $1.3 billion in sales
(increasing 9.8% year-over-year). Additionally, the Company grew EBITDA to
$132.6MM, an increase of 4.0% when compared with 3Q16.
In addition to outstanding financial performance, Beacon ended its fiscal year
having completed five acquisitions and opening four greenfield locations. The
Company’s fiscal year 2017 acquisitions included BJ Supply Company, American
Building & Roofing, Inc., Eco Insulation Supply, Acme Building Materials and
Lowry’s Inc.
During 3Q17, Beacon announced its definitive purchase agreement to acquire
Allied Building Products Corp. (“Allied”), one of the country’s largest exterior and
interior building products distributors, from global diversified building products
group CRH plc. The Company’s acquisition of Allied is expected to close in
January of 2018. The combination of Beacon and Allied will make Beacon one of
the largest traded wholesale building material distributors in North America,
boasting 593 branches in all 50 U.S. states and six provinces across Canada.
Additionally, the acquisition of Allied will enable Beacon to enter adjacent interior
products, capture significant synergies and capitalize on the recovery in the
housing and construction markets.
Quarterly Company Spotlight
Beacon Roofing Supply Sets a Record Quarter and Announces
Acquisition of Allied Building Products
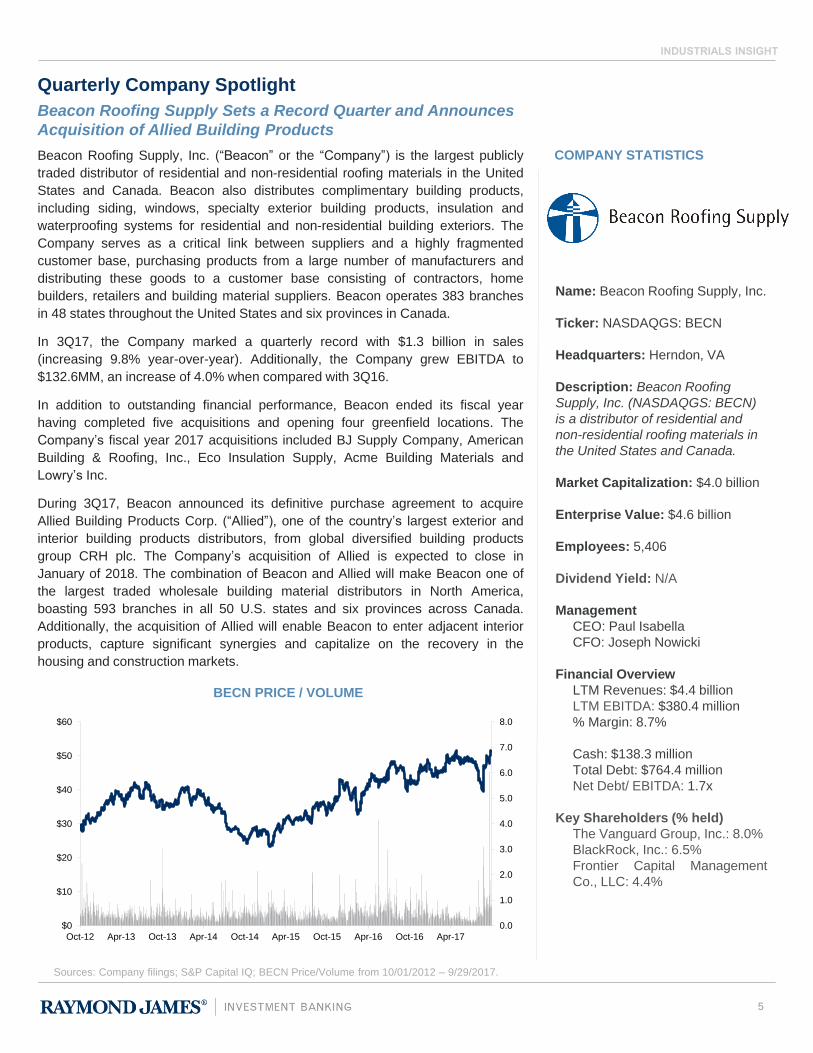
BECN PRICE / VOLUME
Sources: Company filings; S&P Capital IQ; BECN Price/Volume from 10/01/2012 – 9/29/2017.
Name: Beacon Roofing Supply, Inc.
Ticker: NASDAQGS: BECN
Headquarters: Herndon, VA
Description: Beacon Roofing
Supply, Inc. (NASDAQGS: BECN)
is a distributor of residential and
non-residential roofing materials in
the United States and Canada.
Market Capitalization: $4.0 billion
Enterprise Value: $4.6 billion
Employees: 5,406
Dividend Yield: N/A
Management
CEO: Paul Isabella
CFO: Joseph Nowicki
Financial Overview
LTM Revenues: $4.4 billion
LTM EBITDA: $380.4 million
% Margin: 8.7%
Cash: $138.3 million
Total Debt: $764.4 million
Net Debt/ EBITDA: 1.7x
Key Shareholders (% held)
The Vanguard Group, Inc.: 8.0%
BlackRock, Inc.: 6.5%
Frontier Capital Management
Co., LLC: 4.4%
0.0
1.0
2.0
3.0
4.0
5.0
6.0
7.0
8.0
$0
$10
$20
$30
$40
$50
$60
Oct-12 Apr-13 Oct-13 Apr-14 Oct-14 Apr-15 Oct-15 Apr-16 Oct-16 Apr-17
INDUSTRIALS INSIGHT
6
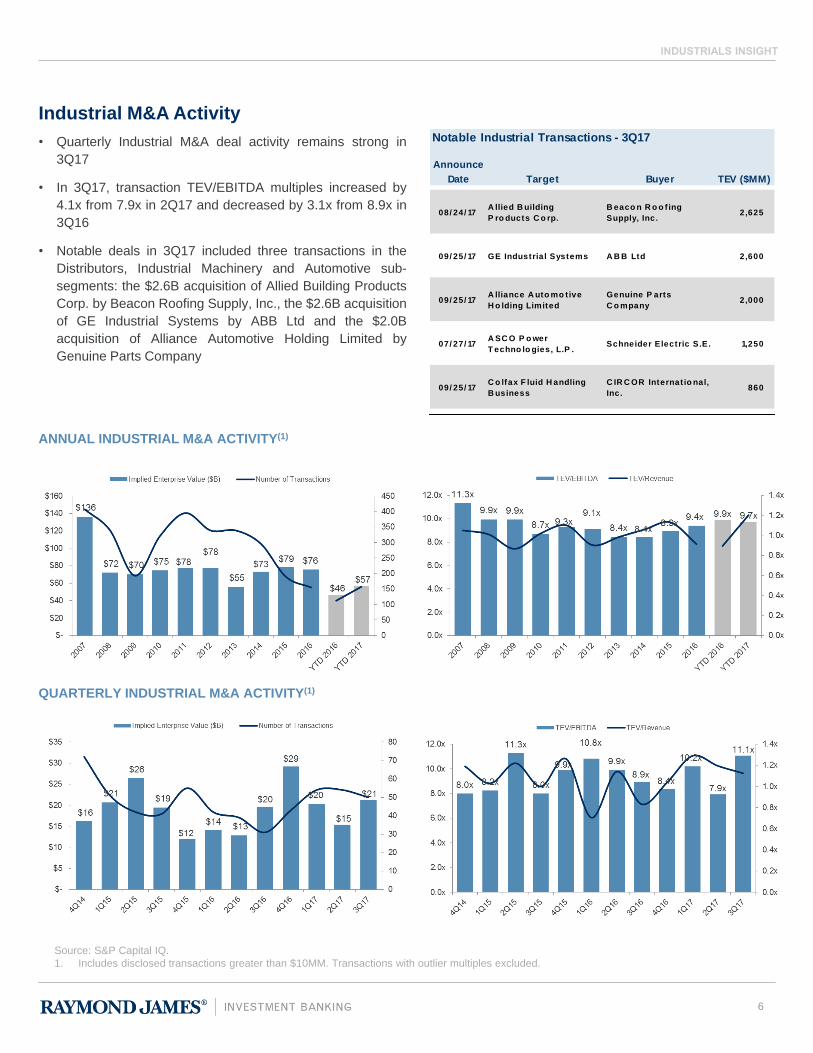
Industrial M&A Activity
• Quarterly Industrial M&A deal activity remains strong in
3Q17
• In 3Q17, transaction TEV/EBITDA multiples increased by
4.1x from 7.9x in 2Q17 and decreased by 3.1x from 8.9x in
3Q16
• Notable deals in 3Q17 included three transactions in the
Distributors, Industrial Machinery and Automotive sub-
segments: the $2.6B acquisition of Allied Building Products
Corp. by Beacon Roofing Supply, Inc., the $2.6B acquisition
of GE Industrial Systems by ABB Ltd and the $2.0B
acquisition of Alliance Automotive Holding Limited by
Genuine Parts Company
ANNUAL INDUSTRIAL M&A ACTIVITY(1)
Source: S&P Capital IQ.
1. Includes disclosed transactions greater than $10MM. Transactions with outlier multiples excluded.
QUARTERLY INDUSTRIAL M&A ACTIVITY(1)
Notable Industrial Transactions - 3Q17
Announce
Date Target Buyer TEV ($MM)
08/ 24/ 17A llied B uilding
P ro ducts C o rp.
B eaco n R o o fing
Supply, Inc.2,625
09/ 25/ 17 GE Industrial Systems A B B Ltd 2,600
09/ 25/ 17A lliance A uto mo tive
H o lding Limited
Genuine P arts
C o mpany2,000
07/ 27/ 17A SC O P o wer
T echno lo gies, L.P .Schneider Electric S.E. 1,250
09/ 25/ 17C o lfax F luid H andling
B usiness
C IR C OR Internat io nal,
Inc.860

INDUSTRIALS INSIGHT
7
Industrial Deal of the Quarter
U.S. Water acquires Tonka Water
Investment Banking Role
Raymond James conducted a robust
auction process for the Company that
generated strong interest from
numerous strategic and financial
buyers.
The process created high competitive
pressure and ultimately, Raymond
James was able to create and deliver
significant value for its client through
the successful managing of the overall
process.
For more information, please
contact:
Brendan Tierney, Managing Director
In August 2017, U.S. Water completed the acquisition of Tonka Water.
Founded in 1956 and based in Plymouth, Minnesota, Tonka Water is a leading
designer and water treatment specialist for a wide variety of surface and ground
water applications for small to mid-sized municipalities. Tonka Water provides a
broad line of proprietary products, which enables the Company to combine
multiple processes to solve the most challenging water quality issues and deliver a
complete custom manufactured system. Tonka Water has developed a deep
distribution network with 28 independent manufacturer representative firms who
gather marketing intel on upcoming projects and develop relationships with
consulting engineers.
U.S. Water is poised to grow their equipment offering in the municipal market and
cross-sell their products and services using Tonka Water’s strong distribution
channel.
Illustrative Product Offering
Aeration &
Stripping
Packaged
Treatment
Systems
Clarification
Filtration
August 2017
A portfolio company of
Ion Exchange
Sell-Side Advisory
Has been acquired by
A subsidiary of
INDUSTRIALS INSIGHT
8
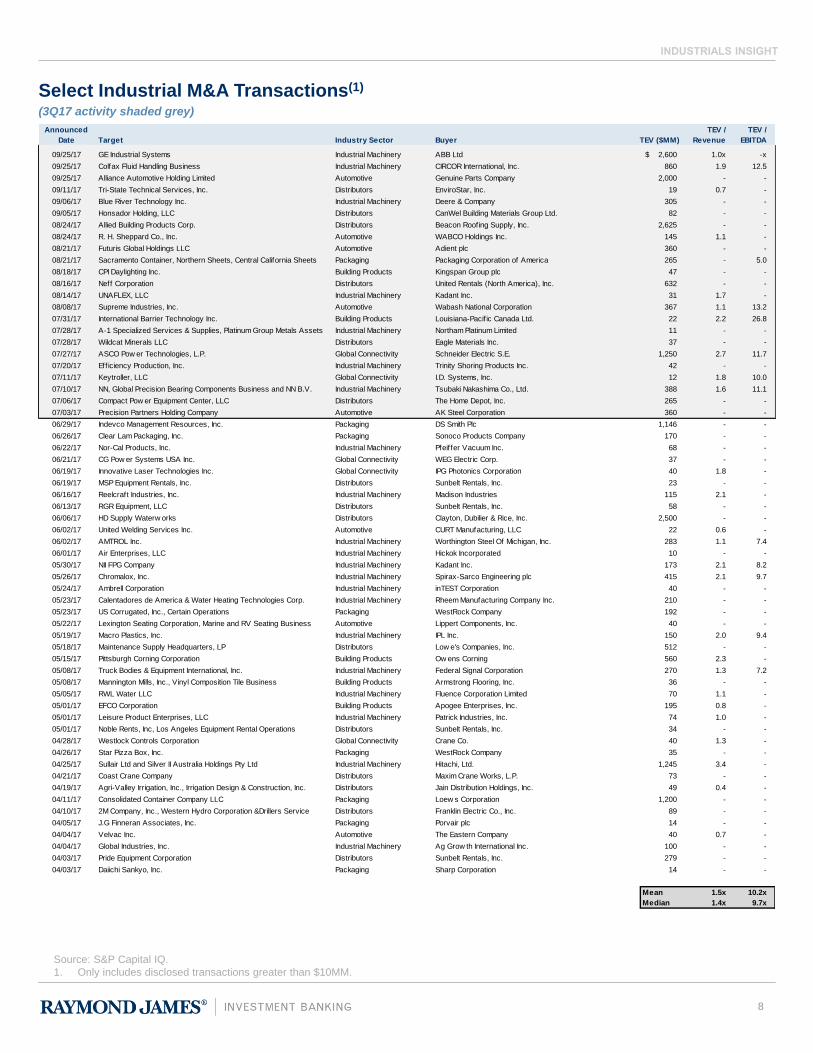
Select Industrial M&A Transactions(1)
(3Q17 activity shaded grey)
Source: S&P Capital IQ.
1. Only includes disclosed transactions greater than $10MM.
Announced TEV / TEV /
Date Target Industry Sector Buyer TEV ($MM) Revenue EBITDA
09/25/17 GE Industrial Systems Industrial Machinery ABB Ltd 2,600$ 1.0x -x
09/25/17 Colfax Fluid Handling Business Industrial Machinery CIRCOR International, Inc. 860 1.9 12.5
09/25/17 Alliance Automotive Holding Limited Automotive Genuine Parts Company 2,000 - -
09/11/17 Tri-State Technical Services, Inc. Distributors EnviroStar, Inc. 19 0.7 -
09/06/17 Blue River Technology Inc. Industrial Machinery Deere & Company 305 - -
09/05/17 Honsador Holding, LLC Distributors CanWel Building Materials Group Ltd. 82 - -
08/24/17 Allied Building Products Corp. Distributors Beacon Roofing Supply, Inc. 2,625 - -
08/24/17 R. H. Sheppard Co., Inc. Automotive WABCO Holdings Inc. 145 1.1 -
08/21/17 Futuris Global Holdings LLC Automotive Adient plc 360 - -
08/21/17 Sacramento Container, Northern Sheets, Central California Sheets Packaging Packaging Corporation of America 265 - 5.0
08/18/17 CPI Daylighting Inc. Building Products Kingspan Group plc 47 - -
08/16/17 Neff Corporation Distributors United Rentals (North America), Inc. 632 - -
08/14/17 UNAFLEX, LLC Industrial Machinery Kadant Inc. 31 1.7 -
08/08/17 Supreme Industries, Inc. Automotive Wabash National Corporation 367 1.1 13.2
07/31/17 International Barrier Technology Inc. Building Products Louisiana-Pacif ic Canada Ltd. 22 2.2 26.8
07/28/17 A-1 Specialized Services & Supplies, Platinum Group Metals Assets Industrial Machinery Northam Platinum Limited 11 - -
07/28/17 Wildcat Minerals LLC Distributors Eagle Materials Inc. 37 - -
07/27/17 ASCO Pow er Technologies, L.P. Global Connectivity Schneider Electric S.E. 1,250 2.7 11.7
07/20/17 Efficiency Production, Inc. Industrial Machinery Trinity Shoring Products Inc. 42 - -
07/11/17 Keytroller, LLC Global Connectivity I.D. Systems, Inc. 12 1.8 10.0
07/10/17 NN, Global Precision Bearing Components Business and NN B.V. Industrial Machinery Tsubaki Nakashima Co., Ltd. 388 1.6 11.1
07/06/17 Compact Pow er Equipment Center, LLC Distributors The Home Depot, Inc. 265 - -
07/03/17 Precision Partners Holding Company Automotive AK Steel Corporation 360 - -
06/29/17 Indevco Management Resources, Inc. Packaging DS Smith Plc 1,146 - -
06/26/17 Clear Lam Packaging, Inc. Packaging Sonoco Products Company 170 - -
06/22/17 Nor-Cal Products, Inc. Industrial Machinery Pfeiffer Vacuum Inc. 68 - -
06/21/17 CG Pow er Systems USA Inc. Global Connectivity WEG Electric Corp. 37 - -
06/19/17 Innovative Laser Technologies Inc. Global Connectivity IPG Photonics Corporation 40 1.8 -
06/19/17 MSP Equipment Rentals, Inc. Distributors Sunbelt Rentals, Inc. 23 - -
06/16/17 Reelcraft Industries, Inc. Industrial Machinery Madison Industries 115 2.1 -
06/13/17 RGR Equipment, LLC Distributors Sunbelt Rentals, Inc. 58 - -
06/06/17 HD Supply Waterw orks Distributors Clayton, Dubilier & Rice, Inc. 2,500 - -
06/02/17 United Welding Services Inc. Automotive CURT Manufacturing, LLC 22 0.6 -
06/02/17 AMTROL Inc. Industrial Machinery Worthington Steel Of Michigan, Inc. 283 1.1 7.4
06/01/17 Air Enterprises, LLC Industrial Machinery Hickok Incorporated 10 - -
05/30/17 NII FPG Company Industrial Machinery Kadant Inc. 173 2.1 8.2
05/26/17 Chromalox, Inc. Industrial Machinery Spirax-Sarco Engineering plc 415 2.1 9.7
05/24/17 Ambrell Corporation Industrial Machinery inTEST Corporation 40 - -
05/23/17 Calentadores de America & Water Heating Technologies Corp. Industrial Machinery Rheem Manufacturing Company Inc. 210 - -
05/23/17 US Corrugated, Inc., Certain Operations Packaging WestRock Company 192 - -
05/22/17 Lexington Seating Corporation, Marine and RV Seating Business Automotive Lippert Components, Inc. 40 - -
05/19/17 Macro Plastics, Inc. Industrial Machinery IPL Inc. 150 2.0 9.4
05/18/17 Maintenance Supply Headquarters, LP Distributors Low e's Companies, Inc. 512 - -
05/15/17 Pittsburgh Corning Corporation Building Products Ow ens Corning 560 2.3 -
05/08/17 Truck Bodies & Equipment International, Inc. Industrial Machinery Federal Signal Corporation 270 1.3 7.2
05/08/17 Mannington Mills, Inc., Vinyl Composition Tile Business Building Products Armstrong Flooring, Inc. 36 - -
05/05/17 RWL Water LLC Industrial Machinery Fluence Corporation Limited 70 1.1 -
05/01/17 EFCO Corporation Building Products Apogee Enterprises, Inc. 195 0.8 -
05/01/17 Leisure Product Enterprises, LLC Industrial Machinery Patrick Industries, Inc. 74 1.0 -
05/01/17 Noble Rents, Inc, Los Angeles Equipment Rental Operations Distributors Sunbelt Rentals, Inc. 34 - -
04/28/17 Westlock Controls Corporation Global Connectivity Crane Co. 40 1.3 -
04/26/17 Star Pizza Box, Inc. Packaging WestRock Company 35 - -
04/25/17 Sullair Ltd and Silver II Australia Holdings Pty Ltd Industrial Machinery Hitachi, Ltd. 1,245 3.4 -
04/21/17 Coast Crane Company Distributors Maxim Crane Works, L.P. 73 - -
04/19/17 Agri-Valley Irrigation, Inc., Irrigation Design & Construction, Inc. Distributors Jain Distribution Holdings, Inc. 49 0.4 -
04/11/17 Consolidated Container Company LLC Packaging Loew s Corporation 1,200 - -
04/10/17 2M Company, Inc., Western Hydro Corporation &Drillers Service Distributors Franklin Electric Co., Inc. 89 - -
04/05/17 J.G Finneran Associates, Inc. Packaging Porvair plc 14 - -
04/04/17 Velvac Inc. Automotive The Eastern Company 40 0.7 -
04/04/17 Global Industries, Inc. Industrial Machinery Ag Grow th International Inc. 100 - -
04/03/17 Pride Equipment Corporation Distributors Sunbelt Rentals, Inc. 279 - -
04/03/17 Daiichi Sankyo, Inc. Packaging Sharp Corporation 14 - -
Mean 1.5x 10.2x
Median 1.4x 9.7x
INDUSTRIALS INSIGHT
9
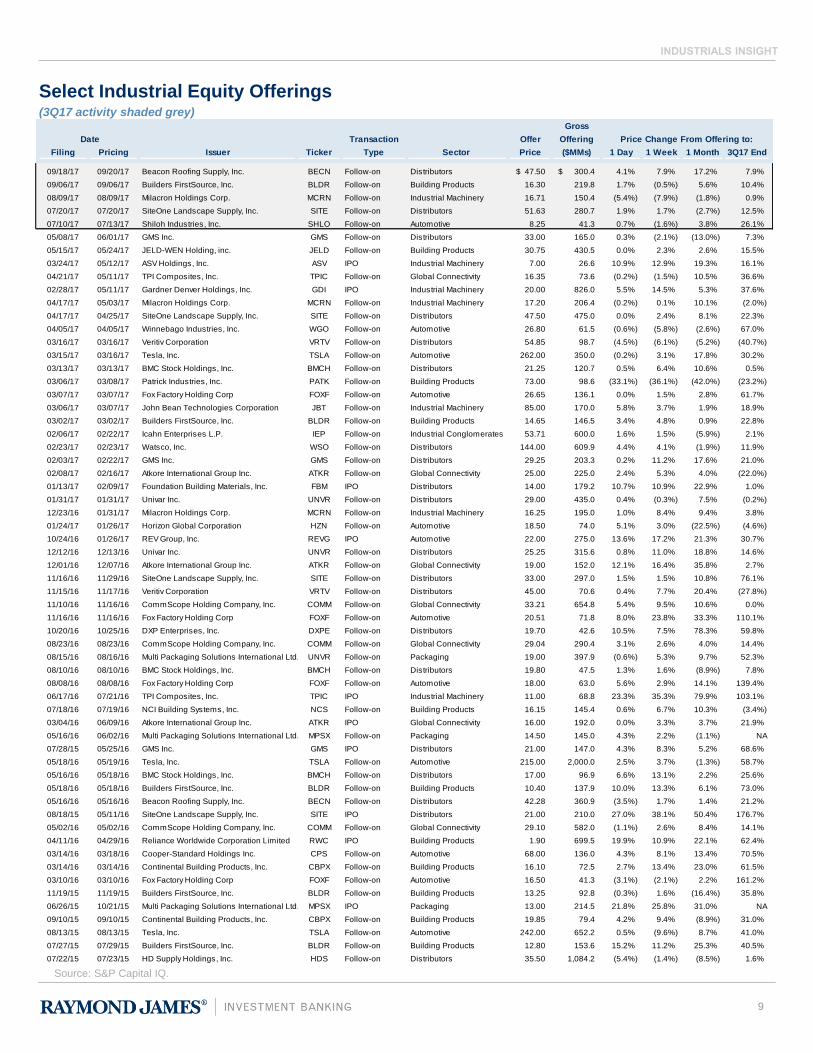
Select Industrial Equity Offerings(3Q17 activity shaded grey)
Source: S&P Capital IQ.
Gross
Date Transaction Offer Offering Price Change From Offering to:
Filing Pricing Issuer Ticker Type Sector Price ($MMs) 1 Day 1 Week 1 Month 3Q17 End
09/18/17 09/20/17 Beacon Roofing Supply, Inc. BECN Follow-on Distributors 47.50$ 300.4$ 4.1% 7.9% 17.2% 7.9%
09/06/17 09/06/17 Builders FirstSource, Inc. BLDR Follow-on Building Products 16.30 219.8 1.7% (0.5%) 5.6% 10.4%
08/09/17 08/09/17 Milacron Holdings Corp. MCRN Follow-on Industrial Machinery 16.71 150.4 (5.4%) (7.9%) (1.8%) 0.9%
07/20/17 07/20/17 SiteOne Landscape Supply, Inc. SITE Follow-on Distributors 51.63 280.7 1.9% 1.7% (2.7%) 12.5%
07/10/17 07/13/17 Shiloh Industries, Inc. SHLO Follow-on Automotive 8.25 41.3 0.7% (1.6%) 3.8% 26.1%
05/08/17 06/01/17 GMS Inc. GMS Follow-on Distributors 33.00 165.0 0.3% (2.1%) (13.0%) 7.3%
05/15/17 05/24/17 JELD-WEN Holding, inc. JELD Follow-on Building Products 30.75 430.5 0.0% 2.3% 2.6% 15.5%
03/24/17 05/12/17 ASV Holdings, Inc. ASV IPO Industrial Machinery 7.00 26.6 10.9% 12.9% 19.3% 16.1%
04/21/17 05/11/17 TPI Composites, Inc. TPIC Follow-on Global Connectivity 16.35 73.6 (0.2%) (1.5%) 10.5% 36.6%
02/28/17 05/11/17 Gardner Denver Holdings, Inc. GDI IPO Industrial Machinery 20.00 826.0 5.5% 14.5% 5.3% 37.6%
04/17/17 05/03/17 Milacron Holdings Corp. MCRN Follow-on Industrial Machinery 17.20 206.4 (0.2%) 0.1% 10.1% (2.0%)
04/17/17 04/25/17 SiteOne Landscape Supply, Inc. SITE Follow-on Distributors 47.50 475.0 0.0% 2.4% 8.1% 22.3%
04/05/17 04/05/17 Winnebago Industries, Inc. WGO Follow-on Automotive 26.80 61.5 (0.6%) (5.8%) (2.6%) 67.0%
03/16/17 03/16/17 Veritiv Corporation VRTV Follow-on Distributors 54.85 98.7 (4.5%) (6.1%) (5.2%) (40.7%)
03/15/17 03/16/17 Tesla, Inc. TSLA Follow-on Automotive 262.00 350.0 (0.2%) 3.1% 17.8% 30.2%
03/13/17 03/13/17 BMC Stock Holdings, Inc. BMCH Follow-on Distributors 21.25 120.7 0.5% 6.4% 10.6% 0.5%
03/06/17 03/08/17 Patrick Industries, Inc. PATK Follow-on Building Products 73.00 98.6 (33.1%) (36.1%) (42.0%) (23.2%)
03/07/17 03/07/17 Fox Factory Holding Corp FOXF Follow-on Automotive 26.65 136.1 0.0% 1.5% 2.8% 61.7%
03/06/17 03/07/17 John Bean Technologies Corporation JBT Follow-on Industrial Machinery 85.00 170.0 5.8% 3.7% 1.9% 18.9%
03/02/17 03/02/17 Builders FirstSource, Inc. BLDR Follow-on Building Products 14.65 146.5 3.4% 4.8% 0.9% 22.8%
02/06/17 02/22/17 Icahn Enterprises L.P. IEP Follow-on Industrial Conglomerates 53.71 600.0 1.6% 1.5% (5.9%) 2.1%
02/23/17 02/23/17 Watsco, Inc. WSO Follow-on Distributors 144.00 609.9 4.4% 4.1% (1.9%) 11.9%
02/03/17 02/22/17 GMS Inc. GMS Follow-on Distributors 29.25 203.3 0.2% 11.2% 17.6% 21.0%
02/08/17 02/16/17 Atkore International Group Inc. ATKR Follow-on Global Connectivity 25.00 225.0 2.4% 5.3% 4.0% (22.0%)
01/13/17 02/09/17 Foundation Building Materials, Inc. FBM IPO Distributors 14.00 179.2 10.7% 10.9% 22.9% 1.0%
01/31/17 01/31/17 Univar Inc. UNVR Follow-on Distributors 29.00 435.0 0.4% (0.3%) 7.5% (0.2%)
12/23/16 01/31/17 Milacron Holdings Corp. MCRN Follow-on Industrial Machinery 16.25 195.0 1.0% 8.4% 9.4% 3.8%
01/24/17 01/26/17 Horizon Global Corporation HZN Follow-on Automotive 18.50 74.0 5.1% 3.0% (22.5%) (4.6%)
10/24/16 01/26/17 REV Group, Inc. REVG IPO Automotive 22.00 275.0 13.6% 17.2% 21.3% 30.7%
12/12/16 12/13/16 Univar Inc. UNVR Follow-on Distributors 25.25 315.6 0.8% 11.0% 18.8% 14.6%
12/01/16 12/07/16 Atkore International Group Inc. ATKR Follow-on Global Connectivity 19.00 152.0 12.1% 16.4% 35.8% 2.7%
11/16/16 11/29/16 SiteOne Landscape Supply, Inc. SITE Follow-on Distributors 33.00 297.0 1.5% 1.5% 10.8% 76.1%
11/15/16 11/17/16 Veritiv Corporation VRTV Follow-on Distributors 45.00 70.6 0.4% 7.7% 20.4% (27.8%)
11/10/16 11/16/16 CommScope Holding Company, Inc. COMM Follow-on Global Connectivity 33.21 654.8 5.4% 9.5% 10.6% 0.0%
11/16/16 11/16/16 Fox Factory Holding Corp FOXF Follow-on Automotive 20.51 71.8 8.0% 23.8% 33.3% 110.1%
10/20/16 10/25/16 DXP Enterprises, Inc. DXPE Follow-on Distributors 19.70 42.6 10.5% 7.5% 78.3% 59.8%
08/23/16 08/23/16 CommScope Holding Company, Inc. COMM Follow-on Global Connectivity 29.04 290.4 3.1% 2.6% 4.0% 14.4%
08/15/16 08/16/16 Multi Packaging Solutions International Ltd. UNVR Follow-on Packaging 19.00 397.9 (0.6%) 5.3% 9.7% 52.3%
08/10/16 08/10/16 BMC Stock Holdings, Inc. BMCH Follow-on Distributors 19.80 47.5 1.3% 1.6% (8.9%) 7.8%
08/08/16 08/08/16 Fox Factory Holding Corp FOXF Follow-on Automotive 18.00 63.0 5.6% 2.9% 14.1% 139.4%
06/17/16 07/21/16 TPI Composites, Inc. TPIC IPO Industrial Machinery 11.00 68.8 23.3% 35.3% 79.9% 103.1%
07/18/16 07/19/16 NCI Building Systems, Inc. NCS Follow-on Building Products 16.15 145.4 0.6% 6.7% 10.3% (3.4%)
03/04/16 06/09/16 Atkore International Group Inc. ATKR IPO Global Connectivity 16.00 192.0 0.0% 3.3% 3.7% 21.9%
05/16/16 06/02/16 Multi Packaging Solutions International Ltd. MPSX Follow-on Packaging 14.50 145.0 4.3% 2.2% (1.1%) NA
07/28/15 05/25/16 GMS Inc. GMS IPO Distributors 21.00 147.0 4.3% 8.3% 5.2% 68.6%
05/18/16 05/19/16 Tesla, Inc. TSLA Follow-on Automotive 215.00 2,000.0 2.5% 3.7% (1.3%) 58.7%
05/16/16 05/18/16 BMC Stock Holdings, Inc. BMCH Follow-on Distributors 17.00 96.9 6.6% 13.1% 2.2% 25.6%
05/18/16 05/18/16 Builders FirstSource, Inc. BLDR Follow-on Building Products 10.40 137.9 10.0% 13.3% 6.1% 73.0%
05/16/16 05/16/16 Beacon Roofing Supply, Inc. BECN Follow-on Distributors 42.28 360.9 (3.5%) 1.7% 1.4% 21.2%
08/18/15 05/11/16 SiteOne Landscape Supply, Inc. SITE IPO Distributors 21.00 210.0 27.0% 38.1% 50.4% 176.7%
05/02/16 05/02/16 CommScope Holding Company, Inc. COMM Follow-on Global Connectivity 29.10 582.0 (1.1%) 2.6% 8.4% 14.1%
04/11/16 04/29/16 Reliance Worldwide Corporation Limited RWC IPO Building Products 1.90 699.5 19.9% 10.9% 22.1% 62.4%
03/14/16 03/18/16 Cooper-Standard Holdings Inc. CPS Follow-on Automotive 68.00 136.0 4.3% 8.1% 13.4% 70.5%
03/14/16 03/14/16 Continental Building Products, Inc. CBPX Follow-on Building Products 16.10 72.5 2.7% 13.4% 23.0% 61.5%
03/10/16 03/10/16 Fox Factory Holding Corp FOXF Follow-on Automotive 16.50 41.3 (3.1%) (2.1%) 2.2% 161.2%
11/19/15 11/19/15 Builders FirstSource, Inc. BLDR Follow-on Building Products 13.25 92.8 (0.3%) 1.6% (16.4%) 35.8%
06/26/15 10/21/15 Multi Packaging Solutions International Ltd. MPSX IPO Packaging 13.00 214.5 21.8% 25.8% 31.0% NA
09/10/15 09/10/15 Continental Building Products, Inc. CBPX Follow-on Building Products 19.85 79.4 4.2% 9.4% (8.9%) 31.0%
08/13/15 08/13/15 Tesla, Inc. TSLA Follow-on Automotive 242.00 652.2 0.5% (9.6%) 8.7% 41.0%
07/27/15 07/29/15 Builders FirstSource, Inc. BLDR Follow-on Building Products 12.80 153.6 15.2% 11.2% 25.3% 40.5%
07/22/15 07/23/15 HD Supply Holdings, Inc. HDS Follow-on Distributors 35.50 1,084.2 (5.4%) (1.4%) (8.5%) 1.6%
INDUSTRIALS INSIGHT
10
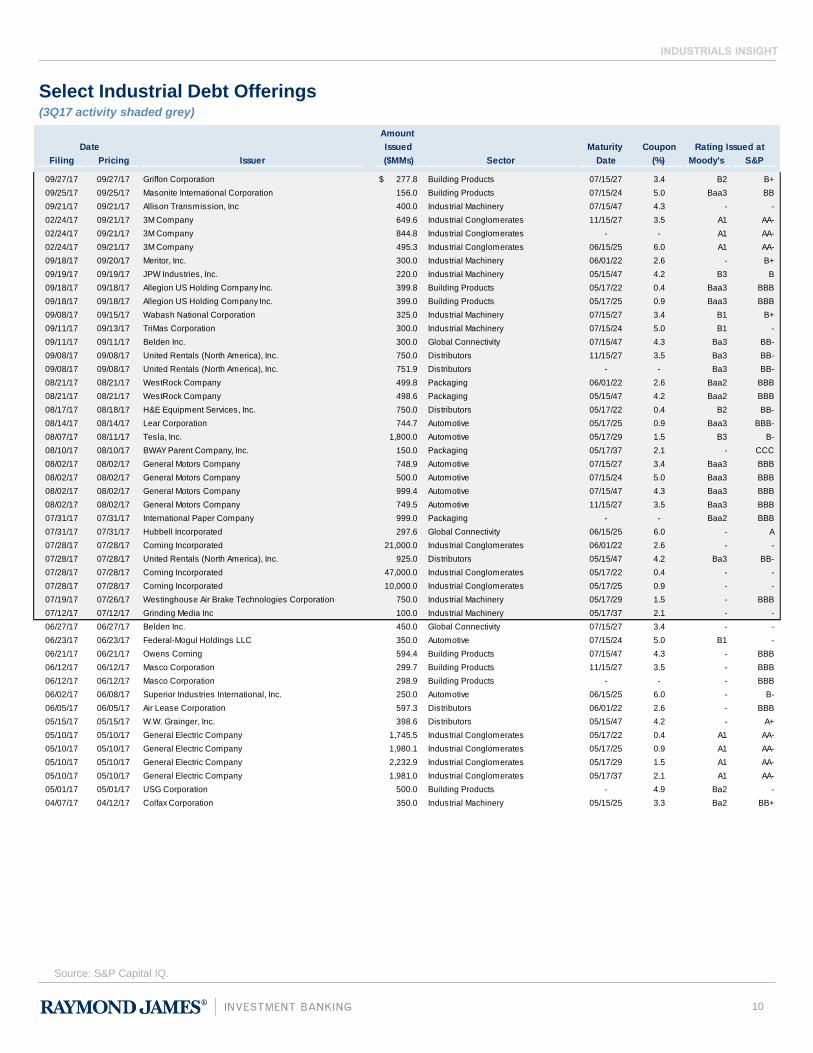
Select Industrial Debt Offerings(3Q17 activity shaded grey)
Source: S&P Capital IQ.
Amount
Date Issued Maturity Coupon Rating Issued at
Filing Pricing Issuer ($MMs) Sector Date (%) Moody's S&P
09/27/17 09/27/17 Griffon Corporation 277.8$ Building Products 07/15/27 3.4 B2 B+
09/25/17 09/25/17 Masonite International Corporation 156.0 Building Products 07/15/24 5.0 Baa3 BB
09/21/17 09/21/17 Allison Transmission, Inc 400.0 Industrial Machinery 07/15/47 4.3 - -
02/24/17 09/21/17 3M Company 649.6 Industrial Conglomerates 11/15/27 3.5 A1 AA-
02/24/17 09/21/17 3M Company 844.8 Industrial Conglomerates - - A1 AA-
02/24/17 09/21/17 3M Company 495.3 Industrial Conglomerates 06/15/25 6.0 A1 AA-
09/18/17 09/20/17 Meritor, Inc. 300.0 Industrial Machinery 06/01/22 2.6 - B+
09/19/17 09/19/17 JPW Industries, Inc. 220.0 Industrial Machinery 05/15/47 4.2 B3 B
09/18/17 09/18/17 Allegion US Holding Company Inc. 399.8 Building Products 05/17/22 0.4 Baa3 BBB
09/18/17 09/18/17 Allegion US Holding Company Inc. 399.0 Building Products 05/17/25 0.9 Baa3 BBB
09/08/17 09/15/17 Wabash National Corporation 325.0 Industrial Machinery 07/15/27 3.4 B1 B+
09/11/17 09/13/17 TriMas Corporation 300.0 Industrial Machinery 07/15/24 5.0 B1 -
09/11/17 09/11/17 Belden Inc. 300.0 Global Connectivity 07/15/47 4.3 Ba3 BB-
09/08/17 09/08/17 United Rentals (North America), Inc. 750.0 Distributors 11/15/27 3.5 Ba3 BB-
09/08/17 09/08/17 United Rentals (North America), Inc. 751.9 Distributors - - Ba3 BB-
08/21/17 08/21/17 WestRock Company 499.8 Packaging 06/01/22 2.6 Baa2 BBB
08/21/17 08/21/17 WestRock Company 498.6 Packaging 05/15/47 4.2 Baa2 BBB
08/17/17 08/18/17 H&E Equipment Services, Inc. 750.0 Distributors 05/17/22 0.4 B2 BB-
08/14/17 08/14/17 Lear Corporation 744.7 Automotive 05/17/25 0.9 Baa3 BBB-
08/07/17 08/11/17 Tesla, Inc. 1,800.0 Automotive 05/17/29 1.5 B3 B-
08/10/17 08/10/17 BWAY Parent Company, Inc. 150.0 Packaging 05/17/37 2.1 - CCC
08/02/17 08/02/17 General Motors Company 748.9 Automotive 07/15/27 3.4 Baa3 BBB
08/02/17 08/02/17 General Motors Company 500.0 Automotive 07/15/24 5.0 Baa3 BBB
08/02/17 08/02/17 General Motors Company 999.4 Automotive 07/15/47 4.3 Baa3 BBB
08/02/17 08/02/17 General Motors Company 749.5 Automotive 11/15/27 3.5 Baa3 BBB
07/31/17 07/31/17 International Paper Company 999.0 Packaging - - Baa2 BBB
07/31/17 07/31/17 Hubbell Incorporated 297.6 Global Connectivity 06/15/25 6.0 - A
07/28/17 07/28/17 Corning Incorporated 21,000.0 Industrial Conglomerates 06/01/22 2.6 - -
07/28/17 07/28/17 United Rentals (North America), Inc. 925.0 Distributors 05/15/47 4.2 Ba3 BB-
07/28/17 07/28/17 Corning Incorporated 47,000.0 Industrial Conglomerates 05/17/22 0.4 - -
07/28/17 07/28/17 Corning Incorporated 10,000.0 Industrial Conglomerates 05/17/25 0.9 - -
07/19/17 07/26/17 Westinghouse Air Brake Technologies Corporation 750.0 Industrial Machinery 05/17/29 1.5 - BBB
07/12/17 07/12/17 Grinding Media Inc 100.0 Industrial Machinery 05/17/37 2.1 - -
06/27/17 06/27/17 Belden Inc. 450.0 Global Connectivity 07/15/27 3.4 - -
06/23/17 06/23/17 Federal-Mogul Holdings LLC 350.0 Automotive 07/15/24 5.0 B1 -
06/21/17 06/21/17 Owens Corning 594.4 Building Products 07/15/47 4.3 - BBB
06/12/17 06/12/17 Masco Corporation 299.7 Building Products 11/15/27 3.5 - BBB
06/12/17 06/12/17 Masco Corporation 298.9 Building Products - - - BBB
06/02/17 06/08/17 Superior Industries International, Inc. 250.0 Automotive 06/15/25 6.0 - B-
06/05/17 06/05/17 Air Lease Corporation 597.3 Distributors 06/01/22 2.6 - BBB
05/15/17 05/15/17 W.W. Grainger, Inc. 398.6 Distributors 05/15/47 4.2 - A+
05/10/17 05/10/17 General Electric Company 1,745.5 Industrial Conglomerates 05/17/22 0.4 A1 AA-
05/10/17 05/10/17 General Electric Company 1,980.1 Industrial Conglomerates 05/17/25 0.9 A1 AA-
05/10/17 05/10/17 General Electric Company 2,232.9 Industrial Conglomerates 05/17/29 1.5 A1 AA-
05/10/17 05/10/17 General Electric Company 1,981.0 Industrial Conglomerates 05/17/37 2.1 A1 AA-
05/01/17 05/01/17 USG Corporation 500.0 Building Products - 4.9 Ba2 -
04/07/17 04/12/17 Colfax Corporation 350.0 Industrial Machinery 05/15/25 3.3 Ba2 BB+
INDUSTRIALS INSIGHT
% of
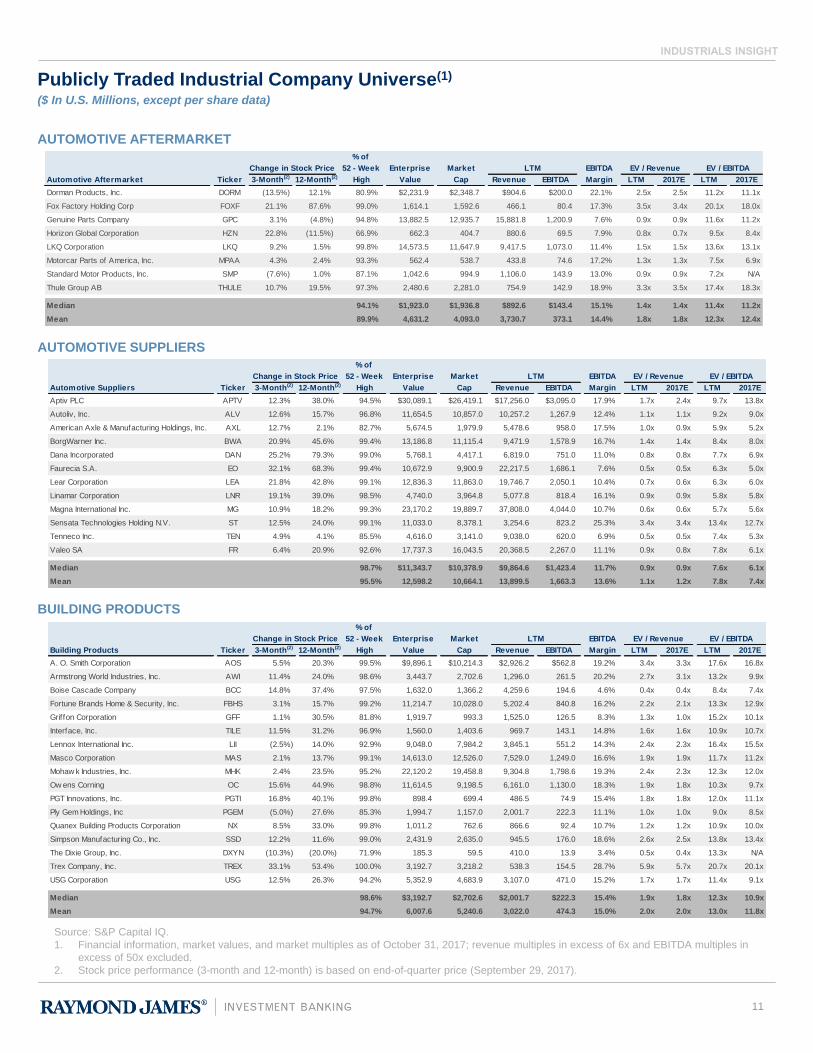
Change in Stock Price 52 - Week Enterprise Market LTM EBITDA EV / Revenue EV / EBITDA
Building Products Ticker 3-Month(2) 12-Month(2) High Value Cap Revenue EBITDA Margin LTM 2017E LTM 2017E
A. O. Smith Corporation AOS 5.5% 20.3% 99.5% $9,896.1 $10,214.3 $2,926.2 $562.8 19.2% 3.4x 3.3x 17.6x 16.8x
Armstrong World Industries, Inc. AWI 11.4% 24.0% 98.6% 3,443.7 2,702.6 1,296.0 261.5 20.2% 2.7x 3.1x 13.2x 9.9x
Boise Cascade Company BCC 14.8% 37.4% 97.5% 1,632.0 1,366.2 4,259.6 194.6 4.6% 0.4x 0.4x 8.4x 7.4x
Fortune Brands Home & Security, Inc. FBHS 3.1% 15.7% 99.2% 11,214.7 10,028.0 5,202.4 840.8 16.2% 2.2x 2.1x 13.3x 12.9x
Griffon Corporation GFF 1.1% 30.5% 81.8% 1,919.7 993.3 1,525.0 126.5 8.3% 1.3x 1.0x 15.2x 10.1x
Interface, Inc. TILE 11.5% 31.2% 96.9% 1,560.0 1,403.6 969.7 143.1 14.8% 1.6x 1.6x 10.9x 10.7x
Lennox International Inc. LII (2.5%) 14.0% 92.9% 9,048.0 7,984.2 3,845.1 551.2 14.3% 2.4x 2.3x 16.4x 15.5x
Masco Corporation MAS 2.1% 13.7% 99.1% 14,613.0 12,526.0 7,529.0 1,249.0 16.6% 1.9x 1.9x 11.7x 11.2x
Mohaw k Industries, Inc. MHK 2.4% 23.5% 95.2% 22,120.2 19,458.8 9,304.8 1,798.6 19.3% 2.4x 2.3x 12.3x 12.0x
Ow ens Corning OC 15.6% 44.9% 98.8% 11,614.5 9,198.5 6,161.0 1,130.0 18.3% 1.9x 1.8x 10.3x 9.7x
PGT Innovations, Inc. PGTI 16.8% 40.1% 99.8% 898.4 699.4 486.5 74.9 15.4% 1.8x 1.8x 12.0x 11.1x
Ply Gem Holdings, Inc PGEM (5.0%) 27.6% 85.3% 1,994.7 1,157.0 2,001.7 222.3 11.1% 1.0x 1.0x 9.0x 8.5x
Quanex Building Products Corporation NX 8.5% 33.0% 99.8% 1,011.2 762.6 866.6 92.4 10.7% 1.2x 1.2x 10.9x 10.0x
Simpson Manufacturing Co., Inc. SSD 12.2% 11.6% 99.0% 2,431.9 2,635.0 945.5 176.0 18.6% 2.6x 2.5x 13.8x 13.4x
The Dixie Group, Inc. DXYN (10.3%) (20.0%) 71.9% 185.3 59.5 410.0 13.9 3.4% 0.5x 0.4x 13.3x N/A
Trex Company, Inc. TREX 33.1% 53.4% 100.0% 3,192.7 3,218.2 538.3 154.5 28.7% 5.9x 5.7x 20.7x 20.1x
USG Corporation USG 12.5% 26.3% 94.2% 5,352.9 4,683.9 3,107.0 471.0 15.2% 1.7x 1.7x 11.4x 9.1x
Median 98.6% $3,192.7 $2,702.6 $2,001.7 $222.3 15.4% 1.9x 1.8x 12.3x 10.9x
Mean 94.7% 6,007.6 5,240.6 3,022.0 474.3 15.0% 2.0x 2.0x 13.0x 11.8x
% of
Change in Stock Price 52 - Week Enterprise Market LTM EBITDA EV / Revenue EV / EBITDA
Automotive Aftermarket Ticker 3-Month(2) 12-Month(2) High Value Cap Revenue EBITDA Margin LTM 2017E LTM 2017E
Dorman Products, Inc. DORM (13.5%) 12.1% 80.9% $2,231.9 $2,348.7 $904.6 $200.0 22.1% 2.5x 2.5x 11.2x 11.1x
Fox Factory Holding Corp FOXF 21.1% 87.6% 99.0% 1,614.1 1,592.6 466.1 80.4 17.3% 3.5x 3.4x 20.1x 18.0x
Genuine Parts Company GPC 3.1% (4.8%) 94.8% 13,882.5 12,935.7 15,881.8 1,200.9 7.6% 0.9x 0.9x 11.6x 11.2x
Horizon Global Corporation HZN 22.8% (11.5%) 66.9% 662.3 404.7 880.6 69.5 7.9% 0.8x 0.7x 9.5x 8.4x
LKQ Corporation LKQ 9.2% 1.5% 99.8% 14,573.5 11,647.9 9,417.5 1,073.0 11.4% 1.5x 1.5x 13.6x 13.1x
Motorcar Parts of America, Inc. MPAA 4.3% 2.4% 93.3% 562.4 538.7 433.8 74.6 17.2% 1.3x 1.3x 7.5x 6.9x
Standard Motor Products, Inc. SMP (7.6%) 1.0% 87.1% 1,042.6 994.9 1,106.0 143.9 13.0% 0.9x 0.9x 7.2x N/A
Thule Group AB THULE 10.7% 19.5% 97.3% 2,480.6 2,281.0 754.9 142.9 18.9% 3.3x 3.5x 17.4x 18.3x
Median 94.1% $1,923.0 $1,936.8 $892.6 $143.4 15.1% 1.4x 1.4x 11.4x 11.2x
Mean 89.9% 4,631.2 4,093.0 3,730.7 373.1 14.4% 1.8x 1.8x 12.3x 12.4x
Publicly Traded Industrial Company Universe(1)
($ In U.S. Millions, except per share data)
11
AUTOMOTIVE AFTERMARKET
AUTOMOTIVE SUPPLIERS
BUILDING PRODUCTS
Source: S&P Capital IQ.
1. Financial information, market values, and market multiples as of October 31, 2017; revenue multiples in excess of 6x and EBITDA multiples in
excess of 50x excluded.
2. Stock price performance (3-month and 12-month) is based on end-of-quarter price (September 29, 2017).
% of
Change in Stock Price 52 - Week Enterprise Market LTM EBITDA EV / Revenue EV / EBITDA
Automotive Suppliers Ticker 3-Month(2) 12-Month(2) High Value Cap Revenue EBITDA Margin LTM 2017E LTM 2017E
Aptiv PLC APTV 12.3% 38.0% 94.5% $30,089.1 $26,419.1 $17,256.0 $3,095.0 17.9% 1.7x 2.4x 9.7x 13.8x
Autoliv, Inc. ALV 12.6% 15.7% 96.8% 11,654.5 10,857.0 10,257.2 1,267.9 12.4% 1.1x 1.1x 9.2x 9.0x
American Axle & Manufacturing Holdings, Inc. AXL 12.7% 2.1% 82.7% 5,674.5 1,979.9 5,478.6 958.0 17.5% 1.0x 0.9x 5.9x 5.2x
BorgWarner Inc. BWA 20.9% 45.6% 99.4% 13,186.8 11,115.4 9,471.9 1,578.9 16.7% 1.4x 1.4x 8.4x 8.0x
Dana Incorporated DAN 25.2% 79.3% 99.0% 5,768.1 4,417.1 6,819.0 751.0 11.0% 0.8x 0.8x 7.7x 6.9x
Faurecia S.A. EO 32.1% 68.3% 99.4% 10,672.9 9,900.9 22,217.5 1,686.1 7.6% 0.5x 0.5x 6.3x 5.0x
Lear Corporation LEA 21.8% 42.8% 99.1% 12,836.3 11,863.0 19,746.7 2,050.1 10.4% 0.7x 0.6x 6.3x 6.0x
Linamar Corporation LNR 19.1% 39.0% 98.5% 4,740.0 3,964.8 5,077.8 818.4 16.1% 0.9x 0.9x 5.8x 5.8x
Magna International Inc. MG 10.9% 18.2% 99.3% 23,170.2 19,889.7 37,808.0 4,044.0 10.7% 0.6x 0.6x 5.7x 5.6x
Sensata Technologies Holding N.V. ST 12.5% 24.0% 99.1% 11,033.0 8,378.1 3,254.6 823.2 25.3% 3.4x 3.4x 13.4x 12.7x
Tenneco Inc. TEN 4.9% 4.1% 85.5% 4,616.0 3,141.0 9,038.0 620.0 6.9% 0.5x 0.5x 7.4x 5.3x
Valeo SA FR 6.4% 20.9% 92.6% 17,737.3 16,043.5 20,368.5 2,267.0 11.1% 0.9x 0.8x 7.8x 6.1x
Median 98.7% $11,343.7 $10,378.9 $9,864.6 $1,423.4 11.7% 0.9x 0.9x 7.6x 6.1x
Mean 95.5% 12,598.2 10,664.1 13,899.5 1,663.3 13.6% 1.1x 1.2x 7.8x 7.4x
INDUSTRIALS INSIGHT
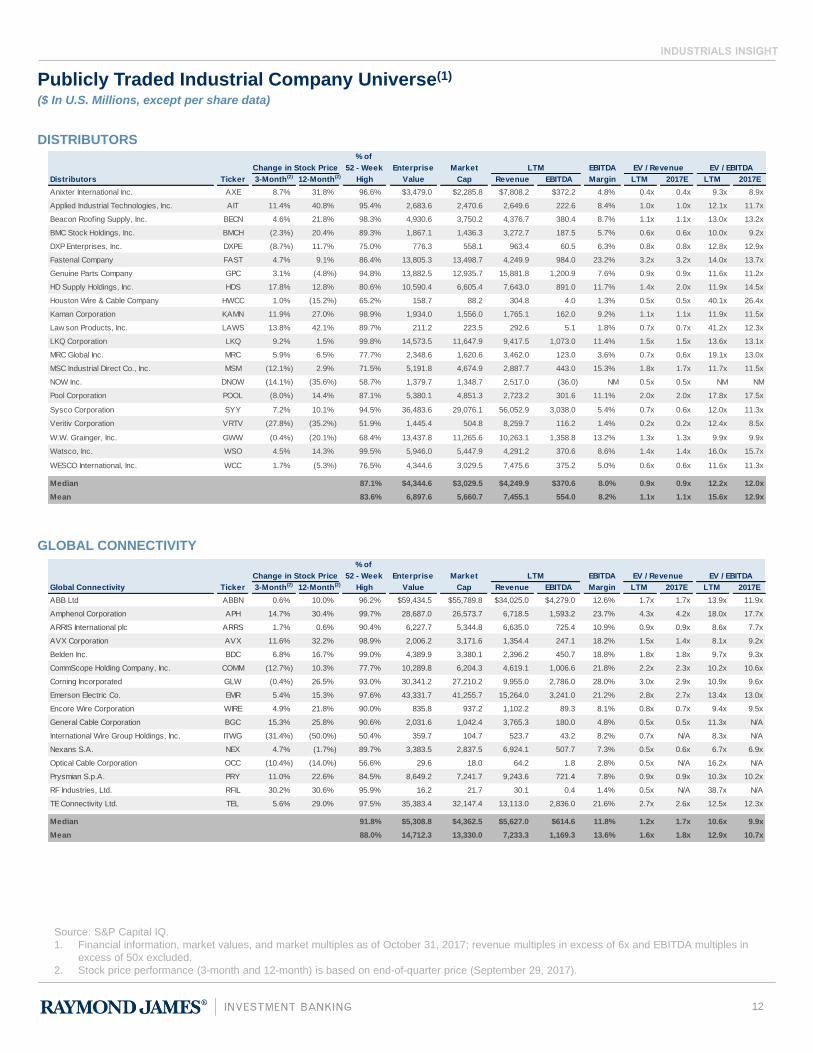
% of
Change in Stock Price 52 - Week Enterprise Market LTM EBITDA EV / Revenue EV / EBITDA
Global Connectivity Ticker 3-Month(2) 12-Month(2) High Value Cap Revenue EBITDA Margin LTM 2017E LTM 2017E
ABB Ltd ABBN 0.6% 10.0% 96.2% $59,434.5 $55,789.8 $34,025.0 $4,279.0 12.6% 1.7x 1.7x 13.9x 11.9x
Amphenol Corporation APH 14.7% 30.4% 99.7% 28,687.0 26,573.7 6,718.5 1,593.2 23.7% 4.3x 4.2x 18.0x 17.7x
ARRIS International plc ARRS 1.7% 0.6% 90.4% 6,227.7 5,344.8 6,635.0 725.4 10.9% 0.9x 0.9x 8.6x 7.7x
AVX Corporation AVX 11.6% 32.2% 98.9% 2,006.2 3,171.6 1,354.4 247.1 18.2% 1.5x 1.4x 8.1x 9.2x
Belden Inc. BDC 6.8% 16.7% 99.0% 4,389.9 3,380.1 2,396.2 450.7 18.8% 1.8x 1.8x 9.7x 9.3x
CommScope Holding Company, Inc. COMM (12.7%) 10.3% 77.7% 10,289.8 6,204.3 4,619.1 1,006.6 21.8% 2.2x 2.3x 10.2x 10.6x
Corning Incorporated GLW (0.4%) 26.5% 93.0% 30,341.2 27,210.2 9,955.0 2,786.0 28.0% 3.0x 2.9x 10.9x 9.6x
Emerson Electric Co. EMR 5.4% 15.3% 97.6% 43,331.7 41,255.7 15,264.0 3,241.0 21.2% 2.8x 2.7x 13.4x 13.0x
Encore Wire Corporation WIRE 4.9% 21.8% 90.0% 835.8 937.2 1,102.2 89.3 8.1% 0.8x 0.7x 9.4x 9.5x
General Cable Corporation BGC 15.3% 25.8% 90.6% 2,031.6 1,042.4 3,765.3 180.0 4.8% 0.5x 0.5x 11.3x N/A
International Wire Group Holdings, Inc. ITWG (31.4%) (50.0%) 50.4% 359.7 104.7 523.7 43.2 8.2% 0.7x N/A 8.3x N/A
Nexans S.A. NEX 4.7% (1.7%) 89.7% 3,383.5 2,837.5 6,924.1 507.7 7.3% 0.5x 0.6x 6.7x 6.9x
Optical Cable Corporation OCC (10.4%) (14.0%) 56.6% 29.6 18.0 64.2 1.8 2.8% 0.5x N/A 16.2x N/A
Prysmian S.p.A. PRY 11.0% 22.6% 84.5% 8,649.2 7,241.7 9,243.6 721.4 7.8% 0.9x 0.9x 10.3x 10.2x
RF Industries, Ltd. RFIL 30.2% 30.6% 95.9% 16.2 21.7 30.1 0.4 1.4% 0.5x N/A 38.7x N/A
TE Connectivity Ltd. TEL 5.6% 29.0% 97.5% 35,383.4 32,147.4 13,113.0 2,836.0 21.6% 2.7x 2.6x 12.5x 12.3x
Median 91.8% $5,308.8 $4,362.5 $5,627.0 $614.6 11.8% 1.2x 1.7x 10.6x 9.9x
Mean 88.0% 14,712.3 13,330.0 7,233.3 1,169.3 13.6% 1.6x 1.8x 12.9x 10.7x
% of
Change in Stock Price 52 - Week Enterprise Market LTM EBITDA EV / Revenue EV / EBITDA
Distributors Ticker 3-Month(2) 12-Month(2) High Value Cap Revenue EBITDA Margin LTM 2017E LTM 2017E
Anixter International Inc. AXE 8.7% 31.8% 96.6% $3,479.0 $2,285.8 $7,808.2 $372.2 4.8% 0.4x 0.4x 9.3x 8.9x
Applied Industrial Technologies, Inc. AIT 11.4% 40.8% 95.4% 2,683.6 2,470.6 2,649.6 222.6 8.4% 1.0x 1.0x 12.1x 11.7x
Beacon Roofing Supply, Inc. BECN 4.6% 21.8% 98.3% 4,930.6 3,750.2 4,376.7 380.4 8.7% 1.1x 1.1x 13.0x 13.2x
BMC Stock Holdings, Inc. BMCH (2.3%) 20.4% 89.3% 1,867.1 1,436.3 3,272.7 187.5 5.7% 0.6x 0.6x 10.0x 9.2x
DXP Enterprises, Inc. DXPE (8.7%) 11.7% 75.0% 776.3 558.1 963.4 60.5 6.3% 0.8x 0.8x 12.8x 12.9x
Fastenal Company FAST 4.7% 9.1% 86.4% 13,805.3 13,498.7 4,249.9 984.0 23.2% 3.2x 3.2x 14.0x 13.7x
Genuine Parts Company GPC 3.1% (4.8%) 94.8% 13,882.5 12,935.7 15,881.8 1,200.9 7.6% 0.9x 0.9x 11.6x 11.2x
HD Supply Holdings, Inc. HDS 17.8% 12.8% 80.6% 10,590.4 6,605.4 7,643.0 891.0 11.7% 1.4x 2.0x 11.9x 14.5x
Houston Wire & Cable Company HWCC 1.0% (15.2%) 65.2% 158.7 88.2 304.8 4.0 1.3% 0.5x 0.5x 40.1x 26.4x
Kaman Corporation KAMN 11.9% 27.0% 98.9% 1,934.0 1,556.0 1,765.1 162.0 9.2% 1.1x 1.1x 11.9x 11.5x
Law son Products, Inc. LAWS 13.8% 42.1% 89.7% 211.2 223.5 292.6 5.1 1.8% 0.7x 0.7x 41.2x 12.3x
LKQ Corporation LKQ 9.2% 1.5% 99.8% 14,573.5 11,647.9 9,417.5 1,073.0 11.4% 1.5x 1.5x 13.6x 13.1x
MRC Global Inc. MRC 5.9% 6.5% 77.7% 2,348.6 1,620.6 3,462.0 123.0 3.6% 0.7x 0.6x 19.1x 13.0x
MSC Industrial Direct Co., Inc. MSM (12.1%) 2.9% 71.5% 5,191.8 4,674.9 2,887.7 443.0 15.3% 1.8x 1.7x 11.7x 11.5x
NOW Inc. DNOW (14.1%) (35.6%) 58.7% 1,379.7 1,348.7 2,517.0 (36.0) NM 0.5x 0.5x NM NM
Pool Corporation POOL (8.0%) 14.4% 87.1% 5,380.1 4,851.3 2,723.2 301.6 11.1% 2.0x 2.0x 17.8x 17.5x
Sysco Corporation SYY 7.2% 10.1% 94.5% 36,483.6 29,076.1 56,052.9 3,038.0 5.4% 0.7x 0.6x 12.0x 11.3x
Veritiv Corporation VRTV (27.8%) (35.2%) 51.9% 1,445.4 504.8 8,259.7 116.2 1.4% 0.2x 0.2x 12.4x 8.5x
W.W. Grainger, Inc. GWW (0.4%) (20.1%) 68.4% 13,437.8 11,265.6 10,263.1 1,358.8 13.2% 1.3x 1.3x 9.9x 9.9x
Watsco, Inc. WSO 4.5% 14.3% 99.5% 5,946.0 5,447.9 4,291.2 370.6 8.6% 1.4x 1.4x 16.0x 15.7x
WESCO International, Inc. WCC 1.7% (5.3%) 76.5% 4,344.6 3,029.5 7,475.6 375.2 5.0% 0.6x 0.6x 11.6x 11.3x
Median 87.1% $4,344.6 $3,029.5 $4,249.9 $370.6 8.0% 0.9x 0.9x 12.2x 12.0x
Mean 83.6% 6,897.6 5,660.7 7,455.1 554.0 8.2% 1.1x 1.1x 15.6x 12.9x
12
DISTRIBUTORS
GLOBAL CONNECTIVITY
Publicly Traded Industrial Company Universe(1)
($ In U.S. Millions, except per share data)
Source: S&P Capital IQ.
1. Financial information, market values, and market multiples as of October 31, 2017; revenue multiples in excess of 6x and EBITDA multiples in
excess of 50x excluded.
2. Stock price performance (3-month and 12-month) is based on end-of-quarter price (September 29, 2017).
INDUSTRIALS INSIGHT
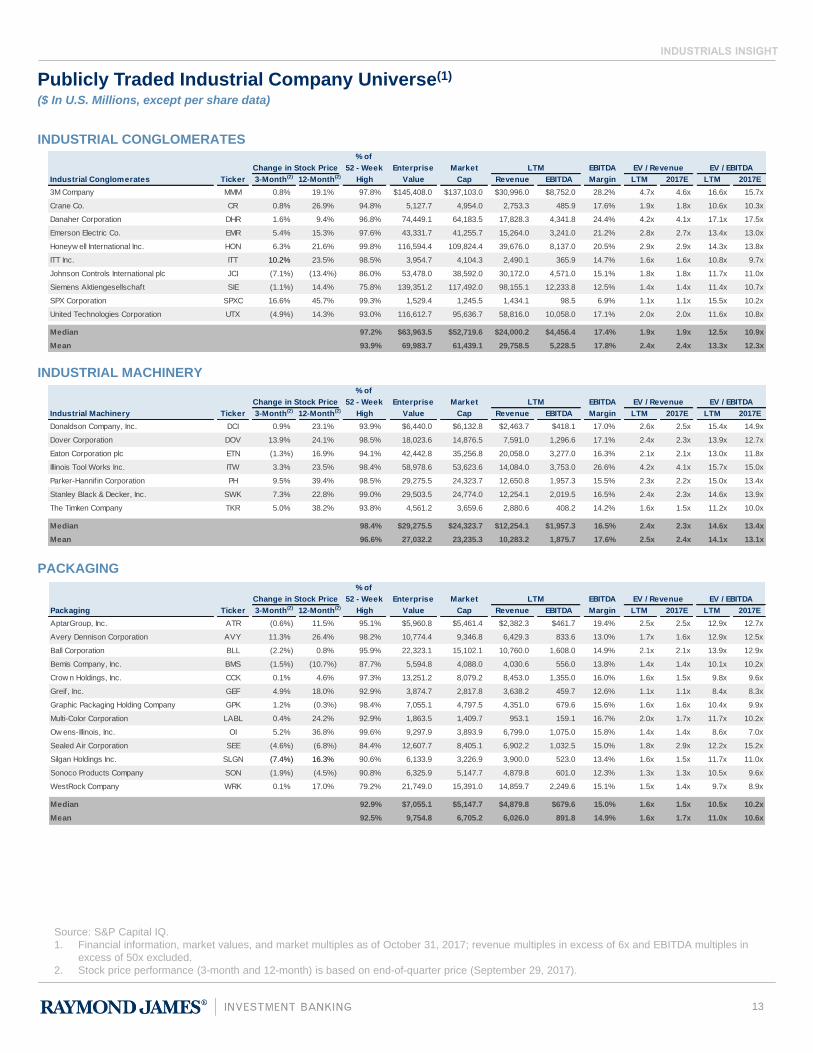
% of
Change in Stock Price 52 - Week Enterprise Market LTM EBITDA EV / Revenue EV / EBITDA
Packaging Ticker 3-Month(2) 12-Month(2) High Value Cap Revenue EBITDA Margin LTM 2017E LTM 2017E
AptarGroup, Inc. ATR (0.6%) 11.5% 95.1% $5,960.8 $5,461.4 $2,382.3 $461.7 19.4% 2.5x 2.5x 12.9x 12.7x
Avery Dennison Corporation AVY 11.3% 26.4% 98.2% 10,774.4 9,346.8 6,429.3 833.6 13.0% 1.7x 1.6x 12.9x 12.5x
Ball Corporation BLL (2.2%) 0.8% 95.9% 22,323.1 15,102.1 10,760.0 1,608.0 14.9% 2.1x 2.1x 13.9x 12.9x
Bemis Company, Inc. BMS (1.5%) (10.7%) 87.7% 5,594.8 4,088.0 4,030.6 556.0 13.8% 1.4x 1.4x 10.1x 10.2x
Crow n Holdings, Inc. CCK 0.1% 4.6% 97.3% 13,251.2 8,079.2 8,453.0 1,355.0 16.0% 1.6x 1.5x 9.8x 9.6x
Greif, Inc. GEF 4.9% 18.0% 92.9% 3,874.7 2,817.8 3,638.2 459.7 12.6% 1.1x 1.1x 8.4x 8.3x
Graphic Packaging Holding Company GPK 1.2% (0.3%) 98.4% 7,055.1 4,797.5 4,351.0 679.6 15.6% 1.6x 1.6x 10.4x 9.9x
Multi-Color Corporation LABL 0.4% 24.2% 92.9% 1,863.5 1,409.7 953.1 159.1 16.7% 2.0x 1.7x 11.7x 10.2x
Ow ens-Illinois, Inc. OI 5.2% 36.8% 99.6% 9,297.9 3,893.9 6,799.0 1,075.0 15.8% 1.4x 1.4x 8.6x 7.0x
Sealed Air Corporation SEE (4.6%) (6.8%) 84.4% 12,607.7 8,405.1 6,902.2 1,032.5 15.0% 1.8x 2.9x 12.2x 15.2x
Silgan Holdings Inc. SLGN (7.4%) 16.3% 90.6% 6,133.9 3,226.9 3,900.0 523.0 13.4% 1.6x 1.5x 11.7x 11.0x
Sonoco Products Company SON (1.9%) (4.5%) 90.8% 6,325.9 5,147.7 4,879.8 601.0 12.3% 1.3x 1.3x 10.5x 9.6x
WestRock Company WRK 0.1% 17.0% 79.2% 21,749.0 15,391.0 14,859.7 2,249.6 15.1% 1.5x 1.4x 9.7x 8.9x
Median 92.9% $7,055.1 $5,147.7 $4,879.8 $679.6 15.0% 1.6x 1.5x 10.5x 10.2x
Mean 92.5% 9,754.8 6,705.2 6,026.0 891.8 14.9% 1.6x 1.7x 11.0x 10.6x
% of
Change in Stock Price 52 - Week Enterprise Market LTM EBITDA EV / Revenue EV / EBITDA
Industrial Machinery Ticker 3-Month(2) 12-Month(2) High Value Cap Revenue EBITDA Margin LTM 2017E LTM 2017E
Donaldson Company, Inc. DCI 0.9% 23.1% 93.9% $6,440.0 $6,132.8 $2,463.7 $418.1 17.0% 2.6x 2.5x 15.4x 14.9x
Dover Corporation DOV 13.9% 24.1% 98.5% 18,023.6 14,876.5 7,591.0 1,296.6 17.1% 2.4x 2.3x 13.9x 12.7x
Eaton Corporation plc ETN (1.3%) 16.9% 94.1% 42,442.8 35,256.8 20,058.0 3,277.0 16.3% 2.1x 2.1x 13.0x 11.8x
Illinois Tool Works Inc. ITW 3.3% 23.5% 98.4% 58,978.6 53,623.6 14,084.0 3,753.0 26.6% 4.2x 4.1x 15.7x 15.0x
Parker-Hannif in Corporation PH 9.5% 39.4% 98.5% 29,275.5 24,323.7 12,650.8 1,957.3 15.5% 2.3x 2.2x 15.0x 13.4x
Stanley Black & Decker, Inc. SWK 7.3% 22.8% 99.0% 29,503.5 24,774.0 12,254.1 2,019.5 16.5% 2.4x 2.3x 14.6x 13.9x
The Timken Company TKR 5.0% 38.2% 93.8% 4,561.2 3,659.6 2,880.6 408.2 14.2% 1.6x 1.5x 11.2x 10.0x
Median 98.4% $29,275.5 $24,323.7 $12,254.1 $1,957.3 16.5% 2.4x 2.3x 14.6x 13.4x
Mean 96.6% 27,032.2 23,235.3 10,283.2 1,875.7 17.6% 2.5x 2.4x 14.1x 13.1x
% of
Change in Stock Price 52 - Week Enterprise Market LTM EBITDA EV / Revenue EV / EBITDA
Industrial Conglomerates Ticker 3-Month(2) 12-Month(2) High Value Cap Revenue EBITDA Margin LTM 2017E LTM 2017E
3M Company MMM 0.8% 19.1% 97.8% $145,408.0 $137,103.0 $30,996.0 $8,752.0 28.2% 4.7x 4.6x 16.6x 15.7x
Crane Co. CR 0.8% 26.9% 94.8% 5,127.7 4,954.0 2,753.3 485.9 17.6% 1.9x 1.8x 10.6x 10.3x
Danaher Corporation DHR 1.6% 9.4% 96.8% 74,449.1 64,183.5 17,828.3 4,341.8 24.4% 4.2x 4.1x 17.1x 17.5x
Emerson Electric Co. EMR 5.4% 15.3% 97.6% 43,331.7 41,255.7 15,264.0 3,241.0 21.2% 2.8x 2.7x 13.4x 13.0x
Honeyw ell International Inc. HON 6.3% 21.6% 99.8% 116,594.4 109,824.4 39,676.0 8,137.0 20.5% 2.9x 2.9x 14.3x 13.8x
ITT Inc. ITT 10.2% 23.5% 98.5% 3,954.7 4,104.3 2,490.1 365.9 14.7% 1.6x 1.6x 10.8x 9.7x
Johnson Controls International plc JCI (7.1%) (13.4%) 86.0% 53,478.0 38,592.0 30,172.0 4,571.0 15.1% 1.8x 1.8x 11.7x 11.0x
Siemens Aktiengesellschaft SIE (1.1%) 14.4% 75.8% 139,351.2 117,492.0 98,155.1 12,233.8 12.5% 1.4x 1.4x 11.4x 10.7x
SPX Corporation SPXC 16.6% 45.7% 99.3% 1,529.4 1,245.5 1,434.1 98.5 6.9% 1.1x 1.1x 15.5x 10.2x
United Technologies Corporation UTX (4.9%) 14.3% 93.0% 116,612.7 95,636.7 58,816.0 10,058.0 17.1% 2.0x 2.0x 11.6x 10.8x
Median 97.2% $63,963.5 $52,719.6 $24,000.2 $4,456.4 17.4% 1.9x 1.9x 12.5x 10.9x
Mean 93.9% 69,983.7 61,439.1 29,758.5 5,228.5 17.8% 2.4x 2.4x 13.3x 12.3x
13
INDUSTRIAL CONGLOMERATES
PACKAGING
INDUSTRIAL MACHINERY
Publicly Traded Industrial Company Universe(1)
($ In U.S. Millions, except per share data)
Source: S&P Capital IQ.
1. Financial information, market values, and market multiples as of October 31, 2017; revenue multiples in excess of 6x and EBITDA multiples in
excess of 50x excluded.
2. Stock price performance (3-month and 12-month) is based on end-of-quarter price (September 29, 2017).
INDUSTRIALS INSIGHT
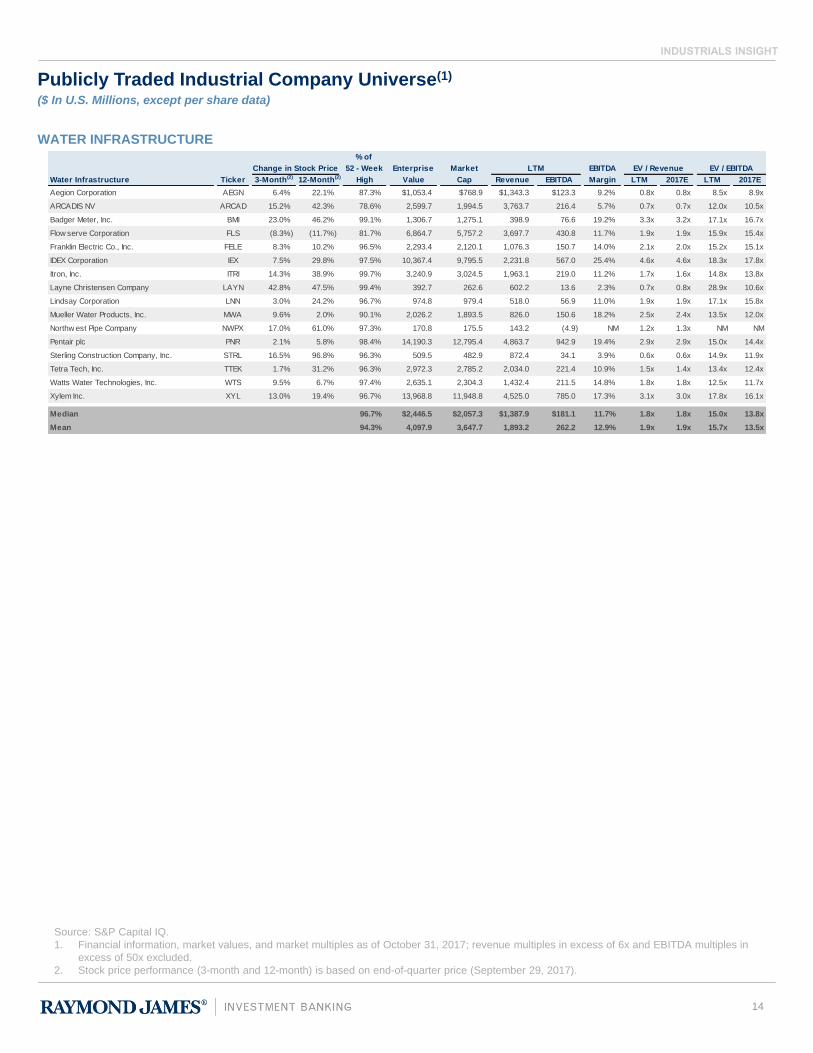
% of
Change in Stock Price 52 - Week Enterprise Market LTM EBITDA EV / Revenue EV / EBITDA
Water Infrastructure Ticker 3-Month(2) 12-Month(2) High Value Cap Revenue EBITDA Margin LTM 2017E LTM 2017E
Aegion Corporation AEGN 6.4% 22.1% 87.3% $1,053.4 $768.9 $1,343.3 $123.3 9.2% 0.8x 0.8x 8.5x 8.9x
ARCADIS NV ARCAD 15.2% 42.3% 78.6% 2,599.7 1,994.5 3,763.7 216.4 5.7% 0.7x 0.7x 12.0x 10.5x
Badger Meter, Inc. BMI 23.0% 46.2% 99.1% 1,306.7 1,275.1 398.9 76.6 19.2% 3.3x 3.2x 17.1x 16.7x
Flow serve Corporation FLS (8.3%) (11.7%) 81.7% 6,864.7 5,757.2 3,697.7 430.8 11.7% 1.9x 1.9x 15.9x 15.4x
Franklin Electric Co., Inc. FELE 8.3% 10.2% 96.5% 2,293.4 2,120.1 1,076.3 150.7 14.0% 2.1x 2.0x 15.2x 15.1x
IDEX Corporation IEX 7.5% 29.8% 97.5% 10,367.4 9,795.5 2,231.8 567.0 25.4% 4.6x 4.6x 18.3x 17.8x
Itron, Inc. ITRI 14.3% 38.9% 99.7% 3,240.9 3,024.5 1,963.1 219.0 11.2% 1.7x 1.6x 14.8x 13.8x
Layne Christensen Company LAYN 42.8% 47.5% 99.4% 392.7 262.6 602.2 13.6 2.3% 0.7x 0.8x 28.9x 10.6x
Lindsay Corporation LNN 3.0% 24.2% 96.7% 974.8 979.4 518.0 56.9 11.0% 1.9x 1.9x 17.1x 15.8x
Mueller Water Products, Inc. MWA 9.6% 2.0% 90.1% 2,026.2 1,893.5 826.0 150.6 18.2% 2.5x 2.4x 13.5x 12.0x
Northw est Pipe Company NWPX 17.0% 61.0% 97.3% 170.8 175.5 143.2 (4.9) NM 1.2x 1.3x NM NM
Pentair plc PNR 2.1% 5.8% 98.4% 14,190.3 12,795.4 4,863.7 942.9 19.4% 2.9x 2.9x 15.0x 14.4x
Sterling Construction Company, Inc. STRL 16.5% 96.8% 96.3% 509.5 482.9 872.4 34.1 3.9% 0.6x 0.6x 14.9x 11.9x
Tetra Tech, Inc. TTEK 1.7% 31.2% 96.3% 2,972.3 2,785.2 2,034.0 221.4 10.9% 1.5x 1.4x 13.4x 12.4x
Watts Water Technologies, Inc. WTS 9.5% 6.7% 97.4% 2,635.1 2,304.3 1,432.4 211.5 14.8% 1.8x 1.8x 12.5x 11.7x
Xylem Inc. XYL 13.0% 19.4% 96.7% 13,968.8 11,948.8 4,525.0 785.0 17.3% 3.1x 3.0x 17.8x 16.1x
Median 96.7% $2,446.5 $2,057.3 $1,387.9 $181.1 11.7% 1.8x 1.8x 15.0x 13.8x
Mean 94.3% 4,097.9 3,647.7 1,893.2 262.2 12.9% 1.9x 1.9x 15.7x 13.5x
14
WATER INFRASTRUCTURE
Publicly Traded Industrial Company Universe(1)
($ In U.S. Millions, except per share data)
Source: S&P Capital IQ.
1. Financial information, market values, and market multiples as of October 31, 2017; revenue multiples in excess of 6x and EBITDA multiples in
excess of 50x excluded.
2. Stock price performance (3-month and 12-month) is based on end-of-quarter price (September 29, 2017).
INDUSTRIALS INSIGHT
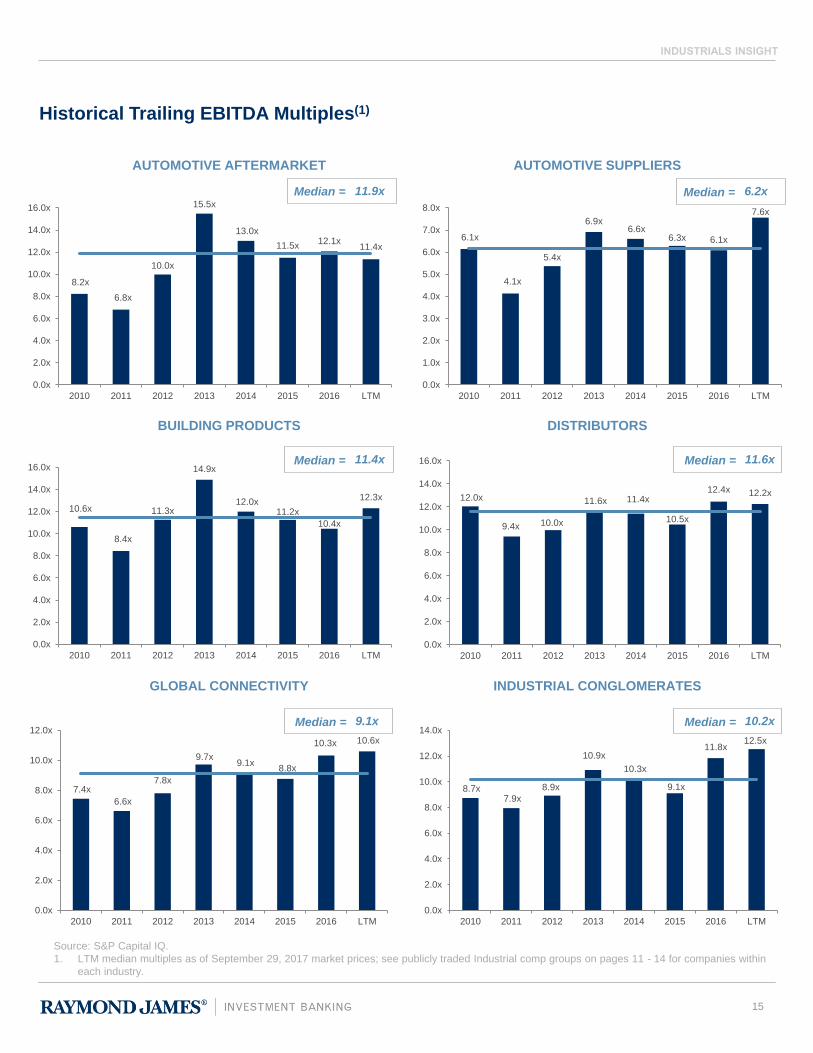
Historical Trailing EBITDA Multiples(1)
15
AUTOMOTIVE AFTERMARKET AUTOMOTIVE SUPPLIERS
BUILDING PRODUCTS DISTRIBUTORS
GLOBAL CONNECTIVITY INDUSTRIAL CONGLOMERATES
Source: S&P Capital IQ.
1. LTM median multiples as of September 29, 2017 market prices; see publicly traded Industrial comp groups on pages 11 - 14 for companies within
each industry.
8.2x
6.8x
10.0x
15.5x
13.0x
11.5x12.1x
11.4x
0.0x
2.0x
4.0x
6.0x
8.0x
10.0x
12.0x
14.0x
16.0x
2010 2011 2012 2013 2014 2015 2016 LTM
11.9xMedian =
6.1x
4.1x
5.4x
6.9x6.6x
6.3x 6.1x
7.6x
0.0x
1.0x
2.0x
3.0x
4.0x
5.0x
6.0x
7.0x
8.0x
2010 2011 2012 2013 2014 2015 2016 LTM
6.2xMedian =
10.6x
8.4x
11.3x
14.9x
12.0x11.2x
10.4x
12.3x
0.0x
2.0x
4.0x
6.0x
8.0x
10.0x
12.0x
14.0x
16.0x
2010 2011 2012 2013 2014 2015 2016 LTM
11.4xMedian =
12.0x
9.4x 10.0x
11.6x 11.4x
10.5x
12.4x 12.2x
0.0x
2.0x
4.0x
6.0x
8.0x
10.0x
12.0x
14.0x
16.0x
2010 2011 2012 2013 2014 2015 2016 LTM
11.6xMedian =
7.4x
6.6x
7.8x
9.7x9.1x
8.8x
10.3x 10.6x
0.0x
2.0x
4.0x
6.0x
8.0x
10.0x
12.0x
2010 2011 2012 2013 2014 2015 2016 LTM
9.1xMedian =
8.7x7.9x
8.9x
10.9x
10.3x
9.1x
11.8x12.5x
0.0x
2.0x
4.0x
6.0x
8.0x
10.0x
12.0x
14.0x
2010 2011 2012 2013 2014 2015 2016 LTM
10.2xMedian =
INDUSTRIALS INSIGHT
16
INDUSTRIAL MACHINERY PACKAGING
WATER INFRASTRUCTURE
Source: S&P Capital IQ.
1. LTM median multiples as of September 29, 2017 market prices; see publicly traded Industrial comp groups on pages 11 - 14 for companies within
each industry.
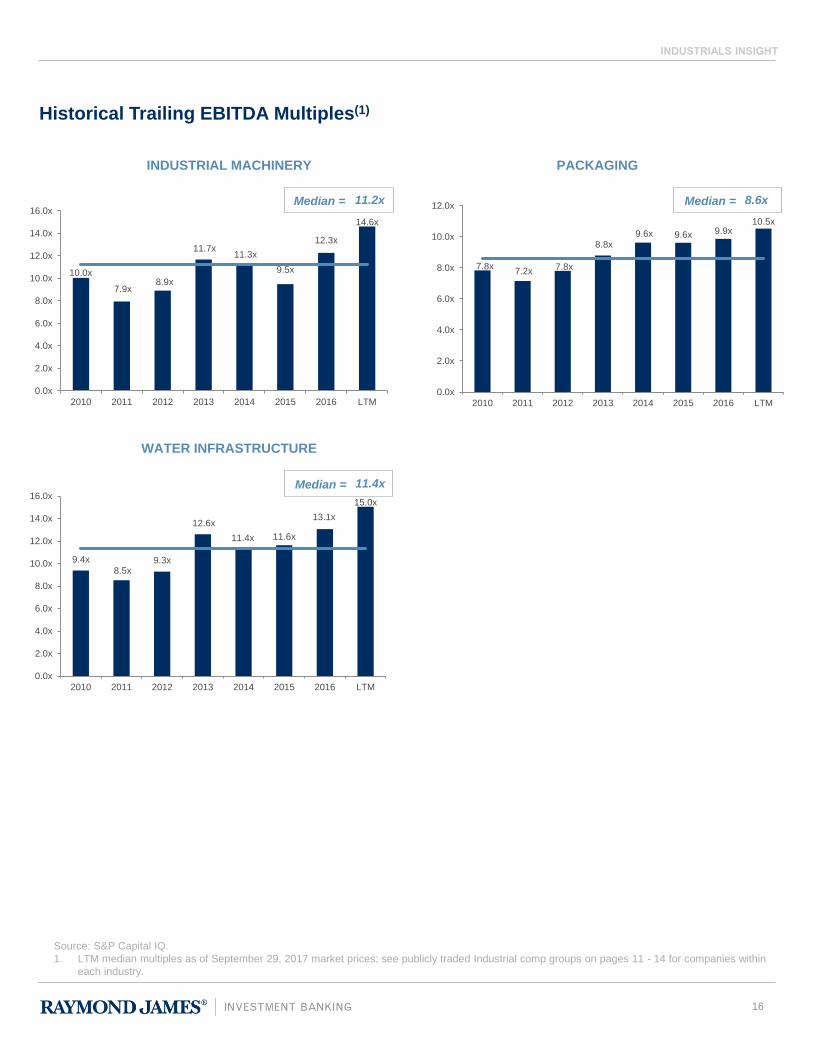
Historical Trailing EBITDA Multiples(1)
10.0x
7.9x8.9x
11.7x11.3x
9.5x
12.3x
14.6x
0.0x
2.0x
4.0x
6.0x
8.0x
10.0x
12.0x
14.0x
16.0x
2010 2011 2012 2013 2014 2015 2016 LTM
11.2xMedian =
7.8x7.2x 7.8x
8.8x9.6x 9.6x 9.9x
10.5x
0.0x
2.0x
4.0x
6.0x
8.0x
10.0x
12.0x
2010 2011 2012 2013 2014 2015 2016 LTM
8.6xMedian =
9.4x
8.5x9.3x
12.6x
11.4x 11.6x
13.1x
15.0x
0.0x
2.0x
4.0x
6.0x
8.0x
10.0x
12.0x
14.0x
16.0x
2010 2011 2012 2013 2014 2015 2016 LTM
11.4xMedian =

INDUSTRIALS INSIGHT
Upcoming Conferences & Events
17
We have highlighted upcoming industry conferences & events which Raymond James will be
sponsoring, attending and/or presenting at over the next several months. Raymond James regularly
attends conferences to gather unique insight into industry trends and further develop our relationship
with industry insiders and thought leaders. We look forward to seeing you at the next one…
JANUARY 13 – 28, 2018
Raymond James will be attending the North American International Auto
Show in Detroit, MI on January 17, 2018.
Additional Information: https://naias.com/
INDUSTRIALS INSIGHT
• Full-service financial services firm with investment banking, equity research, institutional sales & trading, and asset management operations
• Founded in 1962 and public since 1983 (NYSE: RJF)
• Fiscal 2017 revenue of $6.3 billion; net income of nearly $636 million
• More than 115 consecutive quarters of profitability
• Over 7,300 financial advisors in more than 3,000 retail offices serving nearly 3.0 million accounts throughout the United States, Canada and overseas
• European operations in the United Kingdom, France, Belgium, Germany and Switzerland
• 29 North American and international investment banking and institutional sales offices
INDUSTRIALS INVESTMENT BANKING
• Focused on meeting client objectives with extensive experience and industry knowledge
• Longstanding relationships with extensive network of strategic buyers and financial equity sponsors
• Delivers optimal transaction results with client satisfaction throughout the process
Mergers &
Acquisitions
Public Equity
Offerings & Debt
Offerings
Private
Placements
Restructurings &
Recapitalizations
Valuations &
Fairness Opinions
• Over 400 investment banking professionals focused on nine industry sectors
• Since 2013, we have participated in raising more than $300 billion in capital and completed more than 450 advisory assignments domestically and abroad,
including over 400 M&A buy-side or sell-side advisory assignments
RAYMOND JAMES OVERVIEW
INVESTMENT BANKING OVERVIEW
AWARDS & RECOGNITION
For more information, please contact:
Gary Downing // Managing Director – Industrials Group Co-Head // 727.567.1157 // [email protected]
Scott Garfinkel // Managing Director – Industrials Group Co-Head // 615.645.6796 // [email protected]
MIDDLE MARKET
INVESTMENT BANK OF THE
YEAR
AMONG THE “MOST
ADMIRED” SECURITIES
COMPANIES
RANKED
2nd PLACE
“BEST ON THE STREET”
INVESTMENT
BANKING TURNAROUND
FIRM OF THE YEAR
USA MIDDLE MARKET
M&A INVESTMENT
BANK OF THE YEAR
RECEIVED
13 STARMINE
ANALYST AWARDS
INVESTMENT SERVICES
PROVIDER OF THE YEAR -
USA
INDUSTRIALS DEAL OF
THE YEAR
SECTOR EXPERTISE
BUILDING
PRODUCTSDISTRIBUTION
C-STORE & FUEL
PRODUCTS
DISTRIBUTION
WATER
INFRASTRUCTURE
INDUSTRIAL
TECHNOLOGY
DIVERSIFIED
INDUSTRIALSAUTOMOTIVE
Basic Materials
• Stone, Concrete,
Aggregates,
Lumber
Structural
Components
• Framing, Roofing,
Insulation
• Walls, Ceilings,
Floors, Decking
Finished Goods
• Lighting, Fixtures,
Cabinets
• Windows & Doors
Building Products
• Roofing
• HVAC
• Insulation
• Engineered Wood
Industrial
• Pipe, Valve & Fitting
• Process Flow
Control
• MRO
Specialty
• Automotive
• Linens
• Tires
• Diversified
C Store
• C-Store Suppliers &
Service Providers
• C-Store Retailers
• Truck Stops &
Travel Centers
Fuel Products
Distribution
• Branded Oil
Jobbers
• Mobile Fueling
• Terminal Operators
• Wholesale Fuel
Distributors
• Bulk & Commercial
Lube Distributors
Products
• Distribution &
Transmission
Equipment
• Treatment &
Purification
• Pipes, Valves &
Fittings
• Test &
Instrumentation
Services
• Meter Reading
• Trenchless
Rehabilitation
• Water Utilities
• Water Well Drilling
Automation
• Motion Control
• Photonics
• Robotics
Process Equipment &
Controls
• Air Handling/HVAC
• Filtration
• Pumps, Valves,
Controls
• Test &
Measurement
Intelligent
Transportation
• Connected
Mobility
• Smart Parking
Niche Manufacturing
• Machinery &
Equipment
• Printing
Consumables
• Metals
Industrial Services
• Preventive and
Routine
Maintenance
• Route Based
Services
Packaging
• Rigid metal and
plastic
• Flexible
Tier 1/Tier 2
• Advanced Materials
• Interior
Components
• Plastic
Technologies
• Electronics
• Metal Processing
• Engineering &
Tooling
• Engineered
Products
Aftermarket
• Enthusiast Products
• Recreational
Vehicle
• Replacement Parts
Gary DowningBrian McDermott Scott Garfinkel
Roger Woodman Brendan Tierney Dirk Liedtke
Pascal SchmidtBurkhard Weber
Todd Cassidy
U.S. Team German Team
George Steinbarger
David Corbett

INDUSTRIALS INSIGHT
SELECT DEBT AND EQUITY OFFERING TRANSACTIONS
SELECT MERGER AND ACQUISITION TRANSACTIONS
Note: Includes transactions completed by senior bankers while at prior firms.
19
This newsletter includes logos or other words or devices that may be registered trademarks of their respective owners. Such use is solely for purposes of
convenience in referring to the trademark owners and their products/services. This newsletter and its contents are not endorsed, sponsored or affiliated with
any trademark owner. Raymond James & Associates, Inc. and its affiliates are not affiliated with any trademark owner but may provide certain financial
services to one or more trademark owners or their affiliates.
Transaction History
a portfolio company of
Has been acquired by$49,131,558
Has acquired
Has been recapitalized by
a portfolio company of
a portfolio company of
has been recapitalized by
Has been recapitalized by
Has been recapitalized by
a portfolio company of
has been acquired by
a portfolio company of
has been acquired by
Have been acquired by
a portfolio company of
and
a portfolio company of
has acquired
has been recapitalized by
a portfolio company of
has been acquired by
Fairness Opinion
a portfolio company of
Has been recapitalized by
Has been acquired by
has been acquired by
Environmental
Disposal Corporation
Has been recapitalized by
Has been recapitalized by
a portfolio company of
Has been recapitalized by
a portfolio company ofa portfolio company of
has been acquired by
Has acquired
Has been recapitalized by
Has been acquired by
a portfolio company of
and
a portfolio company of
$160,000,000
Senior Credit Facility
Sole Placement Agent
$1,000,000,000
Senior Unsecured Notes
Co-Manager$169,050,000
Initial Public Offering
Co-Manager
a portfolio company of
$117,000,000
Initial Public Offering
Co-ManagerInitial Public Offering
Co-Manager
a portfolio company of
$206,080,000 $233,780,625
Follow-on Offering
Co-Manager
a portfolio company of
a portfolio company of
$1,250,000,000
Senior Secured Notes
Co-Manager$35,000,000
Has received a Pre-IPO
Financing investmentSecured Credit Facilities
Equipment Lease
$230,000,000
$189,750,000
Follow-on Offering
Co-Manager
a portfolio company of
Has been acquired by
Follow-on Offering
Bookrunning Manager
$58,075,000
A portfolio company of
A subsidiary of
Has been acquired by
$345,503,125
Follow-on Offering
Co-Manager
INDUSTRIALS INSIGHT
20
Information obtained from third-party sources is considered reliable, but we do not guarantee that the information herein is accurate or complete. This report
was prepared within Raymond James & Associates' Investment Banking Department and is for information purposes only. This report is not a product of
Raymond James & Associates' Research Department; recipients of this report should not interpret the information herein as sufficient grounds for an
investment decision or any other decision. The report shall not constitute an offer to sell or the solicitation of an offer to buy any of the securities mentioned
herein; past performance does not guarantee future results. Raymond James is not affiliated with and does not endorse, authorize or sponsor any of the
linked web sites or their respective opinions. Raymond James is not responsible for the content of any web site or the collection or use of information
regarding any web site’s users and/or members.
Raymond James Industrials Investment Banking Team
Scott GarfinkelIndustrials Group Co-Head
Managing Director [email protected]
Roger WoodmanManaging Director
Brendan TierneyManaging Director
George SteinbargerSenior Vice President
Gary Downing Industrials Group Co-Head
Managing Director [email protected]
David CorbettSenior Vice President
Todd CassidyManaging Director
Brian McDermottManaging Director
USA
Joerg Brunner Senior Vice President
Pascal SchmidtManaging Director
Dirk LiedtkeManaging Director
Burkhard WeberManaging Director
Germany
Canada
Glenn GatcliffeManaging Director
Craig McDougallSenior Managing Director
Ian MacKayManaging Director