the case for vanguard active management: solving the … see sharpe paper, the arithmetic of active...
TRANSCRIPT

Connect with Vanguard > vanguard.com
Executive summary. There is strong theoretical and practical evidence that most actively managed equity funds will underperform their benchmarks.1 To some, this makes the use of active management seem like a fool’s errand with little chance of long-term success. And yet many investors remain drawn to the prospects of outperforming a benchmark with active management. This apparently counterintuitive situation leads some investors to wonder if there are any concrete ways of increasing the probability of success with active management. We believe there are.
In this paper we examine four key elements of active equity management and its implementation at Vanguard. First, we summarize the extensive evidence documenting the historical shortcomings of most active management. Second, we look at one of the most reliable quantitative indicators of future manager success, low cost, and highlight its
Vanguard research January 2013
1 See The Case for Indexing for a full assessment of this evidence.
The case for Vanguard active management: Solving the low-cost/top-talent paradox?
Authors
Daniel W. Wallick
Brian R. Wimmer, CFA
James D. Martielli, CFA

2
2 It’s All a Big Mistake, Howard Marks, Oaktree Capital Management. June 20, 2012. 3 To avoid confusion, when we refer to passively managed investments or indexed investments, we mean a strategy that mimics the relevant capitalization-
weighted market index (see Philips, 2012).
importance in the manager-selection process. Third, we describe Vanguard’s distinctive strategy in selecting subadvisors to manage our actively managed equity mutual funds. Finally, we document our funds’ performance.
We conclude that while there is no guarantee for selecting talented active managers, a combination of quantitative and qualitative inputs can improve the average investor’s experience. Specifically, we find that low cost continues to be the most effective quantitative filter that has shown, with some consistency, to increase the odds of success. However, no quantitative factor alone can ensure outperformance. Indeed, a rigorous and thoughtful qualitative manager-selection process also must be present in combination with low cost to help achieve success. Finally, we show the positive excess returns generated by Vanguard using this approach over the past 30 years.
In the end we find that low-cost active talent can achieve outperformance; and that investors, to the extent they stick with a disciplined approach, can be successful using actively managed funds.
Noted investor Howard Marks of Oaktree Capital Management stated, “People should engage in active management only if they’re convinced that (a) pricing mistakes occur in the market they’re considering and (b) they—or the managers they hire—are capable of identifying those mistakes and taking advantage of them. Unless both apply,
any time, effort, transaction costs, and management fees expended on active management will be wasted.”2
Nobel laureate William Sharpe demonstrated that the average actively managed dollar will underperform the average passively managed dollar3 as the costs
Notes on risk: All investing is subject to risk, including the possible loss of the money you invest. Bond funds are subject to the risk that an issuer will fail to make payments on time, and that bond prices will decline because of rising interest rates or negative perceptions of an issuer’s ability to make payments. Investments in stocks or bonds issued by non-U.S. companies are subject to risks including country/regional risk and currency risk. Stocks of companies based in emerging markets are subject to national and regional political and economic risks and to the risk of currency fluctuations. These risks are especially high in emerging markets. Prices of mid- and small-cap stocks often fluctuate more than those of large-company stocks. Diversification does not ensure a profit or protect against a loss.

4 See Sharpe paper, The Arithmetic of Active Management.5 Strategic Insight as of June 30, 2012.6 Vanguard calculations using Morningstar data; see Figure 1 for more information. Because of fees, most index funds also underperform their benchmarks.
3
of active management—management fees and transaction costs—typically exceed those of passive management.4 Despite this challenge, many investors believe they can identify above-average active managers who will generate market-beating returns, as 75% of equity mutual fund assets are actively managed.5 There is a strong incentive to seek a small return advantage over the market, which, compounded over the long term, can lead to a meaningfully higher ending portfolio value. Of course, unlucky or unskilled active management can also lead to a meaningfully lower ending portfolio value.
Outperforming with active managers is challenging
Over the past 20 years, less than 25% of actively managed U.S. equity mutual funds outperformed their relevant style benchmarks6. Additionally, research has shown that the underperformance of actively managed funds is relatively consistent across various countries, market segments, and time periods. Why does this occur?
The poor performance of active managers can be understood using the concept of the zero-sum game in financial markets. The zero-sum game explains that within any market, the holdings of all market participants aggregate to form that market (Sharpe, 1991). Therefore, every dollar of outperformance one investor achieves in the market is offset by a dollar of underperformance for other investors in the market. This offsetting of gains and losses would appear to suggest an outperformance probability of 50%. However, the concept assumes no transaction- related costs (or taxes). In reality, these costs can be significant, and they reduce the returns investors realize over time (Philips, 2012). While both active and index funds are subject to costs, research shows that the expense ratios for actively managed funds are typically higher. Active large-cap U.S.
equity funds, for example, charge an average of 0.87%, while comparable index funds charge 0.17% (Philips, 2012).
Another factor impeding the prospect of outperforming with active managers is the lack of persistence among top-performing managers (Carhart, 1997; Brown, 1995). It has long been stated that past performance is not indicative of future results, but many investors are still tempted to select mutual funds by recent performance. Philips (2012) confirms that past performance is no more reliable than a coin flip in identifying active managers who will outperform in the future. Not only is past performance an unreliable predictor, but according to significant research, most other quantitative measures of fund attributes or performance (such as fund size, star ratings, active share, etc.) are equally undependable when used to identify future outperformers (Wallick, 2011; Financial Research Corporation, 2002; Philips, 2010; Schlanger, 2012).
Although this large volume of research clearly presents many of the challenges in obtaining successful active management, we do find that investors’ odds can be improved by utilizing low- cost mutual funds.
Improving the odds of active management success
Many investors search for the quantitative “silver bullet” that would enable them to always identify talented managers in advance. In this ongoing search for the perfect metric, many overlook a very good metric that can improve the odds of success when selecting actively managed mutual funds—the expense ratio (Wallick, 2011; Financial Research Corporation, 2002; Kinnell, 2010). A fund’s current expense ratio—a simple and readily available figure—has historically proved to be an effective predictor of

4
relative future fund performance. Intuitively, this approach seems to make sense because an investor’s return is decreased by every dollar spent on investment-related costs. As a result, holding all else equal, a lower expense ratio would mean higher returns.
This relationship can be seen in Figure 1, where we graph the portion of actively managed U.S. equity funds that have outperformed their style bench-
marks. On the left side of the graph, we calculate the percentage of outperformers for the full universe of actively managed U.S. equity funds. The mutual fund universe in this instance is nearly 2,000 U.S. equity funds versus their stated style benchmarks for the 10-, 15-, 20-, and 25-year periods ended December 31, 2011. As we move to the right, we narrow the universe of funds by removing those with the highest expense ratios. On the far right
Last 10 yearsLast 15 years
Last 20 years Average of the 10-, 15-, 20-, and 25-year period observationsLast 25 years
Figure 1. Percentage of actively managed U.S. equity funds that have outperformed their benchmark, sorted by beginning-of-period expense ratio
Per
cent
age
of f
unds
out
perf
orm
ing
Portion of the actively managed U.S. equity fund universe (sorted from most expensive to least expensive)
15
20
25
30
35
40%
Notes: Period ended December 31, 2011. Because of fees, most index fees also underperform their benchmarks. Our analysis utilized expenses and fund returns for all U.S. active equity funds within the Morningstar nine style boxes that were alive at the start of each analysis period. Their performance was compared with their relevant nine style box benchmark. For any funds that were subsequently merged or liquidated, their performance was calculated up to the point of the merger or liquidation. This allowed us to include all funds in the analysis and avoid survivorship bias. The following benchmarks were used for the nine style boxes: Large-cap blend—S&P 500 through 11/2002 and MSCI Prime Market 750 thereafter; Large-cap value—S&P 500 Value through 11/2002 and MSCI Prime Market Value thereafter; Large-cap growth—S&P 500 Growth through 11/2002 and MSCI Prime Market Growth thereafter; Mid-cap blend—S&P Midcap 400 through 11/2002 and MSCI Mid Cap 450 thereafter; Mid-cap value—Russell Midcap Value through 5/1991, S&P Midcap 400 Value through 11/2002, and MSCI Mid Cap 450 Value thereafter; Mid-cap growth—Russell Midcap Value through 5/1991, S&P Midcap 400 Growth through 11/2002, and MSCI Mid Cap 450 Growth thereafter; Small-cap blend—S&P Small Cap 600 through 11/2002 and MSCI Small Cap 1750 thereafter; Small-cap value—Russell 2000 Value through 12/1993, S&P Small Cap 600 Value through 11/2002, and MSCI Small Cap 1750 Value thereafter; Small-cap growth–Russell 2000 Growth through 12/1993, S&P Small Cap 600 Growth through 11/2002, and MSCI Small Cap 1750 Growth thereafter.
Source: Vanguard calculations using data from Morningstar Inc.
100% 95% 90% 85% 80% 75% 70% 65% 60% 55% 50% 45% 40% 35% 30% 20% 15% 10%25%
5
7 See Wallick (2011).8 See The Clash of the Cultures for a fuller look at Mr. Bogle’s discussion of these factors.
side, the universe includes only funds with expense ratios in the lowest 10% of all actively managed U.S. equity funds.
Two conclusions can be drawn from this chart. First, there is a clear trend in each time period of lower costs leading to higher relative performance. Second, although this trend is positive, it does not by itself lead to identifying active funds that will consistently outperform the comparable index. Indeed, if we look at the aggregate average of the four different time periods, we find that the lowest-cost 50% of the funds in the universe produced a 23% probability of outperforming the benchmark, while the lowest-cost decile of funds (the least expensive 10% of funds in the universe) produced a 32% probability of outperforming the index.
It should be noted that the graph is calculated relative to costless benchmarks. If we lower the benchmark returns by 20 bps to compensate for the cost of investing in a low-cost index fund, the probability of the lowest-cost funds succeeding rises from 32% to 40%.
As a result, although low cost has proven to be the most consistent and effective quantitative factor that investors can use (ex-ante) to noticeably improve their odds7, it does not, by itself, guarantee success. Instead, for investors to achieve success using active management, a combination of both low cost and talent are needed.
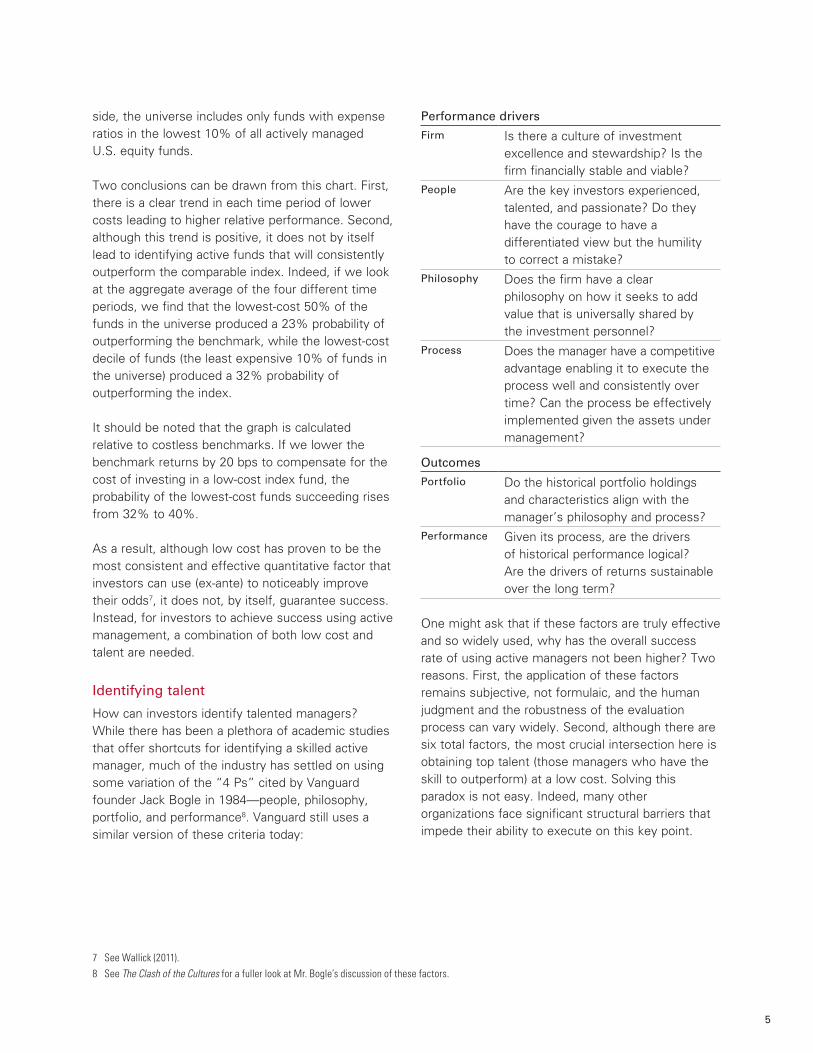
Identifying talent
How can investors identify talented managers? While there has been a plethora of academic studies that offer shortcuts for identifying a skilled active manager, much of the industry has settled on using some variation of the “4 Ps” cited by Vanguard founder Jack Bogle in 1984—people, philosophy, portfolio, and performance8. Vanguard still uses a similar version of these criteria today:
Performance drivers
Firm Is there a culture of investment excellence and stewardship? Is the firm financially stable and viable?
People Are the key investors experienced, talented, and passionate? Do they have the courage to have a differentiated view but the humility to correct a mistake?
Philosophy Does the firm have a clear philosophy on how it seeks to add value that is universally shared by the investment personnel?
Process Does the manager have a competitive advantage enabling it to execute the process well and consistently over time? Can the process be effectively implemented given the assets under management?
Outcomes
Portfolio Do the historical portfolio holdings and characteristics align with the manager’s philosophy and process?
Performance Given its process, are the drivers of historical performance logical? Are the drivers of returns sustainable over the long term?
One might ask that if these factors are truly effective and so widely used, why has the overall success rate of using active managers not been higher? Two reasons. First, the application of these factors remains subjective, not formulaic, and the human judgment and the robustness of the evaluation process can vary widely. Second, although there are six total factors, the most crucial intersection here is obtaining top talent (those managers who have the skill to outperform) at a low cost. Solving this paradox is not easy. Indeed, many other organizations face significant structural barriers that impede their ability to execute on this key point.

6
9 See Franger (2012).10 Strategic Insight as of June 30, 2012.
Seeking to solve the low-cost/top-talent paradox
Both low cost and top talent are crucial for active management to be successful, and yet it can seem paradoxical that the two would coexist. Presumably, the best managers command higher management fees, while only more desperate, marginal managers would accept a relatively low fee. Yet Vanguard has been adept at delivering top talent at a low cost. And while every firm that engages in finding managers may make similar claims, there are five specific factors that distinguish Vanguard’s active management practice from other firms.
Unique ownership structure helps to provide a decisive cost advantageVanguard is the only mutually owned mutual fund company in the asset management business. This distinction is critical. Vanguard is owned collectively by the funds it operates. These funds in turn are owned by their shareholders.
This unique ownership structure enables the firm to provide its services to the Vanguard funds at cost, devoid of any profit margins built in at other fund companies. As a result, Vanguard charges the Vanguard funds only what it costs Vanguard to provide services to the funds—never an additional layer of fees to pay someone else’s return on capital. By contrast, a firm that has issued public stock to disperse ownership or one that is owned by a small group of private investors is typically obligated to provide those investors with a return on the capital they have invested in the firm. This additional layer of fees may pose a hurdle to providing low-cost funds.
Symmetrical performance-based fees align manager and client interestsAll of Vanguard’s subadvisors are paid a base fee that is a percentage of assets managed. In addition, the vast majority also have their contracts structured with a performance-based incentive fee, which rewards the manager for outperforming the fund’s benchmark. This is rare, as only 3% of all mutual funds are structured with performance fees.9
The SEC mandates that if a manager performance fee is used in a mutual fund, it must be structured symmetrically. As a result, managers are rewarded for outperformance and also penalized for under-performance. While the SEC mandates a minimum of one year for any performance fee, Vanguard typically structures its performance fees for periods of three to five years. The use of performance fees with managers over the long term aligns their interests more closely with those of the investor.
Large scale reduces fee levelsVanguard is the largest user of subadvisors in the world, managing more than $350 billion of mutual fund assets via 30 subadvisors.10 This leads to potentially large individual mandates for each subadvisor, often starting at a billion dollars with the potential to grow from there. Placing these large mandates offers two major benefits to fund shareholders. First, when subadvisors manage large sums of money, the absolute dollar value of management fees they receive can be substantial, even if the percentage fee is relatively small.
Second, managers also recognize the operational benefits of these sizable mandates. It is much easier for subadvisors to handle a single $1 billion relationship with Vanguard than 20 different $50 million relationships. The potential cost to acquire and service 20 different accounts versus 1 can be

7
considerable and managers are acutely aware of this. As a result of both of these factors, scale reduces costs while maintaining the ability to attract top talent.
Long-term perspective attracts talentAnother factor distinctive to Vanguard is the length of time it maintains relationships with individual managers. On average, Vanguard engages managers for more than 13 years,11 demonstrating the firm’s commitment to partnering with talented subadvisors and developing long-term relationships.
This long average tenure, when coupled with large mandates, results in a favorable economic proposition for subadvisors. This beneficial structure is not lost on managers. Indeed, our managers have said that they are more confident that they will be retained by Vanguard for longer periods than their typical tenure with other firms. Therefore, the net present value of the cumulative fees they expect to receive from Vanguard is greater than what they would expect to obtain from relationships that may pay a higher fee but typically do not last as long. As a result, many top-quality managers are eager to work as subadvisors for Vanguard funds even though the annual basis point fees they receive from Vanguard may be lower than what they might otherwise earn.
CEO-led search and oversight process sustains long-term perspectiveVanguard has been committed to both active management and indexing ever since we started our manager search process some 30 years ago. Since then, the Portfolio Review Group (PRG), which is chaired by Vanguard’s CEO and consists of long-tenured senior executives, has overseen all Vanguard funds as well as the hiring and firing of all managers.12 As a result, there have only been
three leaders of the firm’s manager search efforts in the past four decades. Today, PRG is supported by more than 20 investment professionals dedicated to the manager oversight and search process.
PRG’s long-term stability reduces the potential to overreact to short-term events and promotes manager evaluation continuity. In contrast, manager-selection processes that are reliant upon a single decision-maker can increase the likelihood of manager turnover, especially if that particular individual leaves the firm or changes roles. The continued commitment of long-tenured Vanguard CEOs and senior executives to the manager search process is one of the reasons the process has been so consistent through the years.
Vanguard’s active management results—excess return analysis
While the aforementioned section is useful in illustrating how Vanguard has the distinctive ability to attract subadvisors at reasonable fees, it does not, by itself, demonstrate that those subadvisors are skilled. Evidence of Vanguard managers’ talent can be found in their track record of performance, which over the past 30 years has produced positive excess returns versus stated fund benchmarks, resulting in a total benefit to shareholders of $27 billion.13 A deeper analysis of Vanguard active fund performance follows.
The client experienceFrom 1982 to 2012, Vanguard has offered 34 actively managed equity mutual funds.14 To measure the success or failure of these funds, we use three different methodologies to weight the performance impact of each fund. First, we weight each fund equally to analyze the performance of the fund lineup. This method analyzes performance from the perspective of an investor with an equal
11 Indeed, if we excluded recently hired subadvisors (those with Vanguard for five years or less) this average tenure figure rises to more than 17 years.12 PRG has oversight responsibility, but as is the case with all registered mutual funds, the board of trustees has the ultimate fiduciary responsibility.13 Monthly excess returns versus funds’ stated benchmarks were multiplied by monthly assets under management and compounded through time from
January 1982 through June 2012.14 This figure includes stand-alone funds available to retail investors. It does not include fund of funds, which are composed of individual Vanguard active
equity mutual funds, or funds that were offered exclusively to institutional investors. Seven funds were merged or liquidated during the period, but their returns have been included in Vanguard performance calculations in Figure 2. See Appendix A for a list of all actively managed Vanguard equity funds and their respective benchmarks.

8
opportunity or willingness to invest in any of the funds. Second, we measure performance on an asset-weighted basis (funds with more assets under management were given more weight than funds with less assets) to account for what might be the more likely client experience, since an investor is more likely to be invested in a large fund than a small fund. Third, we weight the funds according to Vanguard portfolio-construction guidelines of market proportionality. This last approach excludes specialty funds and counts large-, mid-, and small-cap funds in line with the approximate amount they reflect in the overall market and also incorporates international funds to the degree our advice has suggested (10% to 30% depending on the historical year).
Gauging Vanguard performanceAs Figure 2 illustrates, for all three weighting methodologies over the full term examined, Vanguard provided investors with positive excess returns. An equal-weighted portfolio produced 0.35% of annualized excess return relative to the funds’ stated costless benchmarks. On an asset-weighted basis, the annualized excess return has been 0.59% over the past 30 years. On a market-proportional basis, the typical investor would have experienced 0.24% of annual excess return relative to the costless benchmark. All of these calculations cover a maximum of 30 years and include all Vanguard equity funds that existed during the analysis period, whether the funds survived the entire period or not.
Past performance is not a guarantee of future results.
*The market-proportional-weighted methodology weights the underlying funds according to the approximate Vanguard portfolio-construction guidelines that existed at the time. See Appendix B for additional detail.
Notes: The performance of each Vanguard fund was compared with its stated benchmark using monthly return data from January 1980 through June 2012. The returns for all international, global, and domestic large-, mid-, and small-cap Vanguard active equity funds, including those which were merged or liquidated during the period, were included in the performance calculations. The active equity portions of our balanced funds were excluded. Specialty funds were included in the equal-weighted and asset-weighted portfolios but not in the market-proportional portfolios. In our calculations, the portfolios of Vanguard active equity funds are assumed to be rebalanced monthly to the target weights (as determined by the equal-weighting, asset-weighting, and market-proportional-weighting methodologies) across all Vanguard active equity funds alive in a given month. All fund performance data is net of fees. See Appendix A for a full list of funds.
Source: Vanguard.
Equal-weighted
all fundsAsset-weighted
all funds
Market proportional- weighted*
excludes sector funds
January 1982–June 1992 –0.15% 0.06% –0.01%
July 1992–June 2002 0.94 0.86 0.59
July 2002–June 2012 0.27 0.88 0.14
Entire period 0.35 0.59 0.24
Annualized excess returns of Vanguard funds over their stated benchmarks, net of fees January 1982–June 2012
Figure 2.

9
This analysis compares the Vanguard active funds with their costless benchmarks. If we assume an index fund was available for every costless benchmark at a fee of 20 basis points, then the annualized benefits to investors increase to approximately 0.55% on an equal-weighted basis, 0.79% on an asset-weighted basis, and 0.44% on a market-proportional basis.
Appreciating the pattern of returnsWhile calculations for the entire period are positive using each weighting approach, it is worth noting that this does not imply that for each quarter, year, or even decade, clients experienced a positive result. Indeed the equal-weighted and market-proportional-weighted portfolios for the decade between 1982 and 1992 in Figure 2 illustrate there can be extended
periods of time when managers underperformed or were relatively neutral compared with the benchmark.
Figure 3 further illustrates this fact. In the chart, we display the annual pattern of returns for each of the three different weighting criteria used in Figure 2. We find that the actively managed funds had a relatively random pattern of excess returns—sometimes positive and sometimes negative.
As a result, we conclude that if a given fund or group of funds is able to beat the odds and produce excess returns in the long term, those returns will only be captured by investors who stay committed. Timing markets decreases investors’ chances of success, as does timing managers.15 Instead, to be successful, it’s better for investors to identify low-cost providers able to engage top talent and then hold those actively managed funds over long time horizons.
15 See Goyal (2008) for a further discussion of this topic.
Figure 3. The pattern of Vanguard active fund excess returns (1982–2011)
Note: Vanguard fund performance versus fund stated benchmarks. See Appendix A for more detail. The portfolios of Vanguard active equity funds are rebalanced monthly to the target weights across all Vanguard active equity funds available in a given month; full calendar year from 1982 through 2011.
Source: Vanguard.
1982 1984 1992 1994 199819961986 1988 1990 2000 2002 20102004 2006 2008–5
0
5
10
15
20%
Market-proportionalAsset-weightedEqual-weighted

10
Quantifying the benefitFor perspective, we put relative performance figures of Figure 2 into dollar terms. If an investor had begun investing on July 1, 1982, with $100,000 and allocated their investment based on market-proportional weighting, that investor would have ended on June 30, 2012, with $2.261 million or $164,000 more than had they been able to invest in the costless benchmark16. And while comparing funds that charge a fee to a costless benchmark is a high hurdle, the Vanguard funds have, over time, cleared this hurdle. Certainly there were periods of time when the active funds would have under-performed. Indeed, through 1992 the two approaches were nearly comparable with the active fund portfolio—growing to $883,000 versus the costless benchmark’s $892,000. But because of the compounded impact of positive excess returns, by 2002 a gap had developed where the active funds had grown to $1.339 million when the costless benchmark portfolio would have reached $1.275 million.
Others have found similar positive results for Vanguard funds
We have conducted our analysis using excess return—how a fund did relative to its respective costless benchmark. Others might suggest that an assessment of alpha, not excess return, would also be valuable.17 While examining a fund’s excess return relative to a benchmark offers the audience a
calculation of what an actual investor’s experience would have been relative to a costless benchmark, an analysis of alpha could determine the source of the excess return: Was it security selection or factor tilts that lead to the excess return? Both analyses have their benefits and both have been studied by other researchers.
Reinker (2004) and Rodriguez (2007) found the existence of excess return in Vanguard funds, while Kizer (2005) challenged their findings. But the findings in each of these studies lacked statistical significance. Blanchett (2010), on the other hand, conducted seven different alpha tests on three different groups of Vanguard funds between 1975 and 2008 (making it the longest academic study conducted) and found sizable positive alpha that was statistically significant. Averaging the seven different assessments across all three test groups, Blanchett found that, on average, Vanguard funds produced an annual average positive alpha of 1.08%.18
Vanguard active management results compared with other funds
While comparing Vanguard actively managed funds with their respective costless benchmarks is valuable, it also can be useful to compare Vanguard’s active funds with other active funds. In order to be able to effectively compare Vanguard funds with non-Vanguard funds, data availability restricts us to the following approach19: (i) use a maximum of 15
16 This hypothetical example does not represent the return on any particular investment.17 In discussing our analysis and the research performed by others, we use the term “excess return” to refer to the difference between the geometric returns
of active funds versus their benchmarks. We use the term “alpha” to refer to the outperformance of active funds calculated using a regression model, such as the Fama-French 3-factor model.
18 There are four notable published studies assessing Vanguard’s active funds: Reinker (2004) and Rodriguez (2007), who conducted excess return studies comparing the synthetic portfolios of Vanguard funds versus synthetic portfolios of index funds; Kizer (2005), who runs an analysis using the Fama-French 3-factor model; and Blanchett (2010), who conducts several analyses using the Carhart 4-factor model, a return-based style analysis and various other methods. Reinker (2004) found that an asset-weighted portfolio of Vanguard active U.S. equity funds outperformed a portfolio of U.S. index funds by an average annualized amount of 1.02% over the period of 1977–2003. Reinker (2004) also calculates the excess returns of Vanguard active international equity funds versus a portfolio of international index funds to be 0.71% over the period of 1991–2003. Kizer (2005) argues that the results of Reinker (2004), when adjusted for the size and style overweights inherent in an asset-weighted portfolio of Vanguard active funds, are less favorable. Using the Fama-French 3-factor model, he calculates the difference in performance between Vanguard active equity funds and index equity funds to be –0.21% per year from 1977 to 2003, but the amount is statistically insignificant. Rodriguez (2007) found that a portfolio of Vanguard active equity funds outperformed a portfolio of index funds by 0.46% annually from 2003 to 2006, although the outperformance was not statistically significant at the 95% confidence level. Blanchett (2010) uses seven different tests and three test groups for each to calculate alpha from 1975 to 2008. When the results are averaged together, he reports a statistically significant annualized alpha of 1.08%, with each of the three test groups in all seven tests showing a positive alpha.
19 This methodology differs from the approach used in Figures 2 and 3. When analyzing solely Vanguard funds we are able to use the fund’s stated benchmark; however, to be able to compare Vanguard funds with non-Vanguard active funds we have to use Morningstar’s style benchmarks. This is the same method used in The Case for Indexing.

11
years’ worth of data, (ii) compare active funds that Morningstar categorizes in one of their nine domestic style boxes or three broad international categories, (iii) compare active fund performance with their style box benchmarks, and (iv) assess only those funds that survived the entire period. To conduct the analysis we calculated the median excess returns for two groups of funds—Vanguard active and non-Vanguard active.20 This process excludes those funds that do not align with the selected Morningstar style box categories, such as specialty funds.
Comparison with other active fundsFor the 15 years ended June 30, 2012, we find that the median results of Vanguard active funds compares favorably with the universe of other available actively managed funds. Figure 4 displays the 15-year results, where the excess return for the median actively managed Vanguard fund outperformed the median excess return for the actively managed non-Vanguard fund by 0.84% annually. The results were similar for the ten-year period where the median actively managed Vanguard fund outperformed the median non-Vanguard active fund by 0.90% annually. For the five-year period ended June 30, 2012, the median returns for the Vanguard fund underperformed the median non-Vanguard active fund by 0.03%.
20 In order to accurately compare the performance of funds of various styles, we calculated their excess returns versus relevant benchmarks.
Note: U.S. and international equity (excluding sector/specialty funds), full period survivors only, as of June 30, 2012, load fees are not considered (Vanguard does not charge load fees, but some other firms do), active funds compared with benchmarks based on fund style. Source: Vanguard calculations, using data from Morningstar, Inc., MSCI, Standard & Poor’s, and Barclays Capital. Style benchmarks represented by the following indexes: Large blend—Standard & Poor’s 500 Index, 1/1997 through 11/2002, and MSCI US Prime Market 750 Index thereafter; Large value—S&P 500 Value Index, 1/1997 through 11/2002, and MSCI US Prime Market 750 Value Index thereafter; Large growth—S&P 500 Growth Index, 1/1997 through 11/2002, and MSCI US Prime Market 750 Growth Index thereafter; Medium blend—S&P MidCap 400 Index, 1/1997 through 11/2002, and MSCI US Mid Cap 450 Index thereafter; Medium value—S&P MidCap 400 Value Index, 1/1997 through 11/2002, and MSCI US Mid Cap 450 Value Index thereafter; Medium growth—S&P MidCap 400 Growth Index, 1/1997 through 11/2002, and MSCI US Mid Cap 450 Growth Index thereafter; Small blend—S&P SmallCap 600 Index, 1/1997 through 11/2002, and MSCI US Small Cap 1750 Index thereafter; Small value—S&P SmallCap 600 Value Index, 1/1997 through 11/2002, and MSCI US Small Cap 1750 Value Index thereafter; Small growth—S&P SmallCap 600 Growth Index, 1/1997 through 11/2002, and MSCI US Small Cap 1750 Growth Index thereafter. International and global benchmarks include the following MSCI Indexes: EAFE Index, All Country World Index, and Emerging Markets Index.
Source: Vanguard.
Vanguard active Non-Vanguard active
5 years –0.79% –0.76%
10 years 0.02 –0.88
15 years 0.51 –0.33
Median annualized excess returns, net of fees
Figure 4.

12
21 Vanguard fund expense ratios were equal-weighted when calculating the average.22 This relationship between funds was similar for the 10-year period ended June 30, 2012. During this time the median active Vanguard performance was
0.02% with a distribution of 0.93% to –1.20% (for the 75th and 25th percentiles), all other active funds had a median performance of –0.88% with a distribution of 0.40% (75th percentile) to –2.04% (25th percentile) while index funds had a median performance of 0.21% with a distribution of –0.12% (75th percentile) to –0.42% (25th percentile). The same analysis over five years had the median Vanguard performance at –0.79% with a distribution of 0.56% to –2.10%, all other active funds performance was –0.76% with a distribution of 0.95% to –2.40% while index fund performance was –0.20% with a distribution of –0.05% to –0.43%.
Several conclusions emerge from this data. Over certain long-term time periods, the median Vanguard actively managed equity fund has outperformed relative to the fund’s comparable costless benchmarks. In addition, the median Vanguard active equity fund has outperformed the median non-Vanguard active equity fund over the past 10- and 15-year periods. The core drivers of these results are skilled managers and low cost. Indeed as of June 30, 2012, the average Vanguard active equity fund charges 0.37%, and, according to Morningstar data, this is less expensive than 40% of the U.S. index funds available to investors.21
While the previous analysis has all dealt with median results, it is important to note that the dispersion of returns is typically quite different between active funds and indexed funds. Figure 5 illustrates this point for the two categories of funds used in the prior analysis—Vanguard active funds and non-Vanguard active funds. What we see from this dispersion analysis is that for the 15-year analysis period, while the median excess return for Vanguard active funds was 0.51%, the 75th and 25th percentile outcomes ranged from 1.30% to –0.59%. Additionally, all other active funds had an even wider range of results spanning from 1.02% to –1.77%. At the same time, index funds had a much tighter pattern of results ranging from –0.14% to –0.38%.22 So while the median excess return for Vanguard active funds has been successful, that success comes with a wider dispersion of possible results relative to index funds.
Figure 5. Annualized excess returns versus style benchmarks, net of fees (July 1997–June 2012)
Vanguardactive
Non-Vanguardactive
–5
–4
–3
–2
–1
0
1
2
3
4%
Note: This analysis uses data for 15 Vanguard active funds and 1,032 non-Vanguard active funds alive during the full 15-year period and for which Morningstar data were available. U.S. and international equity (excluding sector/specialty funds), funds are equal-weighted, as of June 30, 2012. Load fees are not considered (Vanguard does not charge load fees, but some other �rms do). Net excess returns are the median annualized fund returns (net of management/operating expenses) of active funds versus their relevant style benchmarks.
Source: Vanguard calculations, using data from Morningstar, Inc., MSCI, Standard & Poor’s, and Barclays Capital. Style benchmarks represented by the following indexes: Large blend—Standard & Poor’s 500 Index, 1/1997 through 11/2002, and MSCI US Prime Market 750 Index thereafter; Large value—S&P 500 Value Index, 1/1997 through 11/2002, and MSCI US Prime Market 750 Value Index thereafter; Large growth—S&P 500 Growth Index, 1/1997 through 11/2002, and MSCI US Prime Market 750 Growth Index thereafter; Medium blend—S&P MidCap 400 Index, 1/1997 through 11/2002, and MSCI US Mid Cap 450 Index thereafter; Medium value—S&P MidCap 400 Value Index, 1/1997 through 11/2002, and MSCI US Mid Cap 450 Value Index thereafter; Medium growth—S&P MidCap 400 Growth Index, 1/1997 through 11/2002, and MSCI US Mid Cap 450 Growth Index thereafter; Small blend—S&P SmallCap 600 Index, 1/1997 through 11/2002, and MSCI US Small Cap 1750 Index thereafter; Small value—S&P SmallCap 600 Value Index, 1/1997 through 11/2002, and MSCI US Small Cap 1750 Value Index thereafter; Small growth—S&P SmallCap 600 Growth Index, 1/1997 through 11/2002, and MSCI US Small Cap 1750 Growth Index thereafter. International and global benchmarks include the following MSCI indexes: EAFE Index, All Country World Index, and Emerging Markets Index.
2.84%
1.30%
0.51%
–0.59%
–3.46%
3.76%
1.02%
–0.33%
–1.77%
–4.41%
95th
75th
50th
25th
5th
Percentile
13
23 For tax cost we use the Morningstar “tax cost ratio” data which measures how much a fund’s annualized return is reduced by taxes paid on distributions.
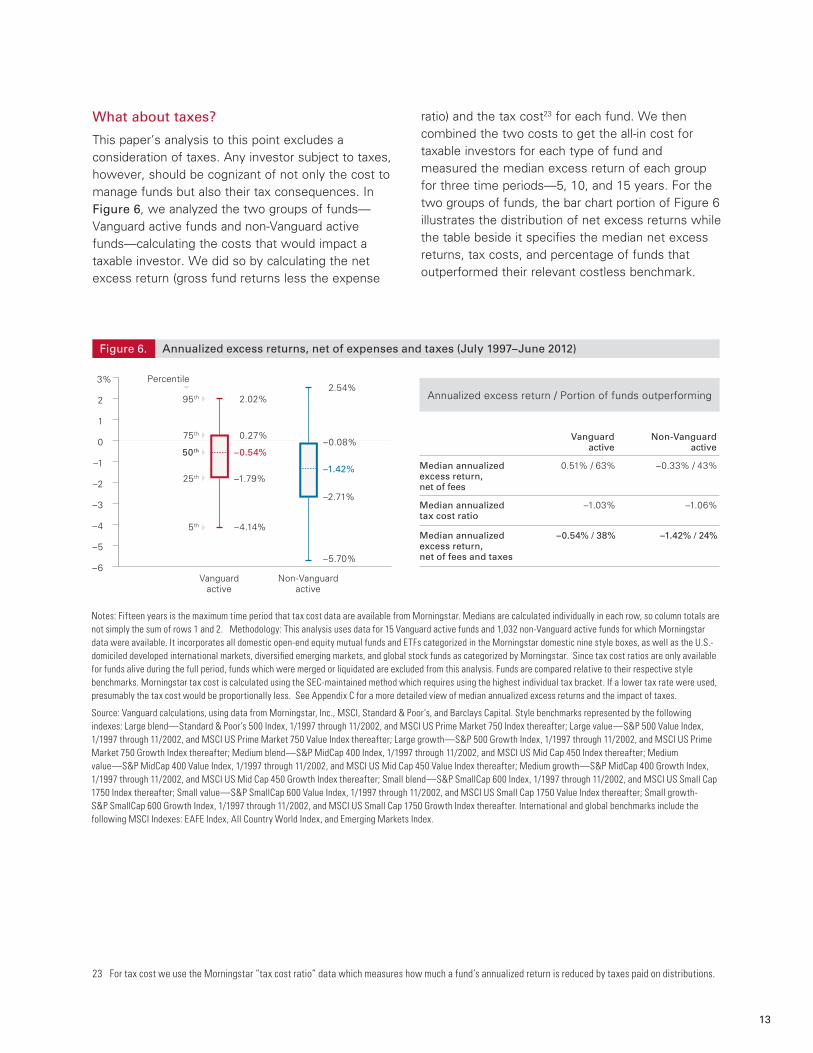
What about taxes?
This paper’s analysis to this point excludes a consideration of taxes. Any investor subject to taxes, however, should be cognizant of not only the cost to manage funds but also their tax consequences. In Figure 6, we analyzed the two groups of funds—Vanguard active funds and non-Vanguard active funds—calculating the costs that would impact a taxable investor. We did so by calculating the net excess return (gross fund returns less the expense
ratio) and the tax cost23 for each fund. We then combined the two costs to get the all-in cost for taxable investors for each type of fund and measured the median excess return of each group for three time periods—5, 10, and 15 years. For the two groups of funds, the bar chart portion of Figure 6 illustrates the distribution of net excess returns while the table beside it specifies the median net excess returns, tax costs, and percentage of funds that outperformed their relevant costless benchmark.
Notes: Fifteen years is the maximum time period that tax cost data are available from Morningstar. Medians are calculated individually in each row, so column totals are not simply the sum of rows 1 and 2. Methodology: This analysis uses data for 15 Vanguard active funds and 1,032 non-Vanguard active funds for which Morningstar data were available. It incorporates all domestic open-end equity mutual funds and ETFs categorized in the Morningstar domestic nine style boxes, as well as the U.S.- domiciled developed international markets, diversi�ed emerging markets, and global stock funds as categorized by Morningstar. Since tax cost ratios are only available for funds alive during the full period, funds which were merged or liquidated are excluded from this analysis. Funds are compared relative to their respective style benchmarks. Morningstar tax cost is calculated using the SEC-maintained method which requires using the highest individual tax bracket. If a lower tax rate were used, presumably the tax cost would be proportionally less. See Appendix C for a more detailed view of median annualized excess returns and the impact of taxes.
Source: Vanguard calculations, using data from Morningstar, Inc., MSCI, Standard & Poor’s, and Barclays Capital. Style benchmarks represented by the following indexes: Large blend—Standard & Poor’s 500 Index, 1/1997 through 11/2002, and MSCI US Prime Market 750 Index thereafter; Large value—S&P 500 Value Index, 1/1997 through 11/2002, and MSCI US Prime Market 750 Value Index thereafter; Large growth—S&P 500 Growth Index, 1/1997 through 11/2002, and MSCI US Prime Market 750 Growth Index thereafter; Medium blend—S&P MidCap 400 Index, 1/1997 through 11/2002, and MSCI US Mid Cap 450 Index thereafter; Medium value—S&P MidCap 400 Value Index, 1/1997 through 11/2002, and MSCI US Mid Cap 450 Value Index thereafter; Medium growth—S&P MidCap 400 Growth Index, 1/1997 through 11/2002, and MSCI US Mid Cap 450 Growth Index thereafter; Small blend—S&P SmallCap 600 Index, 1/1997 through 11/2002, and MSCI US Small Cap 1750 Index thereafter; Small value—S&P SmallCap 600 Value Index, 1/1997 through 11/2002, and MSCI US Small Cap 1750 Value Index thereafter; Small growth-S&P SmallCap 600 Growth Index, 1/1997 through 11/2002, and MSCI US Small Cap 1750 Growth Index thereafter. International and global benchmarks include the following MSCI Indexes: EAFE Index, All Country World Index, and Emerging Markets Index.
Vanguard active
Non-Vanguard active
Median annualizedexcess return, net of fees
0.51% / 63% –0.33% / 43%
Median annualizedtax cost ratio
Annualized excess return / Portion of funds outperforming
–1.03% –1.06%
Median annualizedexcess return,net of fees and taxes
–0.54% / 38% –1.42% / 24%
Vanguardactive
Non-Vanguardactive
–6
–5
–4
–3
–2
–1
0
1
2
3%
2.02%
0.27%
–0.54%
–1.79%
–4.14%
2.54%
–0.08%
–1.42%
–2.71%
–5.70%
95th
75th
50th
25th
5th
Figure 6. Annualized excess returns, net of expenses and taxes (July 1997–June 2012)
Percentile
14
24 The analysis comparing Vanguard active funds with index funds used Morningstar data to identify those index funds with stated benchmarks represented by one of the nine domestic style boxes or the three international style boxes. We calculated the excess return for each index fund relative to its stated benchmark and then calculated the median result for all indexes. For the 15 years ended June 30, 2012, the universe of index funds was composed of 59 funds. The ten-year analysis had 163 index funds and the five-year analysis had 168 funds.
25 See Appendix C.26 Appendix C for the five- and ten-year results.
We find two key results for the 15 years ended June 30, 2012. First, the impact of taxes on individual investors can be considerable. Second, similar to the pre-tax returns, but even more pronounced on an after-tax basis, we find that there was a significant difference between Vanguard funds and other types of funds. Vanguard active funds, for this time period, had a median after-tax performance that was 0.88% better than the comparable median result for non-Vanguard active funds. Indeed, during this time period, the median after-tax Vanguard active fund performance was also 0.54% higher than the median index fund.24
It should be noted that these results cover only one specific time period and over different time periods the results will differ. Indeed, we conducted the same study for ten- and five-year periods ended June 30, 2012. Over the ten-year period, we found similar results with the median Vanguard active fund outperforming the median non-Vanguard active fund by 1.25% annually and outperforming the median index fund by 0.58%. During the five-year period ended June 30, 2012, the median Vanguard active fund produced a result 0.18% higher than the median non-Vanguard active fund.25 Index funds during the past five years outperformed Vanguard active funds by 0.26%.
Some investors might be interested in knowing what aggregate percentage of active funds have outperformed their respective costless benchmarks. In Figure 6, we have included these percentages and find that the figures are quite different on a pre-tax versus after-tax basis. Over 15 years for Vanguard active funds, the pre-tax success ratio is 63% and the after-tax success ratio is 38%. This general relationship also holds true for non-Vanguard active (43% to 24%) and indexed funds (7% to 2%).26 It should be noted that these figures illustrate that while the probability of any individual active fund
outperforming its costless benchmark is modest, particularly after taxes, Vanguard’s funds have done relatively better than other active funds. Some might also be struck by the contrast between the larger number of active funds outperforming the benchmark than index funds, but this is to be expected since the objective of the index is to produce a more consistent return relative to the benchmark, not outperform it. Indeed, among active funds we see a wider dispersion when compared with index funds.
Ultimately, these net-of-fee, net-of-taxes figures are influenced by four factors: (i) the funds’ expense ratios, (ii) investor tax rates, (iii) a manager’s ability to most efficiently manage the changes in their portfolio, and, (iv) the impact of an active manager’s talent on the performance of their fund versus a benchmark. The analysis we have conducted here is subject to all these factors, which can change over time. As a result, for those investors subject to taxes and interested in using actively managed funds, it might be prudent to consider applying an asset location strategy wherein actively managed funds are placed in tax-deferred accounts to the extent such accounts are available.
Conclusion
We believe that successful active management is driven by the combination of low cost and talent. While it is intuitive that lower fees should reduce the hurdles necessary to outperform a benchmark, low costs alone cannot guarantee active management success. On average, most active managers have underperformed their benchmarks and the managers who have succeeded over long time periods are rare. Herein lies an apparent paradox: In order to achieve success, one must engage rare talent at a low cost.
15
Despite this seemingly difficult hurdle, Vanguard has been able to successfully deliver actively managed equity funds. Over long periods of time, the median Vanguard active equity fund has outperformed its stated costless benchmark as well as the median non-Vanguard active equity fund.
Five distinctive corporate characteristics, mutual ownership, large scale, performance fees, long-term perspective, and a CEO-led oversight process, combined with a rigorous manager oversight and search process, have enabled Vanguard to deliver low-cost, high-quality active management. Indeed, the median costs of Vanguard active funds have been so low that they cost less than 40% of all available index funds. Even after tax costs are considered, Vanguard active equity funds have done well —outperforming non-Vanguard active equity funds over the last 5-, 10-, and 15-year periods.
While Vanguard active funds have been successful, the use of any active fund comes with volatility that can affect investors in two ways. First, there can be extensive periods when the return on a group of active funds underperforms their respective benchmarks or comparable index funds. Second, even when the return on an aggregate group of funds does well, certain individual funds within the overall cohort can still do poorly. Therefore, individual fund selection will influence an investor’s results.
As a result, given the inherent volatility of any individual active fund, only those investors comfortable with what could be extensive periods of underperformance should consider actively managed funds. Timing managers is as counterproductive as timing markets, offering little prospect of success. Instead, for investors to have the chance to be
successful using active management, they need to be able to obtain top talent at low cost and have the discipline to stick with it over the long term.
In the end, we find that the most crucial factor is low cost. While indexing has, to many, become synonymous with low cost, the historical data actually shows a more nuanced reality—low cost, and therefore improved odds of investor success—can exist in both active and indexed funds.
16
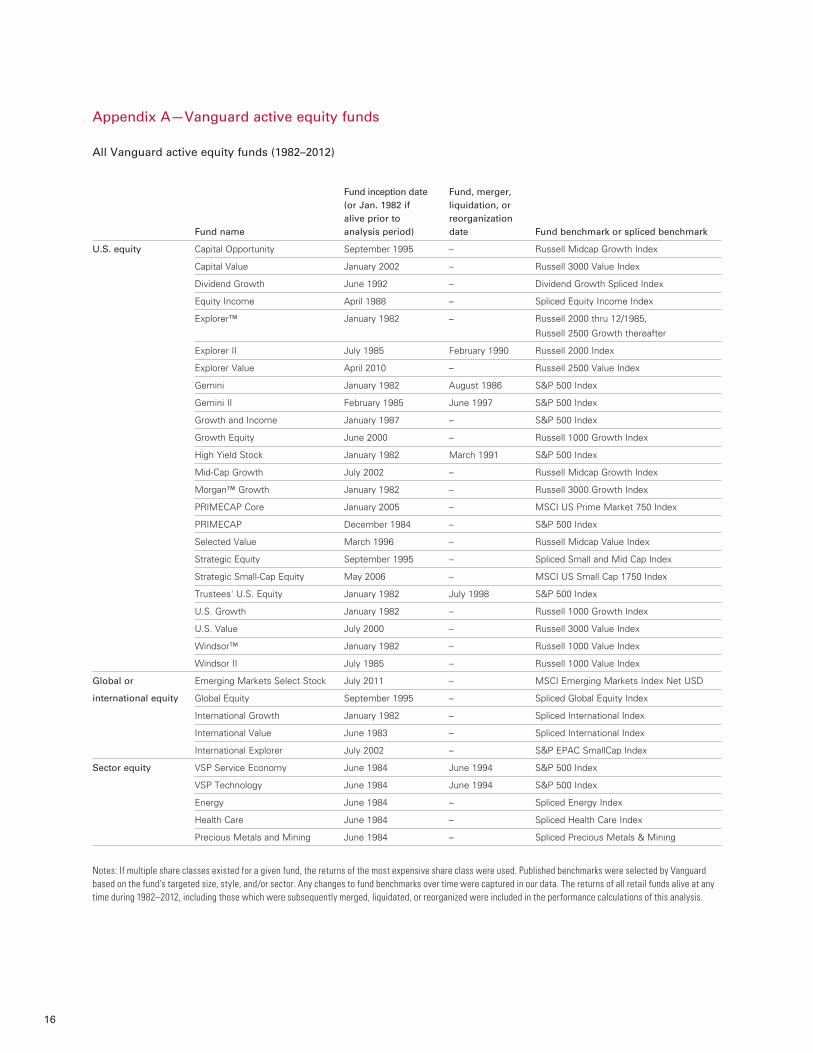
Appendix A—Vanguard active equity funds
All Vanguard active equity funds (1982–2012)
Fund name
Fund inception date (or Jan. 1982 if alive prior to analysis period)
Fund, merger, liquidation, or reorganization date Fund benchmark or spliced benchmark
U.S. equity Capital Opportunity September 1995 – Russell Midcap Growth Index
Capital Value January 2002 – Russell 3000 Value Index
Dividend Growth June 1992 – Dividend Growth Spliced Index
Equity Income April 1988 – Spliced Equity Income Index
Explorer™ January 1982 – Russell 2000 thru 12/1985,
Russell 2500 Growth thereafter
Explorer II July 1985 February 1990 Russell 2000 Index
Explorer Value April 2010 – Russell 2500 Value Index
Gemini January 1982 August 1986 S&P 500 Index
Gemini II February 1985 June 1997 S&P 500 Index
Growth and Income January 1987 – S&P 500 Index
Growth Equity June 2000 – Russell 1000 Growth Index
High Yield Stock January 1982 March 1991 S&P 500 Index
Mid-Cap Growth July 2002 – Russell Midcap Growth Index
Morgan™ Growth January 1982 – Russell 3000 Growth Index
PRIMECAP Core January 2005 – MSCI US Prime Market 750 Index
PRIMECAP December 1984 – S&P 500 Index
Selected Value March 1996 – Russell Midcap Value Index
Strategic Equity September 1995 – Spliced Small and Mid Cap Index
Strategic Small-Cap Equity May 2006 – MSCI US Small Cap 1750 Index
Trustees' U.S. Equity January 1982 July 1998 S&P 500 Index
U.S. Growth January 1982 – Russell 1000 Growth Index
U.S. Value July 2000 – Russell 3000 Value Index
Windsor™ January 1982 – Russell 1000 Value Index
Windsor II July 1985 – Russell 1000 Value Index
Global or
international equity
Emerging Markets Select Stock July 2011 – MSCI Emerging Markets Index Net USD
Global Equity September 1995 – Spliced Global Equity Index
International Growth January 1982 – Spliced International Index
International Value June 1983 – Spliced International Index
International Explorer July 2002 – S&P EPAC SmallCap Index
Sector equity VSP Service Economy June 1984 June 1994 S&P 500 Index
VSP Technology June 1984 June 1994 S&P 500 Index
Energy June 1984 – Spliced Energy Index
Health Care June 1984 – Spliced Health Care Index
Precious Metals and Mining June 1984 – Spliced Precious Metals & Mining
Notes: If multiple share classes existed for a given fund, the returns of the most expensive share class were used. Published benchmarks were selected by Vanguard based on the fund’s targeted size, style, and/or sector. Any changes to fund benchmarks over time were captured in our data. The returns of all retail funds alive at any time during 1982–2012, including those which were subsequently merged, liquidated, or reorganized were included in the performance calculations of this analysis.
17
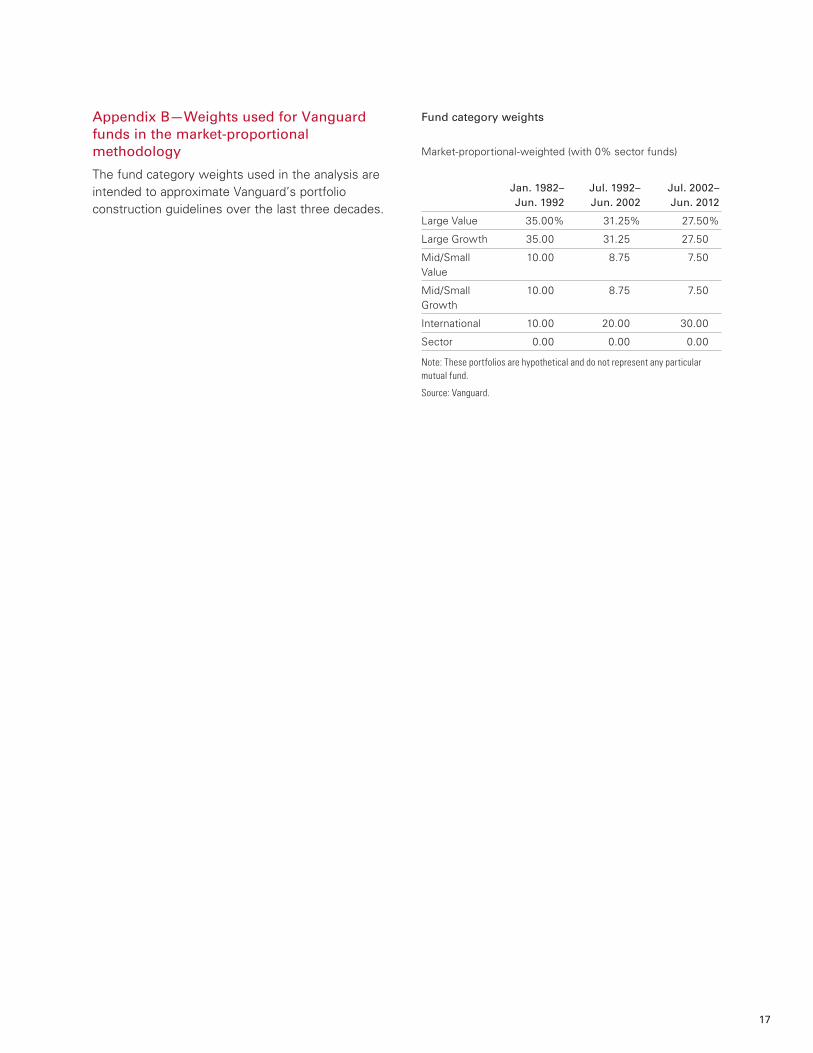
Note: These portfolios are hypothetical and do not represent any particular mutual fund.
Source: Vanguard.
Jan. 1982– Jun. 1992
Jul. 1992– Jun. 2002
Jul. 2002– Jun. 2012
Large Value 35.00% 31.25% 27.50%
Large Growth 35.00 31.25 27.50
Mid/Small Value
10.00 8.75 7.50
Mid/Small Growth
10.00 8.75 7.50
International 10.00 20.00 30.00
Sector 0.00 0.00 0.00
Market-proportional-weighted (with 0% sector funds)
Fund category weightsAppendix B—Weights used for Vanguard funds in the market-proportional methodology
The fund category weights used in the analysis are intended to approximate Vanguard’s portfolio construction guidelines over the last three decades.

18
Appendix C
5 years—Annualized excess returns, net of taxes and fees 10 years—Annualized excess returns, net of taxes and fees
Notes: U.S. and international equity (excluding sector/specialty funds), full period survivors only, as of June 30, 2012, load fees are not considered (Vanguard does not charge load fees, but some other rms do). Medians in each row are calculated individually, so column totals are not simply a sum of rows 1 and 2. Tax cost ratios are pulled from Morningstar for the time periods specied. Net excess returns are the median annualized fund returns (net of management/operating expenses) of active funds versus their style benchmarks.
Source: Vanguard calculations, using data from Morningstar, Inc., MSCI, Standard & Poor’s, and Barclays Capital. Style benchmarks represented by the following indexes: Large blend—Standard & Poor’s 500 Index, 1/1997 through 11/2002, and MSCI US Prime Market 750 Index thereafter; Large value—S&P 500 Value Index, 1/1997 through 11/2002, and MSCI US Prime Market 750 Value Index thereafter; Large growth—S&P 500 Growth Index, 1/1997 through 11/2002, and MSCI US Prime Market 750 Growth Index thereafter; Medium blend—S&P MidCap 400 Index, 1/1997 through 11/2002, and MSCI US Mid Cap 450 Index thereafter; Medium value—S&P MidCap 400 Value Index, 1/1997 through 11/2002, and MSCI US Mid Cap 450 Value Index thereafter; Medium growth—S&P MidCap 400 Growth Index, 1/1997 through 11/2002, and MSCI US Mid Cap 450 Growth Index thereafter; Small blend—S&P SmallCap 600 Index, 1/1997 through 11/2002, and MSCI US Small Cap 1750 Index thereafter; Small value—S&P SmallCap 600 Value Index, 1/1997 through 11/2002, and MSCI US Small Cap 1750 Value Index thereafter; Small growth-S&P SmallCap 600 Growth Index, 1/1997 through 11/2002, and MSCI US Small Cap 1750 Growth Index thereafter. International and global benchmarks include the following MSCI Indexes: EAFE Index, All Country World Index, and Emerging Markets Index.
Tax cost ratios are pulled from Morningstar for the time periods specied.
Median annualized excess returns and tax cost ratios / % of outperformers
Vanguardactive
Non-Vanguardactive
–5
–6
–7
–4
–3
–2
–1
0
1
2
3
4%
Vanguardactive
Non-Vanguardactive
–5
–6
–7
–4
–3
–2
–1
0
1
2
3
4%
2.32%
–0.10%
–1.28%
–2.57%
–3.23%
3.18%
–0.18%
–1.46%
–3.11%
–6.07%
0.80%
0.16%–0.28%
–1.66%
–2.54%
1.95%
–0.33%
–1.53%
–2.74%
–4.91%
95th
75th
50th
25th
5th
95th
75th
50th
25th
5th
Vanguard active
Non-Vanguard active
Median annualizedexcess return, net of fees
–0.79% / 39% –0.76% / 38%
Median annualizedtax cost ratio
–0.59% –0.64%
Median annualizedexcess return,net of fees and taxes
–1.28% / 22% –1.46% / 28%
Vanguard active
Non-Vanguard active
Median annualizedexcess return, net of fees
–0.02% / 53% –0.88% / 32%
Median annualizedtax cost ratio
–0.52% –0.65%
Median annualizedexcess return,net of fees and taxes
–0.28% / 37% –1.53% / 20%
Percentile
Percentile

19
Appendix D
References
Adams, John C., Sattar Mansi, and Takeshi Nishikawa, 2011. Public vs Private Ownership, Board Structure and Fund Manager Turnover. Available at SSRN: http://ssrn.com/abstract=1492846 or http://dx.doi.org/10.2139/ssrn.1492846
Blanchett, David M., 2010. Exploring the “Good Guys”: An Empirical Study of Vanguard’s Actively Managed Domestic Equity Mutual Funds. The Journal of Investing. 19(2): 39–48.
Bogle, John C., 2012. The Clash of the Cultures: Investment vs. Speculation. Hoboken, N.J. John Wiley & Sons.
Brown, Stephen J., and William N. Goetzmann, 1995. Performance Persistence. The Journal of Finance 50(2): 679–698.
Carhart, Mark M., 1997. On Persistence in Mutual Fund Performance. The Journal of Finance 52(1): 57–82.
Fama, Eugene F., and Kenneth R. French, 2010. Luck Versus Skill in the Cross-Section of Mutual Fund Returns. The Journal of Finance 65(5): 1915–1947.
Financial Research Corporation, 2002. Predicting Mutual Fund Performance II: After the Bear. Boston: Financial Research Corporation.
Franger, Sasha, 2012. Performance Incentive Fee Funds Post Downturn. Thomson Reuters.
Goyal, Amit, and Sunil Wahal, 2008. The Selection and Termination of Investment Management Firms by Plan Sponsors. The Journal of Finance 63(4): 1805–1847.
Jones, Robert C., and Russ Wermers, 2011. Active Management in Mostly Efficient Markets. Financial Analysts Journal. 67(6): 29–45.
Kinnel, Russel, 2010. How Expense Ratios and Star Ratings Predict Success. Morningstar Fund Investor. Volume 18, Number 12.
Kizer, Jared, 2005. Index Fundamentalism Revisited—Redux. The Journal of Portfolio Management. 31(2): 112–119.
Malkiel, Burton G., 2004. Can Predictable Patterns in Market Returns Be Exploited Using Real Money? The Journal of Portfolio Management (30th Anniversary Issue): 131–41.
Marks, Howard, 2012. It’s All a Big Mistake. Oaktree Capital Management.
Notes: U.S. and international equity (excluding sector/specialty funds), full period survivors only, as of June 30, 2012. Median expense ratios for Vanguard active and non-Vanguard active for the past 10 years were 0.48% and 1.17%, respectively and for the past 5 years were 0.41% and 1.13%, respectively.
Sources: Vanguard calculations using data from Morningstar.
Annualized impact of expense ratios,15 years ended June 30, 2012
Vanguardactive
Non-Vanguardactive
–2.0
–1.5
–1.0
–0.5
0.0%
–0.36%–0.37%–0.47%–0.57%–0.70% –0.69%
–0.95%
–1.17%
–1.44%
–1.91%
95th
75th
50th
25th
5th
Percentile

20
Molitor, Jeffrey S., 2008. Evaluating Managers: Are We Sending the Right Messages? Valley Forge, Pa.: The Vanguard Group.
Morningstar Analyst Rating for Funds, 2011. Morningstar, Inc.
Philips, Christopher B., and Francis M. Kinniry Jr., 2009. The Active-Passive Debate: Market Cyclicality and Leadership Volatility. Valley Forge, Pa.: The Vanguard Group.
Philips, Christopher B., and Francis M. Kinniry Jr., 2010. Mutual Fund Ratings and Future Performance. Valley Forge, Pa.: The Vanguard Group.
Philips, Christopher B., 2012. The Case for Indexing. Valley Forge, Pa.: The Vanguard Group.
Reinker, Kenneth S., and Edward Tower, 2004. Index Fundamentalism Revisited. The Journal of Portfolio Management.
Reinker, Kenneth S., and Edward Tower, 2005. Are Vanguard’s Managers Good Stock-Pickers or Style-Pickers? The Journal of Porfolio Management. 31(3): 109–111.
Rodriguez, Abel, and Edward Tower, 2007. Do Vanguard’s Managed Funds Beat Its Index Funds? Looking for Prescient Stock and Style Selection.
Schlanger, Todd, Christopher B. Philips, and Karin Peterson LaBarge. The Search for Outperformance: Evaluating ‘Active Share’. Valley Forge, Pa.: The Vanguard Group.
Sharpe, William F., 1991. The Arithmetic of Active Management. Financial Analysts Journal 47(1): 7–9.
Sharpe, William F., 1992. Asset Allocation: Management Style and Performance Measurement. The Journal of Portfolio Management. 18(2): 7–19.
Wallick, Daniel W., Neeraj Bhatia, Andrew S. Clarke, and Raphael A. Stern, 2011. Shopping for Alpha: You Get What You Don’t Pay For. Valley Forge, Pa.: The Vanguard Group.

Vanguard research > Vanguard Center for Retirement Research Vanguard Investment Counseling & Research Vanguard Investment Strategy Group
E-mail > [email protected]
For more information about Vanguard funds, visit vanguard.com or call 800-662-2739 to obtain a prospectus. Investment objectives, risks, charges, expenses, and other important information about a fund are contained in the prospectus; read and consider it carefully before investing.
CFA® is a trademark owned by CFA Institute.
The funds or securities referred to herein are not sponsored, endorsed, or promoted by MSCI, MSCI US Prime Market 750, MSCI US Small Cap 1750, MSCI Emerging Markets Index Net USD, and MSCI bears no liability with respect to any such funds or securities. The prospectus or the Statement of Additional Information contains a more detailed description of the limited relationship MSCI has with Vanguard and any related funds.
S&P 500® and S&P EPAC SmallCap Index are registered trademarks of Standard & Poor’s Financial Services LLC (“S&P”) and have been licensed for use by Vanguard. The Vanguard funds are not sponsored, endorsed, sold or promoted by S&P or its affiliates, and S&P, its affiliates and all of their third-party licensors disclaim any and all warranties and representations, express or implied, including any warranties of merchantability or fitness for a particular purpose or use as to the S&P index data. Vanguard makes no representation regarding the advisability of investing in third-party products that utilize S&P indexes.
The Russell Midcap Growth Index, Russell 3000 Value Index, Russell 2000 Index, Russell 2500 Growth, Russell 2500 Value Index, Russell 1000 Growth Index, Russell Midcap Growth Index, Russell 3000 Growth Index, Russell Midcap Value Index, Russell 3000 Index, Russell 3000 Value Index, Russell 1000 Value Index, and Russell® are registered trademarks of Russell Investments and have been licensed for use by The Vanguard Group, Inc. The Product(s) are not sponsored, endorsed, sold or promoted by Russell Investments and Russell Investments makes no representation regarding the advisability of investing in the Products.
P.O. Box 2600 Valley Forge, PA 19482-2600
© 2013 The Vanguard Group, Inc. All rights reserved. Vanguard Marketing Corporation, Distributor.
ICRTPX 012013
Connect with Vanguard® > vanguard.com