industrial enginnering dep, sharif university of technologyie.sharif.edu/~fvalilai/resources/pm/11...
TRANSCRIPT

12/26/2013
1
International Campus – Kish
Sharif University of Technology
Session#11
Instructor
Omid Fatahi Valilai, Ph.D. Industrial Engineering Department, Sharif University of Technology
Email: [email protected] , Tel: 021-6616-5706
Web site: http://sharif.edu/~fvalilai
Class time
Thursday 09:30~12:30-13:00~16:00- 16:30~19:30
Course evaluation
Mid-term (30%)
Final exam (40%)
Quiz (10%)
Exercise (20%)
International Campus – Kish, Sharif University of Technology
PM (Project Management), Session#11
2

12/26/2013
2
Mid-term session:
23rd, Aban 1392
Reference:
Kerzner, H., “Project Management—A Systems Approach to Planning, Scheduling, and Controlling, Eighth Edition”, 2003, John Wiley & Sons, Inc.
Lewis, James P.; “Project planning, scheduling, and Control a hands-on guide to bringing projects in on time and on budget”, 2001, McGraw-Hill
Project Management Institute; “A Guide to the Project; Management Body of Knowledge”, 5th edition, 2013, Project Management Institute, Inc.
International Campus – Kish, Sharif University of Technology
PM (Project Management), Session#11
3
Course Calendar:
International Campus – Kish, Sharif University of Technology
PM (Project Management), Session#11
4

12/26/2013
3
Contents:
Chapter 1 - Overview
Chapter 2 - Project Management Growth—Concepts and Definitions
Chapter 3 - Organizational Structures
Chapter 4 - Organizing and Staffing the Project Office and Team
Chapter 5 - Management Functions
Chapter 6 - Time Management and Stress
Chapter 7 - Conflicts
Chapter 8 - Special Topics
Chapter 9 - The Variables for Success
Chapter 10 - Working with Executives
Chapter 11 - Planning
International Campus – Kish, Sharif University of Technology
PM (Project Management), Session#11
5
Contents:
Chapter 12 - Network Scheduling
Chapter 13 - Project Graphics
Chapter 14 - Pricing and Estimating
Chapter 15 - Cost Control
Chapter 16 - Trade-off Analysis in a Project Environment
Chapter 17 - Risk Management
Chapter 18 - Learning Curves
Chapter 19 - Modern Developments in Project Management
Chapter 20 - Quality Management
Chapter 21 - Contracts and Procurement
Chapter 22 - Critical Chain Project Management
International Campus – Kish, Sharif University of Technology
PM (Project Management), Session#11
6

12/26/2013
4
Introduction A critical tool employed by a project manager is configuration management or configuration change
control.
As projects progress downstream through the various life-cycle phases, the cost of engineering changes can grow boundlessly.
Configuration management is a control technique, through an orderly process, for formal review and approval of configuration changes. If properly implemented, configuration management provides
Appropriate levels of review and approval for changes
Focal points for those seeking to make changes
A single point of input to contracting representatives in the customer's and contractor's office for approved changes
International Campus – Kish, Sharif University of Technology
PM (Project Management), Session#11
7
Introduction
Management is continually seeking new and better control techniques to cope with the complexities,
masses of data, and tight deadlines that are characteristic of highly competitive industries. Managers
also want better methods for presenting technical and cost data to customers.
Scheduling techniques help achieve these goals. The most common techniques are:
Gantt or bar charts
Milestone charts
Networks
Program Evaluation and Review Technique (PERT)
Arrow Diagram Method (ADM) [Sometimes called the Critical Path Method (CPM)]
Precedence Diagram Method (PDM)
Graphical Evaluation and Review Technique (GERT)
International Campus – Kish, Sharif University of Technology
PM (Project Management), Session#11
8

12/26/2013
5
Program Evaluation and Review Technique (PERT)
International Campus – Kish, Sharif University of Technology
PM (Project Management), Session#11
9
Program Evaluation and Review Technique (PERT)
A big advantage of PERT lies in its extensive planning.
PERT therefore determines where the greatest effort should be made to keep a project on schedule.
The second advantage of PERT is that one can determine the probability of meeting deadlines by development of alternative plans.
If the decision maker is statistically sophisticated, he can examine the standard deviations and the probability of accomplishment data.
A third advantage is the ability to evaluate the effect of changes in the program.
PERT can evaluate the effect of a contemplated shift of resources from the less critical activities to the activities identified as probable bottlenecks.
Finally, PERT allows a large amount of sophisticated data to be presented in a well-organized diagram from which contractors and customers can make joint decisions.
International Campus – Kish, Sharif University of Technology
PM (Project Management), Session#11
10

12/26/2013
6
Network fundamentals
Interdependencies are shown through the
construction of networks. Network analysis can
provide valuable information for planning,
integration of plans, time studies, scheduling, and
resource management.
Networks are composed of events and activities.
An event is defined as the starting or ending point for a
group of activities, and
An activity is the work required to proceed from one
event or point in time to another.
International Campus – Kish, Sharif University of Technology
PM (Project Management), Session#11
11
Network fundamentals
International Campus – Kish, Sharif University of Technology
PM (Project Management), Session#11
12
12/26/2013
7
Network fundamentals
International Campus – Kish, Sharif University of Technology
PM (Project Management), Session#11
13
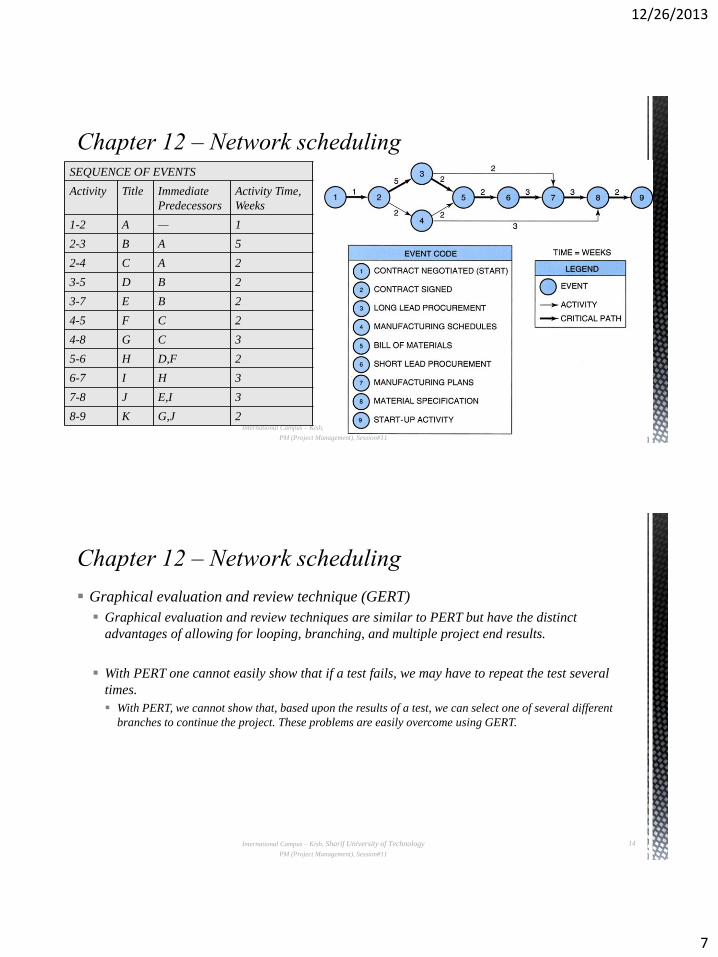
SEQUENCE OF EVENTS
Activity Title Immediate
Predecessors
Activity Time,
Weeks
1-2 A — 1
2-3 B A 5
2-4 C A 2
3-5 D B 2
3-7 E B 2
4-5 F C 2
4-8 G C 3
5-6 H D,F 2
6-7 I H 3
7-8 J E,I 3
8-9 K G,J 2
Graphical evaluation and review technique (GERT)
Graphical evaluation and review techniques are similar to PERT but have the distinct
advantages of allowing for looping, branching, and multiple project end results.
With PERT one cannot easily show that if a test fails, we may have to repeat the test several
times.
With PERT, we cannot show that, based upon the results of a test, we can select one of several different
branches to continue the project. These problems are easily overcome using GERT.
International Campus – Kish, Sharif University of Technology
PM (Project Management), Session#11
14

12/26/2013
8
Graphical evaluation and review technique (GERT)
There are three basic types of interrelationships or
dependencies:
Mandatory dependencies (i.e., hard logic): These are
dependencies that cannot change, such as erecting the walls of
a house before putting up the roof.
Discretionary dependencies (i.e., soft logic): These are
dependencies that may be at the discretion of the project
manager or may simply change from project to project. As an
example, one does not need to complete the entire bill of
materials prior to beginning procurement.
External dependencies: These are dependencies that may be
beyond the control of the project manager such as having
contractors sit on your critical path.
International Campus – Kish, Sharif University of Technology
PM (Project Management), Session#11
15
Graphical evaluation and review
technique (GERT)
Since there exists only one path through
the network that is the longest, the other
paths must be either equal in length to or
shorter than that path.
Therefore, there must exist events and
activities that can be completed before the
time when they are actually needed.
The time differential between the
scheduled completion date and the
required date to meet critical path is
referred to as the slack time
International Campus – Kish, Sharif University of Technology
PM (Project Management), Session#11
16

12/26/2013
9
Graphical evaluation and review technique (GERT)
Slack can be defined as the difference between the latest allowable date and the earliest
expected date based on the nomenclature below:
TE = the earliest time (date) on which an event can be expected to take place
TL = the latest date on which an event can take place without extending the completion date of
the project
Slack time = TL − TE
International Campus – Kish, Sharif University of Technology
PM (Project Management), Session#11
17
Graphical evaluation and review technique (GERT)
Some people prefer to calculate the earliest and latest times for each activity instead. Also, the
earliest and latest times were identified simply as the time or date when an event can be
expected to take place. To make full use of the capabilities of PERT/CPM, we could identify
four values:
The earliest time when an activity can start (ES)
The earliest time when an activity can finish (EF)
The latest time when an activity can start (LS)
The latest time when an activity can finish (LF)
International Campus – Kish, Sharif University of Technology
PM (Project Management), Session#11
18

12/26/2013
10
Graphical evaluation and review technique (GERT)
International Campus – Kish, Sharif University of Technology
PM (Project Management), Session#11
19
Slack time
When performing a forward pass through a network, we work from left to right beginning at the customer's starting milestone (position 1).
The backward pass, however, begins at the customer's end date milestone (position 2), not (as is often taught in the classroom) where the forward pass ends. If the forward pass ends at position 3, which is before the customer's end date, it is possible to have slack on the critical path.
This slack is often called reserve time and may be added to other activities or filled with activities such as report writing so that the forward pass will extend to the customer's completion date.
International Campus – Kish, Sharif University of Technology
PM (Project Management), Session#11
20
12/26/2013
11
Slack time
Negative slack usually occurs when the forward pass extends beyond the customer's end date.
However, the backward pass is still measured from the customer's completion date, thus creating
negative slack.
This is most likely to result when:
The original plan was highly optimistic, but unrealistic
The customer's end date was unrealistic
One or more activities slipped during project execution
The assigned resources did not possess the correct skill levels
The required resources would not be available until a later date
International Campus – Kish, Sharif University of Technology
PM (Project Management), Session#11
21
Estimating activity time Determining the elapsed time between events requires that responsible functional managers evaluate
the situation and submit their best estimates.
The calculations for critical paths and slack times in the previous sections were based on these best estimates.
Many programs, however, include events and activities that are non-repetitive. In this case, the functional managers must submit their estimates using three possible completion assumptions:
Most optimistic completion time. This time assumes that everything will go according to plan and with minimal difficulties. This should occur approximately 1 percent of the time.
Most pessimistic completion time. This time assumes that everything will not go according to plan and maximum difficulties will develop. This should also occur approximately 1 percent of the time.
Most likely completion time. This is the time that, in the mind of the functional manager, would most often occur should this effort be reported over and over again
International Campus – Kish, Sharif University of Technology
PM (Project Management), Session#11
22
12/26/2013
12
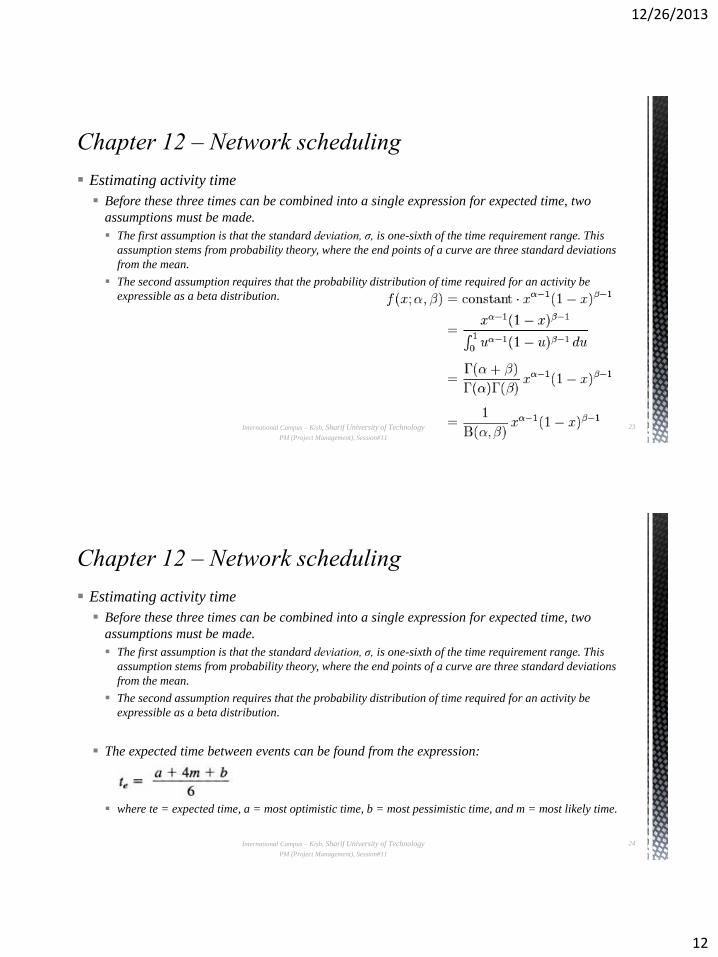
Estimating activity time
Before these three times can be combined into a single expression for expected time, two
assumptions must be made.
The first assumption is that the standard deviation, σ, is one-sixth of the time requirement range. This
assumption stems from probability theory, where the end points of a curve are three standard deviations
from the mean.
The second assumption requires that the probability distribution of time required for an activity be
expressible as a beta distribution.
International Campus – Kish, Sharif University of Technology
PM (Project Management), Session#11
23
Estimating activity time
Before these three times can be combined into a single expression for expected time, two
assumptions must be made.
The first assumption is that the standard deviation, σ, is one-sixth of the time requirement range. This
assumption stems from probability theory, where the end points of a curve are three standard deviations
from the mean.
The second assumption requires that the probability distribution of time required for an activity be
expressible as a beta distribution.
The expected time between events can be found from the expression:
where te = expected time, a = most optimistic time, b = most pessimistic time, and m = most likely time.
International Campus – Kish, Sharif University of Technology
PM (Project Management), Session#11
24

12/26/2013
13
Estimating total program time
In order to calculate the probability of completing the project on time, the standard deviations of
each activity must be known. This can be found from the expression:
International Campus – Kish, Sharif University of Technology
PM (Project Management), Session#11
25
Total PERT/CPM planning
PERT scheduling is a six-step process.
Steps one and two begin with the project manager laying out a list of activities to be performed and then placing these activities in order of precedence, thus identifying the interrelationships. These charts drawn by the project manager are called either logic charts, arrow diagrams, work flow, or simply networks.
The activity time is not identified, and neither is the critical path.
Step three is reviewing the arrow diagrams with the line managers (i.e., the true experts) in order to obtain their assurance that neither too many nor too few activities are identified, and that the interrelationships are correct.
In step four the functional manager converts the arrow diagram to a PERT chart by identifying the time duration for each activity.
It should be noted here that the time estimates that the line managers provide are based on the assumption of unlimited resources because the calendar dates have not yet been defined.
International Campus – Kish, Sharif University of Technology
PM (Project Management), Session#11
26

12/26/2013
14
Total PERT/CPM planning
PERT scheduling is a six-step process.
Step five is the first iteration on the critical path. It is here that the project manager looks at the critical
calendar dates in the definition of the project's requirements.
If the critical path does not satisfy the calendar requirements, then the project manager must try to
shorten the critical path using methods or by asking the line managers to take the "fat" out of their
estimates.
Step six is often the most overlooked step. Here the project manager places calendar dates on each event in
the PERT chart, thus converting from planning under unlimited resources to planning with limited
resources.
If the line manager cannot commit to the calendar dates, then replanning will be necessary.
International Campus – Kish, Sharif University of Technology
PM (Project Management), Session#11
27
Precedence networks
International Campus – Kish, Sharif University of Technology
PM (Project Management), Session#11
28

12/26/2013
15
Lag
The time period between the early start or finish of
one activity and the early start or finish of another
activity in the sequential chain is called lag.
Lag is most commonly used in conjunction with
precedence networks
International Campus – Kish, Sharif University of Technology
PM (Project Management), Session#11
29