induces tachycardia in freely moving mice aversive emotion
TRANSCRIPT
Page 1/23
Aversive Emotion Activates Orexin Neurons andInduces Tachycardia in Freely Moving MiceAkira Yamashita
Kagoshima University: Kagoshima DaigakuShunpei Moriya
Kagoshima University: Kagoshima DaigakuRyusei Nishi
Kagoshima University: Kagoshima DaigakuJun Kaminosono
Kagoshima University: Kagoshima DaigakuAkihiro Yamanaka
Nagoya University: Nagoya DaigakuTomoyuki KUWAKI ( [email protected] )
Kagoshima Daigaku https://orcid.org/0000-0003-4226-3610
Research
Keywords: aversive emotion, stress, orexin, defense response, �ber photometry
Posted Date: December 1st, 2020
DOI: https://doi.org/10.21203/rs.3.rs-115888/v1
License: This work is licensed under a Creative Commons Attribution 4.0 International License. ReadFull License

Page 2/23
AbstractStress affects the sensory and negative emotional components in the brain and causes autonomicresponses and aversive emotion. However, the possible roles for the negative emotional component remainlargely unclear. The perifornical area of the hypothalamus has been known as the center for the defenseresponse, or �ght-or-�ight response, which is characterized by a concomitant rise in arterial blood pressure,heart rate, and respiratory frequency. Orexin neurons located in that region are suggested to be a criticalpopulation responsible for that response. In this study, we examined the suggestion by recording orexinneuronal activity and heart rate in freely moving mice using an original dual-channel �ber photometrysystem in vivo. Association analysis between orexin neuronal activity and aversive stress-inducedautonomic responses revealed a rapid increase in neuronal activity just prior to changes in heart rate. Inaddition, we examined whether orexin neurons would be activated by a conditioned neutral sound that waspreviously associated with aversive stimulus. We show that the negative emotional memory indeedactivated orexin neurons and increased heart rate. Our data suggest that orexin neurons are the keycomponent required to receive aversive emotion and link it with an autonomic defense response. Our dataalso suggest that targeting orexin neurons may enable treatment of psychiatric disorders that result fromchronic stress and occur long after the original sensory inputs are gone.
IntroductionStress is often mistakenly thought of as being purely detrimental. While it is true that excessive stressgenerally has negative effects that can cause various mental disorders and emotional disturbances1,responses to acute stress can be bene�cial and even indispensable for life because they protect againstpotential sources of danger. Acute stress induces a rise in blood pressure, heart rate, respiration, and stress-induced analgesia. These autonomic changes are collectively called the defense response and prepare forand support �ght-or-�ight behavior2. We previously found that orexin-producing neurons in thehypothalamus play a crucial role in this defense response because it is severely attenuated in orexinknockout mice3 and orexin neuron ablated mice4.
Although orexin neurons are essential to autonomic defense responses induced by stress in general, orexinneuronal activity occurring in response to speci�c stressors remains unclear. In the past, several technicallimitations have prevented us from thoroughly examining these unknowns. First, the use of freely movinganimals without anesthesia is necessary because stress responses are unable to occur under anesthesia.Second, the hypothalamus contains many different cell types and targeting only the orexin-producingneurons of interest was di�cult. Some researchers have reported on the activity of orexin neurons in awakerats by using traditional electrophysiological methods such as extracellular recording, and thensubsequently identifying the neurons that were recorded from with immunohistochemistry5,6. However, thisis a time-consuming approach and therefore is not realistic to use for studying the possible effects ofseveral kinds of stressors while simultaneously recording autonomic stress responses. In addition, singlecell recording techniques create a sampling bias: there are about 2000-3000 orexin neurons in the mouse

Page 3/23
brain7 but the activity of only one or two neurons can be recorded at a time. To overcome these limitations,we set out to develop and improve a �ber photometry system.
A �ber photometry system can track the real-time dynamics of genetically speci�ed neuron populationslocated deep within the brain of freely moving mice by using a single channel �ber and genetically encodedCa2+ indicators8-10. We recently utilized a single channel �ber photometry system and successfully recordedorexin11,12 and dopamine13 neural activities using G-CaMP6. More recently, we upgraded the system tooperate via dual channels. The dual channel system can detect more sophisticated data by virtue of two-color measurement(s) by using one color for reference. The animal’s movement sometimes affects the�uorescent signal intensity so this improvement was essential for the simultaneous recording of neuronalactivity and animal behavior. We used mCherry signal as a reference to G-CaMP signal. Although we brie�yreported on this dual channel system in our previous paper12, it will be described in more thorough detailhere. The system with dual-channel was previously published independently of us14,15. However, our systemis jointless from the recording place to the photodetector. Thus, the light transmission e�ciency of theexcitation blue light of our single �ber system is theoretically higher than compared to the ferrule systemsalready published that include one joint. Recently, some groups have published multi-�ber photometrysystems16,17. These systems use bundled �bers. Bundling very thin �bers provides better spatial resolutionthan our single �ber system. Sometimes it seems that the activity of individual cells can be recorded.However, since the �ber is very thin, it is expected that the detection capability of changes in �uorescence islow.
Stress processing in the brain can be described as being dictated by two components. The �rst is a sensorydiscriminative component de�ned by strength of pain and perception of places, and the other is anemotional component that is de�ned by negative emotions that accompany pain such as anxiety, fear, andaversion18,19. Between these components, the emotional component is likely the main contributor topsychiatric disorders resulting from chronic stress because the symptom may occur long after the originalsensory inputs are gone.
The neural mechanisms behind the emotional component of stress have not yet been fully elucidated. Oneof the reasons for this is that many stress studies utilized an acute stress paradigm in which one cannotdistinguish between emotional and sensory components. These include restraint stress20,21, intruderstress22,23, aversive odor stress24, auditory stress12,25, and trembling stress23,25. Therefore, we do not knowat present whether the above-mentioned possible contribution of orexin neurons to stress processing iswithin the branch of the emotional component or downstream of the sensory component.
In order to separate the components, memory-based Pavlovian testing is of interest because this methodgives psychological stress to the animals after cessation of original sensory inputs. Examples are fear-conditioning from social defeat26, electric shock27, and mate vocalization28. It is interesting to point out thatprevious research showed that orexin neurons contribute more preferentially to psychological stressors thanto physical stressors29.
Page 4/23
In order to clarify the activity of orexin neurons at the moment stress applied and to reveal possiblerelationship between orexin neuronal activity and the heart rate response, we measured orexin neuronalactivity induced by aversive stress using a dual channel �ber photometry system and heart rate using atelemetry system in freely moving mice. Furthermore, we attempted to clarify the possible effect of thenegative emotional component of stress in the absence of the original sensory input on orexin neuronalactivity using a fear-conditioning paradigm.
ResultsSetup of dual-channel in vivo �ber photometry system
Fiber photometry systems can track the real-time dynamics of genetically speci�ed neuronal populations inthe deep brain of freely moving mice by using a single �ber and genetically encoded Ca2+ indicators9. Weimproved this system by adding a second channel in order to be able to simultaneously detect both G-CaMP6 and mCherry. To speci�cally express G-CaMP6 and mCherry in orexin neurons, we preparedtransgenic mice and AAV vectors as shown in Fig. 1A. The AAV mixture consisting of AAVdj-TetO-G-CaMP6and AAVdj-TetO-mCherry was stereotaxically injected into the hypothalamus of ORX-tTA mice that expresstetracycline transactivator (tTA) in orexin neurons (Fig. 1A). These AAVs can drive expression of G-CaMP6and mCherry proteins in the presence of tTA. Three weeks after this mixture was injected, G-CaMP6 andmCherry expressed almost exclusively in hypothalamic orexin neurons (Fig. 1B). In 393 ± 60 orexin positiveneurons (n = 6 animals), G-CaMP6(+) cells were 283 ± 46, mCherry(+) cells were 345 ± 59, and both G-CaMP6- and mCherry-expressing orexin neurons were 260 ± 43 (Fig. 1Bv). There was small number ofectopic expressions of G-CaMP6 (G-CaMP6(+) & orexin (-) in total G-CaMP6(+) was 8.3 %). Blue and yellowexcitation lights for G-CaMP6 and mCherry were supplied by LEDs and delivered through a single opticalsilica �ber (Fig. 1C). Fluorescence emission from G-CaMP6 and mCherry expression in the hypothalamicorexin neurons pass back through the single optical silica �ber. The �uorescent signals pass through twodichroic mirrors and separate into green �uorescence derived from G-CaMP6 and red �uorescence derivedfrom mCherry. The signals then arrive at their respective photomultipliers (Fig. 1C). To place the opticalsingle silica �ber in the desired region of the hypothalamus, we implanted a guide cannula with dentalcement (Fig. 1C). The guide cannula allowed the optical �ber to be placed just dorsal to the hypothalamicarea of interest (Fig. 1D). The single optical silica �ber and guide cannula were made in our laboratory withthe support of LUCIR Inc. (Tsukuba, Ibaraki, Japan) (Fig. 1E). These tools allowed us to obtain a stable,noiseless, and high-resolution signal. To measure electrocardiogram (ECG) and body temperature, weimplanted a telemetry system transmitter (DSI) into the abdominal cavity at the same time as the guidecannula implantation (Fig. 1C). The complete system is shown in Fig. 1F. This system allowed for severaltypes of physiological data to be measured in freely moving mice receiving food and water ad libitum. Thedata was measured simultaneously under a high temporal resolution (Fig. 1G). G-CaMP6 signals respondedindependently from shifts in mCherry signals, so we could determine whether the G-CaMP signal was realby comparing it to the levels of mCherry �uorescence. The results shown in Fig. 1 demonstrate we were ableto utilize a dual channel �ber photometry system.
Association between orexin neuronal activity and aversive stress-induced autonomic responses

Page 5/23
In order to plot real-time orexin neural activity dynamics and autonomic response dynamics before and aftervarious types of aversive stress, we simultaneously measured G-CaMP6 �uorescence and ECG and heartrate was calculated from the ECG recordings. As an autonomic response to emotional stress, we analyzedheart rate response because change in body temperature was slow when compared to change in heart rate(see Fig. 1G). Three different stress paradigms with different sensory modalities and different afferentpathways were used. The paradigms were intruder stress, aversive sound stress, and aversive smell stress(Fig. 2A).
All of the stimuli tested, namely intruder (Fig. 2B), ultrasound (Fig. 2C), and predator odor (Fig. 2D), inducedabrupt increases in heart rate (Fig. 2B-D, left column) and G-CaMP6 �uorescence (Fig. 2B-D, middle column),while mCherry �uorescence (Fig. 2B-D, right column) did not change. As the control of stress stimuli, thephysiological response was measured using a cotton swab without odor and an empty box withoutintruders (Fig. 2E). These control stimuli did not increase GCaMP �uorescence or heart rate as much asultrasound stress (Fig. 2F).
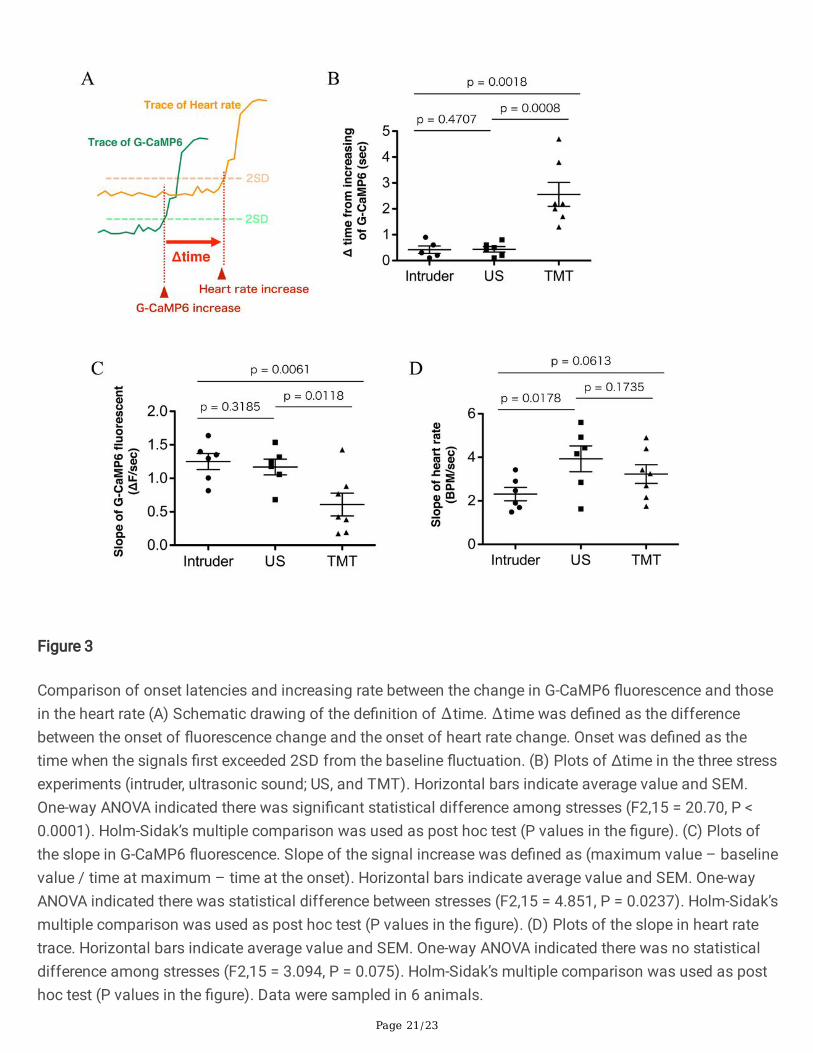
Although increases in G-CaMP6 �uorescence and heart rate appeared to occur simultaneously (Fig. 2B-D),closer examination revealed that there were differences in the responses. To examine possible differencesin the time course, we de�ned onset as the time when the signal more than doubled the standard deviationof the baseline �uctuation (Fig. 3A). We then calculated ∆time to be the difference between the onset of theincrease in heart rate and onset of the increase in G-CaMP6 signal. As a result, ∆time was a positive valuein all the stimuli in every mouse (Fig. 3B) meaning that the change in orexin neural activity preceded theincreases in heart rate in all events. It is of interest to point out that ∆time in the TMT test was signi�cantlylonger than in the intruder test and in the ultrasound test while there was no difference between the intrudertest and the ultrasound test, indicating non-uniform changes in heart rate depending on stress stimuli.
We also calculated slope of the signal increase (maximum value – baseline value / time at maximum –time at the onset). This analysis revealed that slope of G-CaMP6 �uorescence change in the TMT groupwas signi�cantly smaller than that in the intruder and ultrasound groups (Fig. 3C). Meanwhile, the slope ofthe heart rate change did not differ among the three stimuli (Fig. 3D). For TMT stimulation, activation oforexin neurons was relatively gradual when compared to the other stimulation types, and the start of theheart rate response was delayed, but the increase in heart rate ended up being similar.
Conditioned neutral sound stimulation activated orexin neurons
Although we have shown through the previous result that activation of orexin neurons precedes heart rateincrease thus indicating close association between orexin neuronal activity and autonomic outcome, thoseexperiments did not separate between the sensory component and the negative emotional component ofthe stressors. Subsequently, we evaluated the change in orexinergic neuronal activity resulting fromexposure to a neutral tone that was previously conditioned as a cue for an unpleasant experience. With thisclassical conditioning paradigm, it is possible to examine the effects of the pure emotional componentbecause the aversive electrical sensory input was no longer present at the time of testing.

Page 6/23
First, while recording the orexin neural activity and electrocardiogram, we gave a neutral tone withoutelectrical stimulation to the mouse (Fig. 4A Pre). No signi�cant changes in orexin neural activity and heartrate were observed after the sound exposure (Fig. 4B left and Fig. 4C). After conditioning was established asin the protocol shown in Fig. 4A, the mouse was exposed to the sound stimulation that is identical to thatwas applied in the preconditioning period (Fig. 4A Post). As a result, orexin neuronal activity and heart rateincreased immediately and markedly (Fig. 4B right and Fig. 4C). Furthermore, we calculated sound-inducedchanges in heart rate and orexin neuronal activity and compared them between before and after theconditioning (Fig. 4D). The rate of increase in heart rate and orexin neural activity were signi�cantlyincreased by fear conditioning. Conversely, orexin neuronal activity and heart rate did not change (Fig. 4F, G)when exposed to the neutral tone in un-conditioning protocol shown in Fig. 4E. We examined whetherconditioning was established by measuring freezing time during the observation period. As expected,conditioned group animals spent ~50% of the time in freezing while control animals did not (Fig. 4H).
DiscussionIn this study, we examined whether aversive emotion has an effect on the activity of hypothalamic orexinneurons in freely moving mice. We �rst constructed the recording system to assess neuronal activity fromthe speci�c cell type of interest deep in the brain of freely moving mice. Using in vivo recording ofhypothalamic orexin neuronal activity and ECG, we showed that every examined stress type activated orexinneurons just before the change in heart rate took place indicating a possible causative relationship betweenorexinergic neuronal activity and the resultant autonomic out�ow. In addition, we showed that the emotionalcomponent of stress also activated orexin neurons, although the magnitude of orexin neuronal activationseems smaller than when aversive stimulation with sensory input was given. We propose that both thesensory and emotional components of stress activate orexin neurons and hence induce autonomicactivation. Activation of orexin neurons when actual sensory component is absent (conditioned situation)indicates a possible contribution of the orexin system in the etiology of psychiatric disorders resulting fromchronic stress because symptoms may occur after the original sensory inputs no longer occur.
The dual-channel �ber photometry system produces good signal even in freely moving mice
Using our system, we were able to record and analyze neuronal activity and autonomic responses in freelymoving animals with high temporal resolution (Fig. 1G). Two-color simultaneous recording allowed us todistinguish between signal and noise with con�dence. Neuronal activity recording with head-�xed mice11,12
is an easy way to distinguish signal from noise because the animals’ head is unable to move and affect thesignal, but more natural behaviors cannot be measured. As a solution, measurements are taken via optical�ber from freely moving mice. However, in this case, the �ber may twist or move and the transmissione�ciency at the connection between the �ber and the �uorescence detection device changes and largeamounts of noise may occur. The device shown in Fig. 1 was able to eliminate these kinds of noise issues.The �uorescence ratio of green and red may also be used when analyzing data, similar to ratiometryanalysis employed when using a FRET system. However, we did not calculate the ratio and instead used thered signal as an indicator of stable recording. Although we were able to exclude unstable data that occurredduring large or sudden animal movements as judged by mCherry signal, it is necessary to determine a

Page 7/23
method to completely eliminate instability in future experiments. Fiber photometry systems also oftenstruggle with the weakness of their signals. In previous papers, authors have tried to e�ciently extract�uorescent signals with various methods such as time-correlated counting system, lock-in ampli�er,averaging, and ratiometric measurement8,9,30,31. We were able to solve this issue by implanting only a single�ber from the �uorescence detection device into the brain (Fig. 1E). Systems that use standard ferrules willcommonly lose some �uorescence signals in their connections. The absence of such a joint is anadvantageous feature of our system manufactured by LUCIR Inc.
Orexin neuronal activity and heart rate rapidly increase due to aversive stress stimulation irrespective ofsensory modality
We showed here that orexin neuronal activity and heart rate are increased instantaneously by aversivestress in freely moving mice. Giardino et al. already showed predator odor-induced activation of the lateralhypothalamic orexin neurons using �ber photometry method32. Unfortunately, however, they did not assesspossible autonomic consequence of the orexinergic activation. We simultaneously recorded heart rate andtried three kinds of stressors to induce aversive emotion and mice showed similar responses to eachstimulus (Fig. 2). It has already been shown that heart rate increase due to intruder stress is severelyattenuated in orexin de�cient mice3,4. Therefore, orexin may be involved in the regulation of stress-inducedautonomic responses. Furthermore, orexin neurons have dense innervation from the bed nucleus of the striaterminals (BNST) and the central nucleus of the amygdala (CeA)33. A recent study revealed thatoptogenetic/chemogenetic activation of GABAergic neurons in the BNST induces a rapid transition fromNREM sleep to wakefulness through inactivation of melanin-concentrating-hormone neurons (which arelocated in the same hypothalamic region as orexin neurons33) and activation of orexin neurons34. Aprevious study has also shown that stress-induced autonomic responses are attenuated bypharmacological suppression of the activity of the BNST and CeA in wild type mice6. The central medialnucleus of the amygdala (CeM) and BNST are known as areas that regulate emotion-related autonomicresponses35. Therefore, it is suggested that when emotional stress is given to mice, the activity of the CeMand BNST is enhanced, the orexin neurons are subsequently activated, and the autonomic response willoccur2,36. Actually, corticotropin-releasing factor expressing BNST neurons seem to be directly connected toorexin neurons, although their connections were primarily inhibitory and suggesting complex nature ofstress-induced orexinergic activation32. In this study, we showed that orexin neurons are promptly activatedat the time of stress just preceding an increase in heart rate, thus strengthening the "emotional stress circuit"hypothesis.
Three types of aversive stress were chosen for this study because we hypothesized that if the sensorycomponent of stress directly activates orexin neurons, there might be a different response depending on thesensory modality. However, as shown in Fig. 2, all three stress types activated orexin neurons in a similarmanner even though the heart rate response from the TMT test was slightly different from that in theintruder test and ultrasonic test. Therefore, activation of orexin neurons seemed to take place after thesensory inputs of different modalities were integrated as being aversive.

Page 8/23
Possible causal relationship between orexin neuronal activity and heart rate increase
When focusing on the differences between the starting point of the orexin neuronal activity increase and thestarting point of the heart rate increase, we found that the onset of the increase in orexin neuronal activityalways preceded changes in heart rate (Fig. 3B). Due to this �nding, it seemed reasonable to conclude thatthere might be a causal relationship between them, namely that orexin neuronal activity may directly causean increase in heart rate. Unfortunately, our data did not fully prove causality. It is necessary to directlymanipulate neuronal activity, with optogenetics or pharmacogenetics for example, to conclusively prove it.Nevertheless, our data strongly support the possibility.
Differences in orexin neuronal activity depending on the type of stress stimulation
Interestingly, as shown in Fig. 3B, the Δtime is only high in the group exposed to TMT. We further examinedthe difference in the rate of signal rise between the three types of stressors by examining the G-CaMP6slope. This examination shows that the G-CaMP6 �uorescence intensity increase in the TMT group isrelatively moderate, that is, the neuronal activity seems to rise slowly (Fig. 3C). However, the slope of theheart rate increase in the TMT group is the same as that in the other groups (Fig. 3D). Due to these �ndings,we hypothesized that orexin neuronal activity needs to reach a threshold in order to increase heart rate.Taken together, the Δtime in G-CaMP6 slope was prolonged because the TMT group took longer than theother groups to reach the orexin neuronal activity threshold required to initiate heart rate increase. We do notcurrently have an explanation for the reasons behind why the orexin neuronal activity rises slowly only inthe TMT group. It may be that because olfactory information differs from visual and auditory information inthat it takes longer for the chemical substance to diffuse and bind to the receptor, and that the experimentalresult re�ects the time difference from when the TMT stress is given until the mouse processes andinterprets the odorous substances.
The negative emotional component of stress activates orexin neurons and increases heart rate
Sensory input usually increases vigilance levels in animals regardless of the valence of emotion. The orexinneuronal activity we observed (Fig. 2) may be due to an increase in awareness that accompanies anincrease in attention. We were unable to distinguish whether the result of the stress-induced increases inorexin neuronal activity and the subsequent autonomic responses shown in Fig. 2 were caused by anincreased vigilance caused by sensory input alone or by an "emotional change" accompanying the sensoryinput. Therefore, we performed an experiment to distinguish between them by utilizing a fear-conditioningparadigm. Observation of freezing behavior clearly showed that the neutral sound did not cause anyaversive emotional changes unless the sound was associated with electric shock (Fig. 4B). We observed animmediate increase in orexin neuronal activity and heart rate response only when the neutral tone waspreviously associated with aversive emotion (Fig. 4C). This observation is in line with reports showing apossible relationship between orexin and fear behaviors37,38. Considering the results of Fig. 4 and thedescription in the previous discussion, it is possible that the changes in orexin neuronal activity observed inFig. 2 might depend on changes in the emotion of the animals, and not the individual sensory stimulationitself.
Page 9/23
Orexin aversive emotion response theory
In our previous study11, we showed that orexin neurons were activated by painful stimuli (nociceptivestimuli). At that time, it was not possible to distinguish whether the response was caused by the ascendingpathway from the nociceptive receptors or if it was caused by the descending pathway after the brainrecognized the signal as a painful one. Although direct comparison was di�cult, we now speculate thatactivation of orexin neurons via noxious stimulation in response to the aversive emotion that occurs inresponse to painful sensations was made similarly to the present study. This speculation is supported bythe observation that the orexin neuronal response to noxious stimuli was eliminated under anesthesia11.
ConclusionsThis paper shows that use of LUCIR's �ber photometry system with our modi�cation will give us a reliablesignal even when the animal is actively behaving. This system can easily be used in combination with ECG,EEG, EMG recording and video tracking. It can provide simultaneous monitoring and analysis at a hightemporal resolution of all the physiological pieces of information analyzed from neuronal activity deep inthe brain. Although the relationship between stress and orexin neurons has been suggested, it was foundthat orexin neuronal activity is indeed increased due to aversive stress induced by the sensory modalitiestested so far. The most important �nding is that activation of orexin neurons was caused not by sensoryinputs from stress but by changes in emotion to drive autonomic outputs. Aversive emotion serves a veryimportant function as a warning system for keeping animals informed of a variety of dangers.Unfortunately, in many cases of modern society, repeated exposure to acute stress in unavoidable. Forexample, o�ce workers may repeatedly suffer from aversive emotions, which may manifest in illnessessuch as depression. While it may be di�cult to completely escape from the stressor in these types ofsituations, it would be bene�cial to be able to reduce the severity of the aversive emotional component.These data suggest that targeting orexin neurons may enable treatment of psychiatric disorders that resultfrom repeated acute stress.
MethodsAnimals
We used transgenic mice carrying a tetracycline-controlled transactivator transgene (tTA) under the controlof the orexin promoter11 (orexin-tTA mice, n = 45). All experimental procedures were performed inaccordance with the guiding principles for the care and use of animals in the �eld of physiological sciencespublished by the Physiological Society of Japan and were approved by the Institutional Animal UseCommittee at Kagoshima University (MD15075, MD17090, MD18081). Mice were maintained under a strict12-hour light/dark cycle (light period: 7:00–19:00; dark period: 19:00–7:00) in a temperature-controlledroom (22 °C). Food and water were available ad libitum and all efforts were made to minimize animalsuffering and discomfort and to reduce the number of animals used.

Page 10/23
In vivo recordings of neuronal activity using �ber photometry system and cardiovascular parameters usingthe radio-telemetry system
Stereotaxic AAV injection
Surgeries for AAV injections were conducted under iso�urane anesthesia (2%, inhalation) using astereotaxic instrument (ST-7, NARISHIGE, Tokyo, Japan). A viral mixture consisting of recombinant AAV-TetO(3G)-G-CaMP6 (serotype: DJ; 600 nl/injection, 3x10¹² copies/ml) and AAV-TetO(3G)-mCherry (serotype:DJ; 600 nl/injection, 6x10¹² copies/ml) was stereotaxically injected into the right side the hypothalamicperifornical area (PeF) in orexin-tTA mice (Fig. 1A). The AAV mixture was injected via an air-pressureinjection system (I-200J, NARISHIGE, Tokyo, Japan) connected by polyethylene tube to a glass micropipettethat was made from a pulled glass tube (φ1.5 mm, World Precision Instruments, FL, USA) by a puller (SutterInstrument Novato, CA, USA) and had a tip diameter of 18-22 μm. Injection sites was as follows: frombregma anterior 1.5 mm, lateral 0.8 mm, ventral 5.0 mm from dura.
Implantation of optical �ber for �ber photometry system
Over 2 weeks after viral injection, mice were surgically implanted with a guide cannula (LUCIR, Tsukuba,Japan) for placing the optical �ber just above the PeF to record orexin neuronal activity (Fig. 1D). At thestart of the surgical procedures, mice were anesthetized with iso�urane (2–3%, inhalation), and placed on asmall animal stereotaxic instrument as described previously. The site of implantation for the guide cannulawas as follows: from bregma anterior 1.5 mm, lateral 0.8 mm, ventral 5.0 mm from dura. Duringimplantation, �uorescence signal was continuously monitored so that optimal position of the �ber tip waseasily recognized by abrupt increase of the output signal. The guide cannula was �xed by dental cement(Fuji LUTE BC, GC, Tokyo, Japan), gel type quick drying glue (LOCTITE 454, Henkel Japan, Yokohama,Japan), and a small anchor screw. After �xation of the guide cannula, measuring �ber was removed and adummy cannula was inserted to prevent dust from entering the implanted guide cannula during the recoveryperiod.
Implantation of the transducer for the radio-telemetry system
Immediately after performing the guide cannula implantation, an additional implantation surgery wasperformed on the mice. To measure heart rate and body temperature, we used a radio-telemetry system(Data Sciences International, St. Paul, MN, USA)(DSI). This system consists of a radio-frequency transducer(TA11PA-C20) and a receiver (RLA1020). The negative electrode (-) of the transducer was stitched into theright side of the mouse's chest cavity, the positive electrode (+) was stitched into the left side of theabdomen, and the body of the transducer was implanted into the abdominal cavity. A temperature sensor inthe body of the transmitter allowed abdominal temperature to also be measured. During all surgeries, carewas taken to maintain body temperature. After surgeries, mice were treated with penicillin and an analgesic,buprenorphine. For recovery, mice were individually housed and monitored and had access to food andwater ad libitum for at least 1 week.
Recording

Page 11/23
The recording was started once mice completely recovered from all surgeries and a normal circadianrhythm was present. After the recovery period, the dummy cannula was removed, an optical silica �ber (Fig.1E) was inserted, and mice were moved to their measurement cages (Fig. 1F). Locomotor activity wasrecorded with a passive pyroelectric infrared motion sensor (AMN 1111, Panasonic Co., Osaka, Japan) thatwas attached to the ceiling of the experimental cage. Mice were housed in the cage individually during therecording period. Orexin neuronal activity and heart rate were recorded for 2–3 successive days usingLabChart software version 8 (ADInstruments, New South Wales, Australia) in unrestrained, freely moving,and unanesthetized conditions.
Fiber photometry device
A �ber photometry system (COME2-FTR/OPT, LUCIR, Tsukuba, Japan) was used to record the activity oforexin neurons in freely moving mice (Fig. 1C). The system utilizes a single silica �ber that can deliver twoexcitation lights and detect �uorescence from G-CaMP6 and mCherry simultaneously. Blue excitation lightfor G-CaMP6 (470 nm, 0.5 mW at the tip of the silica �ber) and yellow excitation light for mCherry (590 nm)were produced by a high-power LED system, blue; Tholab OPT/LED Blue_TT_FC, yellow; Tholab OPT/LEDyellow_TT_FC (ThoLab Japan, Tokyo, Japan). Blue and yellow excitation light was re�ected by a dichroicmirror, passed through an excitation bandpass �lter, and was delivered via a 400 μm silica �ber into thebrain. G-CaMP6 and mCherry �uorescence were collected by the same silica �ber and guided to anindividual photomultiplier for either G-CaMP6 or mCherry (PMTH-S1M1-CR131, Zolix instruments, Beijing,China) (Fig. 1F). The signal was digitized using a data acquisition system (PowerLab16/35, ADInstruments,New South Wales, Australia), and recorded by LabChart software version 8. Signals were collected at asampling frequency of 100 Hz.
Stress stimulation
Three types of stressors were applied on the following day after the basal measurement was completed(Fig. 2A). The �rst was a socioemotional stressor via the resident-intruder stress test. This stressor wasapplied by placing an age-matched wild-type mouse (intruder mouse) contained in a small polypropylenecage into the experimental cage for 2 min. The polypropylene cage is constructed so that the intruder andresident (experimental) mice are unable to physically contact, but visual, auditory, and olfactorycommunication is available. The second stressor was aversive sound stress. For this test, an approximately100 dB/25 kHz ultrasonic sound was applied to the mouse via an ultrasound-emitting device (PET-AGREE,K-II enterprise, New York, USA). The device was turned on above the cage for 2 seconds. The third stressorwas aversive smell stress. For the aversive smell, 2,4,5-trimethylthiazoline, (TMT, Contech Enterprise,Victoria, Canada) a constituent of fox urine and feces, a common predator odor for mice24,39, was placednear the nose of the mouse for 2 seconds via cotton swab.
The rationale for choosing these particular types of aversive stress were carefully considered. First, intruderstress has been used in orexin knockout mice showing a possible role of orexin neurons in stress-inducedautonomic responses3. Second, we are interested in separating the sensory component and the emotionalcomponent of stress. If the sensory component of stress directly activates orexin neurons, there might be a

Page 12/23
different response depending on sensory modality (optic, auditory, and olfactory) because the informationtransmitted to the brain from the respective receptors (eyes, ears, and nose) occurs via different sensoryafferent pathways.
As the control of stress stimuli, the physiological response was measured using a cotton swab without odorand an empty box without intruders (Fig. 2E).
Fear conditioning
The animal was placed in an experimental chamber and acclimatized for 2 hours and then neutral tonesound (60 dB, 1 kHz) was given for 2 sec during �ber photometry and the heart rate recording. In order toassociate a neutral tone with an unpleasant experience (Fig. 4A), 1 sec electric shock was given to the hindpaw of the animal 1 to 5 sec after a 2 sec neutral tone. This was repeated 15 times using a shock generator(CBX-CT) and a cycle timer (CSG-001, Muromachi Kikai, Tokyo, Japan). After a resting period of 1 hr., theidentical neutral tone was given during �ber photometry and heart rate recording. During the post-recordingperiod, freezing behavior was also measured to con�rm that classical fear conditioning had beensuccessfully established. Freezing time was visually calculated by observing videotaped animal behavior bythe experimenter who is blinded to the experimental group. No electrical stimulus was given to the controlanimals. All the procedures were performed in one chamber. Both behavioral test (sound stimulation andfear conditioning) including baseline recording were performed between 12:00 and 18:00.
Immunohistochemistry.
Mice were deeply anesthetized with urethane (2.0 g/kg, i.p.), and transcardially perfused with 20 ml ofsaline containing 20 unit/ml heparin followed by 20 ml of chilled 4% paraformaldehyde (Wako PureChemical Industries, Ltd., Osaka, Japan) in 0.01 M PBS (pH 7.4). The brain was removed, post-�xed in 4%paraformaldehyde solution at 4 °C overnight, and subsequently immersed in PBS at 4 °C for at least 2 days.A series of 40 μm sections were obtained with a vibratome (SuperMicroSlicer Zero1; DOSAKA EM, Kyoto,Japan). For staining, coronal brain sections were immersed in blocking buffer (1% normal horse serum and0.3% Triton-X in PBS), then incubated with an anti-orexin A goat antibody (SC-8070, Santa CruzBiotechnology, Inc., Dallas, TX, USA) at 4 °C overnight. The sections were washed with PBS and incubated aCF647-conjugated anti-goat IgG antibody (20048, Biotium) for 2 hrs. at room temperature. These brainsections were mounted on a slide and imaged on a �uorescence microscope (BZ-9000, Keyence, Osaka,Japan). The primary and secondary antibody were diluted in blocking buffer or PBS and consisted of anti-orexin A goat antibody used at 1:200 and CF647-conjugated anti-goat IgG antibody at 1:500. We counted G-CaMP6 positive cells (green), mCherry positive cells (red), and anti-orexin A positive cells (far red) in thehypothalamic area where orexin neurons are located (-1.0 ~ -2.0 mm from bregma) using NIH ImageJsoftware. We calculated the relative percentage of G-CaMP6 or mCherry positive neurons in orexin neuronsby using the average number of anti-orexin A positive neurons as the reference. For counting, we used oneout of every four coronal brain slices in an animal.
Statistical analysis.
Page 13/23
Statistical analyses were performed using PRISM software (GraphPad Software, La Jolla, CA, USA). Simplecomparisons of the means between the two groups were performed by Student's t-test or Mann-Whitney’snonparametric test. Multiple comparisons of the means and SEM were performed by one-way ANOVAanalyses followed by Holm-Sidak's multiple comparison tests. A P value of less than 0.05 was consideredsigni�cant.
AbbreviationsBNST: the bed nucleus of the stria terminals; CeA: the central nucleus of the amygdala; CeM: The centralmedial nucleus of the amygdala; ECG: electrocardiogram; PeF: perifornical area; TMT: 2,4,5-trimethylthiazoline; tTA: tetracycline transactivator;
DeclarationsEthics approval and consent to participate
All experimental procedures were performed in accordance with the guiding principles for the care and useof animals in the �eld of physiological sciences published by the Physiological Society of Japan and wereapproved by the Institutional Animal Use Committee at Kagoshima University (MD15075, MD17090,MD18081).
Consent for publication
Not applicable.
Availability of data and materials
The summary statistics are available within the article. The data that support the �ndings of this study areavailable from the corresponding author upon reasonable request.
Funding
This work was supported by JSPS KAKENHI Grants (17K14936 to A. Yamashita; 17K16387 to S.M.;16H05130 to T.K.) and CREST JST (JPMJCR1656 to A. Yamanaka) in the courses during the design of thestudy and collection, analysis, and interpretation of data and in writing the manuscript.
Competing interests
The authors declare that they have no competing interests.
Authors’ contributions
A.Yamashita and T.K. designed the study; A.Yamashita, S.M., R.N., J.K., A.Yamanaka and T.K. conducted thestudy and analyzed the data; and A.Yamashita and T.K. wrote the manuscript. All authors approved the �nalversion of the manuscript.

Page 14/23
Acknowledgments
We thank Jordan L. Pauli for English editing and Miki Sakoda for her excellent technical assistance and allthe members of the department of Physiology for their support. We also thank all the staff members of theInstitute of Laboratory Animal Sciences at Kagoshima University for keeping the animals in good condition.We acknowledge the joint research Laboratory, Kagoshima University Graduate School of Medical andDental Sciences, for the use of their facilities.
References1. WHO. Depression and Other Common Mental Disorders.
https://www.who.int/mental_health/management/depression/prevalence_global_health_estimates/en/(2017)
2. Kuwaki, T. Orexin links emotional stress to autonomic functions. Auton Neurosci161, 20–27.http://doi.org/10.1016/j.autneu.2010.08.004 (2011).
3. Kayaba, Y., et al. Attenuated defense response and low basal blood pressure in orexin knockout mice.Am J Physiol Regul Integr Comp Physiol285, R581–R593. http://doi.org/10.1152/ajpregu.00671.2002(2003).
4. Zhang, W., Sakurai, T., Fukuda, Y. & Kuwaki, T. Orexin neuron-mediated skeletal muscle vasodilation andshift of barore�ex during defense response in mice. Am J Physiol Regul Integr Comp Physiol290,R1654-R1663. http://doi.org/10.1152/ajpregu.00704.2005 (2006).
5. Mileykovskiy, B., Kiyashchenko, L. & Siegel, J. Behavioral correlates of activity in identi�edhypocretin/orexin neurons. Neuron46, 787-798 (2005).
�. Lee, M. G., Hassani, O. K., & Jones, B. E. Discharge of identi�ed orexin/hypocretin neurons across thesleep-waking cycle. J Neurosci25, 6716–6720 http://doi.org/10.1523/JNEUROSCI.1887-05.2005(2005).
7. Zhang, W., Zhang, N., Sakurai, T. & Kuwaki, T. Orexin neurons in the hypothalamus mediatecardiorespiratory responses induced by disinhibition of the amygdala and bed nucleus of the striaterminalis. Brain Res1262, 25–37. http://doi.org/10.1016/j.brainres.2009.01.022 (2009).
�. Cui, G., et al. Deep brain optical measurements of cell type–speci�c neural activity in behaving mice.Nat Protoc9, 1213–1228. http://doi.org/10.1038/nprot.2014.080 (2014).
9. Gunaydin, L. A., et al. Natural neural projection dynamics underlying social behavior. Cell157, 1535–1551. http://doi.org/10.1016/j.cell.2014.05.017 (2014).
10. Guo, Q., et al. Multi-channel �ber photometry for population neuronal activity recording. Biomed OptExpress6, 3919. http://doi.org/10.1364/BOE.6.003919 (2015).
11. Inutsuka, A., et al. The integrative role of orexin/hypocretin neurons in nociceptive perception andanalgesic regulation. Sci Rep6, 29480. http://doi.org/10.1038/srep29480 (2016).
12. Moriya, S., et al. Acute aversive stimuli rapidly increase the activity of ventral tegmental area dopamineneurons in awake mice. Neurosci, 386, 16–23. http://doi.org/10.1016/J.NEUROSCIENCE.2018.06.027(2018).
Page 15/23
13. Futatsuki, T., et al. Involvement of orexin neurons in fasting- and central adenosine-inducedhypothermia. Sci Rep8, 2717. http://doi:10.1038/s41598-018-21252-w (2018).
14. Simone, K., Füzesi, T., Rosenegger, D., Bains, J., Murari, K. Open-source, cost-effective system for low-lightin vivo�ber photometry. Neurophotonics,5(2), 025006. http://doi:10.1117/1.NPh.5.2.025006.(2018).
15. Meng, C., et al. Spectrally resolved �ber photometry for multi-component analysis of brain circuits.Neuron, 98(4), 707-717. http://doi:10.1016/j.neuron.2018.04.012. (2018).
1�. Martianova E, Aronson S, Proulx CD. Multi-�ber photometry to record neural activity in freely-movinganimals. J Vis Exp.152, e60278. http://doi:10.3791/60278. (2019).
17. Sych, Y., Chernysheva, M., Sumanovski, L.T., Helmchen, F. High-density multi-�ber photometry forstudying large-scale brain circuit dynamics. Nat Methods. 16(6), 553-560. http://doi:10.1038/s41592-019-0400-4. (2019).
1�. Minami, M. Neuronal mechanisms underlaying pain-induced negative emotion. BRAIN and NERVE, 64,1241-1247. https://doi.org/10.11477/mf.1416101337 (Japanese. Abstract in English) (2012).
19. Minami, M. & Ide, S. How does pain induce negative emotion? role of the bed nucleus of the striaterminalis in pain-induced place aversion. Curr Mol Med15, 184–190.http://doi.org/10.2174/1566524015666150303002336 (2015).
20. Sharma, H. S. Blood–Brain and Spinal Cord Barriers in Stress. In: Sharma H.S. and Westman, J (Eds)Blood-Spinal Cord and Brain Barriers in Health and Disease, Elsevier, pp. 231–298.http://doi.org/10.1016/B978-012639011-7/50019-X (2004).
21. Grafe, L. A., et al. Orexin 2 receptor regulation of the hypothalamic–pituitary–adrenal (HPA) response toacute and repeated stress. Neurosci348, 313–323. http://doi.org/10.1016/j.neuroscience.2017.02.038(2017).
22. Kurihara, Y., et al. Role of endothelin-1 in stress response in the central nervous system. Am J PhysiolRegul Integr Comp Physiol279, R515–R521. http://doi.org/10.1152/ajpregu.2000.279.2.R515 (2000).
23. Ikoma, Y., Kusumoto-Yoshida, I., Yamanaka, A., Ootsuka, Y. & Kuwaki, T. Inactivation of serotonergicneurons in the rostral medullary raphé attenuates stress-induced tachypnea and tachycardia in mice.Front Physiol9, 832. http://doi.org/10.3389/fphys.2018.00832 (2018).
24. Hotsenpiller, G. & Williams, J. L. A synthetic predator odor (TMT) enhances conditioned analgesia andfear when paired with a benzodiazepine receptor inverse agonist (FG-7142). Psychobiology, 25, 83–88.http://doi.org/10.3758/bf03327031 (1997).
25. Iwakawa, S., Kanmura, Y. & Kuwaki, T. Orexin receptor blockade-induced sleep preserves the ability towake in the presence of threat in mice. Front Behav Neurosci12, 327.http://doi.org/10.3389/fnbeh.2018.00327 (2019).
2�. Golden, S. A., Covington, H. E., Berton, O. & Russo, S. J. A standardized protocol for repeated socialdefeat stress in mice. Nat Protoc6, 1183–1191. http://doi.org/10.1038/nprot.2011.361 (2011).
27. Furlong, T. & Carrive, P. Neurotoxic lesions centered on the perifornical hypothalamus abolish thecardiovascular and behavioral responses of conditioned fear to context but not of restraint. BrainRes1128, 107-119. http://doi.org/10.1016/j.brainres.2006.10.058 (2007).
Page 16/23
2�. Murata, Y., et al. A high fat diet-induced decrease in hippocampal newly-born neurons of male mice isexacerbated by mild psychological stress using a Communication Box. J Affect Disord209, 209–216.http://doi.org/10.1016/J.JAD.2016.11.046 (2017).
29. Furlong, T. M., Vianna, D. M. L., Liu, L. & Carrive, P. Hypocretin /orexin contributes to the expression ofsome but not all forms of stress and arousal. Eur J Neurosci30, 1603–1614.http://doi.org/10.1111/j.1460-9568.2009.06952.x (2009).
30. Isosaka, T., et al. Htr2a-expressing cells in the central amygdala control the hierarchy between innateand learned fear. Cell, 163, 1153–1164. http://doi.org/10.1016/J.CELL.2015.10.047 (2015).
31. Natsubori, A., et al. Ventrolateral striatal medium spiny neurons positively regulate food-incentive, goal-directed behavior independently of D1 and D2 selectivity. J Neurosci37, 2723–2733 (2017).http://doi.org/10.1523/JNEUROSCI.3377-16.2017
32. Giardino, W.J, et al. Parellel circuits from the bed nuclei of stria terminalis to the lateral hypothalamusdrive oppisng emotional states. Nat Neurosci21, 1084-1095. https://doi.org/10.1038/s41593-018-0198-x (2018).
33. Sakurai, T. The role of orexin in motivated behaviours. Nat Rev Neurosci15, 719–731.http://doi.org/10.1038/nrn3837 (2014).
34. González, J. A., Iordanidou, P., Strom, M., Adamantidis, A. & Burdakov, D. Awake dynamics and brain-wide direct inputs of hypothalamic MCH and orexin networks. Nat Commun7, 11395.http://doi.org/10.1038/ncomms11395 (2016).
35. LeDoux, J.E., Iwata, J., Cicchetti, P. & Reis, D.J. Different projections of the central amygdaloid nucleusmediate autonomic and behavioral correlates of conditioned fear. J Neurosci8, 2517–2529.https://doi.org/10.1523/JNEUROSCI.08-07-02517.1988 (1988).
3�. Carrive, P. & Kuwaki, T. Orexin and Central Modulation of Cardiovascular and Respiratory Function. InLawrence A. and de Lecea L. (Eds) Behavioral Neuroscience of Orexin/Hypocretin. Current Topics inBehavioral Neuroscience vol 33, Springer, pp. 157–196. http://doi.org/10.1007/7854_2016_46 (2016).
37. Flores, Á., Saravia, R., Maldonado, R. & Berrendero, F. Orexins and fear: implications for the treatment ofanxiety disorders. Trend Neurosci38, 550–559. http://doi.org/10.1016/j.tins.2015.06.005 (2015).
3�. Soya, S., et al. Orexin modulates behavioral fear expression through the locus coeruleus. NatCommun8, 1606. http://doi.org/10.1038/s41467-017-01782-z (2017).
39. Rampin, O., et al. Where is the TMT? GC-MS analyses of fox feces and behavioral responses of rats tofear-inducing odors. Chem Senses, 43, 105–115. http://doi.org/10.1093/chemse/bjx075 (2018).
Figures

Page 17/23
Figure 1
Simultaneous real time measurement of orexin neural activity, heart rate, and body temperature in freelymoving mice using a �ber photometry and telemetry system. (A) Schematic drawing showing speci�cexpression of G-CaMP6 and mCherry in orexin neurons by injecting AAV vectors into the hypothalamus ofOrexin-tTA transgenic mice. (B) Immunohistochemical con�rmation showing G-CaMP6 (B-i) and mCherry (B-ii) were exclusively expressed in almost all orexin neurons (B-iii) that were visualized by anti Orexin A-antibody in Orexin-tTA mice. G-CaMP6 and mCherry identi�ed by their own �uorescence. Scale bar is 50 μm.

Page 18/23
Images are close-up of the white rectangle in D. B-v) Quanti�cation of G-CaMP-positive cells, mCherry-positive cells, and G-AcMP6 and mCherry double positive cells in hypothalamic orexin neurons. (C)Schematic diagram of dual channel �ber photometry system. Blue excitation light from the 470 nm LEDilluminates the G-CaMP6-expressing neurons in the hypothalamus via optical �ber. Green �uorescence fromG-CaMP6 is then gathered by the same optical �ber and detected by the photomultiplier tube (PMT). Bodytemperature and heart rate were measured by a telemetry system. Telemetry transmitter wasintraperitoneally implanted into the mouse. (D) Con�rmation of the �ber tract after �uorescent recordings.Coronal section of the brain from the orexin-tTA mouse injected with AAV-TetO(3G) G-CaMP6 and AAV-TetO(3G) mCherry mixture 2 weeks before recording. The dashed line indicates the location of the insertedguide cannula and optic �ber. The white square indicates the hypothalamus region. (E) Self-assembledsilica connecting cable called the “patch cord” (i) and in vivo optical �ber cannula (ii). (F) Overall �berphotometry system. (G) Representative traces of locomotor activity (activity count), body temperature,electrocardiography (ECG, expanded traces in the rectangle), heart rate (calculated as beats per minute), andthe �uorescence intensity of G-CaMP6 and mCherry in the orexin neurons.

Page 19/23
Figure 2
Aversive stress activated orexin neurons together with an increase in heart rate. (A) Schematic drawingshowing the experimental design; intruder stress (left), ultrasound stress (middle), and predator odor (TMT)stress (right). (B) Results of intruder stress experiment. The horizontal bar shows the time when the intruderwas in the experimental chamber for 2 min. i) (upper) Averaged time course of the heart rate during theintruder test. Mean value is shown in the orange line and SEM is shown in gray. (middle) Heat maps showthe heart rate in individual animals. (lower) Bar graph shows averaged values of the heart rate for 1min

Page 20/23
during the baseline period and after introduction of an intruder. ii) (upper) Averaged time course of the G-CaMP6 �uorescence during intruder test. Mean value is shown in the green line and SEM is shown in gray.Horizontal bar shows the time when intruder was in the experimental chamber. (middle) Heat maps show G-CaMP6 �uorescence in individual animals. (lower) Bar graph shows averaged values of the intensity of G-CaMP6 �uorescence for 1 min during the baseline period and after introduction of intruder. iii) Results ofmCherry �uorescence are shown in a similar manner to B-ii. (C) Results of the ultrasound stress experiment.Data are shown in a similar manner to B. The horizontal bar shows the time when ultrasound was appliedfor 2 sec. (D) Results of TMT smell experiment. Data are shown in a similar manner to B. The horizontal barshows the time when TMT was applied for 2 sec. Data were sampled in 6 animals in intruder test andultrasound stimulation and 7 animals in TMT test. Group data are presented as mean ± SEM. P value wascalculated using paired student's t-test. (E) Schematic drawing showing the control experimental design;mice (n=4) were given ultrasound stress for positive control. Then odorless cotton swab and empty cagewere presented in interval of 30 min. For randomization, 2 mice received cotton swab for the �rst time andthe other mice received empty cage for the �rst time. (F) Traces of the heart rate (upper), G-CaMP6�uorescence (middle), and �uorescence of mCherry (lower) in ultrasound stress group (left), cotton swabgroup (middle) and empty cage group (right). The colored line indicates averaged value and the gray lineshows SEM.
Page 21/23
Figure 3
Comparison of onset latencies and increasing rate between the change in G-CaMP6 �uorescence and thosein the heart rate (A) Schematic drawing of the de�nition of ∆time. ∆time was de�ned as the differencebetween the onset of �uorescence change and the onset of heart rate change. Onset was de�ned as thetime when the signals �rst exceeded 2SD from the baseline �uctuation. (B) Plots of Δtime in the three stressexperiments (intruder, ultrasonic sound; US, and TMT). Horizontal bars indicate average value and SEM.One-way ANOVA indicated there was signi�cant statistical difference among stresses (F2,15 = 20.70, P <0.0001). Holm-Sidak’s multiple comparison was used as post hoc test (P values in the �gure). (C) Plots ofthe slope in G-CaMP6 �uorescence. Slope of the signal increase was de�ned as (maximum value – baselinevalue / time at maximum – time at the onset). Horizontal bars indicate average value and SEM. One-wayANOVA indicated there was statistical difference between stresses (F2,15 = 4.851, P = 0.0237). Holm-Sidak’smultiple comparison was used as post hoc test (P values in the �gure). (D) Plots of the slope in heart ratetrace. Horizontal bars indicate average value and SEM. One-way ANOVA indicated there was no statisticaldifference among stresses (F2,15 = 3.094, P = 0.075). Holm-Sidak’s multiple comparison was used as posthoc test (P values in the �gure). Data were sampled in 6 animals.

Page 22/23
Figure 4
Conditioning-induced activation of orexin neuron and increase in heart rate without aversive sensory input(A) Experimental design for neuronal and heart rate recordings of conditioning group (n = 4). HR and�uorescence were recorded for 2 min around sound application before conditioning (pre) and 1hr afterconditioning (post). HR and �uorescence were averaged for 1 min during the baseline period and after thecue sound (green horizontal line). (B) Traces of the heart rate (upper), G-CaMP6 and mCherry �uorescence(lower) in pre-conditioning (left) and post-conditioning (right) in the conditioning group. The colored lineindicates the averaged value and the gray line shows SEM. (C) Grouped average and SEM of the averagedvalues for 1 min during the baseline period and after the cue sound. Two-way ANOVA revealed that therewas signi�cant difference between baseline and cue sound (Heart rate: F1, 3 = 8.719, P = 0.0599; G-CaNP6:F1,3 = 15.22, P = 0.0299; mCherry: F1,3 = 2.096, P = 0.2435) and between pre-condition and post-condition(Heart rate: F1, 3 = 622.9, P < 0.0001; G-CaMP6: F1,3 = 30.91, P = 0.0115; mCherry: F1,3 = 0.04808, P =0.8405). P values in the �gure were calculated by Holm-Sidak’s multiple comparison test. (D) Changes in therate of increase due to the cue sound of individual mice. The rate of increase is represented by the averageof after cue sound / the average of before cue sound. P values were calculated using a paired t-test. (E)Experimental design for neuronal and heart rate recordings in the control group (n = 11). (F) Traces of the

Page 23/23
heart rate (left), G-CaMP6 and mCherry �uorescence (right) in the control group. (G) Grouped average andSEM of the averaged values for 1 min during the baseline period and after the cue sound. P values werecalculated using paired t-test. (H) Results of the freezing score (% time) during cue test tone. In the post-session, freezing behavior was counted in the control group (n = 11) and in the conditioned group (n = 4). Pvalues was calculated using Mann-Whitney’s nonparametric test.