indoor environment and productivity in office environment - rehva… · federation of european...
TRANSCRIPT
Federation of European Heating, Ventilation and Air-conditioning Associations
Indoor environment and productivity
in office environment
summary of the key contents of REHVA
Guidebook no 6
Olli Seppänen, professor
Helsinki University of Technology
Federation of European Heating and Air-
conditioning Associations

Federation of European Heating, Ventilation and Air-conditioning Associations
Address:
Rue Washington 40
1050 Brussels
Belgium
www.rehva.eu
Tel: +32 2 514 11 71
Fax: +32 2 512 90 62
Federation of European Heating, Ventilation
and Air-conditioning Associations

Federation of European Heating, Ventilation and Air-conditioning Associations
Use of REHVA Guidebook Power
Point Presentations
• This Power Point Presentation can be freely used for training purposes by REHVA members.
• It is prepared by the main author to the REHVA Guidebook.
• Please refer the original author always when making the presentation.
• Inform REHVA secretariat each time the presentation is used: [email protected]

Federation of European Heating, Ventilation and Air-conditioning Associations
Federation of European Heating
and
Air-conditioning Associations
(REHVA)
=
Professional organization with
28 member countries
representing more than 100 000 HVAC experts in Europe

Federation of European Heating, Ventilation and Air-conditioning Associations
Procedure to include indoor environment in
calculations is needed
• for engineering analysis to compare alternative technical systems
• to convince the employers to invest on better indoor environment
• to motivate building owners to invest on better indoor environment and
• to justify higher rents of high quality leased buildings

Federation of European Heating, Ventilation and Air-conditioning Associations
Economic calculations in design and
operations stage should include
• investment cost
– euros per occupant/employee
• operation cost
– including energy
• productivity and health
benefits/decrements

Federation of European Heating, Ventilation and Air-conditioning Associations
From improved building
performance to benefits
Indoor air quality
Human
responses Benefits
Value of the benefits
Building design and
operation

Federation of European Heating, Ventilation and Air-conditioning Associations
Economic benefits as a driving force
for better IEQ
Owner
occupied
building
Investment
Better IEQ
Better productivity
Improved
performance
Less sick leave
Less complaints
Economic
benefits

Federation of European Heating, Ventilation and Air-conditioning Associations
Simplified definition of
productivity
Output
Productivity =
Input
Output
Productivity =
Input

Federation of European Heating, Ventilation and Air-conditioning Associations
Productivity, building
investment and cost
Productivity =
Work performance
Investment and operational cost
Productivity =
Work performance
Investment and operational cost

Federation of European Heating, Ventilation and Air-conditioning Associations
Factors affecting productivity (Clements-Croome 2000)
ORGANISATION
ENVIRONMENT PERSONAL
CHARACTERISTICS
SOCIAL
ENVIRONMENT
PRODUCTIVITY
Leadership
Organisational
structure
Relationships
between
people
Work, career
Home/work
relationship
Commitment
to work Indoor
Environment

Federation of European Heating, Ventilation and Air-conditioning Associations
IAQ-factors with quantitative
effect on productivity
• Ventilation and sick leave
• Ventilation and work performance
• Temperature and performance
• Perceived indoor air quality and task
performance
• SBS-symptoms and performance

Federation of European Heating, Ventilation and Air-conditioning Associations
Ventilation rates affect
• Concentration of pollutants from indoor sources and outdoor sources
• Pollutants from air handling system itself
• Humidity etc.
• Perceived air quality
• Sick building syndrome symptoms
• Dryness etc.
What about objectively measured sick leave and performance ?

Federation of European Heating, Ventilation and Air-conditioning Associations
Ventilation rates and sick leave
Federation of European Heating, Ventilation and Air-conditioning Associations
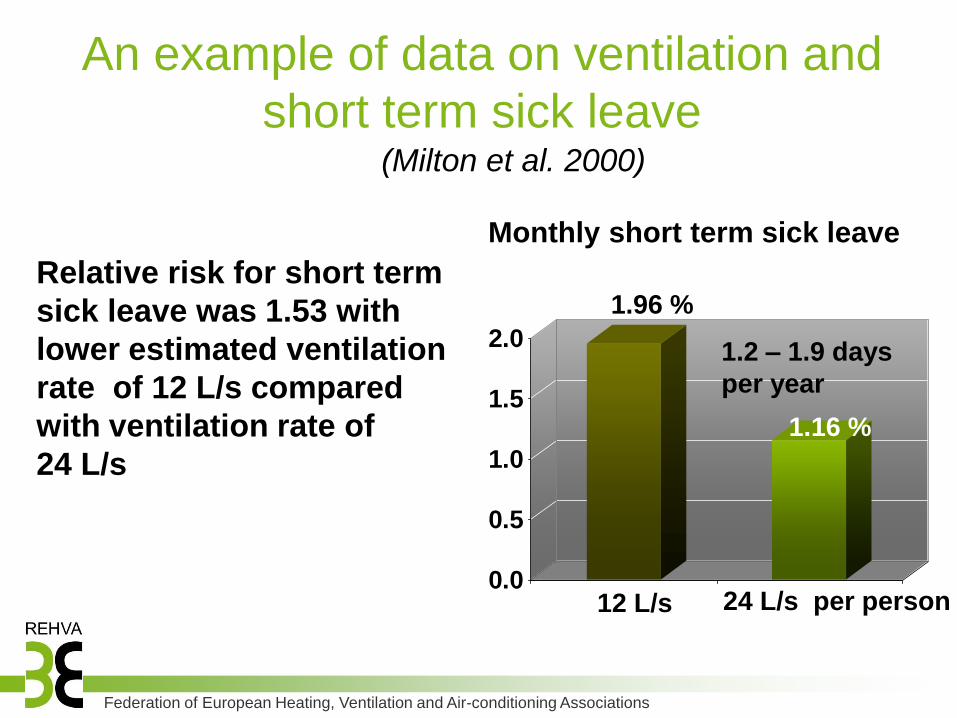
An example of data on ventilation and
short term sick leave
0.0
0.5
1.0
1.5
2.0
12 L/s 24 L/s per person
1.16 %
1.96 %
Monthly short term sick leave
1.2 – 1.9 days
per year
Relative risk for short term
sick leave was 1.53 with
lower estimated ventilation
rate of 12 L/s compared
with ventilation rate of
24 L/s
(Milton et al. 2000)

Federation of European Heating, Ventilation and Air-conditioning Associations
Short term sick leave or illness inflicted by infectious
diseases vs. ventilation rate (ach)
(Adapted to Wells-Riley-model) Drinka (1996), illness in nursing home
Brundage (1988), illness in barracks, all years
Particle concentration model
Brundage (1988), illness in barracks, 1983 data
Milton (2000), sick leave in offices
0 1 2 3 4 0
0.2
0.4
0.6
0.8
1.0
Ventilation Rate (1/h)

Federation of European Heating, Ventilation and Air-conditioning Associations
Ventilation rates and
performance
Federation of European Heating, Ventilation and Air-conditioning Associations
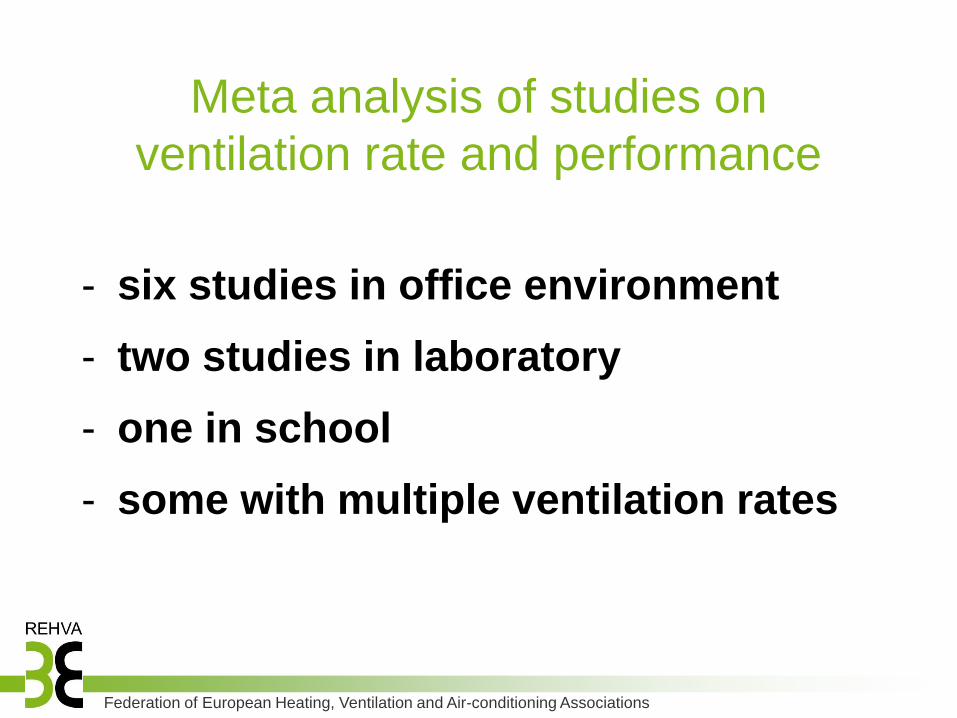
Meta analysis of studies on
ventilation rate and performance
- six studies in office environment
- two studies in laboratory
- one in school
- some with multiple ventilation rates
Federation of European Heating, Ventilation and Air-conditioning Associations
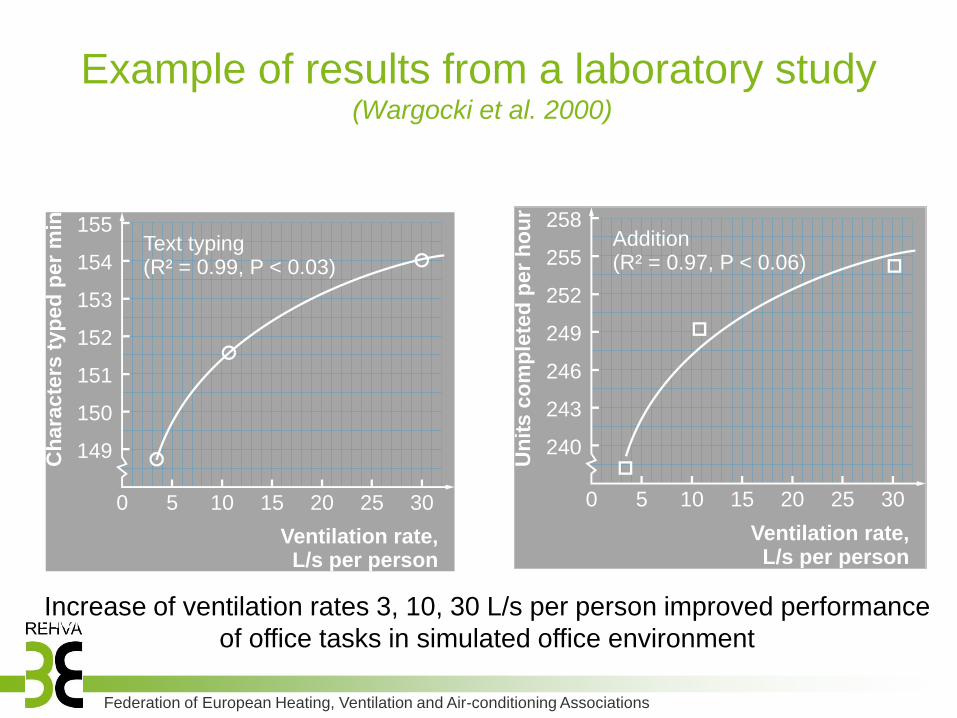
Example of results from a laboratory study (Wargocki et al. 2000)
Increase of ventilation rates 3, 10, 30 L/s per person improved performance
of office tasks in simulated office environment
258
255
252
249
246
243
240
0 5 10 15 20 25 30
Addition(R² = 0.97, P < 0.06)
Ventilation rate,L/s per person
Un
its
co
mp
lete
d p
er
ho
ur
155
154
153
152
151
150
149
0 5 10 15 20 25 30
Text typing(R² = 0.99, P < 0.03)
Ventilation rate,L/s per person
Ch
ara
cte
rs t
yp
ed
pe
r m
in
Increase of ventilation rates 3, 10, 30 L/s per person improved performance
of office tasks in simulated office environment

Federation of European Heating, Ventilation and Air-conditioning Associations
-4-2
02
46
De
lta
P%
/(1
0 L
/s-p
ers
on)
0 10 20 30 40 50
Ventilation Rate (L/s-person)
reported in each study
composite weighted
95% CI of composite weighted
90% CI of composite weighted
sample size weighted
unweighted
Unweighted
Sample size weighted
90% CI
95% CI
Sample size and
outcome weighted
Increase of performance (%) per in increase
in ventilation rate of 10 L/s-person
Federation of European Heating, Ventilation and Air-conditioning Associations
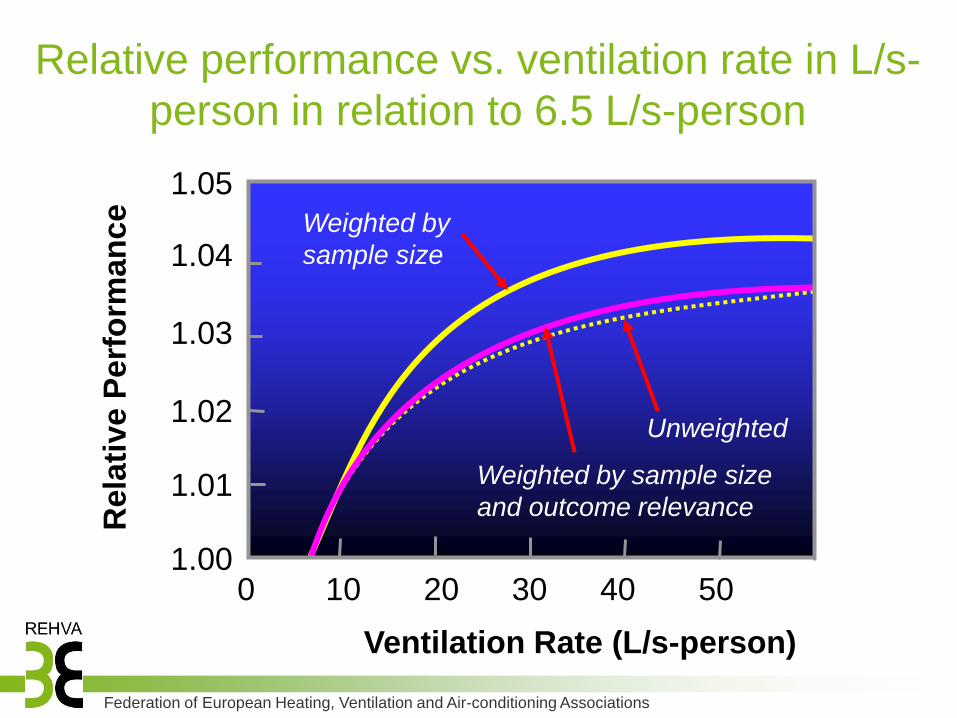
Relative performance vs. ventilation rate in L/s-
person in relation to 6.5 L/s-person
Ventilation Rate (L/s-person)
Rela
tive P
erf
orm
an
ce
0 10 20 30 40 50 60
1.01
1.00
1.02
1.03
1.04
1.05
Weighted by
sample size
Weighted by sample size
and outcome relevance
Unweighted

Federation of European Heating, Ventilation and Air-conditioning Associations
With balancing of air ventilation rates to
better IAQ and energy efficiency An office building in Helsinki
Ven
tila
tio
n r
ate
l/s, p
ers
on
Room number
0
10
20
30
40
50
60
70
1 26 51 76 101 126 151 176 201 226 251 276 301 326
(Tuomainen ym. 2003)
Good ventilation rate
20 l/s, person
Minimun
ventilation
rate
10 l/s, person

Federation of European Heating, Ventilation and Air-conditioning Associations
Performance and perceived
air quality (PAQ) • Perceived air quality has been used close
to hundred years as a criteria of air quality
and ventilation rates – also in many
standards
• PAQ is affected by pollutants, adaptation,
ventilation and other environmental
parameters (oC, RH)
• PAQ is used also as an indicator of air
quality for performance

Federation of European Heating, Ventilation and Air-conditioning Associations
Performance in text-typing vs. perceived air
quality in percentage of dissatisfied (PD%)- IAQ can be improved either by removal sources or by incresing
ventialtion reates
0.8% per 10% in PAQ
Display
terminal Building
materials
wall-to-wall carpet
(poor quality)
0 20 40 60 80
0.94
0.96
0.98
1.00
Perceived air quality, % dissatisfied
Rela
tive P
erf
orm
an
ce
R² = 0.6012

Federation of European Heating, Ventilation and Air-conditioning Associations
Temperature and performance

Federation of European Heating, Ventilation and Air-conditioning Associations
Effects of Temperature
• High temperature – causes discomfort
– increases heart attacks and mortality
• Low temperature – causes discomfort
– decreases the dexterity of fingers
• High temperature in the winter – increases SBS-symptoms
– deteriorated perceived indoor air quality
– increases the complaint on dry air
What about performance?
Federation of European Heating, Ventilation and Air-conditioning Associations
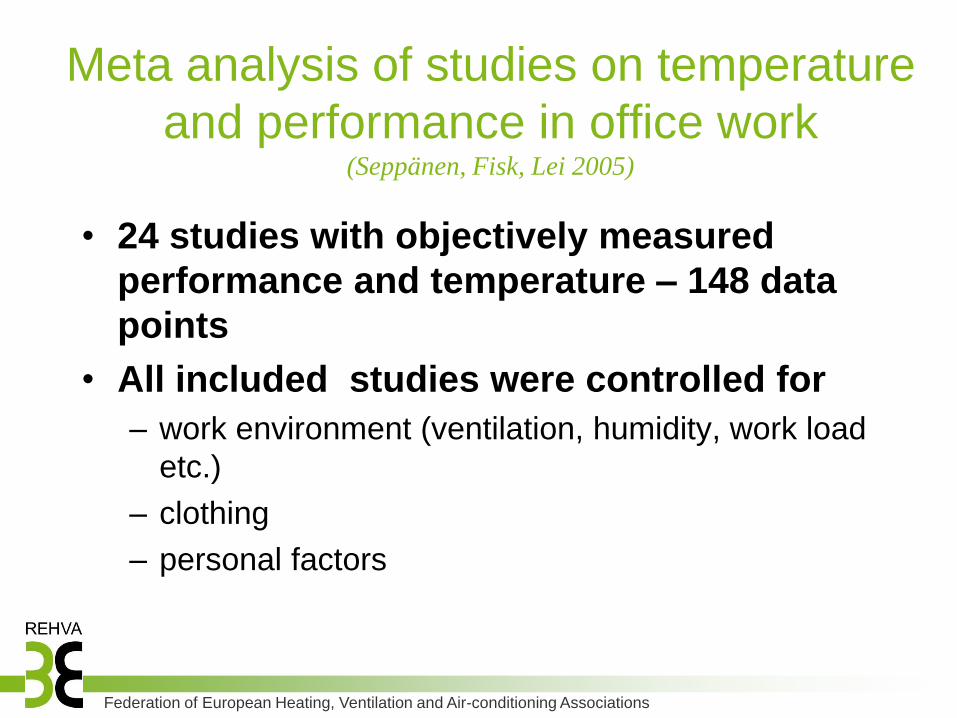
Meta analysis of studies on temperature
and performance in office work (Seppänen, Fisk, Lei 2005)
• 24 studies with objectively measured
performance and temperature – 148 data
points
• All included studies were controlled for
– work environment (ventilation, humidity, work load
etc.)
– clothing
– personal factors
Federation of European Heating, Ventilation and Air-conditioning Associations
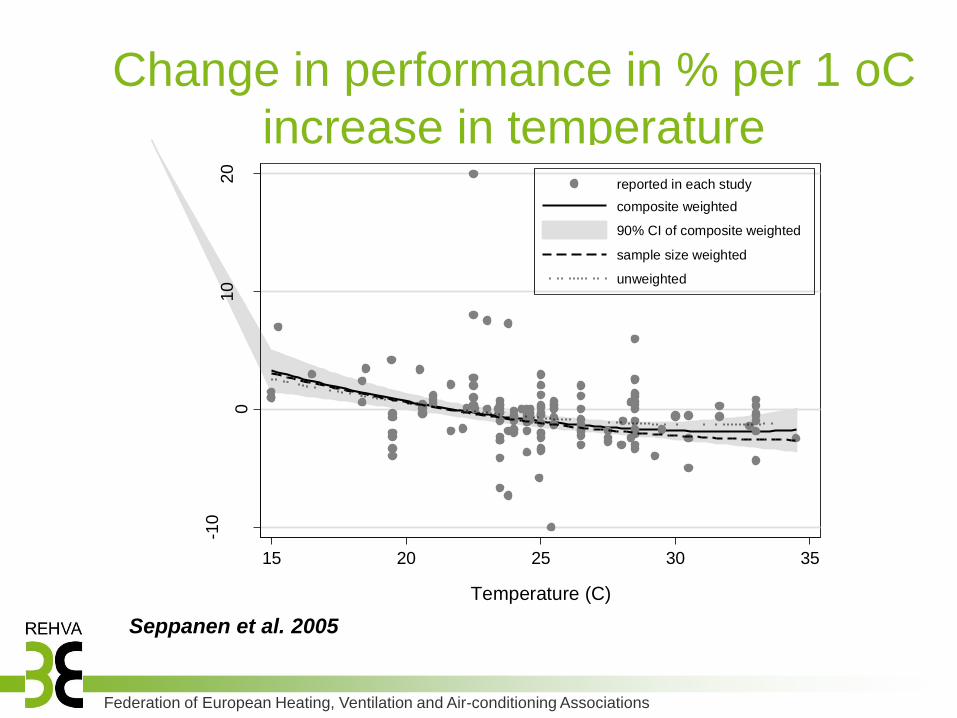
Change in performance in % per 1 oC
increase in temperature
-10
010
20
De
lta P
%/C
15 20 25 30 35
Temperature (C)
reported in each study
composite weighted
90% CI of composite weighted
sample size weighted
unweighted
Seppanen et al. 2005
Federation of European Heating, Ventilation and Air-conditioning Associations
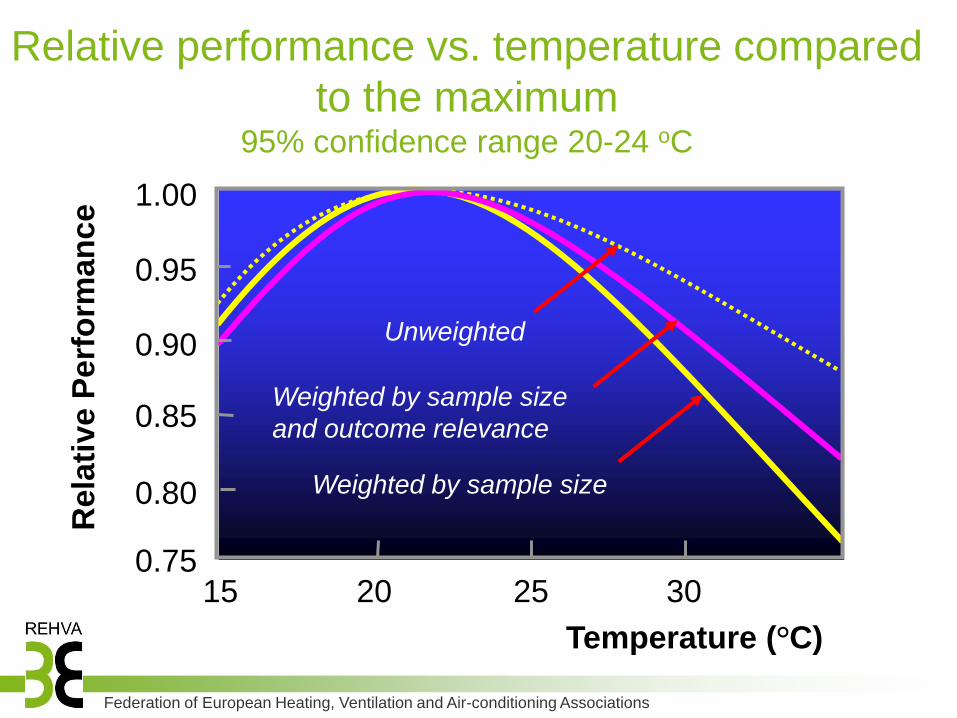
Relative performance vs. temperature compared
to the maximum 95% confidence range 20-24 oC
15 20 25 30 35 0.75
0.80
0.85
Temperature (°C)
0.90
0.95
1.00
Unweighted
Weighted by sample size
and outcome relevance
Weighted by sample size
Rela
tive P
erf
orm
an
ce

Federation of European Heating, Ventilation and Air-conditioning Associations
APPLICATION OF THE
PROCEDURE IN ENGINEERING
ANALYSIS
Federation of European Heating, Ventilation and Air-conditioning Associations
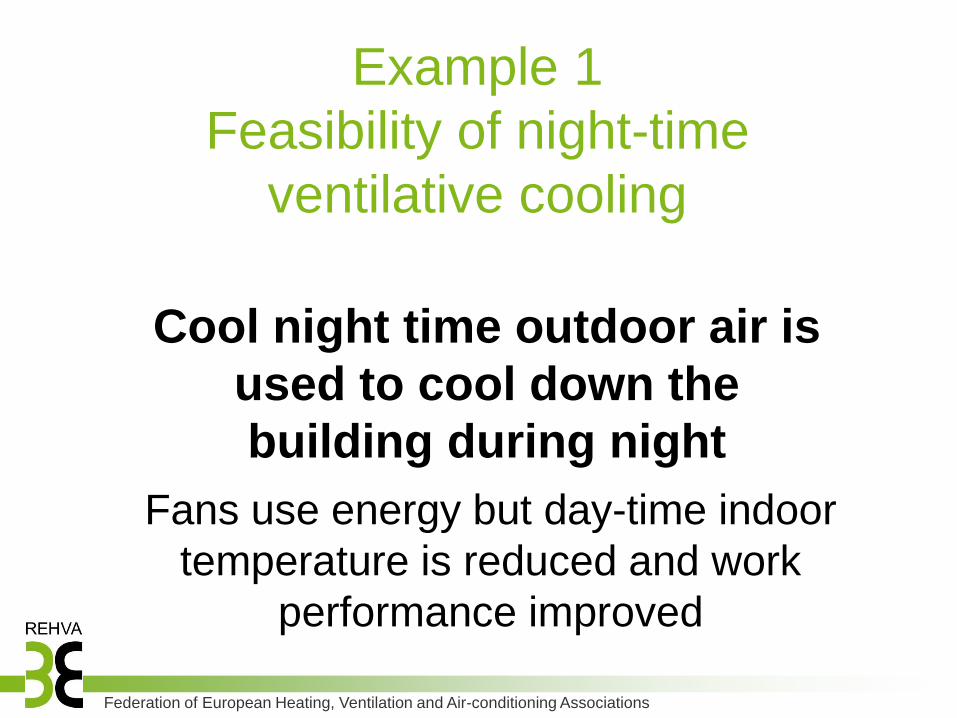
Example 1
Feasibility of night-time
ventilative cooling
Cool night time outdoor air is
used to cool down the
building during night
Fans use energy but day-time indoor
temperature is reduced and work
performance improved

Federation of European Heating, Ventilation and Air-conditioning Associations
Effect of night time ventilative cooling
on room temperatures
Kolokotroni et al. 2001 Aika
Te
mp
era
ture
, °C
Room air - no night time v.
Room surfaces- no night time v.
Outdoor air
Room air – with night time v.
Room surfaces – with night time v.
00:00 06:00 12:00 18:00 00:00
14
16
18
20
22
24
26
28
30

Federation of European Heating, Ventilation and Air-conditioning Associations
• Power use 2.5 kW per m3/s
• Cost of electricity 0.5 – 0.20 c/kWh
• Value of the work 25 €/h
• Effect of temperature on performance at office work
Data used in the analysis
Extra operation time of fans 10 h/night
Rela
tive
Perfor
man
ceSuhteellinensuoritus
15 20 25 30 350.75
0.80
0.85
Temperature (°C)
0.90
0.95
1.00
Unweighted
Weighted by sample size
and outcome relevance
Weighted by sample size
Suhteellinensuoritus
15 20 25 30 350.75
0.80
0.85
Temperature (°C)
0.90
0.95
1.00
Unweighted
Weighted by sample size
and outcome relevance
Weighted by sample size

Federation of European Heating, Ventilation and Air-conditioning Associations
Effect on temperatures and lost work time
17.2
6.2 1.2 1.2 1.2 1.1 .6 .4 .3 .2 lostmi
n
26 26.1 26.1 25.9 24.5 24 23.6 23.5 t op
23.4 3.1 3.1 3.1 3.0 3.0 2.9 2.9 2.5 lost
min
27.9 27.9 27.9 27.8 27.8 27.6 27.2 27.1 t op
27.3 27.1 27.0 26.8 26.5 24.5 21.5 19 t out
8-17 16-17 15-16 14-15 13-14 11-12 10-11 9-10 8-9
With night-time cooling
Without night-time cooling
Less lost work time, min per day
Federation of European Heating, Ventilation and Air-conditioning Associations
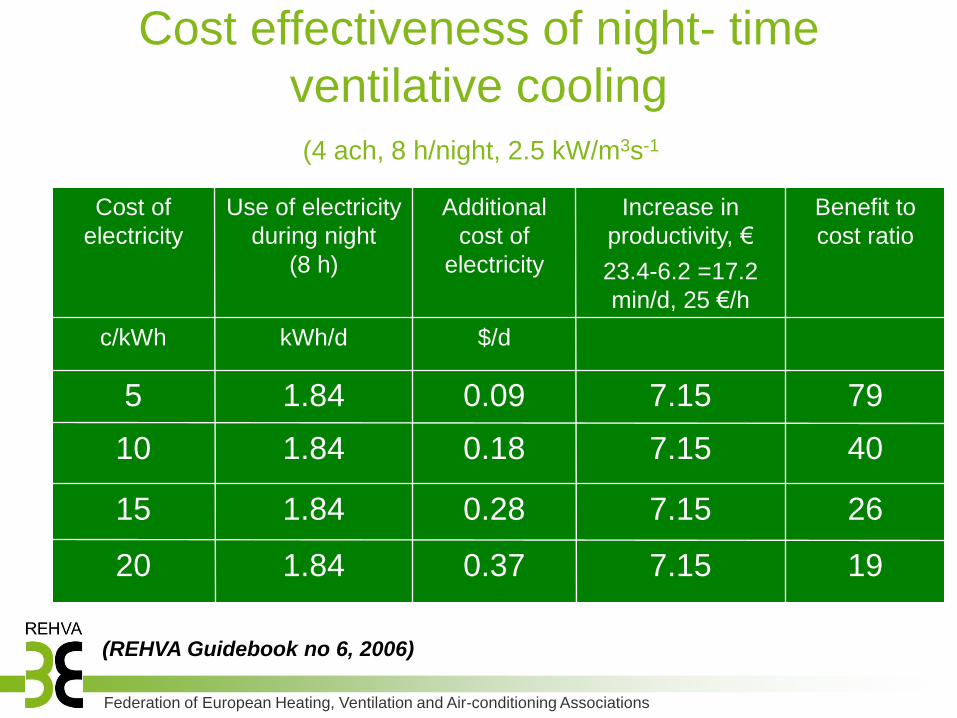
Cost effectiveness of night- time
ventilative cooling
(4 ach, 8 h/night, 2.5 kW/m3s-1)
$/d kWh/d c/kWh
19 7.15 0.37 1.84 20
26 7.15 0.28 1.84 15
40 7.15 0.18 1.84 10
79 7.15 0.09 1.84 5
Benefit to
cost ratio
Increase in
productivity, €
23.4-6.2 =17.2
min/d, 25 €/h
Additional
cost of
electricity
Use of electricity
during night
(8 h)
Cost of
electricity
(REHVA Guidebook no 6, 2006)

Federation of European Heating, Ventilation and Air-conditioning Associations
Example 2
Cost effectiveness of air conditioning,
extended operation time of
ventilation, and increased supplu air
flow rate
Federation of European Heating, Ventilation and Air-conditioning Associations
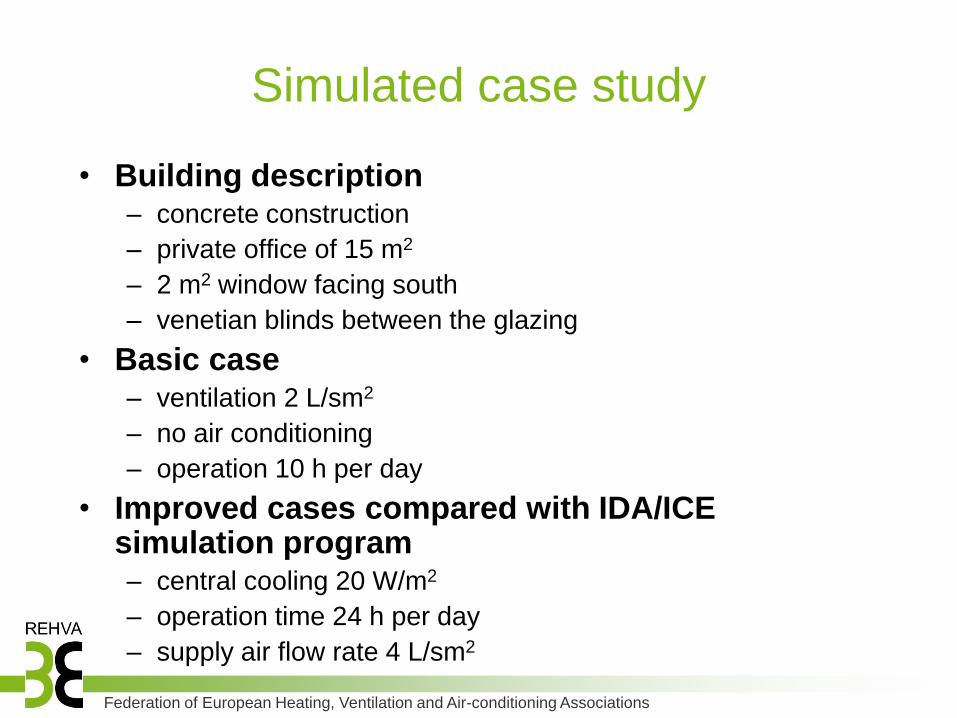
Simulated case study
• Building description – concrete construction
– private office of 15 m2
– 2 m2 window facing south
– venetian blinds between the glazing
• Basic case – ventilation 2 L/sm2
– no air conditioning
– operation 10 h per day
• Improved cases compared with IDA/ICE simulation program – central cooling 20 W/m2
– operation time 24 h per day
– supply air flow rate 4 L/sm2

Federation of European Heating, Ventilation and Air-conditioning Associations
Cost of office environment(additional energy, investment, productivity loss)
0
100
200
300
400
500
600
700
800
Compared cases
An
nu
al
co
st,
eu
ros
/per
son
Basic case:2 L/sm²,10 h/d
20 W/m²,10 h/d
2 L/sm²,24 h/d
4 L/sm²,24 h/d
4 L/sm²,24 h/d,
20 W/m²
energy investment lost productivity total
Costs and benefits of air conditioning and
extended operation time

Federation of European Heating, Ventilation and Air-conditioning Associations
Example 3
Economizer System Evaluation = use
more outdoor air and less return air
when feasible

Federation of European Heating, Ventilation and Air-conditioning Associations
Economizer Systems Modulate Outdoor Air (OA) Supply
Purpose
• reduce HVAC energy
• maintain minimum vent. rate
Method
• use outdoor air for cooling when less expensive than mechanical cooling
Usage in the USA
• common in large HVAC
• considered too expensive for small HVAC
Outdoor Temperature 25 oC
100% OA Min. OA
% O
utd
oo
r A
ir
No economizer

Federation of European Heating, Ventilation and Air-conditioning Associations
Approach – simulation of a case
building
Energy & Ventilation Rate Modeling
• 2000 m2 office building in Washington, DC, VAV HVAC, with and w/o economizer
– Used DOE 2 energy simulation model
– Hourly ventilation rates for year
– Energy use for year
Economic analyses
• energy cost savings from DOE-2 model
• apply absence - vent. rate model
• value of absence based on salary & benefits
0
0.2
0.4
0.6
0.8
1
0 1 2 3 4Ventilation rate (h-1)
Illn
ess
or
sick
leav
e p
rev
ale
nce r
ela
tiv
e
to p
rev
ale
nce w
ith
no
ven
tila
tio
n
Milton (2000), sick leave in officesBrundage (1988), illness in barracks, all yearsBrundage (1988), illness in barracks, 1983 dataDrinka (1996), illness in nursing homeParticle concentration model

Federation of European Heating, Ventilation and Air-conditioning Associations
Results Estimated Annual Benefits of Economizer
Estimated savings from reduced illness-related
absence is 3 - 8 times energy cost savings
Savings from Economizer Minimum
Vent Rate Energy Cost
Savings
Sick Leave Savings
L/ s per person € per worker Days
per
worker
€ per worker
220€ -- €180 1.1 – 0.9 26 10
97 € -- 83€ 0.5 – 0.4 31 20

Federation of European Heating, Ventilation and Air-conditioning Associations
Higher
rent
Economic benefits as driving force Leased building
Investment
Better IAQ
Better
productivity
Less sick leave
Less complaints
Building owner
Benefits to
employer
Higher market value of building
Higher user satisfaction

Federation of European Heating, Ventilation and Air-conditioning Associations
Conclusion • Value of productivity and health improvements
should be included in the life cycle calculations
• These costs are significant, and in same oder of magnitude or higher than the energy cost of buildings
• Most IAQ improvements are very cost effective when producitivity and health benefits are included
• Qualitative data is not adequate between IAQ and human responses – more quantitative data is needed

Federation of European Heating, Ventilation and Air-conditioning Associations
Thank you
for your
attention
To order the REHVA guidebooks :
www.rehva.eu / section Bookstore
or through your national member