indonesian economic diversification as an emerging markets
TRANSCRIPT

I N O V A S I - 17 (3), 2021; 549-564
http://journal.feb.unmul.ac.id/index.php/INOVASI
Copyright@2021; Inovasi - pISSN: 0216-7786 - eISSN: 2528-1097
549
Indonesian economic diversification as an emerging markets country to drive
economic growth
Zulfikar Hasan
Department of Islamic Banking and Centre for Research and Community Service at STAIN Bengkalis, Riau.
Email: [email protected]
Abstract
Indonesia's economic growth as an emerging market country can be determined f rom various variables to be measured. For this study, the authors take the variables of economic growth, infrastructure development, regional economic development, and Special Economic Zones to encourage economic diversification. Economic diversification is needed to increase regional income and increase economic growth, in addition to reducing poverty and creating job opportunities. Economic diversification needs to be done with various policies that can have a good impact on society, one of the most important things to do is improve good infrastructure, especially in rural areas. Most researchers have raised the theme of economic growth by linking poverty levels, but the authors are very interested in linking with infrastructure, regional economies, and also special economic zones. The research used in this paper combines qualitative and quantitative research, where qualitative research looks at the policies that have been and will be made by the central government to support economic diversification. Meanwhile, quantitative research relates more to the effect of economic growth with infrastructure and regional budgets. The results of the author's research indicate that there is a close relationship between economic growth and infrastructure development, where there is a positive relationship between these two variables. Meanwhile, for regional economic development, the central government has provided a stimulus that continues to increase every year. Special Economic Zones are also built based on budget rather than APBN and APBD according to budget optimization from the government.
Keywords: Diversification; emerging markets; economic growth

Indonesian economic diversification as an emerging markets country to drive economic growth ;
Zulfikar Hasan
Copyright@2021; Inovasi - pISSN: 0216-7786 - eISSN: 2528-1097
550
INTRODUCTION
Economic growth as a method of improving output over time is an essential indicator to include the successful development of a country (Todaro, P, & Stephen, 2003). Therefore, it is interesting to identify the various factors that influence it, including the role of government, to be studied more deeply. According to the basic theory of Neoclassical economic growth from Solow and Swan (1956), there is no impact on the role of government on growth in both spending and taxes (Kneller, Richard, Michael, & Norman, 1999). Economic growth is only affected by a stock of capital, labor, and technology that are exogenous. The government can influence the population growth to affect the availability of labor but does not have an impact on economic growth.
Endogenous growth theory (endogenous growth theory) illustrates that investment in physical capital and human capital play a role in determining long-term economic growth. The government's contribution to economic growth can be explained by its influence on changing consumption or spending on public investment and tax revenues. This theory group also considers the existence of infrastructure, laws, and regulations, political stability, government policies, burea ucracy, and the basis of international exchange as important factors that also affect economic growth.
In general, the theory of economic growth can be group into two, namely classical economic growth theory and theory of modern economic growth. In classical economic growth theory, analysis is base on the effectiveness of free-market mechanisms. Classical economic theory is a system neologized by economists who lived in the 18th to early 20th centuries. These classical economists involved Adam Smith, David Ricardo, and W.A Lewis.
Another theory that explains economic growth is the modern economic growth theory. The general characteristic feature of this theory is the role of government in overcoming the failure of the free market system. This group tends not to recognize the effectiveness of a free market system without government intervention. Harrod Domar's theory of economic growth is one of the modern growth theories. Harrod ‐ Domar is a direct development from Keynesian short-term macro theory to long-term macro theory. According to these two economists, investment expenditure (I) not only affects aggregate demand (AD) but also aggregate supply (US) through its inf luence on production capacity. In this longer perspective, investment increases the stock of capital (K). Harrod ‐ Domar said that every addition to the community's capital stock increases the community 's capacity to produce output. The intended output is the potential output that can be generated with the existing capital stock. Meanwhile, the realized output is not necessarily the same as potential output, it depends on the amount of aggregate demand.
Fiscal policy is a government policy concerning the level of government purchases, transfers, and tax structures. Fiscal policy can also be understood as an economic policy carried out by the government through changes in state revenue to achieve certain goals. The scope of this policy is in the areas of government spending and tax revenue, so it is also known as a budget policy. In general, the objectives of the fiscal policy to be achieved include increasing national income, employment opportunities, lowering the inflation rate, reducing the trade balance deficit, and the international balance of payments deficit.
Besides, good economic growth in a country can have a positive impact on society, such as alleviating poverty and also creating jobs.
Economic growth can have a positive impact on poverty decrease when economic growth occurs side with the poor. (Siregar, 2006) also states that economic growth is a necessary condition for poverty reduction, while a sufficient condition is that economic growth must be effective in reducing poverty. That means the growth should spread across all income groups, including among the p oor (growth with equity). Directly, this means that growth needs to be ensured in sectors where the poor work (agriculture or labor-intensive sectors). Indirectly, this means that a sufficiently effective government is needed to redistribute the benefits of growth.
Economic diversification is seen as making a positive contribution to economic representation, developing a multi-sector economy, balancing the structure of the national economy, stabilizing socio-economic conditions including enhancing people's living standards, and making the country's

INOVASI – 17 (3), 2021
549-564
Copyright@2021; Inovasi - pISSN: 0216-7786 - eISSN: 2528-1097
551
economy more open (Nghiem, 2010). Global economic trends lead to economic diversification, which is shown by the decline in the contribution of the agricultural sector to the economy.
The solution to increasing the non-government sector in promoting economic growth is through increasing the regional economy through diversification. Why is regional diversification so urgent? Because besides being believed to be able to increase the driving force of the economy, it is also hoped that it will become a special strategy in supporting quality and sustainable economic growth in Indonesia.
As we know, a balanced growth source structure, both between economic sectors and between regions, is very strategic in maintaining economic stability and strengthening the sustainability of economic growth. The dynamics of the national economy in recent years provide an important lesson that the structure of the economy. Which is concentrated in the primary commodity sector, which can make the Indonesian economy vulnerable to global shocks. A low diversification ratio will lead to a contraction in economic growth in the regions, thus becoming an obstacle to national economic growth.
Therefore, it is necessary to strengthen the economy, by exploring sources of economic growth through the expansion of regional diversification. This regional diversification policy is estimated to add 0.3% -0.4% of the Gross Domestic Product (GDP). One of the causes of low economic growth in several provinces is dependence on natural resources (SDA), especially in the plantation, quarrying, and mining sectors. When viewed regionally, there are provinces in Indonesia that have experienced an economic contraction in the last few years. These areas are provinces that have a high dependence on natural resources. So, we need a quick and precise solution to diversify the area. Integrated steps from the government are needed, such as expanding infrastructure development, developing investment in Human Resources (HR), and strengthening bureaucratic governance.
The efforts that have been carried out by the government to increase Indonesia's economic growth are certainly not easy, but there needs to be fundamental strengthening from the governme nt such as making clear regulations and implementation. Such as policies that can encourage economic growth with several driving factors such as infrastructure development policies. The optimizing the regional economy and the development of Special Economic Zones have been established by the government.
METHOD
The method used by researchers in this paper is a combination of qualitative and quantitative research. The analytic methodology consists of three steps: variable selection, data collection, and data analysis. The research chooses one variable in each industry included in the stock market. The variable selection depends on it is relative importance in the industry or sector. Sectors that are represented in this study are infrastructure development, regional economy, economic growth, and special economic zones.
This paper uses cointegration time-series techniques and the Granger causality test to examine long-term relationships and dynamic interactions between variables of interest. As this method is now well-known, we only mention those aspects that were relevant in our research. First, for exact model specifications, we performed unit root and cointegration tests. We implement a group unit root test, like so:
(Levin, C, & C, 2002) t (assuming a common unit root process), lm, (Pesaran & Y, 2003), Augmented Dickey-Fuller (ADF) (H & B, 2004) unit root test (assuming individual unit root processes) to determine command variables integration. Then, to test for cointegration, the autoregressive vector-based approach (VAR) was used by (Johansen, 1998) and Johansen & Juselius (1990), then the JJ cointegration test was carried out. Since JJ's results cointegration tests tend to be sensitive to the VAR sequence, following Hall (1989) and Johansen (1992), we determine the lag length makes the error term uncorrelated series.
Specifically, Chang considers a panel model generated by a first-order autoregressive regression:

Indonesian economic diversification as an emerging markets country to drive economic growth ;
Zulfikar Hasan
Copyright@2021; Inovasi - pISSN: 0216-7786 - eISSN: 2528-1097
552
Yit = 𝝆IYit-1 + 𝝁it
where as usual i = 1,..., N denotes individual cross-sectional units and t =1,...,Ti denotes time-series observations. Note that the total number T for each individual i may differ across cross-sectional units, i.e. unbalanced panels are allowed.
The initial values (y10,…,yN0) are set at zero for simplicity. The error term u it is given by an AR (pi) invertible process: 𝛾I (L) Uit = 𝜀it
The augmented regression can be written in matrix form as:
yi = yliPi + Xi𝜷I + 𝜺it
Instead of basing the unit root tests on deviations from the estimated common factors, (Pesaran, 2003) proposes a test based on standard unit root statistics in a Cross-sectionally Augmented DF (CADF) regression - that is a DF (or ADF) regression which is augmented with the cross-section averages of lagged levels and first-differences of the individual series.
∆yit = ai + biyit-1 + ciyt-1 + di∆𝒚t + eit
Where : yt =N-1 ∑𝑁𝑗=1 yjt, ∆𝑦t = N-1 ∑𝑁
𝑗=1 ∆𝑦jt and eit is the regression error
Individual CADF statistics are used to develop a modified version of the IPS t-bar test (denoted CIPS for Cross-sectionally Augmented IPS) that simultaneously take account of cross-section dependence and residual serial correlation:
CIPS = 𝟏
𝑵 ∑𝒏
𝒊=𝒍 CADFi
After implementing the unit root and cointegration tests, we proceeded to the specification and estimation of Granger causality. Especially, the finding that the variables are not stationary and not cointegrating suggests the use of the Granger causality VAR model at the first difference. However, if they are cointegrated, a vector error correction model (VECM) or VAR level can be used (R & Granger, 1987). According to Granger's representation theorem, for each cointegrated series, the error correction term must be included in the model. Engle & Granger (1987) and (Toda & Phillips, 1993) show that omitting this error correction term (ECT) in the model leads to model specification errors. Through ECT, ECM opens additional channels for the emergence of Granger causality which is completely ignored by the standard Granger and Sims test (Masih & Masih, 1999)
VECM can then be easily reformulated in the form of a matrix as follows:
(∆𝑰𝑫∆𝑹𝑬
∆𝑺𝑬𝒁∆𝑬𝑮
) = (𝜶𝟎𝜶𝟏𝜶𝟐𝜶𝟑
) + ∑ 𝝉𝒊𝒌𝒊=𝟏 (
∆𝑰𝑫∆𝑹𝑬
∆𝑺𝑬𝒁∆𝑬𝑮
) + (
𝑰𝑫𝑹𝑬
𝑺𝑬𝒁𝑬𝑮
) + (𝒗𝟎𝒗𝟏𝒗𝟐𝒗𝟑
)
Where ID is infrastructure development, RE is a regional economy, SEZ is special economic zones and EC is economic growth.
The data used in this study are annual data for the period of 2015 to 2020. The data set is compiled into a panel data from sources as The Central Bureau of Statistics , Ministry of Finance, Committee for an acceleration of priority infrastructure provision (KPPIP), Ministry of National Development Planning of Indonesia, or Bappenas/PPN in collaboration with the central government. In this paper, the focal variables are infrastructure development (ID), regional economy (RE), special economic zones (SEZ), and economic growth (EG).
Testing of the Partial Regression Coefficient (t-test). This analysis is used to measure the strength of variables and also shows the direction of the relationship between the dependent variable and the independent variable. The formula for multiple linear regression in general is:
Y = a + b1 X1 + b2 X2 + e

INOVASI – 17 (3), 2021
549-564
Copyright@2021; Inovasi - pISSN: 0216-7786 - eISSN: 2528-1097
553
Linear regression analysis is used in this study to determine whether there is the influence of independent variables. The t statistical test shows how far one independent variable individually explains the variation in the dependent variable. There are two ways to look at this: If Prob. > ɑ (5%), then H0 is accepted;
Conversely, if Prob <0.05 then reject H0
Note: H0 = independent variable does not affect the dependent variable. H1 = independent variable affects the dependent variable.
Table 1. Description of variables
Variables Descriptions Sources
Country
Indonesia as an emerging market in the world. According
to Oxford Economics, it has the most interesting growth
story in the world. In the future, Indonesia 's insistence
becomes the locomotive of the global economy in the
coming years. Blessed with abounding natural resources
and frequently independent of foreign funding, Indonesia
looks set to become a fundamental player in the future
with GDP growth of 5.1% per annum.
Oxford Economics, world bank,
International Monetary Fund
Economic
Growth
Indonesia 's economic growth from 2010-2020 has
decreased in 2020 Indonesia 's economic growth will reach
6.22%. In the third quarter of 2020, the Indonesian
economy grew by -3.49% (YoY); improved from the
previous quarter at -5.32% (YoY). That shows the process
of economic recovery and the turning point of national
economic activities towards the positive zone.
Ministry of Finance, World
Bank, The Central Bureau of
Statistics, Bank Indonesia
Infrastructure
Development
(ID)
To support the achievement of the government's vision and
mission for the 2015-2020 period. Infrastructure
development has an important role in the national
development strategy. The infrastructure development
budget in 2015 is 290 trillion rupiahs, in 2020 it will
increase to 419.2 trillion rupiah
Ministry of Finance, Committee
for the acceleration of priority
infrastructure provision
(KPPIP), Ministry of National
Development Planning of
Indonesia or Bappenas/PPN
Regional
Economy (RE)
Transfer to regions and village funds (trillion rupiahs). In
the 2019 State Budget, Transfers to Regions and Village
Funds (TKDD) are allocated to reach IDR 826.77 trillion.
The TKDD consists of transfers to the regions of IDR
756.77 trillion and Village Funds of IDR 70.0 trillion.
More than 75 Percent of APBD is Used up for Salary and
Operational Expenditures.
Ministry of Finance
Special
Economic
Zones (SEZ)
Encouraging investment and increasing international
competitiveness, growth, job creation, and foreign
exchange earnings.
SEZ development is financed from the State Revenue and
Expenditure Budget (APBN) and/or Regional Revenue and
Expenditure Budget (APBD)
Ministry of National
Development Planning of
Indonesia or Bappenas/PPN
Among the variables above are used as a measurement tool by the author to see how the direction of policies that have been and will be carried out by the government to improve the economic sector of the Indonesian population. The variables above will be obtained through reliable sources from the central government, such as reports from the Ministry of Finance, besides being analyzed through the author's analysis by putting forward economic theories such as optimization of the regional economy to help accelerate sustainable development.
RESULTS AND DISCUSSION
In Indonesia, high and sustainable economic growth during the New Order era (1966-1998) made a major contribution to poverty reduction (as measured by the number of people living below the

Indonesian economic diversification as an emerging markets country to drive economic growth ;
Zulfikar Hasan
Copyright@2021; Inovasi - pISSN: 0216-7786 - eISSN: 2528-1097
554
poverty line as a percentage of the total population). However, after that, in 1999, the poverty rate began to decline slowly until 2005. However, in 2006, the number of poverty increased again to 17.75 percent or around 39.30 million people. The increase in the number of poor people in 2006 was mainly due to the impact of the cut in fuel subsidies that occurred towards the end of 2005.
The results of Indonesia's economic growth performance throughout the New Order era, it has provided exceptional experiences for the Indonesian people. This considerable experience has made various policies for the central government to increase economic growth such as economic diversification in addition to the stimulus provided by the government.
Figure 1. Indonesia economic growth 2015-2020
Infrastructure is an important factor in supporting economic growth. For this reason, the government continues to increase the infrastructure budget. Since 2009-2017 the infrastructure budget for APBN expenditure has continued to increase and has always been above 8 percent.
Table 2. The development of Indonesia 's economic diversification, infrastructure development, and regional
economy
Tahun Economic Growth Infrastructure Development (in trillion) Regional Economic (in trillion)
2015 4.88 256.1 623.1
2016 5.03 269.1 710.3
2017 5.07 388.3 755.9
2018 5.17 410.7 766.2
2019 5.02 415 826.8
2020 2.97 419 920
Indonesian economic diversification, which is used as a measuring tool f or the researcher is economic growth, infrastructure, and regional economies. From 2015 to 2020 there has been an increase in infrastructure and the regional economy in this case related to village funds transferred from the central government to local governments.
Table 3. Method: Least Squares
Variable Coefficient Std. Error t-Statistic Prob.
C 7.05E+12 1.60E+12 4.410606 0.0216
X1 -5.68E+11 2.26E+11 -2.518409 0.0863
X2 0.913986 0.251525 3.633777 0.0359
R-squared 0.902505 Mean dependent var 7.67E+12
Adjusted R-squared 0.837509 S.D. dependent var 1.01E+12
S.E. of regression 4.07E+11 Akaike info criterion 56.61005 Sum squared resid 4.98E+23 Schwarz criterion 56.50593
4,88 5,03 5,07 5,17 5,02
2,97
0
1
2
3
4
5
6
2015 2016 2017 2018 2019 2020
Economic
Growth

INOVASI – 17 (3), 2021
549-564
Copyright@2021; Inovasi - pISSN: 0216-7786 - eISSN: 2528-1097
555
Variable Coefficient Std. Error t-Statistic Prob.
Log-likelihood -166.8302 Hannan-Quinn criteria. 56.19325 F-statistic 13.88543 Durbin-Watson stat 2.778837 Prob(F-statistic) 0.030442
Based on the results of the t-test, the decision making is as follows:
Testing the variable X1
The first hypothesis states that X1 does not have a significant effect on Y. Based on the results of data calculations using the Eview 11 program, the result is that the significance value is 0 .0863. This means that the decision to reject H1 and accept H0 means that X1 has a significant effect on Y because the significance value is greater than 0.05 with a positive relationship direction.
Testing the variable X2
The second hypothesis states that X2 has a significant and positive effect on Y. Based on the results of data calculations using the Eviews 11. the program, it is found that the significance value is 0.0359. This means that the decision to reject H0 and accept H1 means that X2 has a significant effect on Y because the significance value is smaller than 0.05 with a negative relationship direction.
Based on the test results with the multiple linear regression method to test the effect of the independent variables (X1 and X2) on the dependent variable (Y), an equation can be drawn up as follows:
Y = C (1) + C (2) * X1 + C (3) * X2
Y = 7.05-5.68 * X1 + 0.914 * X2
These results can be explained as follows: The regression coefficient for X1 is -5.68, which means that every 1% increase in X1 will decrease Y by -5.68%, assuming other variables are constant, and vice versa; The regression coefficient of X2 is 0.914 which means that every 1% increase in the exchange rate will increase Y by 0.914%, assuming other variables are constant and vice versa.
Testing of the simultaneous regression coefficient (Test F)
Hypothesis testing F test is used to see whether overall the independent variables have a significant effect on the dependent variable. The results of data processing show that the independent variables (X1 and X2) have a significance F count of 13.88543 with a smaller significance level (0.030442) than 0.05. Thus the results of the analysis in this study indicate that together the independent variables (X1 and X2) affect Y. Thus the first hypothesis (H1) in this study can be accepted.
Multiple determination coefficient
The value of the multiple determination coefficient in Eviews 11 is the same as in other applications, which is labeled R-Square. In the table above, it can be seen that the R-Square is 0.902505, which means that a set of dependent variables in the model can explain the independent variables by 90.2%. while the rest is explained by other variables outside the model that are not studied.
Adjusted R Square
The adjusted R Square value means that the R Square value has been corrected by the standard error value. In the table above the R, Square adjuster is 0.837509 while the standard error value of the regression model is 4.07 indicated by the S.E of the regression label. This standard error value is greater than the standard deviation value of the independent variable designated with the label "S.D. dependent var "which is equal to 1.01 which means that the regression model is not valid as a model of the dependent variable.
Table 4. Summary
Method Statistic Prob.** Crosssections Obs
Null: unit root (assumes common unit root process)
Levin, Lin & Chu t* -0.25338 0.4000 3 15

Indonesian economic diversification as an emerging markets country to drive economic growth ;
Zulfikar Hasan
Copyright@2021; Inovasi - pISSN: 0216-7786 - eISSN: 2528-1097
556
Null: Unit root (assumes individual unit root process)
Im, Pesaran and Shin W-stat 1.14864 0.8746 3 15
ADF - Fisher Chi-square 1.64259 0.9495 3 15
PP - Fisher Chi-square 2.73860 0.8409 3 15
** Probabilities for Fisher tests are computed using an asymptotic Chi
-square distribution. All other tests assume asymptotic normality.
Table 5. Kevin Lin and Chu
Method Statistic Prob.**
Levin, Lin & Chu t* -0.25338 0.4000
** Probabilities are computed assuming asymptotic normality
Intermediate results on UNTITLED
2nd Stage Variance HAC of Max Band-
Series Coefficient of Reg Dep. Lag Lag width Obs
Y -0.02856 9.E+22 3.E+22 0 0 4.0 5
X2 -0.36954 1.E+23 7.E+22 0 0 4.0 5
X1 -0.25984 0.7053 0.7364 0 0 1.0 5
Coefficient t-Stat SE Reg mu* sig* Obs
Pooled -0.17779 -1.149 1.042 -0.554 0.919 15
Table 6. Im, Pesaran and Shin Unit Root
Method Statistic Prob.**
Im, Pesaran and Shin W-stat 1.14864 0.8746
** Probabilities are computed assuming asymptotic normality
Intermediate ADF test results
Max
Series t-Stat Prob. E(t) E(Var) Lag Lag Obs
Y -0.1117 0.8899 -1.558 2.648 0 0 5
X2 -1.2747 0.5491 -1.558 2.648 0 0 5
X1 -0.0501 0.9001 -1.558 2.648 0 0 5
Average -0.4788 -1.558 2.648
Warning: for some series the expected mean and variance for the given lag
and observation are not covered in IPS paper
Table 7. Unit root (individual unit root process) ADF Fisher
Method Statistic Prob.**
ADF - Fisher Chi-square 1.64259 0.9495
ADF - Choi Z-stat 1.51943 0.9357
** Probabilities for Fisher tests are computed using an asymptotic Chi
-square distribution. All other tests assume asymptotic normality.
Intermediate ADF test results UNTITLED
Series Prob. Lag Max Lag Obs
Y 0.8899 0 0 5
X2 0.5491 0 0 5
X1 0.9001 0 0 5
Table 8. Heteroskedasticity Test: Glejser
Null hypothesis: Homoskedasticity
F-statistic 9.995607 Prob. F(2,3) 0.0471
Obs*R-squared 5.217092 Prob. Chi-Square(2) 0.0736
Scaled explained SS 1.863522 Prob. Chi-Square(2) 0.3939
Test Equation:
Dependent Variable: ARESID
Method: Least Squares

INOVASI – 17 (3), 2021
549-564
Copyright@2021; Inovasi - pISSN: 0216-7786 - eISSN: 2528-1097
557
Date: 12/23/20 Time: 08:46
Sample: 1 6
Included observations: 6
Variable Coefficient Std. Error t-Statistic Prob.
C 3.48E+11 2.94E+11 1.182273 0.3223
X1 8.84E+10 4.15E+10 2.128162 0.1232
X2 -0.143049 0.046292 -3.090128 0.0537
R-squared 0.869515 Mean dependent var 2.48E+11
Adjusted R-squared 0.782526 S.D. dependent var 1.61E+11
S.E. of regression 7.50E+10 Akaike info criterion 53.22492
Sum squared resid 1.69E+22 Schwarz criterion 53.12080
Log-likelihood -156.6748 Hannan-Quinn criteria . 52.80812
F-statistic 9.995607 Durbin-Watson stat 2.574428
Prob(F-statistic) 0.047135
The Dickey-Fuller Augmented Test, the null hypothesis on the Dickey-Fuller test states that the unit root is in the autoregressive model. H0 = There is a unit root problem in the autoregressive model. H1 = There is no unit root problem in the autoregressive model.
From several tests that the author has done on the variables above, it can be concluded that the probability value is greater than a, either 1%, 5%, or 10%, so it does not reject H0, which means that there is a unit root problem in this autoregressive model.
Economic diversification policy according to the author
Integrated measures to expand the diversification of sources of economic growth, especially in areas that are still largely supported by primary commodities, need to be encouraged. This is important to strengthen the structure of economic resources evenly in Indonesia, not only focusing on several sectors, especially the primary commodity sector, which can leave Indonesia's economy vulnerable to global shocks.
Figure 2. Diversification of the Indonesian economy as an emerging market country
First, strengthening the development of basic regional infrastructure, continuing to develop investment in skilled human resources, and strengthening bureaucratic governance. Second, optimizing various potentials in regional economic sectors, both through vertical (downstream) and horizontal diversification. Third, develop Special Economic Zones (KEK) and Industrial Estates in an integrated manner.
Whereas the structure of a stabilized source of growth, both between economic sectors and between regions, is very strategic in maintaining economic stability and strengthening the sustainability of economic growth. The dynamics of the national economy in recent years provide an
Infrastructure development
Regional Economic
Special Zone Economic

Indonesian economic diversification as an emerging markets country to drive economic growth ;
Zulfikar Hasan
Copyright@2021; Inovasi - pISSN: 0216-7786 - eISSN: 2528-1097
558
important lesson that the economic structure that is concentrated only on a few sectors, especially the primary commodity sector can make the Indonesian economy vulnerable to global shocks. A low diversification ratio will lead to a contraction in economic growth in the regions, thus becoming an obstacle to national economic growth. Regional dependence on primary commodity prices causes economic growth to fluctuate, depending on the prices created in the market. If commodity prices are high, regional and national economic growth will be high and vice versa.
Figure 3. Economic diversification policy infrastructure development
The infrastructure budget extends to progress in line with the increase in Indonesia's economic growth. President Joko Widodo's work priority during the 2nd period of Indonesia's leadership is to accelerate infrastructure development, especially outside Java. The p riority of roads outside Java Island is one of the integrations of accelerated goods and services to strengthen fundamental sectors such as the flow of goods traffic. Where the target that the Government wants to achieve in increasing the infrastructure budget is:
Figure 4. Priority target
256,1 269,1
388,3410,7 415 419
0
50
100
150
200
250
300
350
400
450
2015 2016 2017 2018 2019 2020
Infrastructure budget (in trillion rupiah)
Road construction / reconstruction
Bridge construction
and rehabilitation
Airport constructi
on
Railway track
construction
Irrigation network
Dam
INOVASI – 17 (3), 2021
549-564
Copyright@2021; Inovasi - pISSN: 0216-7786 - eISSN: 2528-1097
559
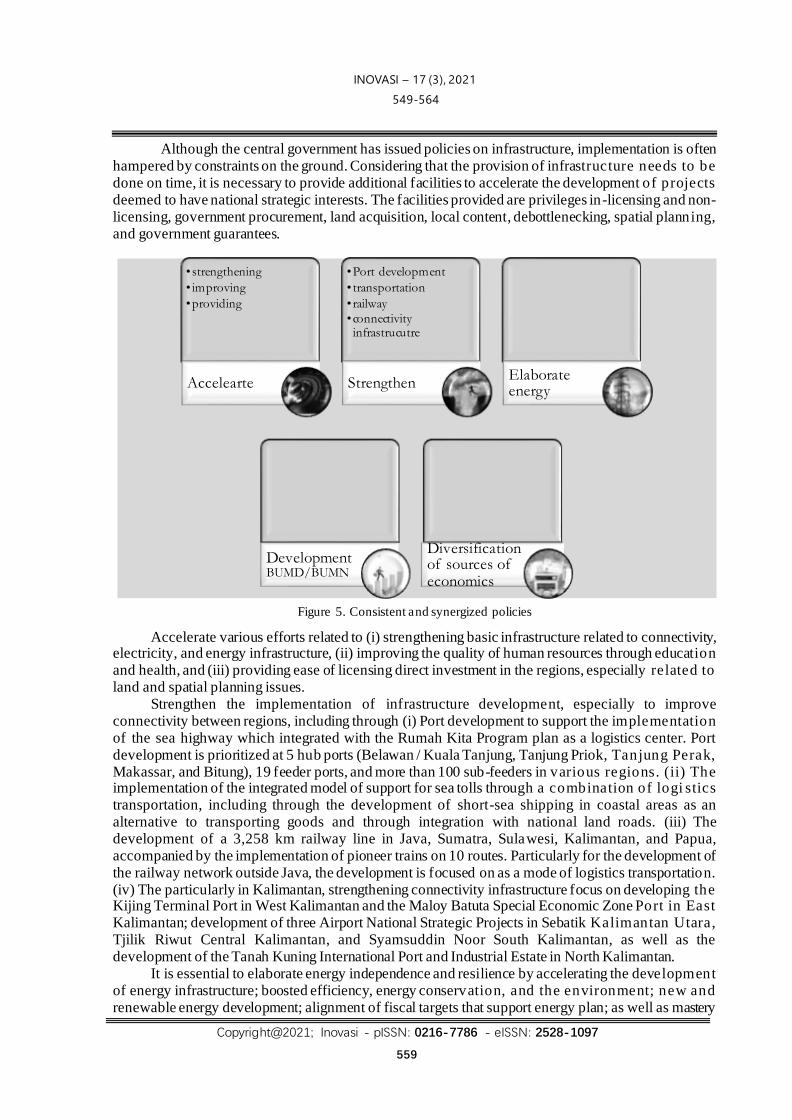
Although the central government has issued policies on infrastructure, implementation is often hampered by constraints on the ground. Considering that the provision of infrastructure needs to be done on time, it is necessary to provide additional facilities to accelerate the development of projects deemed to have national strategic interests. The facilities provided are privileges in-licensing and non-licensing, government procurement, land acquisition, local content, debottlenecking, spatial planning, and government guarantees.
Figure 5. Consistent and synergized policies
Accelerate various efforts related to (i) strengthening basic infrastructure related to connectivity, electricity, and energy infrastructure, (ii) improving the quality of human resources through education and health, and (iii) providing ease of licensing direct investment in the regions, especially related to land and spatial planning issues.
Strengthen the implementation of infrastructure development, especially to improve connectivity between regions, including through (i) Port development to support the implementation of the sea highway which integrated with the Rumah Kita Program plan as a logistics center. Port development is prioritized at 5 hub ports (Belawan / Kuala Tanjung, Tanjung Priok, Tanjung Perak, Makassar, and Bitung), 19 feeder ports, and more than 100 sub-feeders in various regions. (ii) The implementation of the integrated model of support for sea tolls through a combination of logi stics transportation, including through the development of short-sea shipping in coastal areas as an alternative to transporting goods and through integration with national land roads. (iii) The development of a 3,258 km railway line in Java, Sumatra, Sulawesi, Kalimantan, and Papua, accompanied by the implementation of pioneer trains on 10 routes. Particularly for the development of the railway network outside Java, the development is focused on as a mode of logistics transportation. (iv) The particularly in Kalimantan, strengthening connectivity infrastructure focus on developing the Kijing Terminal Port in West Kalimantan and the Maloy Batuta Special Economic Zone Port in East Kalimantan; development of three Airport National Strategic Projects in Sebatik Kalimantan Utara, Tjilik Riwut Central Kalimantan, and Syamsuddin Noor South Kalimantan, as well as the development of the Tanah Kuning International Port and Industrial Estate in North Kalimantan.
It is essential to elaborate energy independence and resilience by accelerating the development of energy infrastructure; boosted efficiency, energy conservation, and the environment; new and renewable energy development; alignment of fiscal targets that support energy plan; as well as mastery
• strengthening
• improving
•providing
Accelearte
•Port development
• transportation
• railway
•connectivity infrastrucutre
StrengthenElaborate energy
DevelopmentBUMD/BUMN
Diversification of sources of economics

Indonesian economic diversification as an emerging markets country to drive economic growth ;
Zulfikar Hasan
Copyright@2021; Inovasi - pISSN: 0216-7786 - eISSN: 2528-1097
560
of technology and increasing added value. The policy direction is carried out both nationally and regionally by taking into account the circumstances and potentials in each region (local wisdom). Increasing regional and national participation in energy development is carried out through the implementation of the BUMD / BUMN. Besides, the development of steam power and coal gas power plants needs to be encouraged and increased because it can support the availability of electricity f or the mining industry in a more efficient and environmentally friendly manner. In Kalimantan, the development of electric power infrastructure is also carried out through the use of coal reserves and hydropower sources. Accelerate the development of diversification of sources of economic growth, both vertically and horizontally. Vertical diversification is carried out downstream of the bauxite and palm oil industries.
Purpose of development of Special Economic Zones
Encouraging investment and increasing international competitiveness, growth, job creation, and foreign exchange earnings. To accelerate the achievement of national economic development, it is necessary to increase investment through the preparation of areas that have economic and geostrategic advantages. The zone is prepared to maximize industrial activities, exports, imports, and other economic activities that have high economic value. SEZ development aims to accelerate regional development and as a breakthrough model for regional development for economic growth, inc luding industry, tourism, and trade to increase employment.
Figure 6. Related to area development

INOVASI – 17 (3), 2021
549-564
Copyright@2021; Inovasi - pISSN: 0216-7786 - eISSN: 2528-1097
561
Figure 7. Industrial development and SEZs distribution of industrial estates snd special economic zones
To accelerate the achievement of national economic development that is felt by all Indonesian people, a breakthrough in regional development models is needed. The development of Special Economic Zones is a breakthrough in regional development that has the target of increasing investment, optimizing competitive industries, accelerating regional development for economic growth, including industry, tourism, and trade to increase employment. Special Economic Zones consist of one or several zones, namely: export management, logistics, technology development, industry, tourism, energy, and other economies.
Figure 8. Industrial development / SEZ Integrated Planning
Acceleration of Industrial
Growth and Industrial
Estates
Population
increaseProductivit
y and industrial
competitiveness
Industrial area
development
Build a business and investment
climate
Financing with
competitive access and feesCompetent
and disciplined Industrial
HR
Friendly industrial relations
Providing harmonious fiscal
incentives
Increased access to
global markets
(Exports)
Availability of infrastructure and energy
Availability and quality
of raw materials

Indonesian economic diversification as an emerging markets country to drive economic growth ;
Zulfikar Hasan
Copyright@2021; Inovasi - pISSN: 0216-7786 - eISSN: 2528-1097
562
In the 2019 State Budget, Transfers to Regions and Village Funds (TKDD) were allocated to reach IDR 826.77 trillion. The TKDD consists of transfers to the regions of IDR 756.77 trillion and Village Funds of IDR 70.0 trillion.
Figure 9. Transfer to regions and village funds/regional economic (trillion rupiahs)
Village funds are APBN funds allocated for villages that are transferred through the district/city APBD and prioritized for the implementation of development and empowerment of village communities. Through the Village Law, the Village authority has been strengthened in government administration, development implementation, community development, and village community empowerment. Apart from strengthening their authority, villages are also given sources of income.
Figure 10. Village fund output priority
The use of Village Funds is prioritized to finance development and community empowerment aimed at improving the welfare of rural communities. Improving the quality of human life and poverty alleviation, and outlined in the village government work plan. The implementation of activities financed from the village fund shall be guided by the technical guidelines set by the regent/mayor
623,1710,3
755,9 766,2826,8
920
0
100
200
300
400
500
600
700
800
900
1000
2015 2016 2017 2018 2019 2020
Regional
economy
budget (in
trillion rupiah)
Village road
Bridge
Clean Water Connection
Drainag &
Irrigation
PolindesVillage Market
Village PAUD
Well
Embung Desa

INOVASI – 17 (3), 2021
549-564
Copyright@2021; Inovasi - pISSN: 0216-7786 - eISSN: 2528-1097
563
regarding activities financed from the village fund. Prioritized implementation of activities funded by the Village Fund is self-managed using local resources/raw materials and is pursued by absorbing more labor from the local village community. The Village Fund can be used to finance activities that are not included in the priority use of the Village Fund after obtaining approval from the regent/mayor by ensuring that the Village Fund allocation for priority activities has been fulfilled and/or development and community empowerment activities have been fulfilled.
CONCLUSIONS
From the findings of the first party and developed by the author, it can be concluded that the relationship between infrastructure development and the regional economy has a significant relationship. Among the variables used as a measuring tool by this writer are several indicators that can be done, it is hoped that there will be more other authors to raise the theme of economic diversification seen from other indicators. Economic diversification is very much needed to balance the national economy, especially in areas that do not have access to the flow of goods. Infrastructure development outside Java is one of the most urgent matters to increase economic growth and create many job opportunities.
Indonesia as an emerging market country according to the Oxford Economics study is not just a joke. But this institution provides some clear indicators to assess every country in the world. Like an increase in the Gross Domestic Product (GDP) figure, the availability of funding, in this case, will relate to the budget for infrastructure, regional economic development, and the development of special economic zones. The development of special economic zones is necessary to improve the basic economic fundamentals of several regions in Indonesia. Besides that, it can also increase the growth of a skilled workforce. Aside from that, Indonesia also has the most attractive economic growth in the world, which will later become the locomotive of the global economy in the coming year. Abundant natural resources are also one of the key points for Indonesia not to depend on foreign funding.
Hopefully, this research can provide a little contribution for educators, students, and the academic world in general.
REFERENCES
Ahmad, S. (2012). Analisis Pertumbuhan Ekonomi dan Kesenjangan Pertumbuhan Ekonomi Antara Region di Indonesia Tahun 2001-2010. Jurnal Ekonomi dan Perencanaan Pembangunan 9JEPP), 33-45.
Asyad, L. (2005). Pengantara Perencanaan dan Pembangunan Ekonomi Daerah . Yogyakarta: BPFE-UGM.
Case, E, K., & C, R. F. (2007). Prinsip-Prinsip Ekonomi Edisi Kedelapan. Jakarta: Erlangga.
H, R. M., & B, P. (2004). Testing for a Unit Root in Panel with Dynamic Factors. Journal of Econometrics, 81-126.
Johansen, S. (1998). Statistical Analysis of Cointegration Vectors. Journal of Economic Dynamics and Control, 231-254.
Kneller, Richard, Michael, B., & Norman, G. (1999). Fiscal Policy and Growth: Evidence from OECD Countries. Journal of Public Economics, 45-56.
Levin, A., C, F. L., & C, S. J. (2002). Unit Root Tets in Panel Data: Asymptotic and Finite -Sample Properties. Journal of Econometrics, 1-24.
Masih, & Masih, R. (1999). Are ASEAN Stock Market Fluctuations Due Mainly to Intraregional Contagion Effects ? Pacific-Basin Finance Journal, 251-282.
Nachrowi, D., & Usman, H. (2006). Pendekatan Populer dan Praktis Ekonometrika Untuk Analsis Ekonomi dan Keuangan. Jakarta: Lembaga Penerbitan Fakultas Ekonomi Universitas Indonesia.

Indonesian economic diversification as an emerging markets country to drive economic growth ;
Zulfikar Hasan
Copyright@2021; Inovasi - pISSN: 0216-7786 - eISSN: 2528-1097
564
Nghiem, L. (2010). Activity and Income Diversification : Trends, Determinants and Effect on Poverty Redcution. Erasmus University , 67-86.
Pesaran. (2003). A Simple Panel Unit Root in the Presence of Cross Section Dependence. Cambridge University, 34-45.
Pesaran, I. K., & Y, S. (2003). Testing for Unit Roots in Heterogeneous Panels. Journal of Econometrics, 53-74.
R, F. E., & Granger, C. W. (1987). Cointegration and Error Correction: Representation, Estimation and Testing. Econometrica, 251-276.
Samuelson, A, P., & Nordhaus, D. W. (2004). Ilmu Makroekonomi. Jakarta: PT Media Global Eduksi.
Siregar. (2006). Perbaikan Struktural dan Pertumbuhan Ekonomo : Mendorong Investasi dan Menciptakan Lapatan Kerja. Jurnal Ekonomi Politik dan Keuangan, 50-67.
Toda, & Phillips. (1993). Vector Autoregression and Causality. Econometrica, 229-255.
Todaro, P, M., & Stephen, S. (2003). Economic Development. London: UK: Pearson Education Limited.