future of the indonesian defense industry - … · each market category, ... future of the...
TRANSCRIPT
Report Price: US$ 1250 (Single User)
Future of the Indonesian Defense Industry –
Market Attractiveness, Competitive Landscape and
Forecasts to 2020
Future of the Indonesian Defense Industry – Market Attractiveness, Competitive Landscape and Forecasts to 2020
2
Summary
“Future of the Indonesian Defense Industry – Market Attractiveness, Competitive Landscape and Forecasts to 2020” report offers the reader detailed analysis of the defense budget over the next five years. Alongside it offers insights into the market opportunities and entry strategies adopted by foreign OEMs (original equipment manufacturers) to gain a market share in the Indonesian defense industry.
The report provides detailed analysis of the current industry size and growth expectations during 2016-2020,
including highlights of the key growth stimulators. It also benchmarks the industry against key global markets
and provides detailed understanding of emerging opportunities in specific areas.
Key Findings
Indonesia, the world‟s sixteenth largest economy, is currently one of the most attractive defense markets in
South Asia and recorded a CAGR of XX% during 2011–2015 to reach US$XX billion in 2015. The country‟s
increasing military expenditure is reflected in the ongoing modernization drive to replace its aging military
hardware along with building its indigenous defense industrial base. Furthermore, continuous territorial
disputes and the country‟s vulnerability to natural disasters have led to the upgrade of military equipment
such as military transport aircraft, rescue helicopters, and naval vessels. As a percentage of GDP,
Indonesia‟s defense expenditure is expected to increase from XX% in 2015 to XX% in 2020, due to the
country‟s continuous procurement and modernization of military equipment. The country‟s cumulative
expenditure on the procurement of advanced military hardware is projected to be US$XX billion over the
next five years. The various procurements expected to be implemented over the forecast period include
multi-role aircraft, submarines, cyber security, armored vehicles, and missile defense systems, among many
others. Although the country historically procured the majority of its defense imports from Russia, it is now
focusing on opening its market to various suppliers either through direct government-to-government deals or
by establishing joint ventures and partnerships. The country‟s homeland security market, which valued
US$XX billion in 2015, will primarily be driven by terrorism and border security to control organized crime,
which includes illegal immigration, illegal fishing, human trafficking, drug smuggling, and kidnapping.
Key Features and Benefits
The report provides detailed analysis of the Indonesian defense industry during 2011–2020, including the
factors that influence the military expenditure. It provides detailed expectations of growth rates and projected
total expenditure.
It provides the manufacturers with insights on market opportunities along with industry structure and
dynamics prevalent in the country. In addition, the report focuses on the regulations governing the
Indonesian defense industry and the potential market entry strategies with an expert analysis of the
competitive structure.
Future of the Indonesian Defense Industry – Market Attractiveness, Competitive Landscape and Forecasts to 2020
3
1. Market Attractiveness and Emerging Opportunities
1.1. Defense Market Size Historical and Forecast
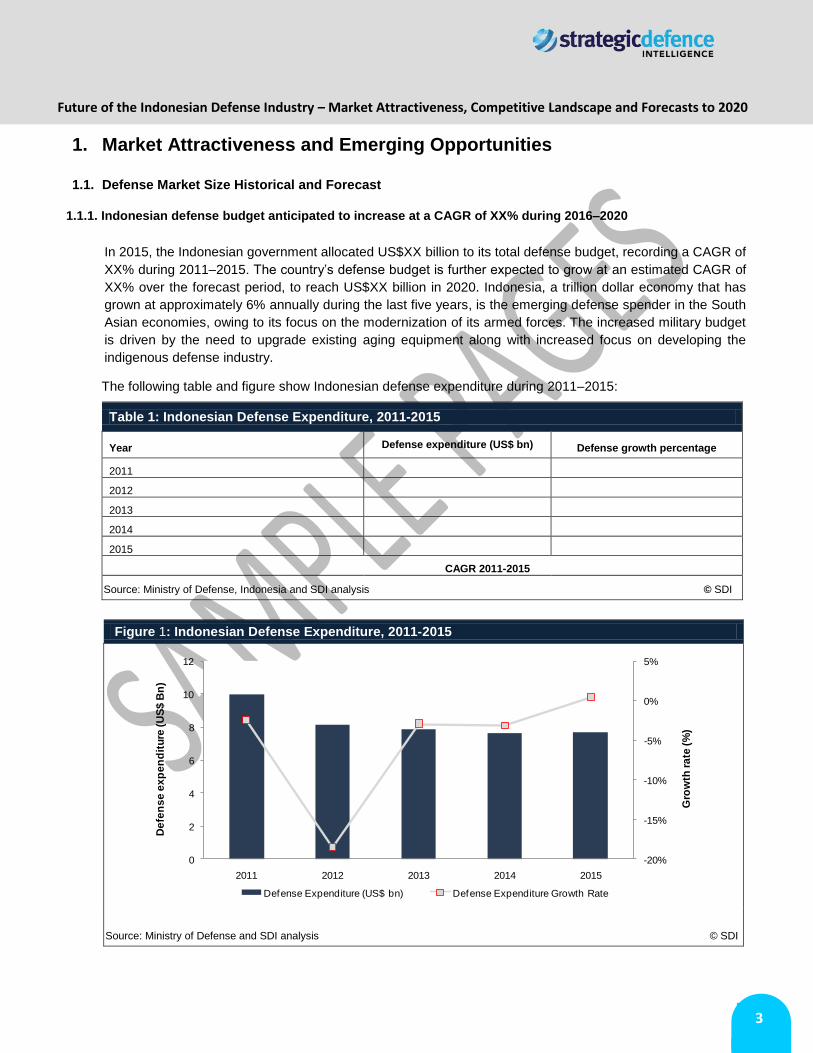
1.1.1. Indonesian defense budget anticipated to increase at a CAGR of XX% during 2016–2020
In 2015, the Indonesian government allocated US$XX billion to its total defense budget, recording a CAGR of
XX% during 2011–2015. The country‟s defense budget is further expected to grow at an estimated CAGR of
XX% over the forecast period, to reach US$XX billion in 2020. Indonesia, a trillion dollar economy that has
grown at approximately 6% annually during the last five years, is the emerging defense spender in the South
Asian economies, owing to its focus on the modernization of its armed forces. The increased military budget
is driven by the need to upgrade existing aging equipment along with increased focus on developing the
indigenous defense industry.
The following table and figure show Indonesian defense expenditure during 2011–2015:
Table 1: Indonesian Defense Expenditure, 2011-2015
Year Defense expenditure (US$ bn)
Defense growth percentage
2011
2012
2013
2014
2015
CAGR 2011-2015
Source: Ministry of Defense, Indonesia and SDI analysis © SDI
Figure 1: Indonesian Defense Expenditure, 2011-2015
Source: Ministry of Defense and SDI analysis © SDI
-20%
-15%
-10%
-5%
0%
5%
0
2
4
6
8
10
12
2011 2012 2013 2014 2015
Gro
wth
ra
te (
%)
De
fen
se
ex
pe
nd
itu
re (
US
$ B
n)
Defense Expenditure (US$ bn) Defense Expenditure Growth Rate
Future of the Indonesian Defense Industry – Market Attractiveness, Competitive Landscape and Forecasts to 2020
4
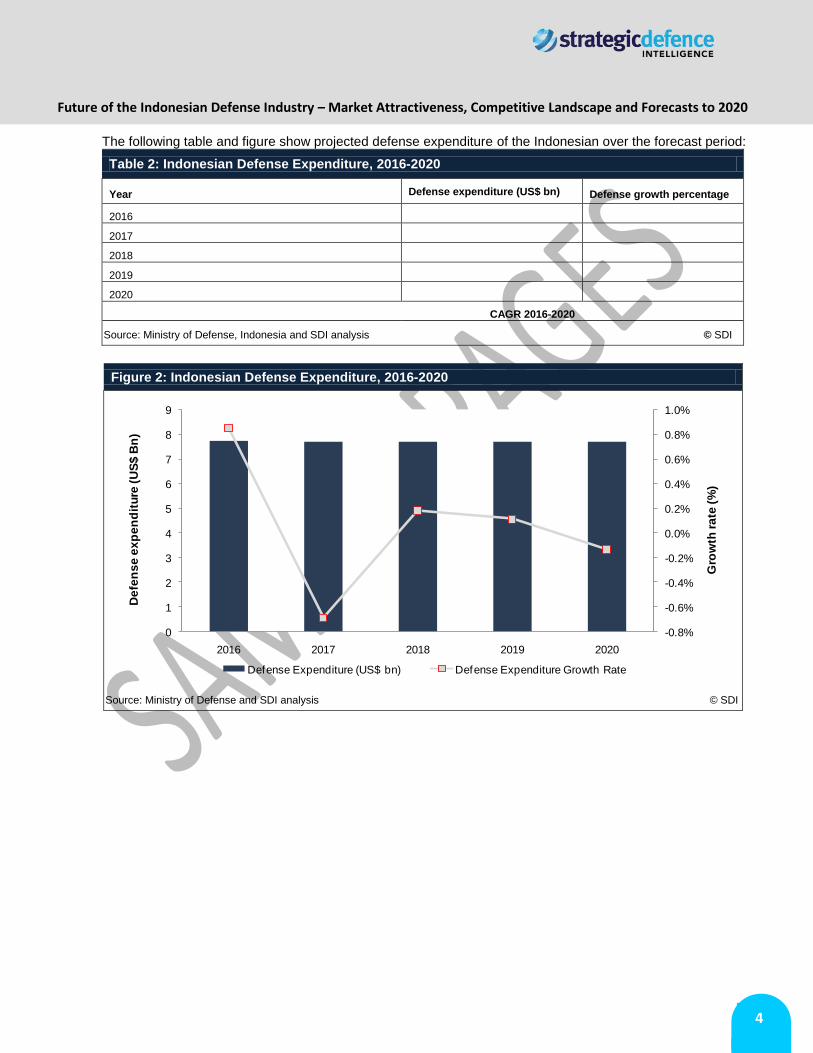
The following table and figure show projected defense expenditure of the Indonesian over the forecast period:
Table 2: Indonesian Defense Expenditure, 2016-2020
Year Defense expenditure (US$ bn)
Defense growth percentage
2016
2017
2018
2019
2020
CAGR 2016-2020
Source: Ministry of Defense, Indonesia and SDI analysis © SDI
Figure 2: Indonesian Defense Expenditure, 2016-2020
Source: Ministry of Defense and SDI analysis © SDI
-0.8%
-0.6%
-0.4%
-0.2%
0.0%
0.2%
0.4%
0.6%
0.8%
1.0%
0
1
2
3
4
5
6
7
8
9
2016 2017 2018 2019 2020
Gro
wth
ra
te (
%)
De
fen
se
ex
pe
nd
itu
re (
US
$ B
n)
Defense Expenditure (US$ bn) Defense Expenditure Growth Rate
Future of the Indonesian Defense Industry – Market Attractiveness, Competitive Landscape and Forecasts to 2020
5
1.2. Analysis of Defense Budget Allocation
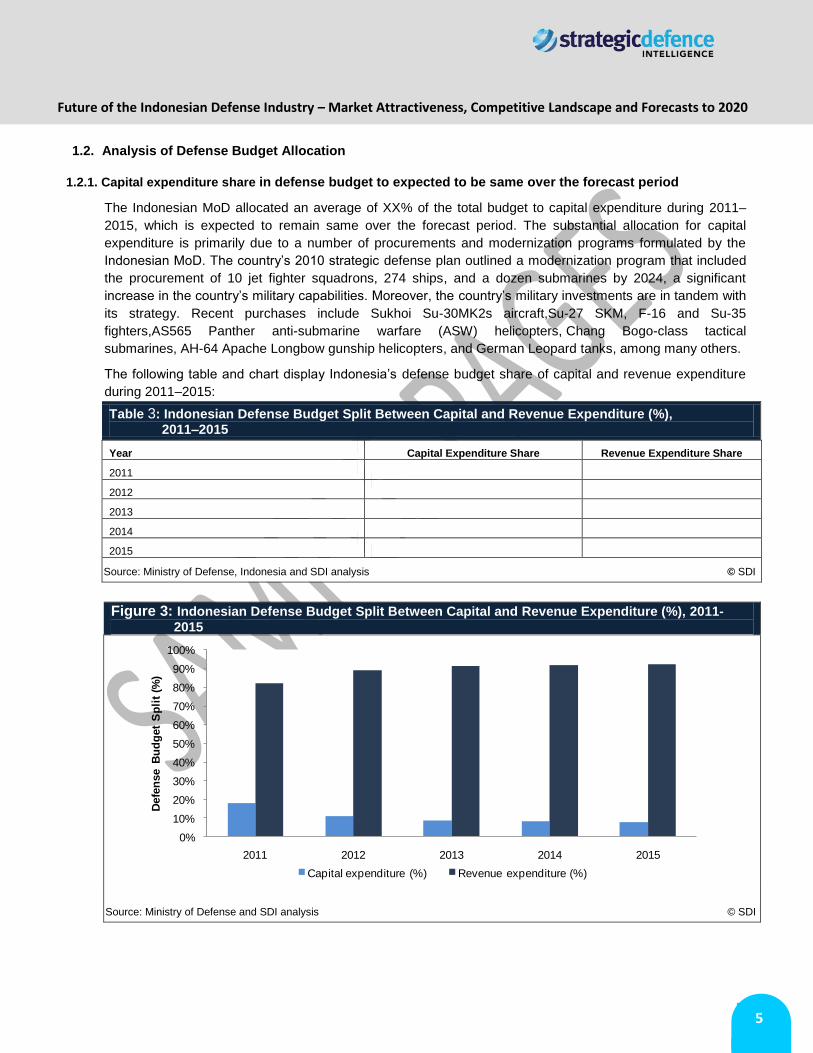
1.2.1. Capital expenditure share in defense budget to expected to be same over the forecast period
The Indonesian MoD allocated an average of XX% of the total budget to capital expenditure during 2011–
2015, which is expected to remain same over the forecast period. The substantial allocation for capital
expenditure is primarily due to a number of procurements and modernization programs formulated by the
Indonesian MoD. The country‟s 2010 strategic defense plan outlined a modernization program that included
the procurement of 10 jet fighter squadrons, 274 ships, and a dozen submarines by 2024, a significant
increase in the country‟s military capabilities. Moreover, the country‟s military investments are in tandem with
its strategy. Recent purchases include Sukhoi Su-30MK2s aircraft,Su-27 SKM, F-16 and Su-35
fighters,AS565 Panther anti-submarine warfare (ASW) helicopters, Chang Bogo-class tactical
submarines, AH-64 Apache Longbow gunship helicopters, and German Leopard tanks, among many others.
The following table and chart display Indonesia‟s defense budget share of capital and revenue expenditure
during 2011–2015:
Table 3: Indonesian Defense Budget Split Between Capital and Revenue Expenditure (%), 2011–2015
Year Capital Expenditure Share Revenue Expenditure Share
2011
2012
2013
2014
2015
Source: Ministry of Defense, Indonesia and SDI analysis © SDI
Figure 3: Indonesian Defense Budget Split Between Capital and Revenue Expenditure (%), 2011-
2015
Source: Ministry of Defense and SDI analysis © SDI
0%
10%
20%
30%
40%
50%
60%
70%
80%
90%
100%
2011 2012 2013 2014 2015
Defe
nse B
ud
get
Sp
lit
(%)
Capital expenditure (%) Revenue expenditure (%)
Future of the Indonesian Defense Industry – Market Attractiveness, Competitive Landscape and Forecasts to 2020
6
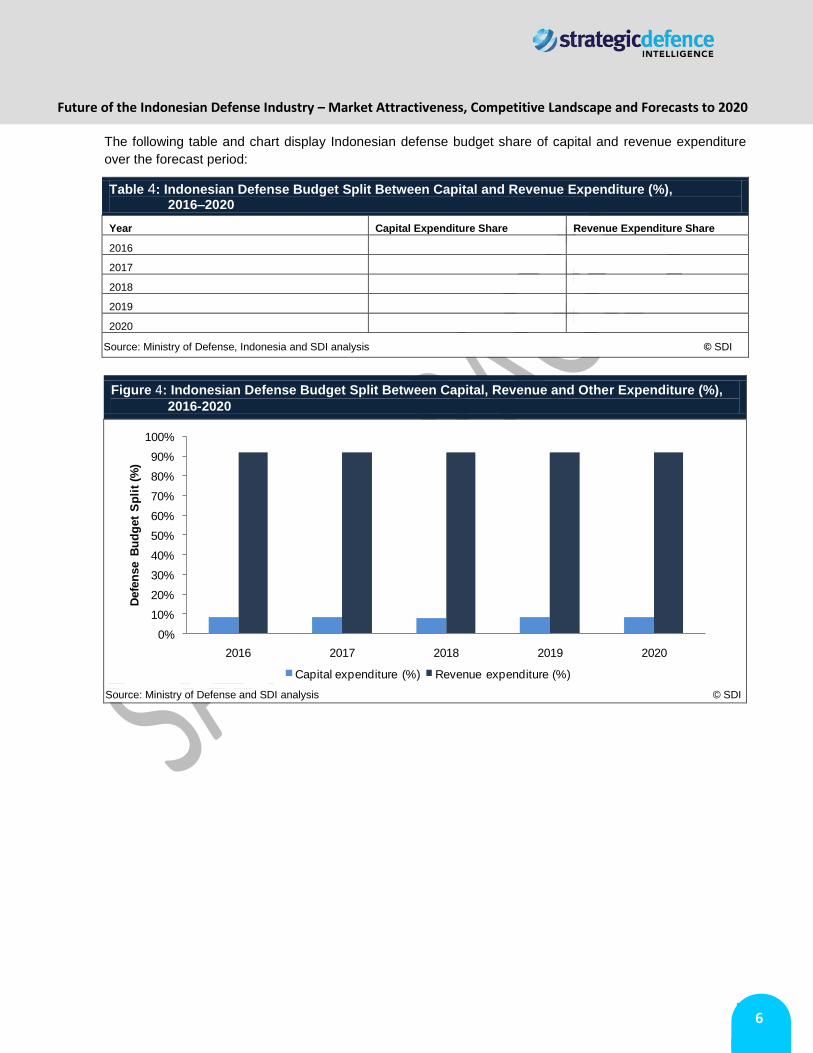
The following table and chart display Indonesian defense budget share of capital and revenue expenditure
over the forecast period:
Table 4: Indonesian Defense Budget Split Between Capital and Revenue Expenditure (%), 2016–2020
Year Capital Expenditure Share Revenue Expenditure Share
2016
2017
2018
2019
2020
Source: Ministry of Defense, Indonesia and SDI analysis © SDI
Figure 4: Indonesian Defense Budget Split Between Capital, Revenue and Other Expenditure (%),
2016-2020
Source: Ministry of Defense and SDI analysis © SDI
0%
10%
20%
30%
40%
50%
60%
70%
80%
90%
100%
2016 2017 2018 2019 2020
Defe
nse B
ud
get
Sp
lit
(%)
Capital expenditure (%) Revenue expenditure (%)
Future of the Indonesian Defense Industry – Market Attractiveness, Competitive Landscape and Forecasts to 2020
7
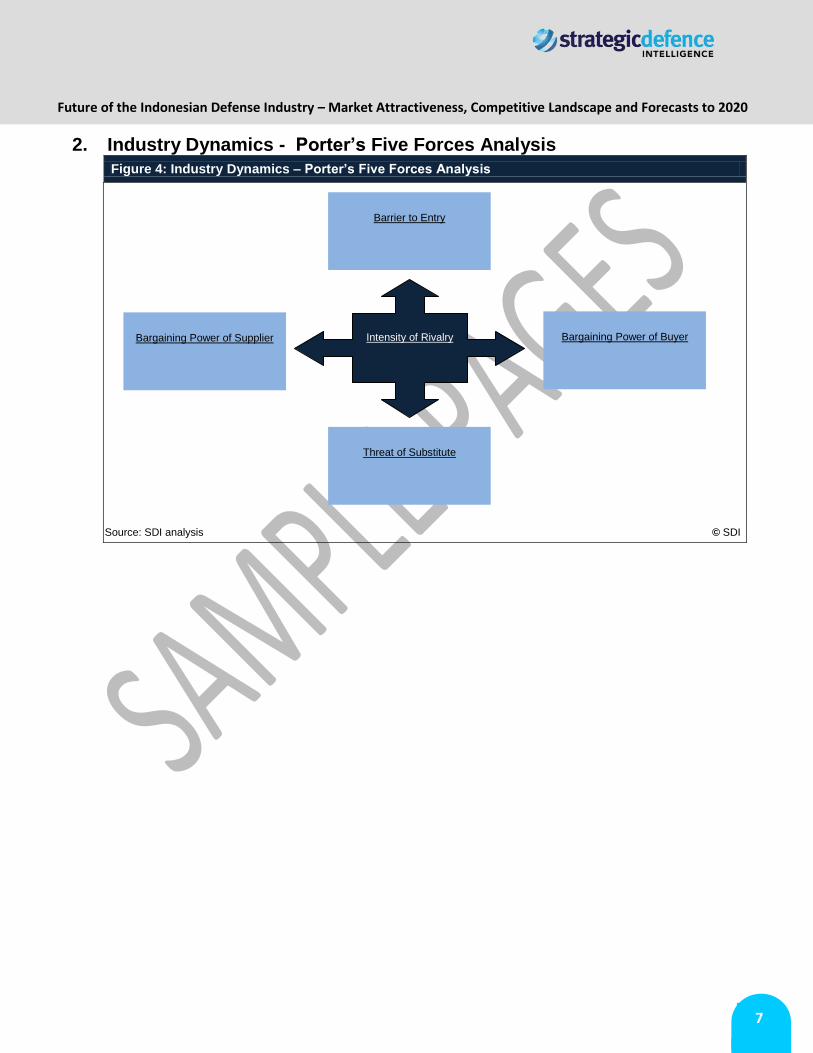
2. Industry Dynamics - Porter’s Five Forces Analysis
Figure 4: Industry Dynamics – Porter’s Five Forces Analysis
Source: SDI analysis © SDI
Intensity of Rivalry Bargaining Power of Supplier
Bargaining Power of Buyer
Barrier to Entry
Threat of Substitute
Future of the Indonesian Defense Industry – Market Attractiveness, Competitive Landscape and Forecasts to 2020
8
Report Methodology
SDI‟s dedicated research and analysis teams consist of experienced professionals with a background in
industry research and consulting in the defense sector. The following research methodology is followed for all
databases and reports:
Secondary Research
The research process begins with exhaustive secondary research to source reliable qualitative and
quantitative information related to the defense market. The secondary research sources that are typically
referred to include, but are not limited to:
Industry associations
National government documents and statistical databases
Company websites, annual reports, financial reports, broker reports, investor presentations
Industry trade journals and other literature
Internal and external proprietary databases
News articles, press releases, and webcasts specific to the companies operating in the market
Primary Research
SDI conducts hundreds of primary interviews a year with industry participants and commentators in order to
validate its data and analysis. A typical research interview fulfills the following functions:
Provides first-hand information on market size, market trends, growth trends, competitive landscape,
and future outlook
Helps to validate and strengthen secondary research findings
Further develops the analysis team‟s expertise and market understanding
Primary research involves e-mail interactions, telephone interviews, and face-to-face interviews for
each market category, division, and sub-division across geographies
The participants who typically take part in such a process include, but are not limited to:
Industry participants: CEOs, VPs, business development managers, market intelligence managers,
and national sales managers
External experts: investment bankers, valuation experts, research analysts, and key opinion leaders
specializing in defense markets
Conventions
Currency conversions are performed on the basis of average annual conversion rate format
calculations
All the values in tables, with the exception of compounded annual growth rate (CAGR) and
compounded annual rate of change (CARC), are displayed to one decimal place; therefore, due to
this rounding method, growth rates may appear inconsistent with absolute values
The forecasted values are projected on the basis of nominal values; the inflation was not taken into account
Future of the Indonesian Defense Industry – Market Attractiveness, Competitive Landscape and Forecasts to 2020
9
TABLE OF CONTENTS
1. Introduction ......................................................................................................................... 10
1.1. What is this Report About? ..........................................................................................................10
1.2. Definitions .....................................................................................................................................10
1.3. Summary Methodology .................................................................................................................12
1.4. SDI Terrorism Index ......................................................................................................................13
1.5. About Strategic Defence Intelligence ..........................................................................................13
2. Executive Summary ............................................................................................................ 14
3. Market Attractiveness and Emerging Opportunities ........................................................ 16
3.1. Defense Market Size Historical and Forecast..............................................................................17
3.1.1. Indonesian defense budget expected to reach US$20.4 billion by 2020, at a CAGR of 16.44% ............ 17
3.1.2. Defense expenditure is driven by the modernization of the armed forces, indigenization, territorial
disputes, and natural disasters ............................................................................................................................. 21
3.1.3. Defense budget as a percentage of GDP expected to increase over the forecast period ....................... 24
3.2. Analysis of Defense Budget Allocation .......................................................................................26
3.2.1. Capital expenditure share in defense budget to expected to be same over the forecast period ............. 26
3.2.2. Per capita defense expenditure expected to increase during the forecast period ................................... 28
3.3. Homeland Security Market Size and Forecast ............................................................................30
3.3.1. Homeland security expenditure is expected to grow at a CAGR of 4.91% during the forecast period .... 30
3.3.2. Border Security and Terrorism to drive the homeland security market over the forecast period ............. 34
3.3.3. Indonesia considered as „some risk‟ category of terrorist attack .............................................................. 35
3.3.4. Indonesia has a terrorism index score of “0.4” ......................................................................................... 36
3.4. Benchmarking with Key Global Markets .....................................................................................37
3.4.1. Indonesia‟s defense budget expected to register rapid growth over the forecast period ......................... 37
3.4.2. Indonesian defense expenditure is relatively smaller than other Asian countries .................................... 39
3.4.3. The Indonesian defense budget as a percentage of GDP is expected to increase during 2016–2020 ... 40
3.4.4. Indonesia suffers some level of terrorist activity ....................................................................................... 41
3.5. Market Opportunities: Key Trends and Growth Stimulators ......................................................43
3.5.1. Infrastructure Construction ....................................................................................................................... 43
3.5.2. Multi-Role Aircraft ..................................................................................................................................... 44
3.5.3. Submarine ................................................................................................................................................ 45
3.5.4. Cyber Security .......................................................................................................................................... 46
4. Defense Procurement Market Dynamics ........................................................................... 47
4.1. Import Market Dynamics ...............................................................................................................48
4.1.1. Defense imports expected to increase during forecast period ................................................................. 48
4.1.2. Aircraft and ships constitute the majority of Indonesian defense imports ................................................ 49
4.1.3. Indonesia plans to diversify arms imports ................................................................................................ 50
Future of the Indonesian Defense Industry – Market Attractiveness, Competitive Landscape and Forecasts to 2020
10
4.2. Export Market Dynamics ..............................................................................................................51
4.2.1. Indonesia does not possess significant defense export capability ........................................................... 51
5. Industry Dynamics .............................................................................................................. 52
5.1. Five Forces Analysis.....................................................................................................................52
5.1.1. Bargaining power of supplier: Low ........................................................................................................... 53
5.1.2. Bargaining power of Buyer: Medium ........................................................................................................ 53
5.1.3. Barrier to entry: Medium ........................................................................................................................... 53
5.1.4. Intensity of rivalry: Low ............................................................................................................................. 53
5.1.5. Threat of Substitution: High ..................................................................................................................... 53
6. Market Entry Strategy ......................................................................................................... 54
6.1. Market Regulation .........................................................................................................................54
6.1.1. Defense investment policy conducive to both domestic and foreign investment ..................................... 54
6.1.2. New procurement policy to support small and medium enterprises ......................................................... 55
6.1.3. Indonesia to launch formal offset policy ................................................................................................... 55
6.2. Market Entry Route .......................................................................................................................56
6.2.1. Foreign defense suppliers enter the Indonesian defense market primarily through joint ventures .......... 56
6.2.2. Strategic partnership and military collaborations an easier way to access the Indonesian defense
market 56
6.3. Key Challenges .............................................................................................................................57
6.3.1. Small defense budget deters investment ................................................................................................. 57
6.3.2. Lack of defense infrastructure .................................................................................................................. 57
6.3.3. Corruption impedes the growth of the Indonesian defense industry ........................................................ 57
7. Competitive Landscape and Strategic Insights ................................................................ 58
7.1. Competitive landscape Overview .................................................................................................58
7.2. Key Public Sector Companies ......................................................................................................59
7.2.1. PT Dirgantara Indonesia: overview .......................................................................................................... 59
7.2.2. PT Dirgantara Indonesia: Major Products and Services .......................................................................... 59
7.2.3. PT Digantara Indonesia: recent announcements and strategic initiatives ............................................... 59
7.2.4. PT Digantara Indonesia: alliances ............................................................................................................ 60
7.2.5. PT Digantara Indonesia: recent contract wins .......................................................................................... 61
7.2.6. PAL Indonesia: overview .......................................................................................................................... 62
7.2.7. PAL Indonesia: Major Products and Services .......................................................................................... 62
7.2.8. PAL Indonesia: recent announcements and strategic initiatives .............................................................. 62
7.2.9. PAL Indonesia: Alliances .......................................................................................................................... 63
7.2.10. PAL Indonesia: Recent Contract Wins ..................................................................................................... 63
7.2.11. PT Pindad: overview ................................................................................................................................. 64
7.2.12. PT Pindad: Major Products and Services ................................................................................................. 64
Future of the Indonesian Defense Industry – Market Attractiveness, Competitive Landscape and Forecasts to 2020
11
7.2.13. PT Pindad: recent announcements and strategic initiatives..................................................................... 65
7.2.14. PT Pindad: alliances ................................................................................................................................. 66
7.2.15. PT Pindad: Recent Contract Wins ............................................................................................................ 66
7.2.16. Dok & Perkapalan: overview .................................................................................................................... 67
7.2.17. Dok & Perkapalan: Major Products and Services .................................................................................... 67
7.2.18. Dok & Perkapalan: recent announcements and strategic initiatives ........................................................ 67
7.2.19. Dok & Perkapalan: alliances ..................................................................................................................... 68
7.2.20. Dok & Perkapalan: Recent Contract Wins ................................................................................................ 68
7.3. Key Private Sector Companies ....................................................................................................69
7.3.1. PT Dahana: overview ............................................................................................................................... 69
7.3.2. PT Dahana: products and services .......................................................................................................... 69
7.3.3. PT Dahana: recent announcements and strategic initiatives ................................................................... 69
7.3.4. PT Dahana: alliances ................................................................................................................................ 70
7.3.5. PT Dahana: recent contract wins ............................................................................................................. 70
7.3.6. PT Multiintegra: overview ......................................................................................................................... 71
7.3.7. PT Multiintegra: products and services .................................................................................................... 71
7.3.8. PT Multiintegra: recent announcements and strategic initiatives ............................................................. 72
7.3.9. PT Multiintegra: recent contract wins ....................................................................................................... 72
7.3.10. Radar and Communications Systems: overview ...................................................................................... 73
7.3.11. Radar and Communications Systems: products and services ................................................................. 73
7.3.12. Radar and Communications Systems: recent announcements and strategic initiatives. ......................... 73
7.3.13. Radar and Communications Systems: alliances ...................................................................................... 74
7.3.14. PT SOG Indonesia: overview ................................................................................................................... 75
7.3.15. PT SOG Indonesia: products and services .............................................................................................. 75
7.3.16. PT SOG Indonesia: recent announcements and strategic initiatives ....................................................... 75
7.3.17. PT SOG Indonesia: alliances ................................................................................................................... 76
8. Business Environment and Country Risk ......................................................................... 77
8.1. Demographics & Social Statistics ................................................................................................77
8.1.1. Total Rural Population .............................................................................................................................. 77
8.1.2. Total Urban Population ............................................................................................................................. 78
8.2. Economic Performance ................................................................................................................79
8.2.1. GDP Per Capita ........................................................................................................................................ 79
8.2.2. GDP, Current Prices ................................................................................................................................. 80
8.2.3. Exports of goods and services, current prices ......................................................................................... 81
8.2.4. Imports of goods and services, current prices .......................................................................................... 82
8.2.5. Gross National disposable income (USD Bn)........................................................................................... 83
8.2.6. Consumer Price Index .............................................................................................................................. 84
8.2.7. Wholesale Price Index .............................................................................................................................. 85
Future of the Indonesian Defense Industry – Market Attractiveness, Competitive Landscape and Forecasts to 2020
12
8.2.8. Local Currency Unit per US Dollar ........................................................................................................... 86
8.2.9. Local Currency Unit per Euro ................................................................................................................... 87
8.2.10. Lending Rate (%) ...................................................................................................................................... 88
8.2.11. Deposit Rate (%) ...................................................................................................................................... 89
8.2.12. Real Interest Rate (%) .............................................................................................................................. 90
8.2.13. Market Capitalization of Listed Companies .............................................................................................. 91
8.2.14. Market Capitalization of Listed Companies (% of GDP) ........................................................................... 92
8.2.15. Government Cash Surplus/Deficit ............................................................................................................ 93
8.2.16. Government Cash Surplus/Deficit as % of GDP ...................................................................................... 94
8.2.17. Central government debt (LCU Bn) .......................................................................................................... 95
8.2.18. Central government debt as % of GDP (LCU Bn) .................................................................................... 96
8.2.19. Goods exports as % of GDP .................................................................................................................... 97
8.2.20. Goods imports as % of GDP .................................................................................................................... 98
8.2.21. Goods Trade Surplus/Deficit as % of GDP............................................................................................... 99
8.2.22. Service Imports as % of GDP ................................................................................................................. 100
8.2.23. Service Exports as % of GDP ................................................................................................................. 101
8.2.24. Service Trade Surplus/Deficit as % of GDP ........................................................................................... 102
8.2.25. Foreign Direct Investment (US$ Billion) ................................................................................................. 103
8.2.26. Net foreign direct investment as % of GDP ............................................................................................ 104
8.2.27. International reserves, including gold ..................................................................................................... 105
8.2.28. External Debt (US$ Billion) ..................................................................................................................... 106
8.2.29. External Debt as % of GDP .................................................................................................................... 107
8.3. Energy and Utilities ..................................................................................................................... 108
8.3.1. Conventional Thermal Electricity Net Generation .................................................................................. 108
8.3.2. Hydroelectricity Net Generation .............................................................................................................. 109
8.3.3. Nuclear Electricity Net Generation ......................................................................................................... 110
8.3.4. Conventional Thermal Electricity Installed Capacity .............................................................................. 111
8.3.5. Proved Natural Gas Reserves ................................................................................................................ 112
8.3.6. Petroleum Consumption ......................................................................................................................... 113
8.3.7. Crude Oil Proved Reserves (Billion Barrels) .......................................................................................... 114
8.3.8. Indonesian Non-Hydro Renewable Electricity Net Generation (Billion Kilowatts) .................................. 115
8.4. Infrastructure ............................................................................................................................... 116
8.4.1. Roads, total network (km) ....................................................................................................................... 116
8.4.2. Air transport, freight ................................................................................................................................ 117
8.4.3. Overall Construction (US$ Million) ......................................................................................................... 118
8.5. Minerals ....................................................................................................................................... 119
8.5.1. Patents Granted ...................................................................................................................................... 119
8.6. Telecommunication .................................................................................................................... 120

Future of the Indonesian Defense Industry – Market Attractiveness, Competitive Landscape and Forecasts to 2020
13
8.6.1. Telephone Lines ..................................................................................................................................... 120
8.6.2. Telephone Lines Penetration Rate ......................................................................................................... 121
9. Appendix ............................................................................................................................ 122
9.1. About SDI ..................................................................................................................................... 122
9.2. Disclaimer .................................................................................................................................... 122
Future of the Indonesian Defense Industry – Market Attractiveness, Competitive Landscape and Forecasts to 2020
14
LIST OF FIGURES Figure 1: Indonesian Defense Expenditure (US$ Billion), 2011–2015 ................................................................................................................. 17 Figure 2: Indonesian Defense Expenditure (US$ Billion), 2016–2020 ................................................................................................................. 18 Figure 3: Indonesian Defense Expenditure (in IDR Trillion), 2011–2015 ............................................................................................................. 19 Figure 4: Indonesian Defense Expenditure (in IDR Trillion), 2016–2020 ............................................................................................................. 20 Figure 5: Indonesian GDP Growth vs. Defense Expenditure Growth and Defense Expenditure as Percentage of GDP, 2011–2015 .................. 24 Figure 6: Indonesian GDP Growth vs. Defense Expenditure Growth and Defense Expenditure as Percentage of GDP, 2016–2020 .................. 25 Figure 7:Indonesian Defense Budget Split Between Capital and Revenue Expenditure (%), 2011–2015 ............................................................ 26 Figure 8: Indonesian Defense Budget Split Between Capital and Revenue Expenditure (%), 2016–2020 ........................................................... 27 Figure 9: Indonesian Per Capita Defense Expenditure (US$), 2011–2015 .......................................................................................................... 28 Figure 10: Indonesian Per Capita Defense Expenditure (US$), 2016–2020 ........................................................................................................ 29 Figure 11: Indonesian Homeland Security Budget (US$ billion), 2011–2015 ...................................................................................................... 30 Figure 12: Indonesian Homeland Security Budget (US$ billion), 2016–2020 ...................................................................................................... 31 Figure 13: Indonesian Homeland Security Budget (IDR Trillion), 2011–2015 ...................................................................................................... 32 Figure 14: Indonesian Homeland Security Budget (IDR Trillion), 2016–2020 ...................................................................................................... 33 Figure 15: SDI Terrorism Heat Map, 2015 .......................................................................................................................................................... 35 Figure 16: SDI Terrorism Index, 2015 ................................................................................................................................................................. 36 Figure 17: Benchmarking with Key Markets – 2011–2015 vs. 2016–2020 .......................................................................................................... 38 Figure 18: Defense Expenditure of the World‟s Largest Military Spenders (US$ Billion), 2015 and 2020 ........................................................... 39 Figure 19: Defense Expenditure as a Percentage of GDP of Largest Military Spenders (%), 2015 ..................................................................... 40 Figure 20: Infrastructure Construction Market Size (US$ Million), 2015–2025 ..................................................................................................... 43 Figure 21: Multi-role Aircraft Defense Market Size (US$ Million), 2015–2025 .................................................................................................... 44 Figure 22: Submarine Market Size (US$ Million), 2015–2025 ............................................................................................................................ 45 Figure 23: Submarine Market Size (US$ Million), 2015–2025 ............................................................................................................................. 46 Figure 24: Indonesian Defense imports TIV value (US$ Million), 2010–2014 ...................................................................................................... 48 Figure 25: Indonesian Defense Imports by Category (%), 2010–2014 (TIV values) ............................................................................................ 49 Figure 26: Indonesian Defense Imports by Region (%), 2010–2014 ................................................................................................................... 50 Figure 27: Industry Dynamics – Porter‟s Five Forces Analysis ............................................................................................................................ 52 Figure 28: Indonesian Rural Population (In Millions), 2016–2025 ....................................................................................................................... 77 Figure 29: Indonesian Urban Population (In Millions), 2016–2025 ...................................................................................................................... 78 Figure 30: Indonesian GDP Per Capita, 2011–2020 ........................................................................................................................................... 79 Figure 31: Indonesian GDP, Current Prices (In US$ Billions), 2011–2020 .......................................................................................................... 80 Figure 32: Indonesian Exports of goods and services, current prices (US$ Billion), 2003–2012 .......................................................................... 81 Figure 33: Indonesian Imports of goods and services, current prices (US$ Billion), 2003–2012 .......................................................................... 82 Figure 34: Indonesian Gross National Disposable Income (US$ Billion), 2005–2012 .......................................................................................... 83 Figure 35: Indonesian Consumer Price Index, 2008–2017 .................................................................................................................................. 84 Figure 36: Indonesian Wholesale Price Index, 2003–2012 ................................................................................................................................. 85 Figure 37: Local Currency Unit per US$ - Exchange Rate, 2008–2017 ............................................................................................................... 86 Figure 38: Local Currency Unit per Euro, 2008–2017 ......................................................................................................................................... 87 Figure 39: Lending Rate (%), 2003–2012 ........................................................................................................................................................... 88 Figure 40: Deposit Rate (%), 2003–2012 ............................................................................................................................................................ 89 Figure 41: Real Interest Rate (%), 2003–2012 .................................................................................................................................................... 90 Figure 42: Indonesian Market Capitalization of Listed Companies (US$ Billion), 2003–2012 .............................................................................. 91 Figure 43: Indonesian Market Capitalization of Listed Companies (% of GDP), 2002–2011 ................................................................................ 92 Figure 44: Indonesian Government Cash Surplus/Deficit (LCU Billion), 2002–2011............................................................................................ 93 Figure 45: Indonesian Government Cash Surplus/Deficit as % of GDP, 2002–2011 ........................................................................................... 94 Figure 46: Indonesian Central government debt (LCU Bn), 2002–2011 .............................................................................................................. 95 Figure 47: Indonesian Central government debt as % of GDP (LCU Bn), 2002–2011 ........................................................................................ 96 Figure 48: Indonesia‟s Goods Exports as % of GDP, 2002–2011 ....................................................................................................................... 97 Figure 49: Indonesia‟s Goods Imports as % of GDP, 2002–2011 ....................................................................................................................... 98 Figure 50: Indonesia‟s Goods Trade Surplus/Deficit as % of GDP, 2002–2011 .................................................................................................. 99 Figure 51: Indonesia‟s Service Imports as % of GDP, 2002–2011 .....................................................................................................................100 Figure 52: Indonesia‟s Service Exports as % of GDP, 2002–2011 .....................................................................................................................101 Figure 53: Indonesia‟s Service Trade Surplus/Deficit as % of GDP, 2002–2011 ................................................................................................102 Figure 54: Indonesian Foreign Direct Investment (US$ Billion), 2002–2011 .......................................................................................................103 Figure 55: Indonesian Net foreign direct investment as % of GDP, 2002–2011 .................................................................................................104 Figure 56: Indonesia‟s International reserves, including gold (US$ Billion), 2002–2011 .....................................................................................105
Future of the Indonesian Defense Industry – Market Attractiveness, Competitive Landscape and Forecasts to 2020
15
Figure 57: Indonesia‟s External Debt (US$ Billion), 2001–2010 .........................................................................................................................106 Figure 58: Indonesia‟s External Debt as % of GDP, 2001–2010 ........................................................................................................................107 Figure 59: Indonesian Conventional Thermal Electricity Net Generation (Billion Kilowatt hours), 2001–2010.....................................................108 Figure 60: Indonesian Hydroelectricity Net Generation (Billion Kilowatt hours), 2002–2011 ...............................................................................109 Figure 61: Indonesian Nuclear Electricity Net Generation (Billion Kilowatt hours), 2001–2010 ...........................................................................110 Figure 62: Indonesian Conventional Thermal Electricity Installed Capacity (Million Kilowatt hours), 2001–2010 ................................................111 Figure 63: Indonesia‟s Proved Natural Gas Reserves (Trillion Cubic Feet), 2004–2013.....................................................................................112 Figure 64: Indonesia‟s Petroleum Consumption (Thousand Barrels Per Day), 2003–2012 ................................................................................113 Figure 65: Indonesia‟s Crude Oil Proved Reserves (Billion Barrels), 2002–2011 ...............................................................................................114 Figure 66: Indonesia‟s Non-Hydro Renewable Electricity Net Generation (Billion Kilowatts), 2001–2010 ..........................................................115 Figure 67: Indonesia‟s Roads, total network (km), 2002–2009 ...........................................................................................................................116 Figure 68: Indonesia‟s Air transport freight (million ton-km), 2002–2011 ............................................................................................................117 Figure 69: Indonesia‟s Overall Construction (US$ Million), 2007–2016 ..............................................................................................................118 Figure 70: Indonesian Patents Granted, 2003–2012 ..........................................................................................................................................119 Figure 71: Indonesia‟s Telephone Lines (In Million), 2003–2012 ........................................................................................................................120 Figure 72: Indonesia‟s Telephone Lines Penetration Rate (Per 100 People), 2003–2012 ..................................................................................121
Future of the Indonesian Defense Industry – Market Attractiveness, Competitive Landscape and Forecasts to 2020
16
LIST OF TABLES Table 1: Indonesian Defense Expenditure (US$ Billion), 2011–2015 .................................................................................................................. 17 Table 2: Indonesian Defense Expenditure (US$ Billion), 2016–2020 .................................................................................................................. 18 Table 3: Indonesian Defense Expenditure (in IDR Trillion), 2011–2015 .............................................................................................................. 19 Table 4: Indonesian Defense Expenditure (in IDR Trillion), 2016–2020 .............................................................................................................. 20 Table 5: Indonesian GDP Growth vs. Defense Expenditure Growth and Defense Expenditure as Percentage of GDP, 2011–2015 ................... 24 Table 6: Indonesian GDP Growth vs. Defense Expenditure Growth and Defense Expenditure as Percentage of GDP, 2016–2020 ................... 25 Table 7: Indonesian Defense Budget Split Between Capital and Revenue Expenditure (%), 2011–2015 ............................................................ 26 Table 8: Indonesian Defense Budget Split Between Capital and Revenue Expenditure (%), 2016–2020 ............................................................ 27 Table 9: Indonesian Per Capita Defense Expenditure (US$), 2011–2015 ........................................................................................................... 28 Table 10: Indonesian Per Capita Defense Expenditure (US$), 2016–2020 ......................................................................................................... 29 Table 11: Indonesian Homeland Security Budget (US$ billion), 2011–2015 ........................................................................................................ 30 Table 12: Indonesian Homeland Security Budget (US$ billion), 2016–2020 ........................................................................................................ 31 Table 13: Indonesian Homeland Security Budget (IDR Trillion), 2011–2015 ....................................................................................................... 32 Table 14: Indonesian Homeland Security Budget (IDR Trillion), 2016–2020 ....................................................................................................... 33 Table 15: Benchmarking with Key Markets – 2011–2015 vs. 2016–2020............................................................................................................ 37 Table 16: SDI Terrorism Index ............................................................................................................................................................................ 41 Table 17: Offset Regulations in Indonesia .......................................................................................................................................................... 54 Table 18: PT Digantara Indonesia-Major Products & Services ............................................................................................................................ 59 Table 19: PT Digantara Indonesia - Alliances ..................................................................................................................................................... 60 Table 20: PT Digantara Indonesia - recent contract wins .................................................................................................................................... 61 Table 21: PAL Indonesia - Major Products & Services ....................................................................................................................................... 62 Table 22: PAL Indonesia - Alliances ................................................................................................................................................................... 63 Table 23: PAL Indonesia - recent contract wins .................................................................................................................................................. 63 Table 24: PT Pindad - Major Products & Services .............................................................................................................................................. 64 Table 25: PT Pindad - Alliances .......................................................................................................................................................................... 66 Table 26: PT Pindad - recent contract wins ........................................................................................................................................................ 66 Table 27: Dok & Perkapalan-Major Products & Services .................................................................................................................................... 67 Table 28: Dok & Perkapalan-Alliances ................................................................................................................................................................ 68 Table 29: Dok & Perkapalan- recent contract wins.............................................................................................................................................. 68 Table 30: PT Dahana - Major Products & Services ............................................................................................................................................. 69 Table 31: PT Dahana - Alliances ........................................................................................................................................................................ 70 Table 32: PT Dahana- recent contract wins ........................................................................................................................................................ 70 Table 33: PT Multiintegra- Major Products & Services ........................................................................................................................................ 71 Table 34: PT Multiintegra - Recent Contract Wins .............................................................................................................................................. 72 Table 35: Radar and Communications Systems - Major Products & Services ..................................................................................................... 73 Table 36: Radar and Communications Systems- Alliances ................................................................................................................................. 74 Table 37: PT SOG Indonesia - Major Products & Services ................................................................................................................................. 75 Table 38: PT SOG Indonesia - Alliances............................................................................................................................................................. 76