indicators of water quantity and quality - acwi · indicators of water quantity and quality lucinda...
TRANSCRIPT

1
Indicators of water quantity and quality
Lucinda B. Johnson, Dan Breneman, Valerie Brady, Jan Ciborowski, Yakuta Baghat
Sustainable Water Resources RoundtableAnn Arbor, MIApril 5,6, 2004

2
⇑ Nutrients⇑ Sediments ⇑ Pesticides
Disrupts natural hydrology –⇑ Peak flow & flooding
Forest harvest
⇑ Sediments ⇑ Contaminants⇓ Nutrient cycling
Disrupts natural hydrology –⇑ Peak flow & flooding
Impervious surface
⇑ Nutrients⇑ Sediments⇑ Pesticides⇓ Nutrient cycling⇓ Soil infiltration
Disrupts natural hydrology –⇑ Peak flow & flooding
Agricultural field tiles
⇑ Water temp. (summer)
⇓ Oxygen conc.⇑ Nutrient conc.
⇓ Stream base flow⇓ Ground water table
Water withdrawal (irrigation; drinking
water)
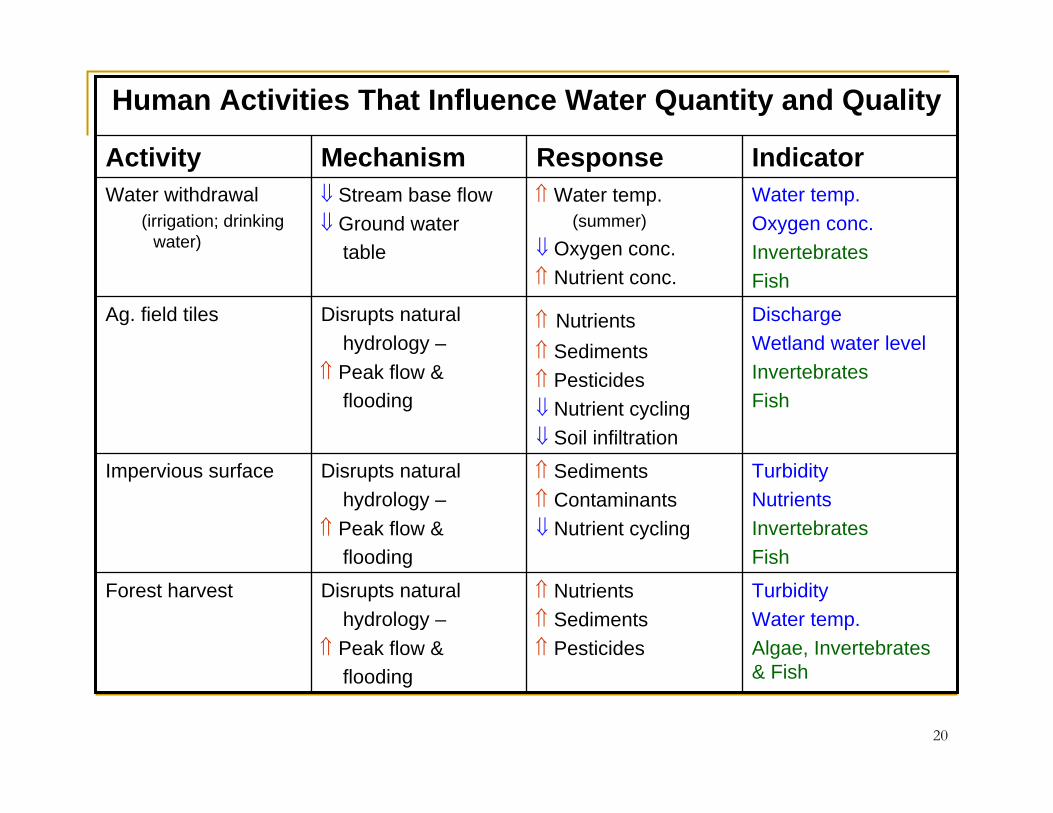
Response/StressMechanismActivityHuman Activities That Influence Water Quantity and Quality
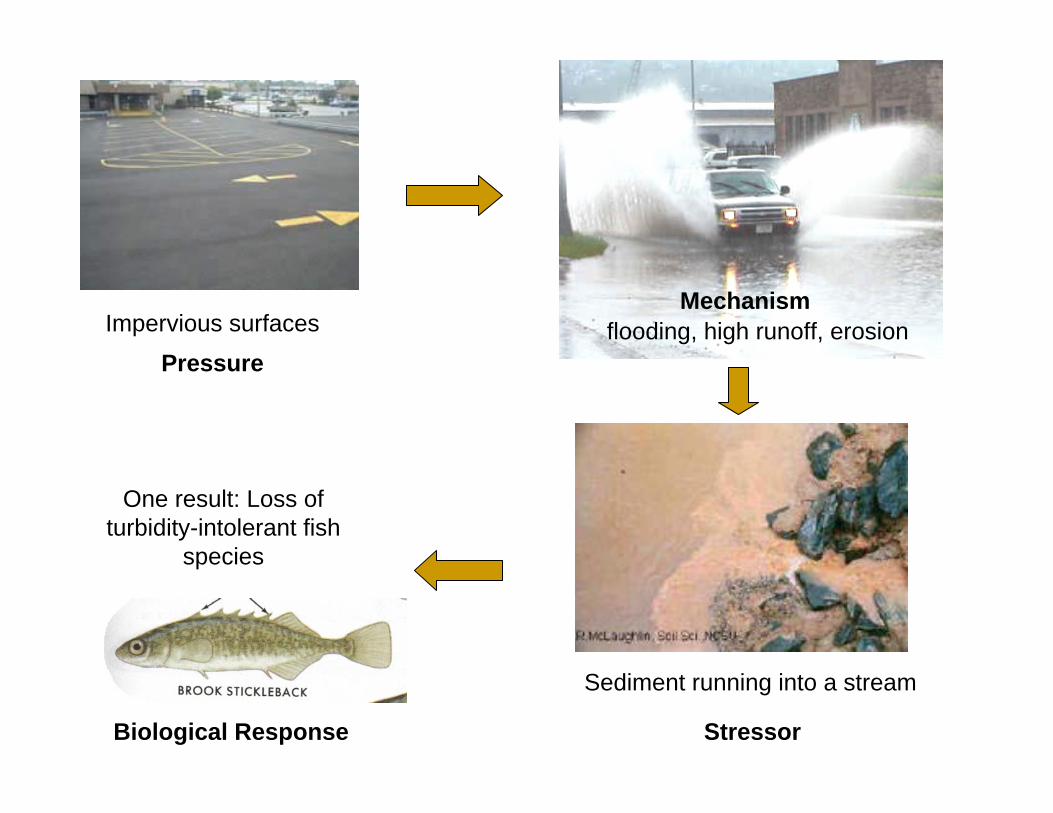
Impervious surfaces flooding, high runoff, erosion
One result: Loss of turbidity-intolerant fish
species
Sediment running into a stream
Pressure
StressorBiological Response
Mechanism

4
Best management practices (BMPs) can mitigate stresses
Rain gardens catch water from parking lots and other impervious surfaces. They slow the runoff, which reduces flooding, stream storm peaks, and erosion; and they allow pollutants in the water to settle out before reach streams, lakes and wetlands.

5
Effects of Impervious Surfaces:Stream Hydrograph
Predicted and observed discharge from middle reach of Miller Creek, a highly urbanized stream in Duluth, MN.
From Schomberg, et al.

6
Comparison of hydrographs above and below mall development area on Miller Creek.
Effects of impervious surface on discharge in Miller Creek, contrasted with a nearby watershed with little urban development
From Schomberg, et al.
Wooded watershed45 acres
Urbanized watershed30 acres

7From Schomberg, et al.

8From Schomberg, et al.

9From Schomberg, et al.

10
Effects of Agriculture:
From: USGS

11
More row crop agriculture leads to more nutrients in streams
From Johnson et al. 1997
5.0N
itrog
en (D
IN; m
g/L)
4.03.0
2.0
1.0
0.5
0.0
20
Row crop area (percent)
40 60 80 100

12
However, undisturbed buffers next to streams reduce the stress
From: Johnson et al. 1997
Nitr
ogen
(DIN
; mg/
L)
5.04.0
3.0
2.0
1.0
0.5
0.0
Riparian zone width (m)2 5 10 20 50
From: Johnson et al.
0
2
4
6
8
1 0
1 2
1 4
1 6
1 8
n = 1 8
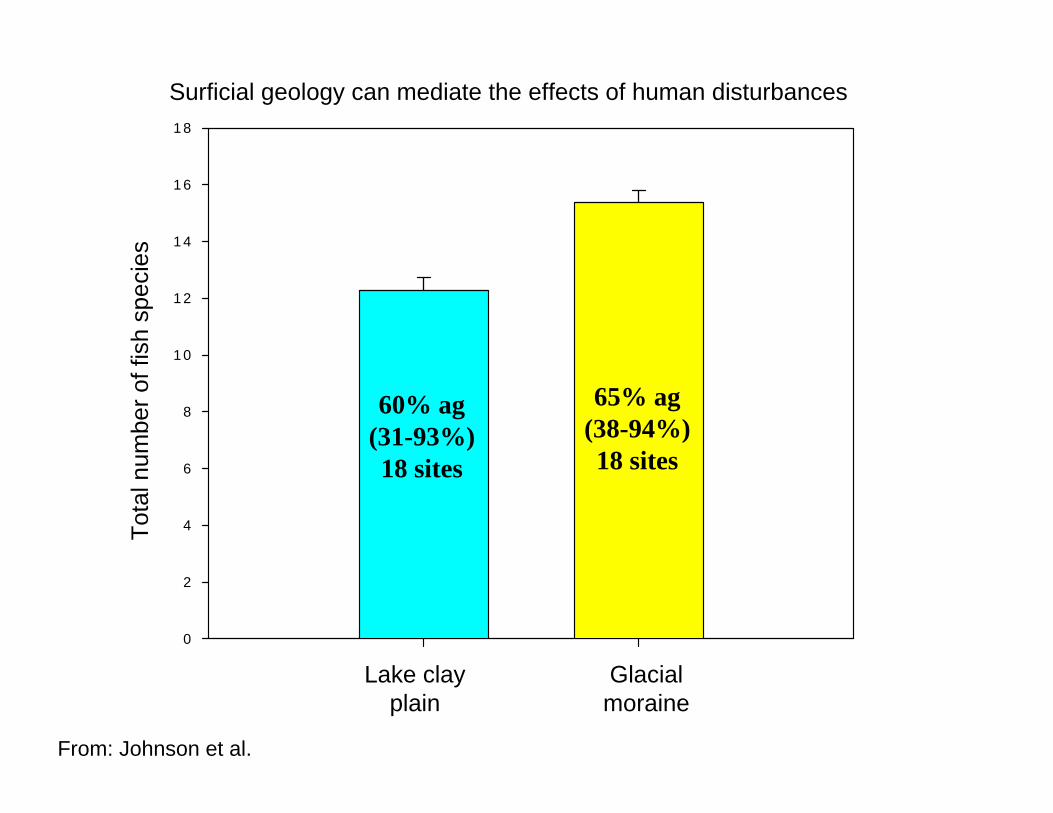
60% ag(31-93%)18 sites
65% ag(38-94%)18 sites
Lake clay plain
Glacial moraine
Tota
l num
ber o
f fis
h sp
ecie
s
Surficial geology can mediate the effects of human disturbances

14
Effects of Forest Harvest:
15
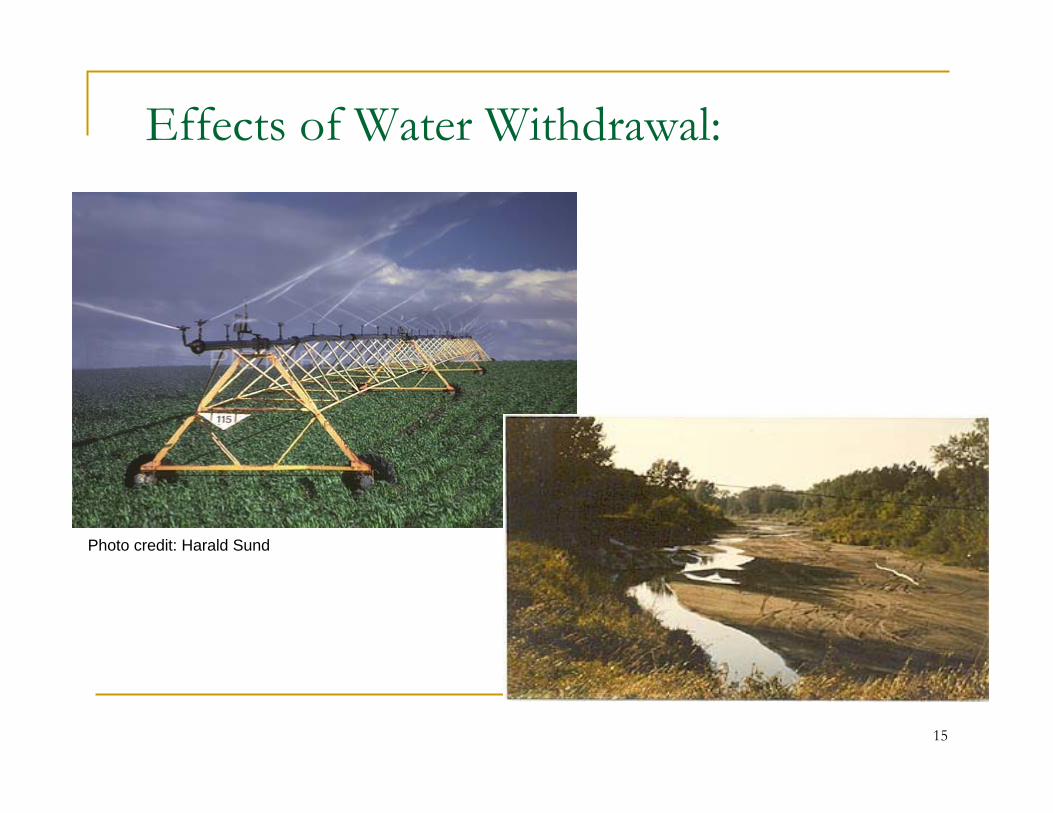
Effects of Water Withdrawal:
Photo credit: Harald Sund

16
Increasing agriculture
Agriculture Disturbance Gradient 1
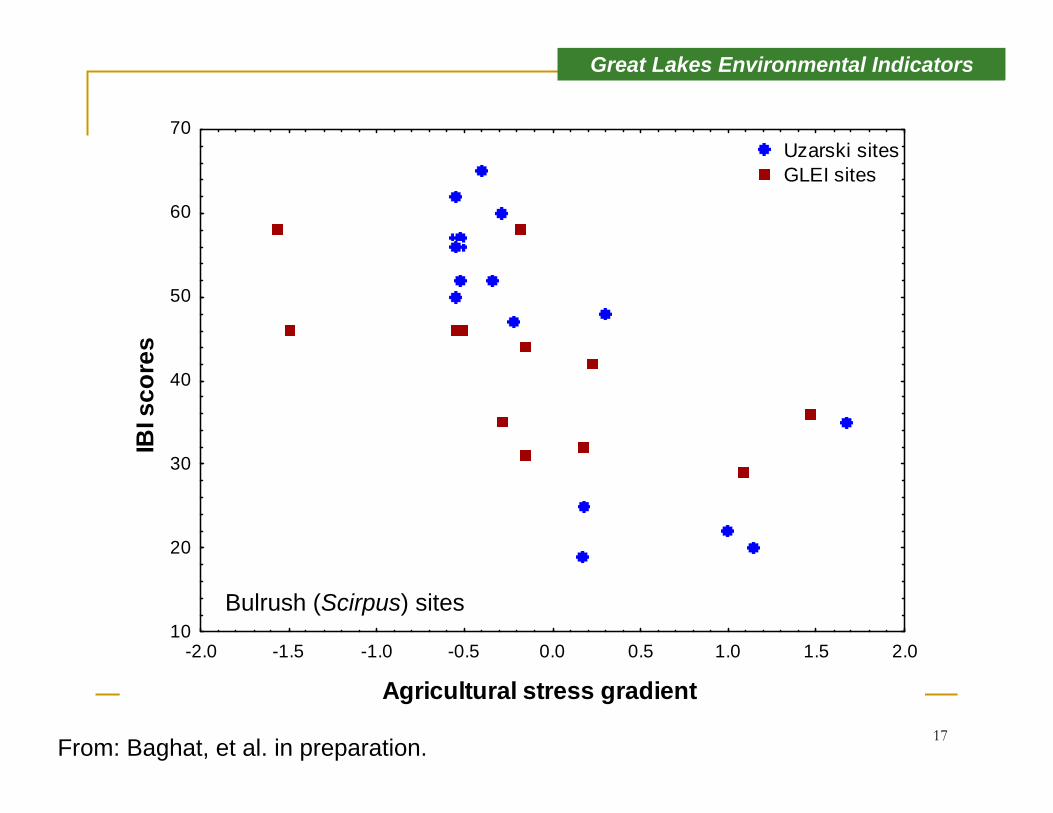
Great Lakes Environmental Indicators
17
Agricultural stress gradient
IBI s
core
s
-2.0 -1.5 -1.0 -0.5 0.0 0.5 1.0 1.5 2.010
20
30
40
50
60
70Uzarski sitesGLEI sites
From: Baghat, et al. in preparation.
Great Lakes Environmental Indicators
Bulrush (Scirpus) sites

18
Great Lakes Environmental Indicators
Human Population Density Gradient 1
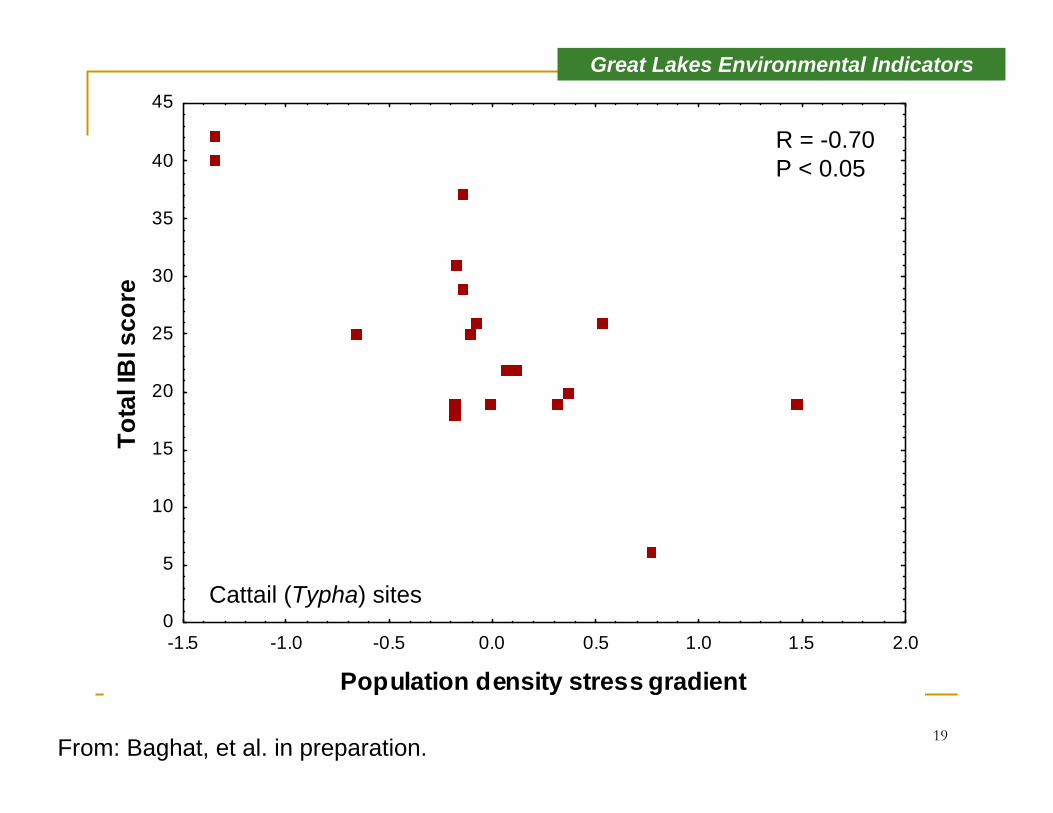
19
-1.5 -1.0 -0.5 0.0 0.5 1.0 1.5 2.0
Population density stress gradient
0
5
10
15
20
25
30
35
40
45To
tal I
BI s
core
From: Baghat, et al. in preparation.
Great Lakes Environmental Indicators
Cattail (Typha) sites
R = -0.70P < 0.05
20
Turbidity Water temp.Algae, Invertebrates & Fish
⇑ Nutrients⇑ Sediments ⇑ Pesticides
Disrupts natural hydrology –
⇑ Peak flow & flooding
Forest harvest
TurbidityNutrientsInvertebratesFish
⇑ Sediments ⇑ Contaminants⇓ Nutrient cycling
Disrupts natural hydrology –
⇑ Peak flow & flooding
Impervious surface
Discharge Wetland water levelInvertebratesFish
⇑ Nutrients ⇑ Sediments ⇑ Pesticides ⇓ Nutrient cycling⇓ Soil infiltration
Disrupts natural hydrology –
⇑ Peak flow & flooding
Ag. field tiles
Water temp. Oxygen conc.Invertebrates Fish
⇑ Water temp. (summer)
⇓ Oxygen conc.⇑ Nutrient conc.
⇓ Stream base flow⇓ Ground water
table
Water withdrawal(irrigation; drinking
water)
IndicatorResponseMechanismActivity
Human Activities That Influence Water Quantity and Quality

21
ConclusionsThere are well-documented links between water quality and water quantity issuesIndicators of water quality, as influenced by human activities that affect water quantity, are:
Water temperature, dissolved oxygen, turbidity, nutrients and flow regimeAlgal, invertebrate and fish communities
Collaboration with ongoing indicator development efforts is essential for success of the SWRR process
Flow Alteration in Rivers of the Great Lakes
David Allan School of Natural Resources & Environment
The University of Michigan
Collaborators: L.C. Hinz Jr. N.L. Poff, E. Rutherford,P. Seelbach, P. Webb, M.J. Wiley
Mapping in cooperation with the Great Lakes Commission Funded by the Great Lakes Protection Fund
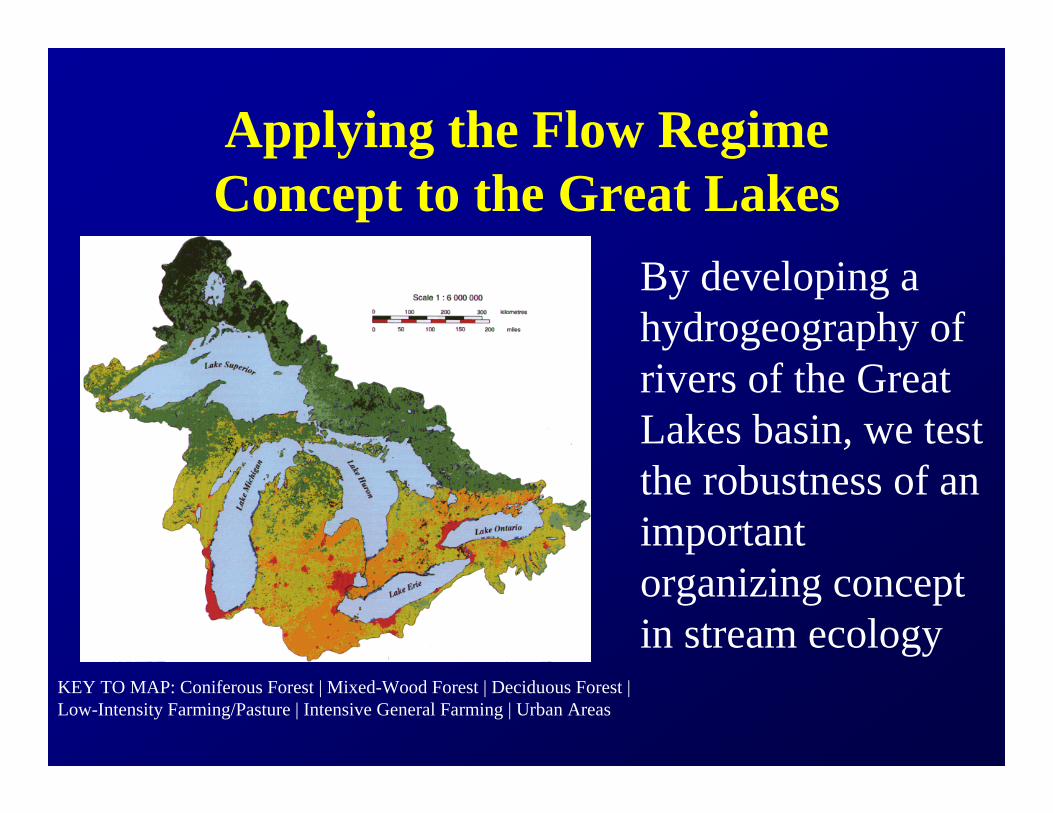
Applying the Flow Regime Concept to the Great Lakes
By developing a hydrogeography of rivers of the Great Lakes basin, we test the robustness of an important organizing concept in stream ecology
KEY TO MAP: Coniferous Forest | Mixed-Wood Forest | Deciduous Forest | Low-Intensity Farming/Pasture | Intensive General Farming | Urban Areas
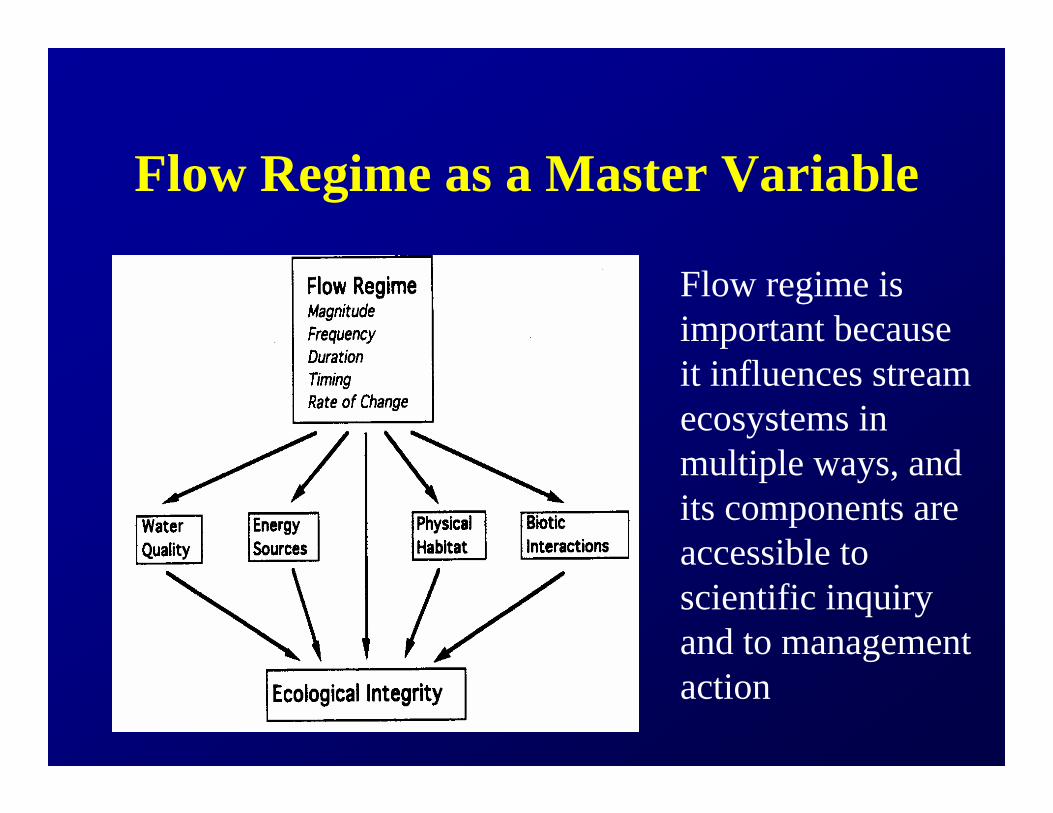
Flow Regime as a Master Variable
Flow regime is important because it influences stream ecosystems in multiple ways, and its components are accessible to scientific inquiry and to management action
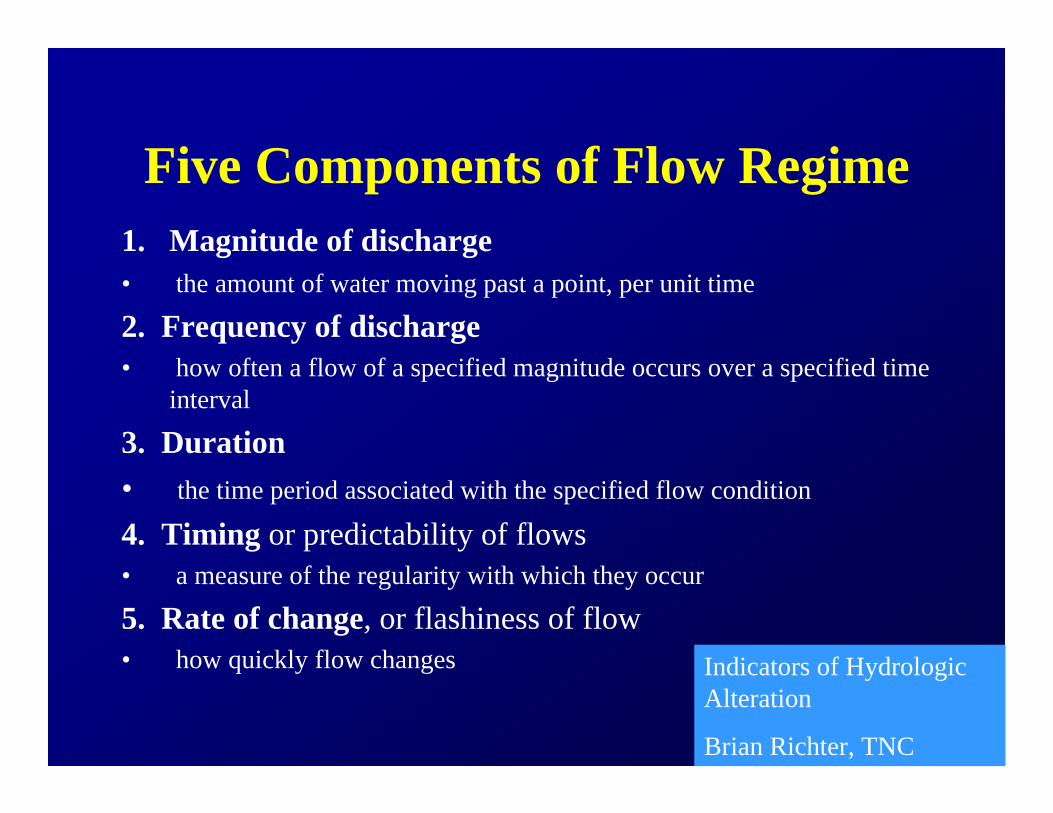
Five Components of Flow Regime1. Magnitude of discharge• the amount of water moving past a point, per unit time
2. Frequency of discharge• how often a flow of a specified magnitude occurs over a specified time
interval
3. Duration• the time period associated with the specified flow condition
4. Timing or predictability of flows• a measure of the regularity with which they occur
5. Rate of change, or flashiness of flow• how quickly flow changes Indicators of Hydrologic
Alteration
Brian Richter, TNC
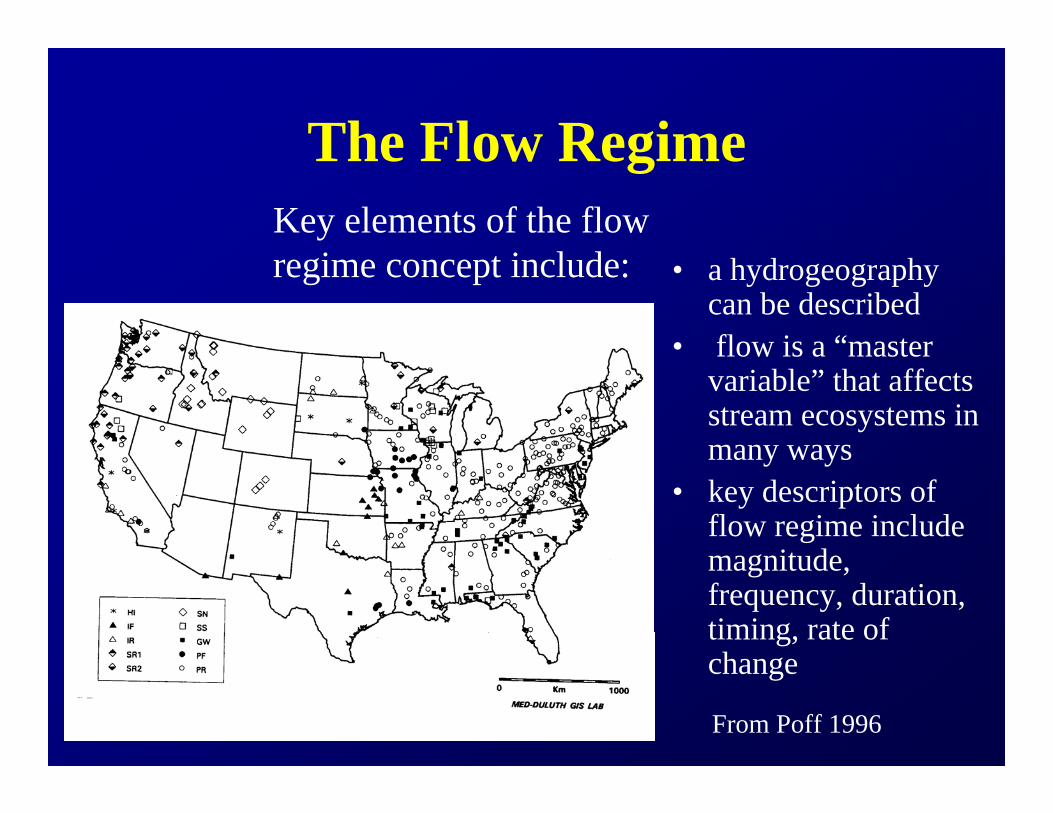
The Flow Regime
• a hydrogeography can be described
• flow is a “master variable” that affects stream ecosystems in many ways
• key descriptors of flow regime include magnitude, frequency, duration, timing, rate of change
Key elements of the flow regime concept include:
From Poff 1996
Our Questions• What is meant by flow regime and can we identify flow regimes within rivers of the Great Lakes basin ?
• Are spatial patterns evident in flow regime that may be indicative of broad geologic and climatic controls ?
• Have human actions discernibly altered flow regimes over the course of the 20th century?
• What evidence exists of altered flow regimes and what can we infer about human influence ?

The Database
%[
%[ %[%[
%[
%[
%[%[%[
%[%[%[
%[
%[
%[%[%[%[
%[%[%[
%[
%[
%[%[%[%[%[%[
%[
%[
%[
%[%[
%[%[%[
%[
%[%[%[
%[
%[%[%[%[%[
%[ %[%[%[%[ %[%[%[
%[ %[%[%[
%[%[ %[
%[%[%[%[
%[%[%[%[ %[%[
%[
%[%[
%[ %[ %[%[%[
%[%[
%[
%[ %[%[%[
%[%[%[%[
%[
%[%[%[%[%[%[
%[ %[%[%[%[
%[%[
%[%[%[%[
%[%[
%[%[%[
%[%[%[%[%[%[%[%[%[%[%[%[%[%[
%[ %[ %[%[%[
%[ %[%[%[
%[%[%[%[%[%[
%[%[%[ %[
%[%[
%[%[
%[%[
%[
%[%[%[%[
%[%[
%[
%[
%[
%[%[%[%[%[
%[
%[%[
%[
%[%[
%[%[%[%[%[%[%[%[%[%[%[%[
%[ %[
%[%[
%[
%[%[%[
%[%[
%[
%[
%[ %[%[%[
%[ %[ %[%[
%[
%[
%[%[ %[ %[ %[%[%[
%[
%[%[
%[%[%[%[%[
%[
%[
%[%[
%[
%[%[
%[%[%[%[%[%[%[%[
%[%[ %[%[
%[%[
%[%[%[
%[%[
%[ %[
%[%[ %[
%[
%[ %[ %[%[
%[%[ %[%[%[
%[%[%[%[ %[ %[%[%[
%[%[
%[
%[%[%[%[%[%[
%[%[%[%[%[%[%[ %[
%[%[%[%[%[%[%[%[%[%[%[%[
%[%[%[%[
%[
%[%[%[%[%[%[%[%[
%[%[%[%[%[%[%[%[%[ %[ %[
%[%[
%[%[ %[
%[%[%[
%[
%[
%[
%[%[ %[
%[%[
%[
%[
%[
%[%[%[
%[
%[
%[
%[
%[
%[
%[
%[
%[%[%[
%[
%[%[%[
%[
%[%[
%[
%[
%[
%[
%[ %[
%[%[
%[
%[
%[
%[
%[
%[
%[
%[
%[
%[
%[
%[
%[
%[
%[
%[
%[
%[
%[
%[
%[
%[
%[
%[
%[
%[
%[
%[%[
%[
%[
%[
%[
%[
%[
%[
%[
%[
%[%[%[
%[
%[
%[
%[
%[
%[
%[
%[
%[
%[
%[
%[
%[
%[
%[
%[
%[
%[
%[
%[
%[
%[
%[
%[
%[
%[
%[
%[
%[%[
%[
%[
%[
%[
%[
%[
%[
%[
%[%[
%[%[%[
%[
%[ %[
%[
%[%[
%[
%[
%[
%[
%[
%[
%[
%[
%[ %[ %[ %[ %[%[
%[%[
%[ %[
%[%[
%[%[%[%[%[%[%[%[ %[%[%[%[%[
%[%[
%[
%[
%[
%[%[
%[
%[
%[
%[
%[
%[%[
%[ %[
%[
%[
%[%[
%[
%[
%[
%[
%[
%[
%[
%[
%[
%[
%[
%[
%[
%[
%[
%[
%[%[
%[
%[
%[
%[
%[
%[
%[
%[
%[
%[
%[
%[
%[
%[
%[
%[
%[
%[
%[
%[
%[
%[
%[
%[
%[%[%[
%[
%[
%[
%[
%[ %[
%[ %[
%[
%[
%[
%[
%[
%[
%[
%[
%[
%[
%[
%[%[
%[
%[
%[
%[
%[
%[
%[
%[
%[
%[
%[
%[
%[
%[
%[
%[
%[%[
%[
%[
%[
%[
%[
%[ %[
%[
%[
%[
%[
%[
%[
%[
%[
%[
%[
%[
%[
%[
%[
%[%[
%[
%[%[
%[ %[
%[
%[
%[ %[
%[
%[%[%[
%[
%[ %[
%[
%[
%[
%[%[
%[
%[
%[
%[
%[
%[
%[%[
%[
%[
%[
%[
%[ %[
%[
%[
%[
%[
%[
%[
%[
%[
%[%[
%[
%[
%[
%[ %[
%[
%[
%[
%[
%[
%[
%[
%[
%[%[
%[
%[
%[
%[
%[
%[%[
%[
%[
%[
%[
%[
%[
%[
%[
%[ %[%[
%[
%[
%[
%[
%[
%[
%[
%[
%[
%[
%[%[
%[
%[
%[%[
%[
%[%[
%[
%[
%[
%[
%[
%[
%[
%[
%[
%[
%[
%[
%[
%[
%[
%[
%[
%[%[
%[
%[
%[
%[
%[
%[
%[%[
%[
%[
%[
%[
%[
%[
%[
%[
%[
%[
%[
%[
%[
%[%[
%[
%[
%[
%[
%[
%[%[
%[
%[
%[%[
%[
%[
%[
%[
%[
%[
%[%[ %[
%[
%[
%[
%[
%[
%[
%[
%[
%[
%[
%[
%[
%[
%[
%[
%[
%[
%[%[
%[
%[
%[
%[
%[%[%[
%[
%[
%[
%[
%[
%[
%[
%[
%[
%[
%[
%[%[
%[
%[
%[
%[
%[
%[
%[
%[
%[
%[
%[
%[
%[
%[
%[
%[%[
%[
%[
%[
%[
%[
%[
%[
%[
%[
%[
%[
%[
%[
%[
%[
%[
%[
%[
%[
%[%[
%[
%[
%[
%[%[
%[
%[
%[
%[
%[
%[
%[
%[ %[%[ %[
%[
%[
%[
%[
%[
%[
%[
%[%[
%[
%[
%[
%[
%[
%[
%[
%[
%[
%[%[
%[
%[
%[
%[ %[
%[
%[ %[
%[
%[
%[
%[
%[
%[
%[
%[
%[
%[
%[%[
%[
%[
%[
%[
%[
%[
%[
%[
%[
%[
%[
%[
%[
%[
%[
%[%[
%[
%[
%[%[
%[
%[%[
%[
%[
%[
%[
%[
%[
%[
%[
%[
%[
%[%[
%[
%[
%[
%[
%[
%[
%[
%[
%[
%[
%[
%[
%[
%[
%[%[
%[%[
%[
%[
%[%[%[
%[
%[
%[%[%[
%[%[
%[%[%[
%[
%[
%[ %[
%[
%[%[ %[ %[
%[%[
%[
%[%[%[
%[%[
%[
%[%[
%[
%[
%[
%[
%[%[
%[
%[
%[
%[
%[ %[ %[%[%[
%[ %[
%[
%[
%[
%[%[%[%[%[%[
%[
%[%[%[%[
%[%[%[%[%[
%[
%[%[
%[%[%[
%[%[ %[%[
%[
%[
%[ %[
%[%[
%[
%[
%[
%[
%[%[%[%[%[ %[
%[
%[%[%[
%[%[%[
%[
%[%[
%[
%[
%[
%[
%[
%[%[%[ %[
%[%[%[
%[%[%[%[
%[
%[%[
%[%[
%[
%[
%[%[%[
%[
%[%[%[%[
%[
%[
%[
%[%[%[%[%[%[
%[%[%[%[%[
%[%[%[%[%[
%[%[%[%[
%[
%[
%[%[%[%[
%[%[
%[
%[
%[
%[
%[
%[
%[
%[
%[
%[
%[%[
%[%[%[%[
%[%[
%[%[
%[%[
%[
%[%[
%[
%[
%[
%[%[
%[
%[
%[%[%[
%[
%[%[
%[%[
%[
%[
%[
%[ %[
%[%[%[
%[%[%[
%[%[
%[ %[%[%[ %[ %[ %[%[
%[%[%[%[%[%[
%[ %[%[%[ %[
%[%[%[%[%[%[%[
%[%[%[
%[%[%[%[
%[%[%[%[
%[%[%[
%[
%[
%[
%[%[ %[%[
%[%[%[%[%[%[%[%[
%[
%[
%[
%[%[
%[ %[%[%[
%[
%[%[%[
%[
%[
%[
%[%[%[
%[
%[%[
%[
%[
%[%[%[%[%[%[%[%[
%[%[%[%[%[%[%[%[ %[
%[
%[
%[
%[%[%[
%[%[%[
%[%[
%[%[%[%[
%[
%[%[%[%[
%[%[%[%[%[%[%[
%[%[%[%[%[%[%[ %[%[
%[%[%[%[
%[%[
%[
%[%[%[%[
%[
%[%[
%[
%[%[
%[%[
%[%[
%[ %[%[%[
%[%[ %[%[%[ %[
%[
%[
%[
%[
%[%[ %[%[
%[%[
%[
%[
%[
%[%[ %[%[%[
%[
%[
%[
%[%[
%[
%[%[
%[ %[%[%[
%[
%[
%[%[ %[
%[
%[%[
%[
%[
%[
%[
%[
%[
%[%[
%[%[
%[
%[
%[
%[
%[
%[%[
%[
%[ %[
%[
%[
%[
%[
%[
%[%[ %[ %[%[%[%[
%[
%[
%[
%[
Great Lakes States and ProvincesLake BasinsGaging stations
Great Lakes BasinGaging Stations
Great Lakes BasinGaging Stations
We selected a total of 425 gages (259 in U.S., 166 in Ontario) to include in our analyses
Gages were excluded due to incomplete records or obvious flow disturbance.

Assigning Streams to Flow ClassesThis flow chart of Poff (1996) was used to assign individual streams to his 9 categories.
Six of these categories are represented in the Great Lakes Basin:Perennial runoff 264 (70%)Stable groundwater 53 (14%)Superstable 29 (8%)Snow + rain 25 (7%)Snowmelt 4 (1%)Intermittent runoff 1 (0.3%)
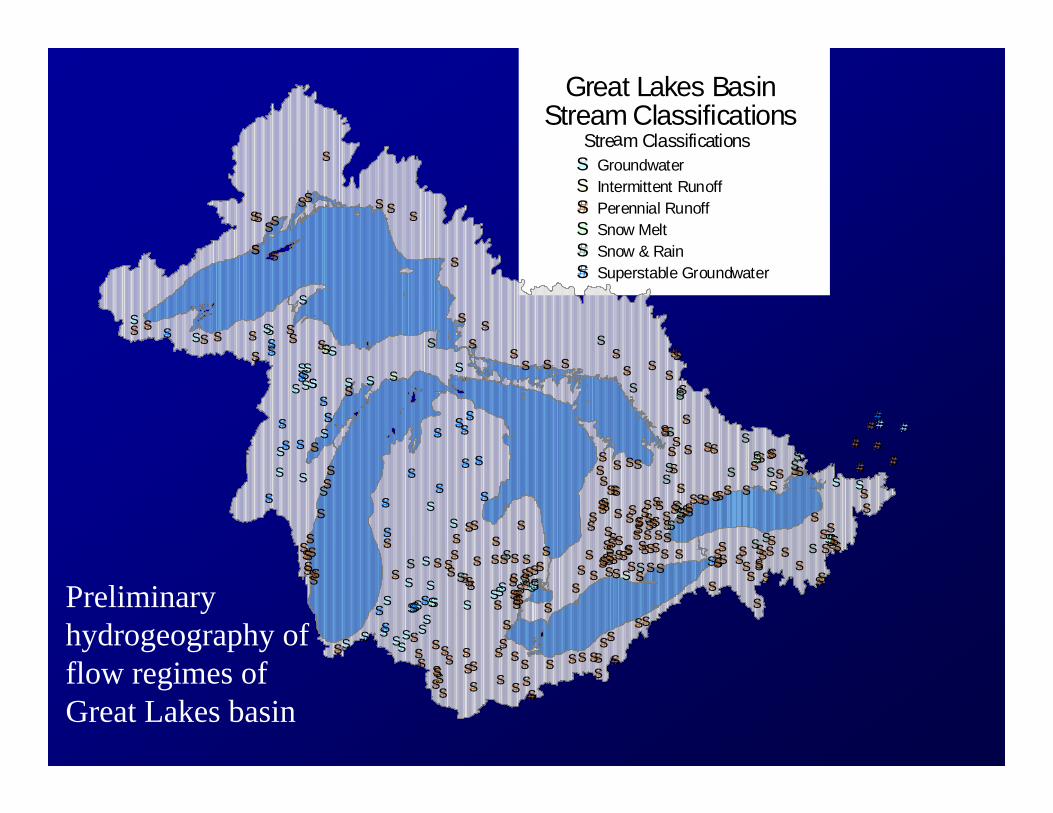
Preliminaryhydrogeography of flow regimes of Great Lakes basin
#S
#S#S#S#S
#S
#S#S#S
#S
#S
#S#S
#S#S#S#S
#S#S
#S#S#S#S
#S#S
#S
#S#S#S#S#S
#S#S #S#S#S#S#S#S#S
#S#S
#S#S#S#S#S
#S#S#S
#S#S
#S#S
#S#S#S
#S
#S
#S
#S
#S#S#S
#S #S
#S
#S #S#S#S#S
#S#S
#S#S
#S#S
#S#S #S#S#S #S#S#S#S#S
#S#S#S#S#S#S#S#S#S#S#S
#S#S#S#S
#S
#S#S
#S
#S#S#S
#S
#S
#S#S
#S
#S
#S
#S
#S#S
#S
#S
#S
#S
#S
#S
#S
#S
#S#S#S
#S
#S
#S
#S
#S
#S
#S
#S#S
#S#S
#S
#S
#S#S
#S
#S#S
#S
#S#S#S
#S
#S
#S
#S
#S
#S
#S
#S
#S
#S
#S#S
#S
#S
#S
#S #S
#S
#S
#S
#S
#S
#S
#S#S
#S
#S
#S
#S
#S
#S
#S
#S
#S#S
#S
#S#S
#S
#S
#S
#S
#S
#S
#S
#S
#S
#S
#S#S
#S
#S
#S #S#S
#S
#S
#S
#S#S
#S
#S
#S
#S#S
#S
#S
#S
#S#S
#S
#S
#S
#S
#S
#S#S
#S
#S
#S #S
#S
#S#S
#S#S
#S
#S
#S
#S
#S#S
#S
#S#S
#S #S
#S
#S
#S
#S
#S
#S
#S
#S#S
#S
#S
#S
#S
#S
#S
#S
#S
#S#S
#S
#S
#S
#S
#S
#S
#S
#S #S#S
#S#S
#S
#S
#S#S#S#S
#S#S#S#S
#S#S#S
#S
#S#S
#S
#S
#S#S#S
#S#S
#S
#S
#S#S#S#S #S#S#S#S
#S
#S #S#S#S#S#S
#S#S#S#S#S
#S#S#S
#S #S#S
#S#S#S#S#S#S#S#S#S#S
#S#S#S
#S#S#S
#S
#S
#S#S
#S#S #S
#S
#S
#S
#S
#S#S #S
#S#S #S
#S#S
#S
#S
#S
#S#S#S
Great Lakes BasinStream Classifications
Groundwater#SIntermittent Runoff#SPerennial Runoff#SSnow Melt#SSnow & Rain#SSuperstable Groundwater#S
Stream Classifications

Validity of the Flow Regime Concept
• Our analysis supports the view that flow regimes can be characterized by hydrologic analysis.
• Using less stringent criteria than Poff (1996) we were able to include more gages, and thus achieve a finer-scale mapping.
• A substantial body of literature provides evidence that flow regime influences biological assemblages

Some Key LiteratureAllan, J.D. et al. 2004. An Assessment of Flows for Rivers of the Great Lakes Basin. Final Report to the Great Lakes Protection Fund, October, 2004. http://www-personal.umich.edu/~dallan/dallan_pubs.html
• Baker D.B., Richards, R.P., Loftus T.T., et al. 2004. A new flashiness index: Characteristics and applications in Midwestern rivers and streams. Journal of the American Water Resources Association 40: 503-522.
• Baron J.S., Poff N.L., Angermeier P.L., Dahm C.N., Gleick P.H., Hairston N.G., Jackson R.B., Johnston C.A., Richter B.D., Steinman A.D. 2002. Meeting ecological and societal needs for freshwater. Ecological Applications 12 (5): 1247-1260
• Poff, N.L. and J.D. Allan. 1995. Functional organization of stream fish assemblages in relation to hydrological variability. Ecology 76:606-627.
• Poff, N.L. 1996. A hydrogeography of unregulated streams in the United States and an examination of scale-dependence in some hydrologic descriptors. Freshwater Biology 36:71-91.
• Poff, N.L., J.D. Allan, M.B. Bain, J.R. Karr, K.L. Prestegaard, B.D. Richter, R.E. Sparks, and J.C. Stromberg. 1997. The natural flow regime: a paradigm for river conservation and restoration. BioScience 47:769-784.
• Richards, R.P. 1990. Measures of flow variability and a new flow-based classification of Great lakes tributaries. Journal of Great Lakes Research 16:53-70.

Temporal Change in Flow Regime
• Human actions may alter a river’s flow regime– Dams and flood storage can regulate river flow,
making it more constant– Changing land use can alter flow pathways, making
river flow more variable– Water withdrawals can reduce available runoff– Climate change can alter P and ET
• Do long term gage records document temporal changes in hydrologic regime in the Great Lakes Basin?
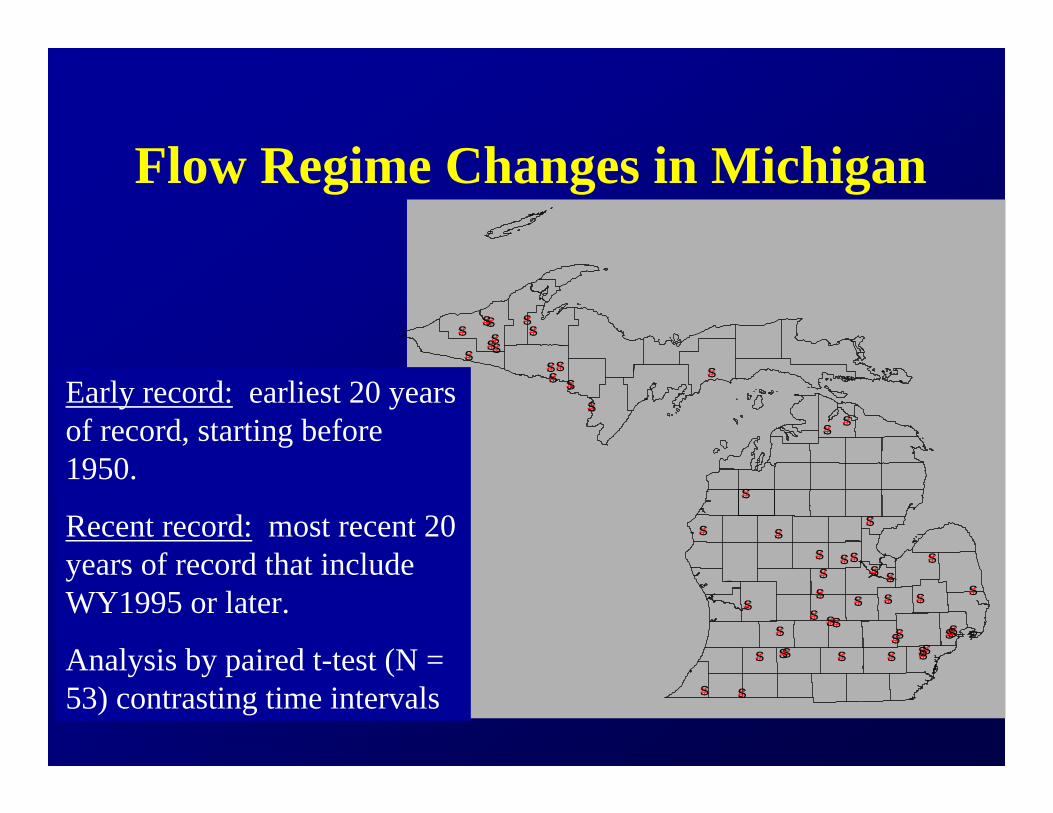
Flow Regime Changes in Michigan
#S#S#S
#S#S
#S
#S#S
#S
#S#S#S#S
#S#S
#S#S
#S#S#S #S
#S#S#S#S
#S
#S
#S#S
#S
#S #S
#S
#S #S#S
#S#S
#S#S
#S#S#S
#S
#S#S#S#S#S#S
#S#S#S
Early record: earliest 20 years of record, starting before 1950.
Recent record: most recent 20 years of record that include WY1995 or later.
Analysis by paired t-test (N = 53) contrasting time intervals

Changes in Flow Metrics
Magnitude of dischargeMean daily Q Water yield
Frequency of discharge% floods in 60 days# high pulse events# low pulse events
Duration of dischargeLow pulse duration
Timing of dischargeFlow predictabilityConstancy/predictabilityDate of min flow Rate of change of discharge
Rise rate# of reversals

Summary of Temporal Analysis
Compared to early records:• discharge has increased• flows exhibit more synchrony, more high flows,
and fewer low flow events• recent flows exhibit shorter duration of low flow
events• flow timing is more predictable, and the date of
minimum flow is slightly earlier• Rate of rise is faster, and reversals are fewer

Another Approach
• Characterize flow statistics for a reference period (pre-dam, early decades, etc)
• Trisect range of results into a lower, middle, upper third (so these will be equal)
• Characterize flow statistics for the comparison period (post-dam, late decades)
• Calculate the proportion of those flows that fall in each of the three ranges
For a single river….
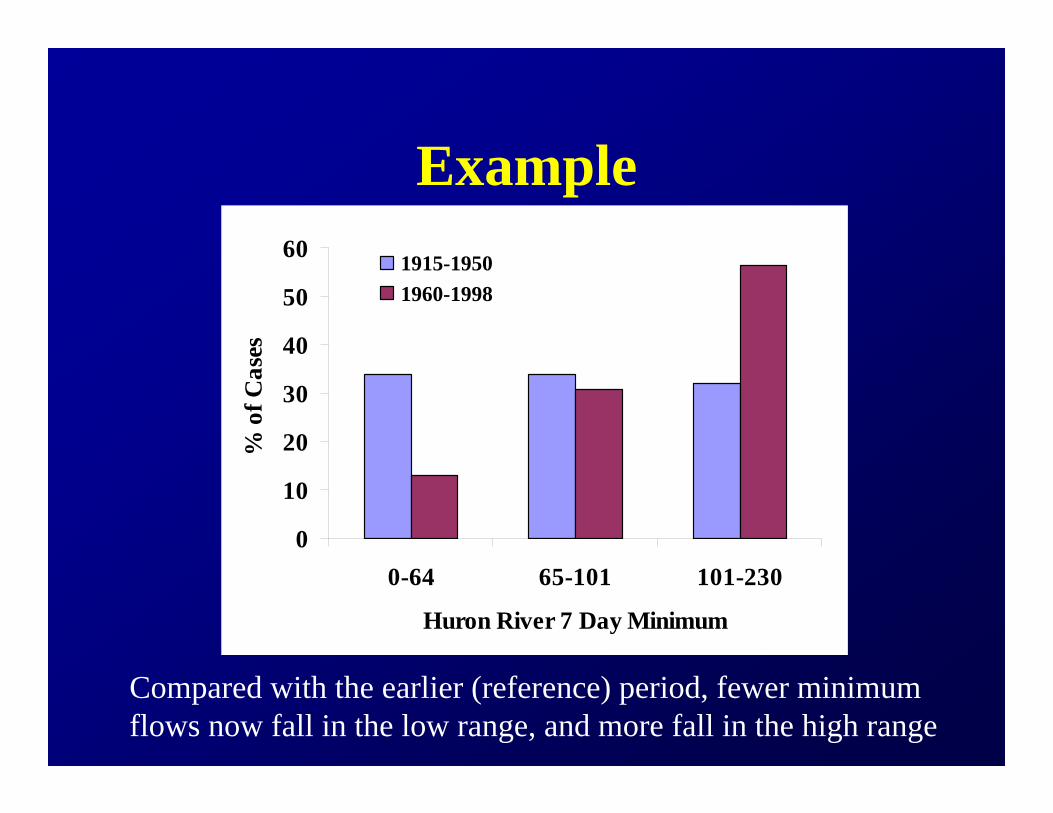
Example
0
10
20
30
40
50
60
0-64 65-101 101-230
Huron River 7 Day Minimum
% o
f Cas
es1915-19501960-1998
Compared with the earlier (reference) period, fewer minimum flows now fall in the low range, and more fall in the high range
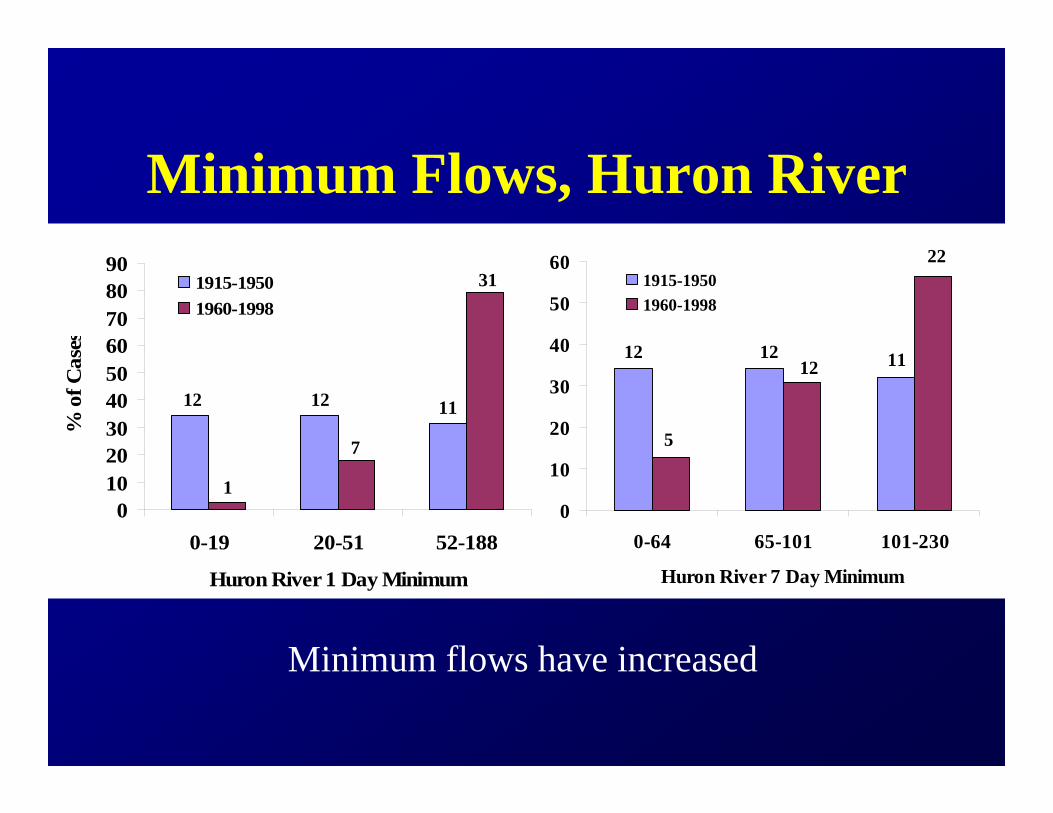
Minimum Flows, Huron River
0
10
20
30
40
50
60
0-64 65-101 101-230
Huron River 7 Day Minimum
1915-19501960-1998
12 12 11
5
12
22
0102030405060708090
0-19 20-51 52-188
Huron River 1 Day Minimum
% o
f Cas
es
1915-19501960-1998
12 12
31
1
7
11
Minimum flows have increased

Rise/Fall Rates, Huron River
010203040506070
0-45.5 45.6-63 63.1-128Huron River Rise Rate
% o
f Cas
es
1915-19501960-1998
0
10
20
30
40
50
60
-102--50 -49--37.5 -37.4-0Huron River Fall Rate
1915-19501960-1998
12
3
12
1011
26
12
21
12 1411
4
Rise rates are sharply up
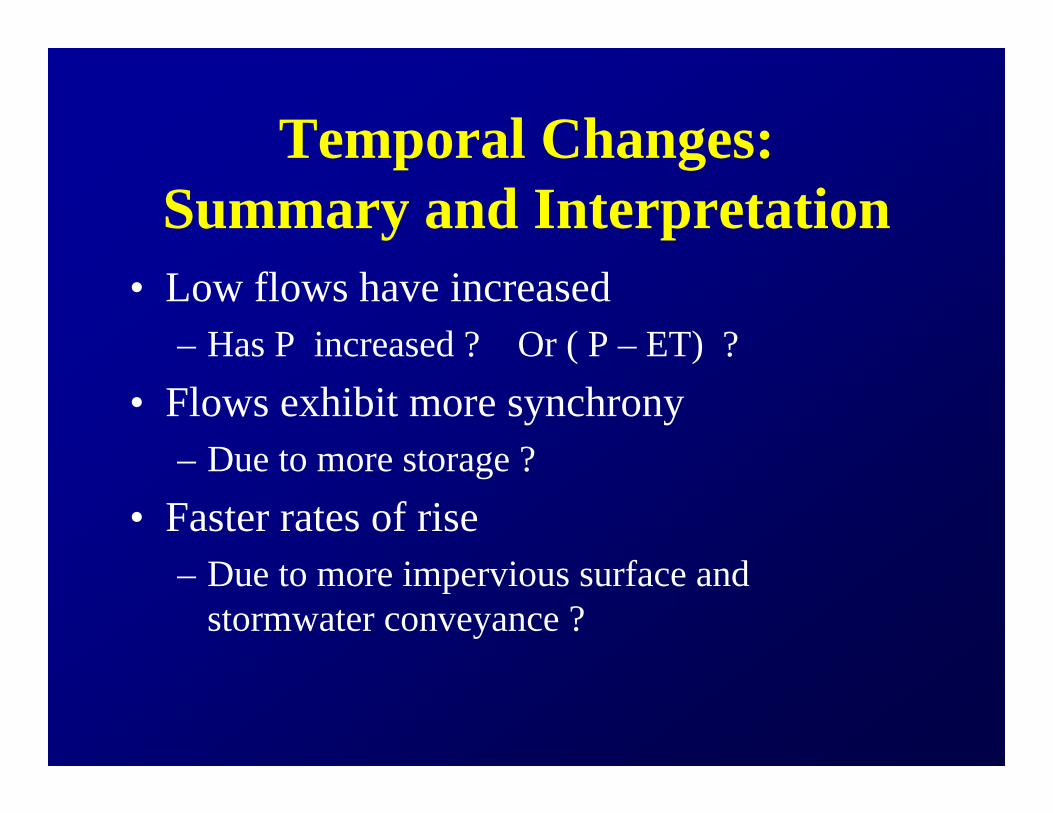
Temporal Changes: Summary and Interpretation
• Low flows have increased– Has P increased ? Or ( P – ET) ?
• Flows exhibit more synchrony– Due to more storage ?
• Faster rates of rise– Due to more impervious surface and
stormwater conveyance ?

20th C precipitation trends
25
30
35
4019
00-19
1019
10-19
2019
20-19
3019
30-19
4019
40-19
5019
50-19
6019
60-19
7019
70-19
8019
80-19
9019
90-20
00
Ann
ual P
reci
p (in
ches
)
Annual precipitation for ten regions of Michigan, averaged by decade. Bold red line is the average for all regions.

20th C Storage TrendsCumulative Storage
0
20000
40000
60000
80000
100000
120000
1800 1850 1900 1950 2000
Acr
e-fe
et
1929 1932 -1945
1915
Total storage capacity of all impoundments on the Huron River is now about 26% of total annual water discharge

20th C Impervious Surface Trends
1995 Future build-out
Thanks to Amy Mangus and SEMCOG

Acknowledgements
• Martha Carlson, Sarah Greene and Jennifer Mackay for assistance in acquiring and analyzing data.
• Stuart Eddy and the Great Lakes Commission for GIS and graphics assistance.
• Jim Diana, Ed Rutherford, Paul Seelbach, Paul Webb and Mike Wiley for helpful advice.
Funding for this project was provided by the Great Lakes Protection Fund.
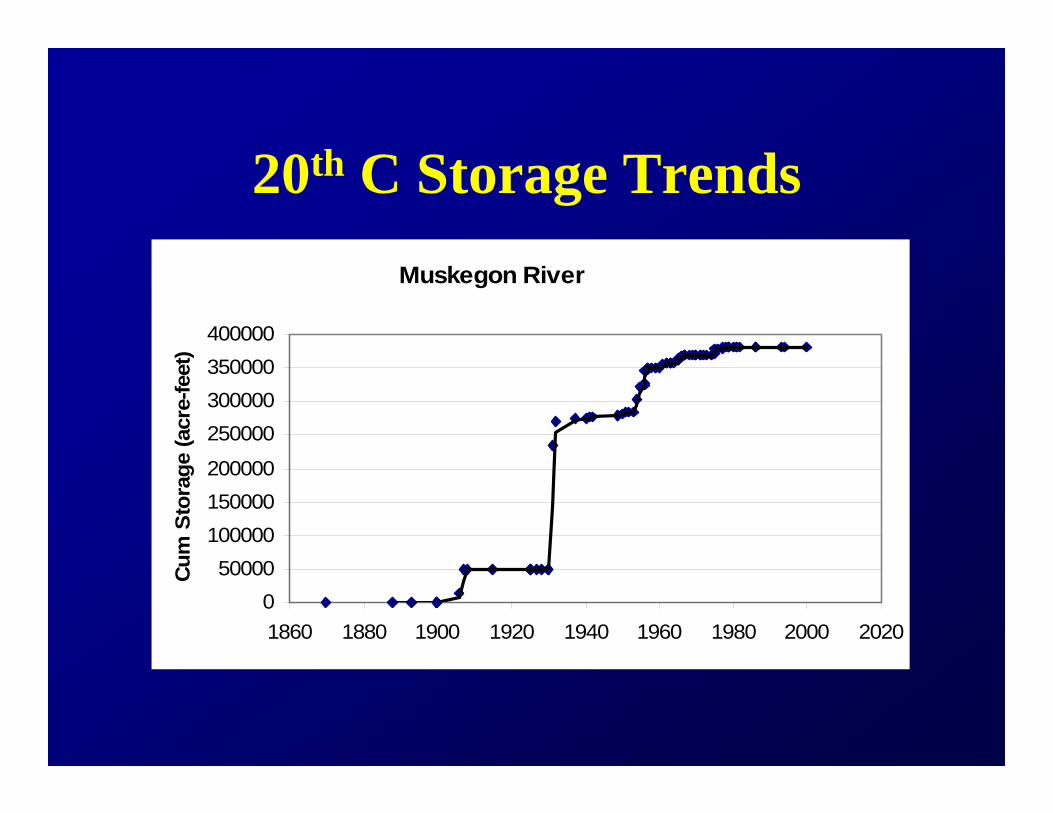
Muskegon River
050000
100000150000200000
250000300000350000400000
1860 1880 1900 1920 1940 1960 1980 2000 2020
Cum
Sto
rage
(acr
e-fe
et)
20th C Storage Trends
What Role Do Ecological What Role Do Ecological Indicators Play in EnsuringIndicators Play in Ensuring
Sustainable Water Resources?Sustainable Water Resources?
Brian H. HillBrian H. HillUS Environmental Protection AgencyUS Environmental Protection AgencyMidMid--Continent Ecology DivisionContinent Ecology DivisionDuluth, MinnesotaDuluth, Minnesota
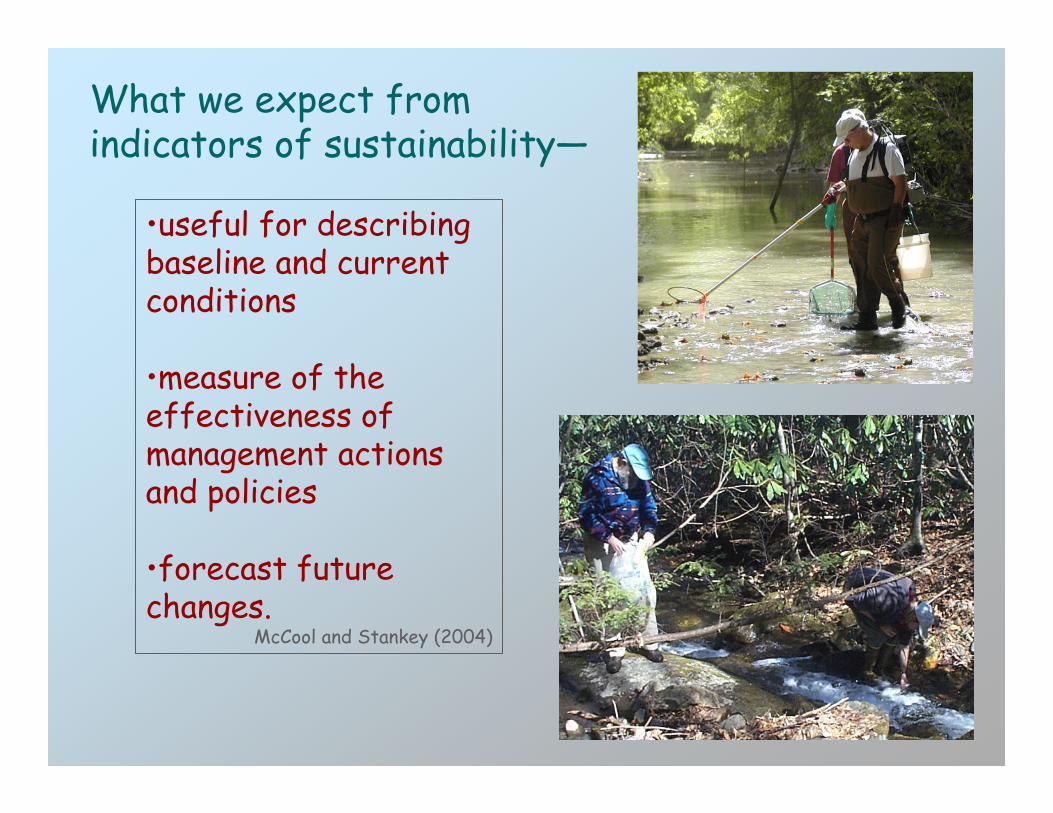
What we expect from indicators of sustainability—
•useful for describing baseline and current conditions
•measure of the effectiveness of management actions and policies
•forecast future changes.
McCool and Stankey (2004)
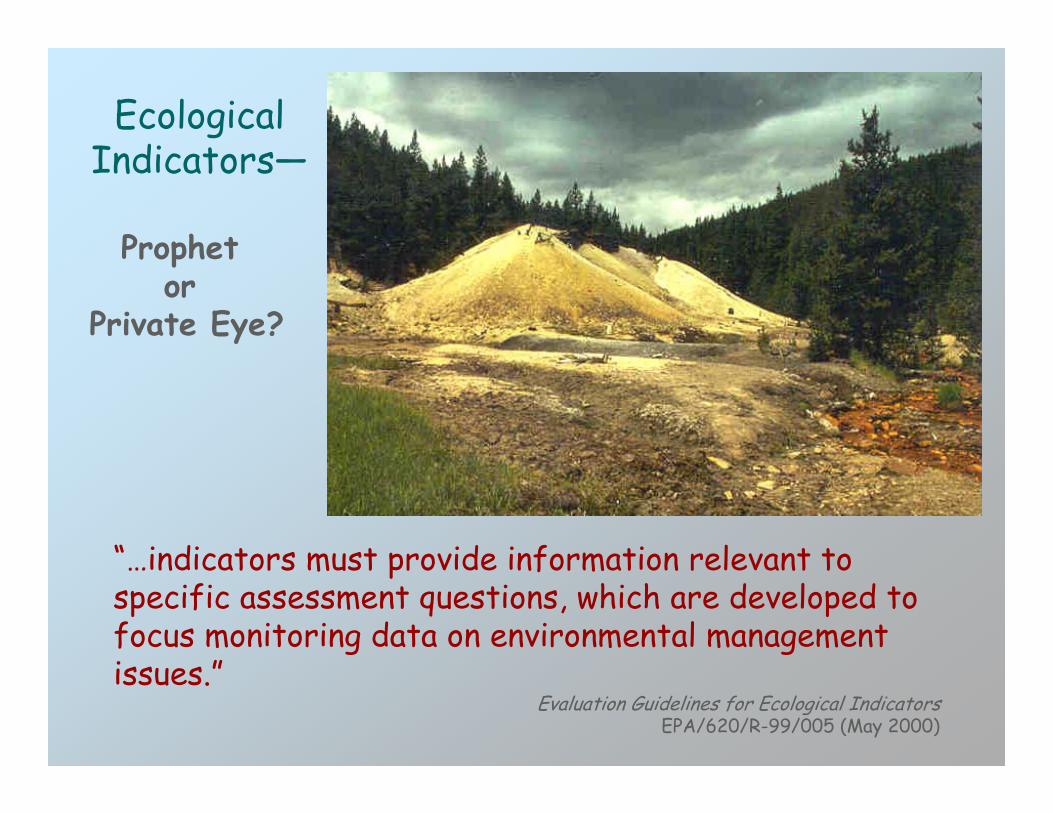
Ecological Indicators—
“…indicators must provide information relevant to specific assessment questions, which are developed to focus monitoring data on environmental management issues.”
Evaluation Guidelines for Ecological IndicatorsEPA/620/R-99/005 (May 2000)
Prophet or
Private Eye?

Key Elements of Ecosystem Indicators—
ecosystem structure•species richness•species diversity•biomass•food web connectivity
ecosystem function •energy flow•biogeochemical cycling
diagnostics•stressor-response
stability•resistance•resilience
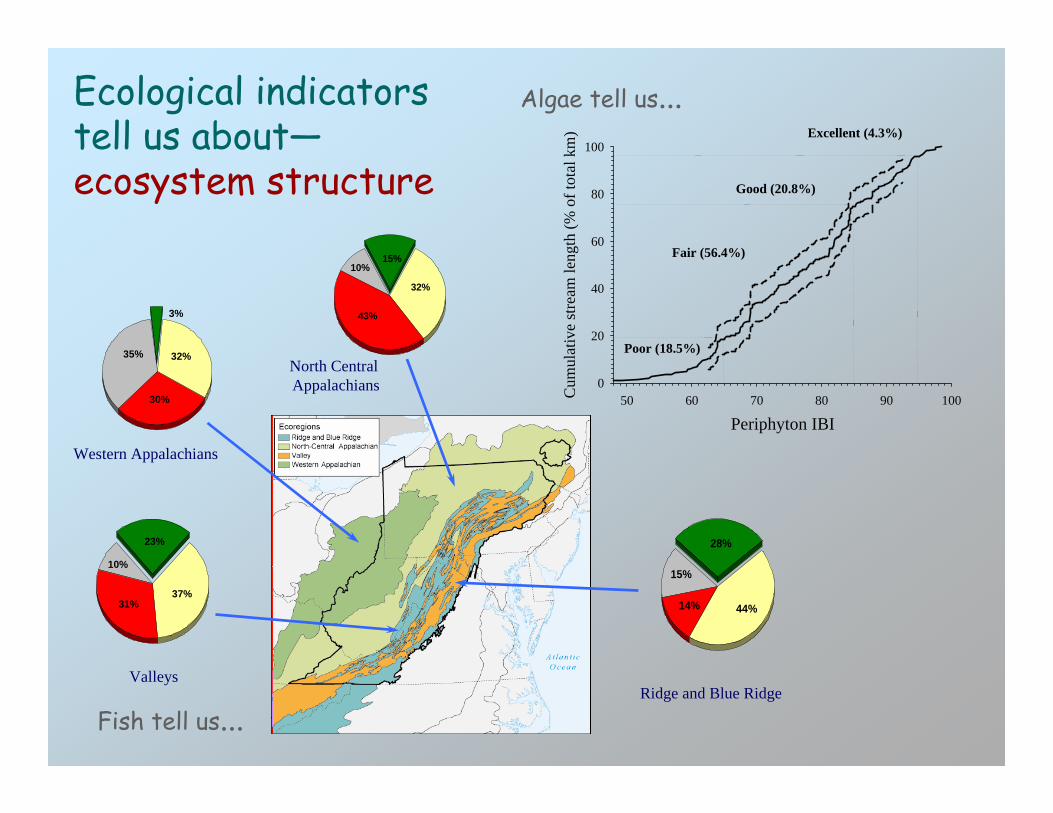
Periphyton IBI50 60 70 80 90 100C
umul
ativ
e st
ream
leng
th (%
of t
otal
km
)
0
20
40
60
80
100Excellent (4.3%)
Good (20.8%)
Fair (56.4%)
Poor (18.5%)
Ecological indicators tell us about—ecosystem structure
35%
3%
32%
30%
Western Appalachians
10%
23%
37%31%
Valleys
10%15%
32%
43%
North Central Appalachians
15%
28%
44%14%
Ridge and Blue Ridge
Fish tell us...
Algae tell us...

Ecological indicators tell us about—ecosystem function
Diss
olve
d Zi
nc ( μ
g L-1
)
0
50
100
150
200
250
Cerio
daph
nia
mor
talit
y (%
)
0
20
40
60
80
100
Net
dai
ly m
etab
olis
m (m
g O
2 m-2
d-1
)
0
2
4
6
8
10
Sedi
men
t mic
robi
al r
espi
ratio
n (m
g O
2 m-2
d-1
)
0.00
0.05
0.10
0.15
0.20
0.25
0.30
ZincCeriodaphnia mortality Net daily metabolismSediment microbial respiration
Forest Harvest History (PCA axis)-4 -2 0 2
Nut
rien
t Upt
ake
Rat
e (g
m-2
h-1
)
1.0
1.2
1.4
1.6
Appalachians (Rk=0.56)
Cascades (Rk=043)
Ouachitas (Rk=0.49)
Redwoods (Rk=066)

Ecological indicators —diagnose causes of impairment
Habitat Factor 1-2 -1 0 1 2
Indi
cato
r Val
ue
0
20
40
60
80
100
Fish IBI Response to Habitat Gradient
High -------------------------------------> Low
Nutrient GradientEu
traph
entic
dia
tom
s
0.25
0.50
0.75
r=0.62
Diatom Response to Nutrient Gradient
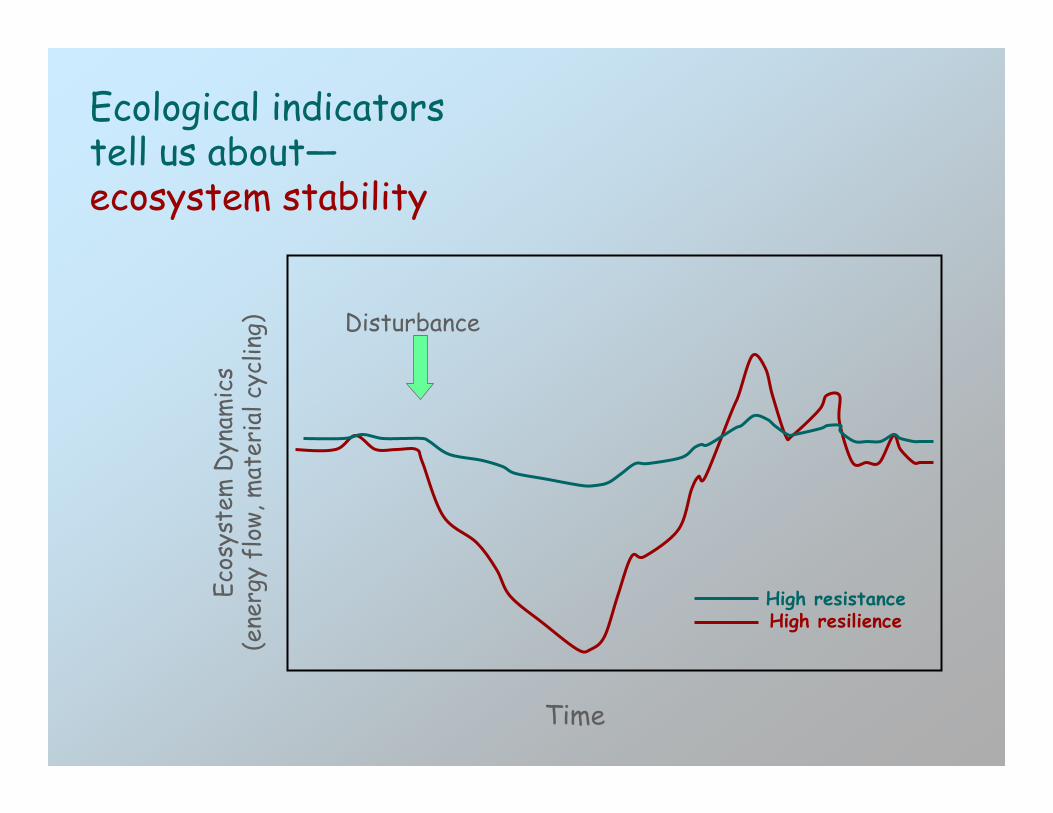
Ecological indicators tell us about—ecosystem stability
Time
Ecos
yste
m D
ynam
ics
(ene
rgy
flow
, mat
eria
l cyc
ling) Disturbance
High resistanceHigh resilience

Urbanization/Residential Development
Forest Practices
Agriculture Mining Recreation & Mgmt
DamsChannelization
DiversionsLevees
Revetments
Increasing Population
RoadsConstructionPoint SourcesWastewater
Pets
FragmentationFertilizersPesticides
RoadsMonocultureCompaction
Sedimentation
FertilizersLivestockPesticides
Habitat Alt.IrrigationCompaction
Animal Waste
Habitat Alt.Toxic Waste
OilGravel
ExtractionHeavy MetalsLiming
RoadsConstructionHabitat Alt.
BoatingFishing
Fish Intro.,Poisoning
Changes in Biological Assemblages
R. Jan Stevenson (from Bryce et al. 1999)
Natural Stressors/Geographic Setting (Climate, Geology, Latitude, etc.)
Human Activities
Stressors
Endpoints
Changes in flow, timing,
amount,pathway
Changes in sediment
load
Changes in Vegetation
Chemical Loading;Toxins
NutrientsO2 DemandAcid/Base
Mobilizationof heavy metals
Water QualityChemical Habitat
Physical Habitat
Stream Channel
Modification
Atmospheric Deposition
NOxSOx
Air ToxicsLiming
This is what we measure
This is what we need to
understand

S
JR
Tp
Sb0
WN0
Ss0
k5
k6x
xx
xx
x
M
P
Ss
Nx
k2
k1
k3
k4
k39
R
xSf x
Wke
x
GWtime
Jw1
Jw1Jw0
Dk24
k23
k14
x
Wke
Sb
Wke
Jw
PI
PFBI
BF
x
(-)
(-)
(-)
k7
k8
k9
k10
k11
k12
k13
k15
k16
k17
k18k19
k20
k21
k22
k36
k25
k26
k27
k28
k29
k30
k31
k32
k33k34 k3
5
k37
k38
k40
k41
k42
k43
x
k44
k45 k4
6
k47
time
Jw0
What ecologist tell non-ecologists about ecosystems...
TpTp
Tp
Tp
ET A
WdWd
timeWd
k48
BFD
PFD
DS
-
...but, the fact is we can measure all of these components and their interactions
Our current views of ecosystems, by themselves, will not help promote sustainability because...
•Indicators of condition for surface waters, while good for what they do, are only measures of the symptoms, not the problem
•Indicators are generally limited to the spatio-temporal scale of measurement, and are difficult to extrapolate to the appropriate scales
•Sustainability is a system level property that includes not only the determinants of surface waters but also how the system may change in the future
...indicators of sustainable surface waters may not be a realistic goal!
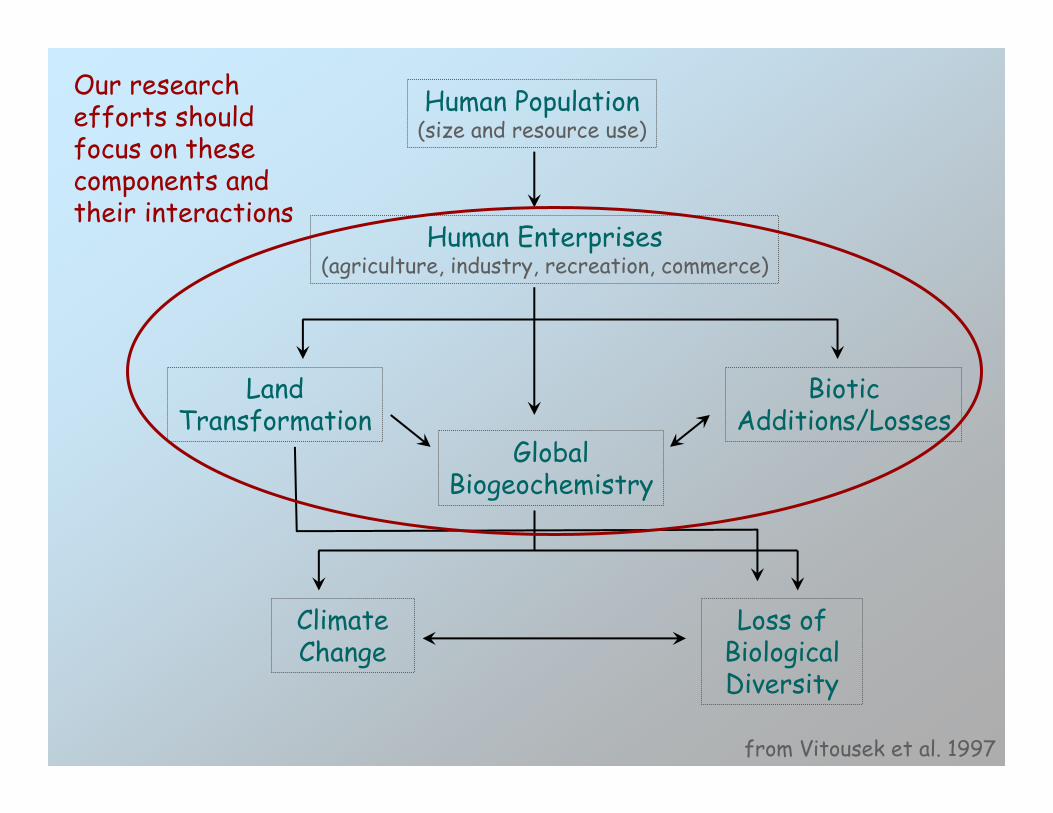
Human Population(size and resource use)
Human Enterprises(agriculture, industry, recreation, commerce)
Land Transformation
Global Biogeochemistry
Biotic Additions/Losses
Climate Change
Loss of Biological Diversity
from Vitousek et al. 1997
Our research efforts should focus on these components and their interactions
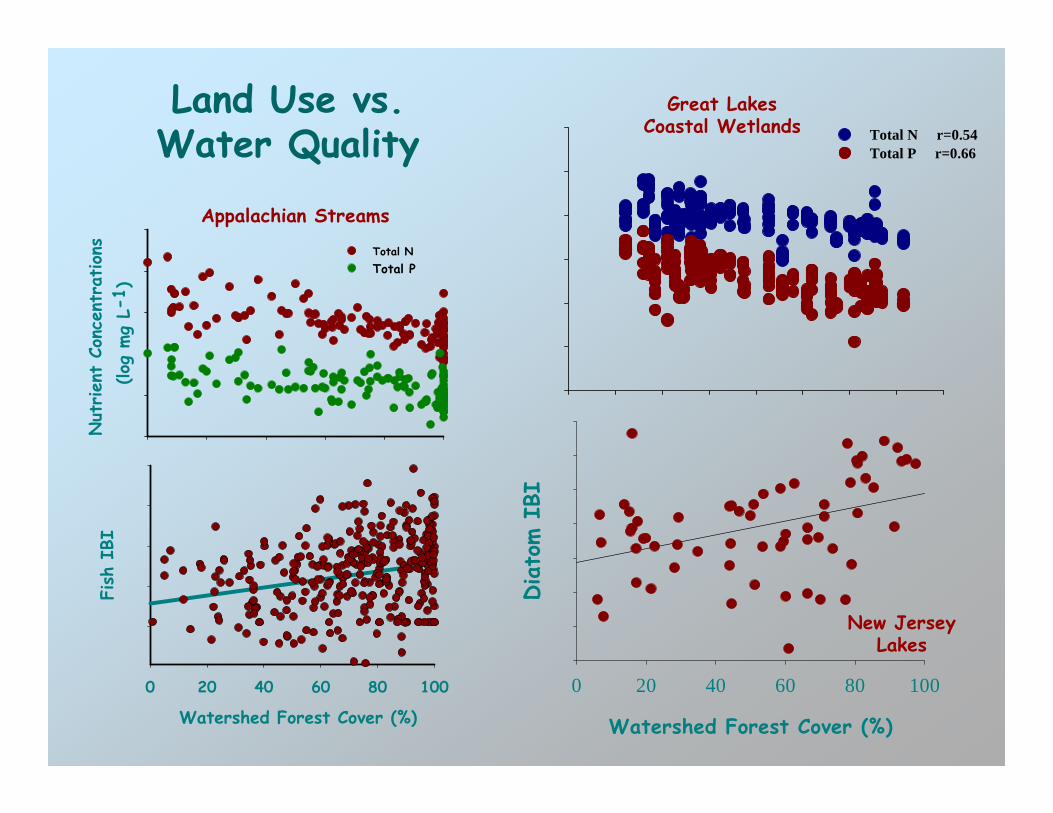
Watershed Forest Cover (%)
0 20 40 60 80 100
Diato
m I
BI
Total N r=0.54Total P r=0.66
Land Use vs. Water Quality
Appalachian Streams
Great Lakes Coastal Wetlands
New Jersey Lakes
Watershed Forest Cover (%)
Nut
rien
t Co
ncen
trat
ions
(lo
g mg
L-1 )
Total N Total P
0 20 40 60 80 100
Fish
IBI
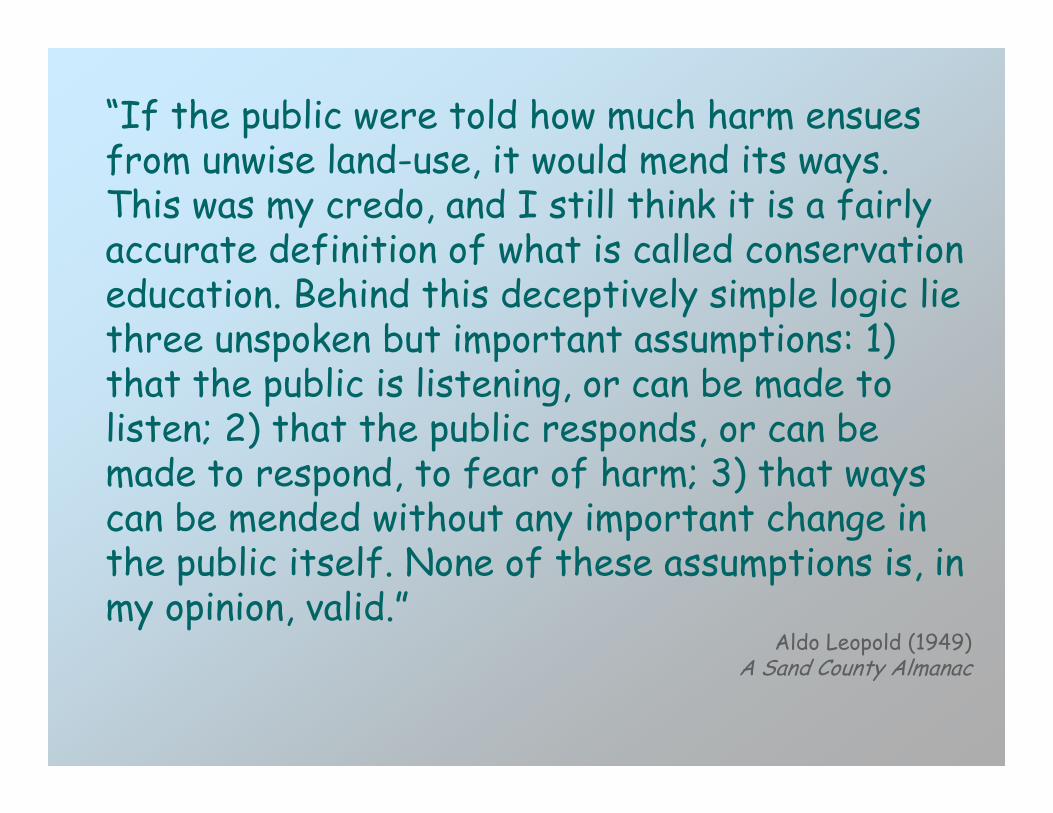
“If the public were told how much harm ensues from unwise land-use, it would mend its ways. This was my credo, and I still think it is a fairly accurate definition of what is called conservation education. Behind this deceptively simple logic lie three unspoken but important assumptions: 1) that the public is listening, or can be made to listen; 2) that the public responds, or can be made to respond, to fear of harm; 3) that ways can be mended without any important change in the public itself. None of these assumptions is, in my opinion, valid.”
Aldo Leopold (1949)A Sand County Almanac

How do we get the public to respond?
1. Educationa) K-12 programsb) post-secondaryc) community outreach
2. Engagementa) inclusion of all stakeholdersb) respect for all perspectives
3. Empowermenta) consensus management plansb) adoption by general publicc) enforcement at stakeholder level

Research Needs
•indicators linking aquatic resources to their watersheds
•indicators of ecosystem functions and stability
•indicators that inform and engage stakeholders
•models capable of predicting futures with less than perfect information
From www.salmonnation.com
“Whole watershed land use in the 1950s was the best predictor of present-day diversity, whereas riparian and watershed land use in the 1990s were comparatively poor indicators.”
Harding et al, 1998

“Once upon a time I agreed with Eric Chivian and the Center for Health and the Global Environment that people will protect the natural environment when they realize its importance to their health and to the health and lives of their children. Now I am not so sure. It's not that I don't want to believe that; it's just that I read the news and connect the dots...”
Bill Moyers (2004) on receiving the Global Environment Citizen Award
Ding Darling, 1962
Ecologically SustainableWater Management
www.nature.org [email protected] www.freshwaters.org
Andy Warner

Proportion of U.S. Species at RiskProportion of U.S. Species at Risk

Freshwater EcosystemsCauses of Species Loss...
• Water Quality Degradation• Changes in Natural Flows
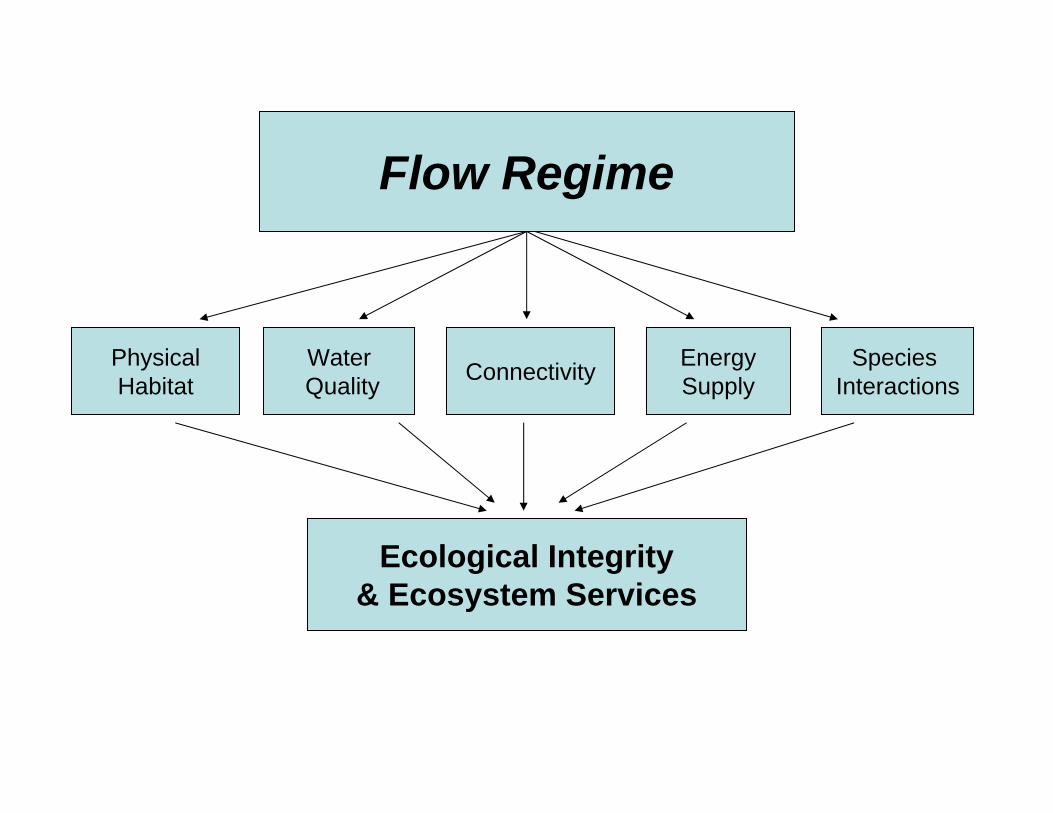
Flow Regime
PhysicalHabitat
WaterQuality
EnergySupply
Species Interactions
Ecological Integrity& Ecosystem Services
Connectivity

It’s Not Just a Matter of Water Volume…
This is the same volume!

Environmental Flows
The flow of water in a natural river or lake that sustains healthy ecosystems and the goods and services that humans derive from them.
The goal is not to create optimal conditions for all species all of the time;
we want to create adequate conditions for all native species enough of the time.
Environmental Flows
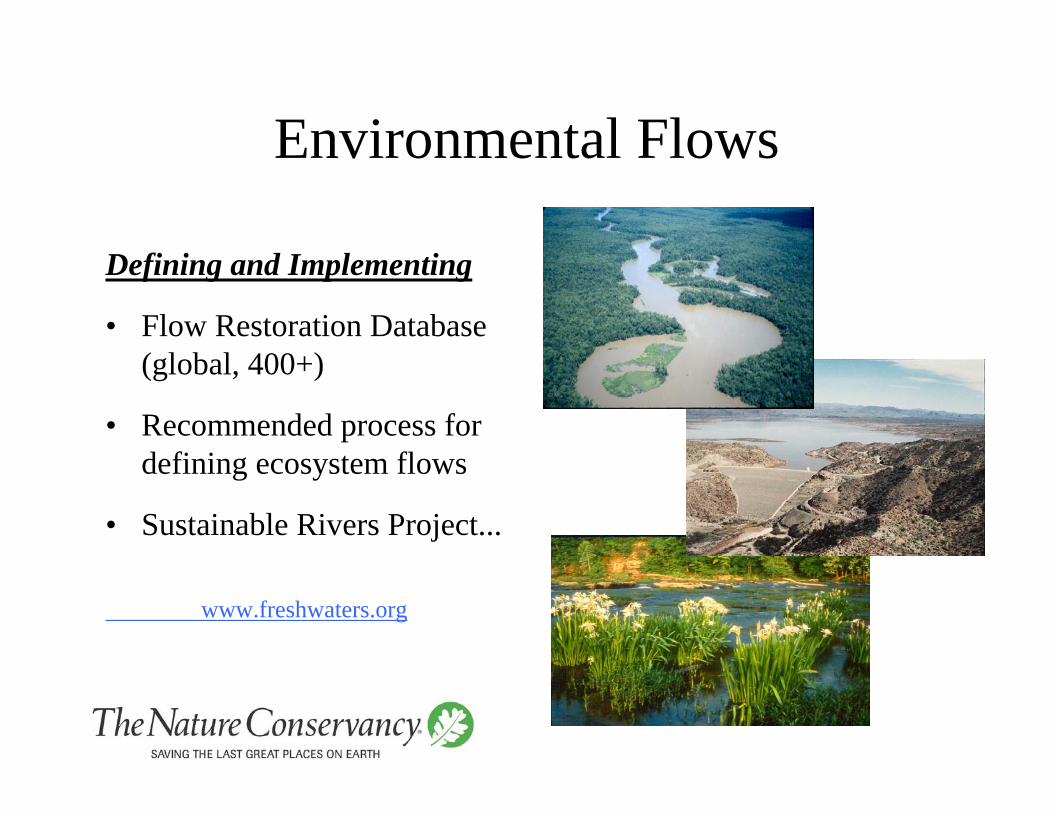
Defining and Implementing
• Flow Restoration Database (global, 400+)
• Recommended process for defining ecosystem flows
• Sustainable Rivers Project...
www.freshwaters.org
Environmental Flows

Green
Allegheny(under consideration)
Roanoke
Bill Williams
SavannahWhite, Black,Little Red
Sustainable Rivers ProjectCurrent Sites
Ashuelot
Cypress
WestWillamette
Purgatoire(under consideration)

Ecologically Sustainable Water Management What’s Missing in the U.S.?
• Clear management goals for our rivers that explicitly recognize ecological needs for water quantity and flow
• State/federal program designed to achieve these goals– Permitting processes that are 1) ecologically protective; 2)
supportive of long-term economic development; and, 3) balanced in sharing responsibility
Systematic and efficient process for setting limits of hydrologic alteration across multiple rivers (e.g., state-wide)

Limits of Hydrologic Alteration Method
LOHA is a Method founded upon three basic concepts:• Environmental flow recommendations should be based on long-term
ecosystem health, rather than limited components such as fish species (e.g., Arthington et al. 1992; Richter et al. 1997; Poff et al. 1997; Dyson et al. 2003; Annear et al. 2004)
• Ecosystem health is best supported by the natural flow regime, and departures from natural flows will result in ecosystem degradation
(e.g., Arthington et al. 1992; Poff et al. 1997; Richter et al. 2003; Bunn and Arthington 2003; Annear et al. 2004)
• The health of rivers can be described as spanning a spectrum of degradation such as “excellent” to “poor”
(e.g., Petts 1996; King et al. 2004; Richter and Postel 2003; USEPA 2004)
These river health classes can be used as a basis for goal-setting and applied to defining environmental flows for all rivers in a state

Ecological Goal Setting
From: “Rivers for Life: Managing Water for People and Nature”
by Sandra Postel and Brian Richter (Island Press 2003)

LOHA Method: General Steps
• Set Goals: Assign Rivers a Desired Ecological Condition (Class) Set health goals for rivers or river segments (much like state water quality classification)
• Assess Compliance with Hydrologic Criteria Specific criteria are dependent upon the river’s Class and allow compliance to be assessed
• Design Protection Strategies for Rivers Meeting Criteria Analogous to water quality anti-degradation policies; facilitates review of new permit
applications
• Design Restoration Strategies for Rivers Out of Compliance Analogous to TMDLs; facilitates watershed- and market-based approaches for streamflow
restoration
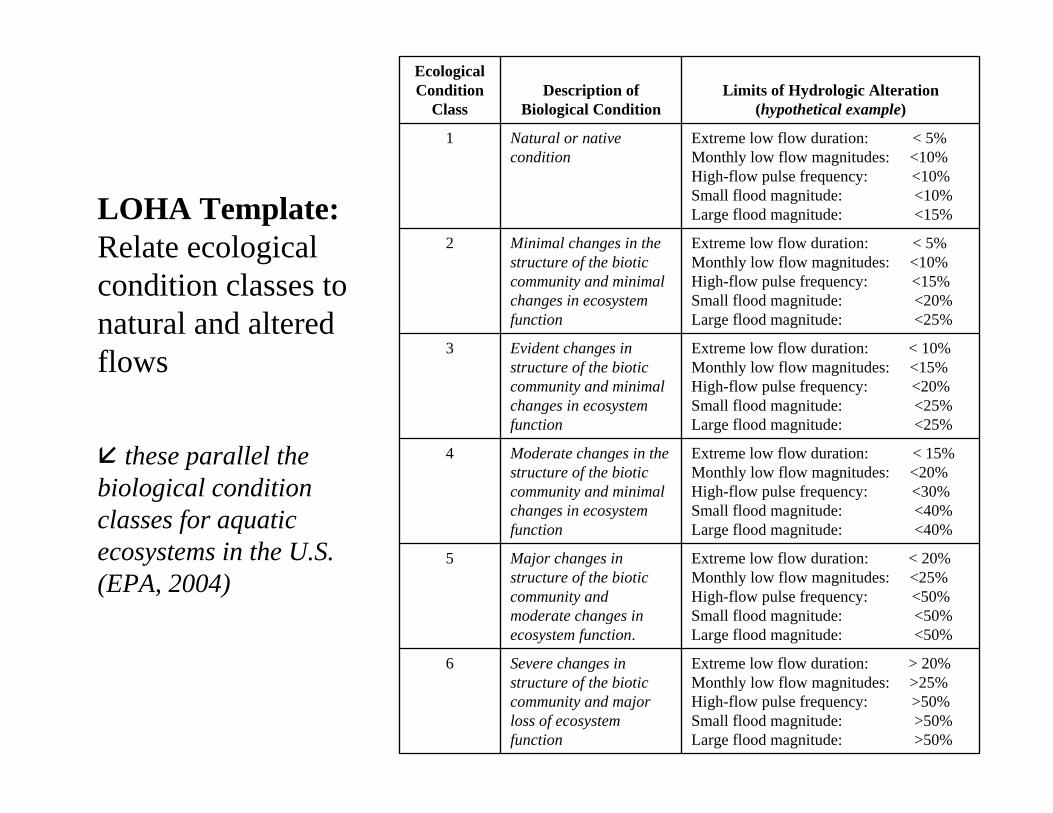
Extreme low flow duration: > 20%Monthly low flow magnitudes: >25%High-flow pulse frequency: >50%Small flood magnitude: >50%Large flood magnitude: >50%
Severe changes in structure of the biotic community and major loss of ecosystem function
6
Extreme low flow duration: < 20%Monthly low flow magnitudes: <25%High-flow pulse frequency: <50%Small flood magnitude: <50%Large flood magnitude: <50%
Major changes in structure of the biotic community and moderate changes in ecosystem function.
5
Extreme low flow duration: < 15%Monthly low flow magnitudes: <20%High-flow pulse frequency: <30%Small flood magnitude: <40%Large flood magnitude: <40%
Moderate changes in the structure of the biotic community and minimal changes in ecosystem function
4
Extreme low flow duration: < 10%Monthly low flow magnitudes: <15%High-flow pulse frequency: <20%Small flood magnitude: <25%Large flood magnitude: <25%
Evident changes in structure of the biotic community and minimal changes in ecosystem function
3
Extreme low flow duration: < 5%Monthly low flow magnitudes: <10%High-flow pulse frequency: <15%Small flood magnitude: <20%Large flood magnitude: <25%
Minimal changes in the structure of the biotic community and minimal changes in ecosystem function
2
Extreme low flow duration: < 5%Monthly low flow magnitudes: <10%High-flow pulse frequency: <10%Small flood magnitude: <10%Large flood magnitude: <15%
Natural or native condition
1
Limits of Hydrologic Alteration(hypothetical example)
Description of Biological Condition
Ecological Condition
Class
LOHA Template:Relate ecological condition classes to natural and altered flows
these parallel the biological condition classes for aquatic ecosystems in the U.S. (EPA, 2004)
• Select the river categorization system most appropriate for a state
modest effort: existing state/national examples
• Identify the flow parameters that can best represent the health of a river
moderate effort: representativeness v.s. manageable number
• Establish thresholds between river health classes Increase the resolution at which we can define thresholds between river classes
large effort: increase the certainty and resolution between river classes
Ecologically Sustainable Water ManagementTechnical Tasks and Research Needs

Ecologically SustainableWater Management
www.nature.org [email protected] www.freshwaters.org
Andy Warner