certain situations exist where: if one quantity increases, the other quantity also increases. if...
TRANSCRIPT

Certain situations exist where: If one quantity increases,
the other quantity also increases.
If one quantity increases, the other quantity decreases.
This kind of modeling is called variation.
10. Variation

Direct Variation
Definition: When one quantity increases, the other increases. When one quantity decreases, the other decreases.

Indirect Variation
Definition: When one quantity increases, the other decreases. When one quantity decreases, the other increases.

Joint Variation
Definition: When one quantity varies according to two other quantities.

Example 1
Express the statement as an equation. Use the given information to find the constant of proportionality.
y is directly proportional to x. When x = 3, y = 39.

Express the statement as an equation. Use the given information to find the constant of proportionality.
M is inversely proportional to the square of t. When t = -4, M = 5.
Example 2

C is proportional to cube root of s and inversely proportional to t. When t = 7 and s = 27, C = 66.
Express the statement as an equation. Use the given information to find the constant of proportionality.
Example 3

The pressure P of a sample of gas is directly proportional to the temperature T and inversely proportional to the volume V. Write an equation that expresses this variation.
Find the constant of proportionality if 125 L of gas exerts a pressure of 12.7 kPa at a temperature of 250 K.
Find the pressure if volume is increased to 150 L and temperature is decreased to 200 K. (Round the answer to the nearest tenth.)
Example 4

The force F needed to keep a car from skidding is jointly proportional to the weight w of the car and the square of the speed s, and is inversely proportional to the radius of the curve r.
Write an equation that expresses this variation.
A car weighing 3,600 lb travels around a curve at 60 mph. The next car to round the curve weighs 2,500 lb and requires the same force as the first. How fast was the second car traveling?
Example 5

Example 5(continued)r
swkF
2
First Car(3600lb, 60mph) Second Car(2500lb, ?mph)

One quantity depends on another quantity # of shirts -> revenue Age -> Height Time of day -> Temperature
11. Functions

Function – Definition
4 Representations of a function:• Verbally – a description in words• Numerically – a table of values• Algebraically – a formula• Visually – a graph
Formal definition: A function f is a rule that
assigns to each element x in a set A exactly
one element, f (x), in a set B. ( f (x) is read as “ f of x ”)

Verbal & Numeric
Verbal: Function f(x) divides x by 3 and then adds 4.
Numeric:
x -2 5 9 -4 1
f(x)
Table describes the values in A and their assignments in B.

Algebraic & Graphic
Algebraic:
Graphic:
x -2 5 9 -4 1
f(x)
Plot points (x, f(x)) in the two dimensional plane
43
)( x
xf
2 4 6 8
-21
21
42
x
f(x)

Example: Evaluate the function at the indicated values.
3)( 2 xxf
xfxffff ,1),2(),2(),0(

Piecewise Functions
0 if
03- if
3 if
4
5
3
)(2 x
x
x
xx
x
xg
Evaluate the function at the indicated values.
)2(),0(),1(),3(),4( ggggg

Difference Quotient
Find f(a), f(a+h), and the difference quotient for the given function.
7)( 2 xxf
Difference quotient:h
afhaf )()(

Domain
Domain:
Recall definition: A function f is a rule that assigns to each
element x in a set A exactly one element, f(x), in a set B.
Set A = input => x = independent variable
Set B = output => y = f(x) = dependent variable
Two restrictions on the domain for any function:

Example 1
Find the domain for the following function.
36
5)(
2
x
xxf
D:

Example 2
Find the domain for the following function.
xxf 11)(
D:

Functions in one variable can be represented by a graph.
Each ordered pair (x, f(x)) that makes the equation true is a point on the graph.
Graph function by plotting points and then connecting the points with smooth curves.
12. Graphs of Functions

Example
x
f(x)
24)( xxf
Create a table of points:
x
-3
-2
-1
0
1
6
-1 1
-6
)(xfy

Basic Functions - Linear
f(x) = mx +b
x
f(x)
x
f(x)

Basic Functions - Power
f(x) =
x
f(x)
x
f(x)
nx

f(x) =
x
f(x)
x
f(x)
nn xx /1
Basic Functions - Root

f(x) =
x
f(x)
x
f(x)
nx
1
Basic Functions - Reciprocal
x
f(x)
0 if
0 if ||
x
x
x
xxf(x) =
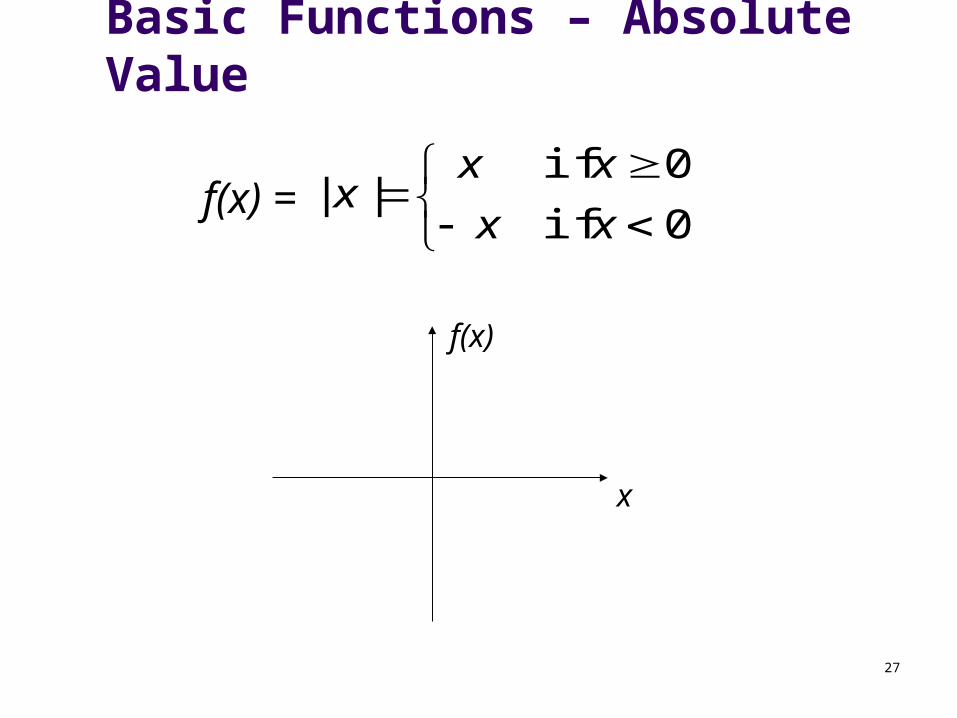
Basic Functions – Absolute Value

Vertical Line Test
Determine if an equation is a function of x:
Draw a vertical line anywhere and cross the graph at most once, then it is a function.
y=
x
f(x)
x
f(x)
x 922 yx

Piecewise Function Graph
0 if
03- if
3 if
4
5
3
)(2 x
x
x
x
x
xg
-3

Domain/Range from Graph
Look at graph to determine domain (inputs) and range (outputs).
x
f(x)
Domain:
Range:2
2
-2 4
-2

Average Rate of Change (A.R.O.C.): change in the function values over the change in the input values.
For a function, y = f(x), between x = a and x = b, the A.R.O.C is:
13. Average Rate of Change

x
y
-16 -12 -8 -4 4 8 12 16
-9
9
3
Find the average rate of change between the indicated points.
A.R.O.C. =
(-16, 6)
(-4, -6)
Example 1

x
y
-16 -12 -8 -4 4 8 12 16
-9
9
3
Find the average rate of change between the indicated points.
A.R.O.C. =
(-16, 6) (12, 9)
Example 2

Find the average rate of change of the function between the values of the variable.
32 5)( xxxf 2,2, xx
A.R.O.C.
Example 3

Find the average rate of change of the function between the values of the variable.210)( xxf hxx 1,1,
A.R.O.C.
Example 4

A man is running around a track 200 m in circumference. With the use of a stopwatch, his time is recorded at the end of each lap, seen in the table below.
Time (s) Distance (m)
32 200
66 400
104 600
153 800
209 1000
270 1200
341 1400
419 1600
What was the man’s speed between 66s and 209s? Round answer to the nearest hundredth.
Calculate the man’s speed for each lap.Please round answer to the nearest hundredth.
Lap 1:
Lap 2:
Example 5

Vertical Shifts f(x) + c: Add to the function => shift up
||)( xxf
f(x) - c: Subtract from the function => shift down
xxf )(
14. Transformations

f(x+c): Add to the variable => shift back(left)
||)( xxf
f(x – c): Subtract from the variable => shift forward(right)
xxf )(
Horizontal Shifts

Graph the function: 5)3()( 2 xxf
Example: Shifts

f(-x): Negate the variable => reflect in the y-axis
xxf )(
y-axis reflection

-f(x): Negate the function => reflect in the x-axis
2)( xxf
x-axis reflection

Graph the function: 2|7|)( xxf
Example: Shift and reflection

cf(x): multiply the function by c > 1=> vertical stretch
3)( xxf
cf(x): multiply the function by 0 < c < 1 => vertical shrink
2)( xxf
(1,1)(8,2)
(2,4)
Vertical Stretch & Shrink

Even function(y-axis symmetry): if f(-x) = f(x)
Odd function(origin symmetry): if f(-x) = -f(x)
Determine whether the following are even, odd, or neither.
7)( 2 xxh
43)( xxxg
Even & Odd Functions