indicators of drought vulnerability for assessing … of drought vulnerability for assessing coping...
TRANSCRIPT
Indicators of Drought Vulnerability for Assessing Coping Mechanism in Arid Western Rajasthan
D.K. Saha, Amal Kar* and M.M. RoyCentral Arid Zone Research Institute, Jodhpur 342 003, IndiaReceived: July 2011
Abstract: In order to identify some socio-economic indicators of drought vulnerability that could be measured at grassroots level in the sandy desert of India, a study was undertaken in ten dune-covered villages of Jodhpur district with limited water availability, low crop production and comparatively less employment opportunities. In-depth interviews with sample households from different land-holding categories and different castes/communities in the villages revealed that a land holding of less than 2 ha, and non-availability of secondary sources of income (family income below Rs. 3200 per month) are the major indicators of drought vulnerability at the grassroots level. MGNREGA is now emerging as an indicator of drought-coping capability at village level.
Key words: Drought, vulnerability, socio-economic indicators, western Rajasthan.
Drought is an integral part of the earth’s climate. It can be defined as a recurring extreme climatic event over land, characterized by below-normal rainfall over a period of months to years (Dai, 2011). Considering that the arid regions receive much less rainfall than the other regions on the earth and have lesser number of rainy days, the incidence of drought is also higher in this region. Depending on its severity, drought causes different degrees of suffering to the human societies, especially those depending more on agriculture and allied activities.
In India the arid western part of Rajasthan state, covering 62% of the country’s arid lands, is frequently affected by droughts of different intensities. Between 1901 and 2010 the region experienced droughts of moderate to severe and disastrous intensities in 57 years. Broadly, people of the region expect drought in two to three years out of five, and have, therefore, developed various coping mechanisms to avoid its adverse impacts. Yet, drought continues to take a heavy toll of the region’s economy as well as human and livestock populations. The condition becomes especially precarious when drought continues for years together (e.g., 1903-05, 1957-60, 1966-71 and 1984-87).
Such long droughts greatly impact the desert societies because the food, fodder and water resources get severely depleted (Narain and Kar, 2005). The drought of 1898-1900 was so severe and widespread that about 1 million people perished
(Kachchhawaha, 1985). In recent decades, the drought of 2002 was of ‘disastrous’ proportion when the annual rainfall was a mere 127 mm (38% of the long-term average), and the crucial summer monsoon rainfall was 90 mm, against the normal of 280 mm. A rapid reconnaissance of the villages across western Rajasthan during the drought of 2002 brought out how the livelihoods of different segments of rural communities were affected with the depleting food, fodder and water resources, and how people tried to adjust to the worsening situation (Narain and Kar, 2005). The study also highlighted the need for developing a system to measure vulnerability of the society to drought, so that advanced planning could be made to reach out to the most needed villages and segments of the society during emergency.
Vulnerability of a household unit or of a community or a society to drought can be defined as its capacity to withstand the exposure to drought stresses, either experienced or anticipated. It is a dynamic process that changes on different time scales, and is driven by the evolving environmental, social, economic and political interactions in the area of influence of the target unit (Dwyer et al., 2004; Downing et al., 2005; Wehbe et al., 2005). Despite the concept being theoretically sound and appropriate for drought planning, assessment of vulnerability is still very difficult because of the enormity of interactions in space and time between the different variables in the complex web of environmental-social-economic-political realm. Often the assessment is based on measurement of a set of carefully
Annals of Arid Zone 51(1): 1-9, 2012
*E-mail: [email protected]
2 SAHA et al.
selected indicators, but because of the complex and dynamic nature of the interactions between the variables, the choosing of appropriate indicators applicable to large areas is difficult. Gathering of reliable information at grassroots level on the chosen socio-economic indicators in a data-poor and difficult desert terrain poses a serious problem. Compared to this, the bio-physical indicators of drought are more or less standardized (Smakhtin, 2004; Wilhite, 2005; Anon., 2009; Vittal et al., 2010).
Despite the above, broadly the less prosperous a household or a community is, the fewer the options are for it to respond to drought. Since food, fodder, water and livelihoods are the major casualties of drought, vulnerability can be assessed in terms of factors/indicators that measure the exposure to the above four insecurities. Rathore (2005) conducted a drought vulnerability assessment in four agro-climatic zones of Rajasthan, using caste, income and farm-size categories, and found qualitatively that both the low-income and the middle-income households were more vulnerable to drought. Babatunde (2008) found in a study in Nigeria that the female-headed households were more vulnerable to food insecurity than the male-headed households. A survey of the farming communities in western Rajasthan during the Century-scale drought of 2002 revealed that the small and the middle farmers were the most affected, and adopted different strategies to evade its impacts (Narain and Kar, 2005). A growing gap between the practice of indigenous technologies and the functioning of modern methods is also increasing the vulnerability of people to drought, although enough quantitative information is lacking. Jodha (2008) found that with emerging socio-economic transformations the gradual discontinuation of the traditional practices of conservation and sustainable use of common property resources like common pastures or local ponds (with maintained catchments), caused degradation to those resources and made them defunct, thereby making the household/community more vulnerable. The present study was undertaken to find out if it is possible to determine some appropriate socio-economic indicators of drought vulnerability that could be measured at grassroots level.
Study Area
The study was carried out in ten villages of Jodhpur district (Khatawas, Khatarda and Bewta
in Luni tehsil, Kelwa Khurd, Malunga, Basni Bhatiyani and Santora Khurd in Osian tehsil and Neemwa-Ka-Gaon, Duggar and Bhangarh in Shergarh tehsil), where the average annual rainfall varies from 229 mm to 314 mm, more than 90% of which comes during the summer monsoon. The villages are characterized by a sandy terrain with low sandy hummocks or sand dunes, limited groundwater availability, low crop production, and few employment opportunities (Table 1).
MethodologyData were collected through a specially
designed interview schedule, and following participatory rural appraisal. For primary data, a total of 153 heads of households were selected randomly, representing the various land holding classes as well as different castes and communities. Both qualitative and quantitative data were collected in respect of socio-economic and demographic characteristics of the sample households, land uses, cropping patterns, livestock, etc. For secondary data, the available revenue records of the villages were consulted from various sources, including the village Patwari record, the Tehsil record and the Census Handbooks.
ResultsSocio-economic attributes
Analysis of demographic data of the sample villages belied the traditional notion of a typical pyramidal structure of rural population, having a wide base and a tapering summit. Instead, the structure is evolving into a barrel shape with a short base that gradually expands up till the
District Tehsil Name of village Household covered
Jodhpur Luni Khatawas 15Katarda 12Bewta 15
Jodhpur Osian Kelwa khurd 19Maloonga 21Basni Bhatiyani 14Santora khurd 12
Jodhpur Shergarh Neemwa-ka-gaon 14Duggar 16Bhangarh 15
Total 10 153
Table 1. Villages studied

3INDICATORS OF DROUGHT
15-19 year age group, and then almost equal percentages in the older groups, including at the 65-year-plus group. This implies not only a greater awareness of the need for population control but also the need for efficacy of health improvement program by the State. A large gap between the male and the female populations is a source of concern. Nearly 55% population in the sample villages was illiterate (71% among females). Among the ‘literates’, 23% studied up to the primary school level, and 15% up to the secondary level.
Working population constituted 34% of the total inhabitants. About 54% of the male population had some kind of occupation, agriculture and animal husbandry accounting for 33%, laborer 16%, and different services (e.g., private and public sector job, business, pension, etc.) the rest. Among the females, only 7% were in agriculture, and 3% in animal husbandry and labor, but 57% had household jobs to do. Overall, agriculture and animal husbandry engaged 64% of the total workers, labor 27%, and services 8%. The Mahatma Gandhi National Rural Employment Guarantee Act (MGNREGA) is now a major source of labor income.
The average size of land holding by the sample households was 4.41 ha, while the operational holding was 3.98 ha. Only 8% of the sample households did not possess any agricultural land. Irrigated land was mostly owned by large farmers, while the disadvantageous (scheduled caste, scheduled tribe and marginal and small farmers) groups of people owned meager irrigated land (0.43% of total irrigated land).
A satisfactory matching was noticed between the net sown area during kharif season and monsoon rainfall, confirming that agriculture is almost totally dependent on the monsoon alone (Fig. 1). Because of the sandy undulating terrain, a dominantly coarse sandy soil, and a dry environment with deep groundwater, the productivity of all the major kharif crops like pearl millet, clusterbean, sesame and pulses like mung bean was poor. Land owned by the marginal farmers and those by the scheduled tribes (who mostly owned the poor quality lands) registered poorer productivity of crops.
There has been a fast change in livestock composition whereby buffalo population has increased by 135% between 2003 and 2007 census, despite the overall water and fodder scarcity in the region (Fig. 2). Buffaloes are getting importance because they provide higher returns as compared to the cattle. Also, unlike the cattle, there is no social taboo in selling the unproductive
Fig. 1. Summer monsoon rainfall and area under cultivation (2001-2008).
0
100
200
300
400
500
2001 2002 2003 2004 2005 2006 2007 2008Year
Rai
nfal
l (m
m)
0
500
1000
1500
2000
2500
3000
Area
(ha)
Monsoon Rainfall Cultivated area
Fig. 2. Per cent change in livestock population (2003-2007).

4 SAHA et al.
he-buffaloes for slaughter house. Livestock has always provided security to the inhabitants because even under worst drought conditions people can sell some livestock products, including milk, or if need be, even live animals.
Sheep and goats together constituted 85% of the total livestock population (2040 in the sample households). Livestock numbers generally decline by 20-40% during the moderate to severe droughts, especially because of the non-availability of water and feed resources, but also due to heat-stress-related diseases. Many gynoecological disorders (e.g., anestrous, repeat breeding and metritis), as well as tympani, diarrhoea and other stomach ailments, have been reported under prolonged heat stress, and malnourishment due to lack of water and fodder.
Sources of Income as Per Land Holdings
Of the various sources of livelihood agriculture, including animal husbandry, contributed more than half of the total income of the sample respondents (Table 2). Livestock becomes a major source of income in the region during droughts, especially as milk to the nearby urban centers and
as live-weight of the small ruminants for meat. Broadly, household income was found to increase with the land holding size. Respondents with medium to large holdings earned more than the others, and derived their major share of income from agriculture, including livestock. Among the other sources, labor activities provided employment to almost half of the sample respondents, including the recently-introduced MGNREGA. This program is becoming a major source of livelihood support, providing at least 100 man-days’ employment to a member of each family for works related to rural reconstruction, irrespective of the socio-economic status of the villagers.
The average monthly household income of landless farmers, who constituted 8% of the total households, was a meager Rs. 2751, which was primarily derived from labor activities in the farm lands, both within and outside the village, road construction, stone quarries and MGNREGA. Although MGNREGA contributed 3% of the total income of a poor respondent in these initial years of introduction, it was considered by the respondents as a highly stable income, and hence was popular.
Table 2. Income (Rs.) and land holding (ha) classes in the studied villages
Land holding (ha) category
Income (Rs.)
Agriculture Animal husbandry
Others (including
labor)
Pension MGNREGA activities
Total Average monthly household
income Landless - 30000
(8.0)* (3.0)#
358210 (90.0)* (10.0)#
- 8000 (2.0)* (4.0)#
396210 (5.03)#
2751
Marginal (<1)
22 8000 (27.0)* (7.0)#
62500 (7.0)* (5.0)#
498590 (58.0)* (14.0)#
43,200 (5.0)*
(100.0)#
27000 (3.0)*
(15.0)#
859290 (10.91)#
3113
Small (1-2)
366000 (34.0)* (12.0)#
1128801 (11.0)* (10.0)#
544000 (50.0)* (16.0)#
- 52000 (5.0)*
(29.0)#
1074880 (13.65)#
2889
Semi-medium (2-4)
658000 (34.0)* (22.0)#
339920 (18.0)* (28.0)#
868,095 (45.0)* (25.0)#
- 55000 (3.0)*
(31.0)#
1921015 (24.40)#
4326
Medium (4-10)
1223000 (45.0)* (41.0)#
531840 (20.0)* (44.0)
907470 (34.0)* (26.0)#
- 29000 (1.0)*
(16.0)#
2691310 (34.19)#
5750
Large (>10)
504300 (54.0)* (17.0)#
122000 (13.0)* (10.0)#
292700 (32.0)* (9.0)#
- 9000 (1.0)* (5.0)#
928000 (11.82)#
7030
Total 2979300 (38.0)*
(100.0)#
1199140 (15.0)*
(100.0)#
3469065 (44.0)*
(100.0)#
43200 (0.54)*
(100.0)#
180000 (2.46)*
(100.0)#
7870705 (100.0)#
4286
* Figures in parentheses indicate percentage within land holding groups.# Figures in parentheses indicate percentage amongst land holding groups.

5INDICATORS OF DROUGHT
Sources of Income for Different Castes/Communities
The average annual income of a scheduled tribe household was as low as Rs. 2383, about 65% of which was from labor activities. A scheduled caste household had an average annual income of Rs. 3138 (Table 3). Although MGNREGA provided 3-9% of the total income, 48% share of MGNREGA’s income went to scheduled caste population. The annual household income of general and other backward class (OBC), who earned their livelihood mostly from agriculture and animal husbandry, was Rs. 4838-4965. This was more than double the average income of a scheduled tribe.
Components of Vulnerability and Drought Coping Mechanism
The desert region has developed several adjustment mechanisms like mixed cropping, agro-forestry, increasing the herd size, changing
the livestock composition, livestock migration, access to secondary occupations, etc., for human survival during droughts of different intensities.
Components of vulnerability to drought were examined with respect to access to nutritious food, extent of indebtedness, access to fodder, availability of meal, access to urban health care, etc. Access to nutritious food was measured in terms of consumption of milk, butter milk (ghee) and vegetables by the households of different economic status (land holding) and caste groups. It revealed that the consumption pattern depended largely on the economic status of a household. Economically disadvantageous households could not afford to have nutritious diet regularly. During drought years the intake of nutritious food declined among all the land holding groups irrespective of economic status (Table 4).
Among the caste groups, the per capita intake of nutritious food was higher among the households
Caste/ Community
Source of incomeAgriculture Animal
husbandryOthers
(including labor)Pension MGNREGA
activitiesTotal Average monthly
household income
General 1231000 (49.0)* (41.0)#
418000 (17.0)* (35.0)#
772200 (31.0)* (22.0)#
36000 (1.0)*
(83.0)#
45500 (2.0)*
(24.0)#
2502700 (32.0)#
4965
OBC 1248300 (34.0)* (42.0)#
641640 (16.73)* (53.0)#
1778185 (48.0)* (51.0)#
7200 (0.19)* (17.0)#
40500 (1.08)* (22.0)#
3715825 (47.0)#
4838
Scheduled Caste
390500 (30.0)* (13.0)#
127500 (10.0)* (11.0)#
677430 (53.0)* (20.0)#
- 85000 (7.0)*
(48.0)#
1280430 (16.0)#
3138
Scheduled Tribe
109500 (29.0)* (4.0)#
12000 (3.0)* (1.0)#
241250 (65.0)* (7.0)#
- 9000 (3.0)* (6.0)#
371750 (5.0)#
2383
Total 2979300 (38.0)*
(100.0)#
1199140 (15.0)*
(100.0)#
3469065 (44.0)*
(100.0)#
43200 (0.54)*
(100.0)#
180000 (2.46)*
(100.0)#
7870705 (100.0)#
4286
* Figures in parenthesis indicate percentage within caste groups.# Figures in parenthesis indicate percentage amongst caste groups.
Table 3. Income (Rs.) of different caste/community in the studied villages
Land holding category Milk Butter milk (Ghee) VegetablesN D N D N D
Land less 3.68 1.92 - - 1.13 0.63Marginal 5.57 3.04 0.38 0.17 1.60 1.04Small 7.02 4.20 0.42 0.22 1.67 0.90Semi-medium 7.37 4.56 0.42 0.24 1.70 0.94Medium 9.85 5.52 0.62 0.35 2.07 1.09Large 13.90 8.26 0.78 0.43 2.35 1.25N: Normal year; D: Drought year.
Table 4. Food items consumed according to land holding (average per capita intake in kg month-1)

6 SAHA et al.
belonging to higher categories, as compared to the lower categories, both during normal and drought years, although the difference was not very high (Table 5). The tribal population, on the other hand, had poor access to nutritious food. A more prominent difference was noticed when the food intake was quantified as per gender. Women in the age group of 15 and above consumed less than the men. The skipping of meals during drought was comparatively more prevalent among the marginalized groups of population.
The sample farm households purchased fodder irrespective of their land holding categories. The emphasis was mostly on dry fodder and feed concentrates, both during normal years and drought years, because the permanent pastures (also called the common property resources, CPRs) are in a highly degraded state, and can hardly support the grazing animals (Table 6).
Indebtedness is generally considered to be a criterion for vulnerability measurement. In our sample villages almost all the households took financial loans (Tables 7 and 8), irrespective of their land holdings, caste composition, etc. Both institutional (cooperative societies, banks) and non-institutional (relatives, neighbors, moneylenders) credits fulfill the needs of the farming communities. The amount borrowed
during normal rainfall years averaged 25% of the expenses, while that during drought years was 75%. The extent of indebtedness was also found to be more pronounced during the drought years (68%). The causes of borrowing from institutional and non-institutional agencies during normal and drought years are shown in Fig. 3. The loan taken from non-institutional agencies was mainly utilized for socio-religious purposes. For non-institutional credit, money was repaid at the time of good harvest or by rendering physical labor. Institutional loan was repaid as per the terms and conditions laid down by the agencies.
Another criterion of drought vulnerability, the incidence of diseases like fever, respiratory problems, water-borne diseases, pneumonia, etc., was found to be common during the normal and the drought years, irrespective of the socio-economic conditions of the farm households, but high fever and water-borne diseases were recorded more during the drought years. The patients had easy access to health centers in the vicinity for treatment, irrespective of their socio-economic status. Access to the urban health care centers, however, depended more on economic condition of the farmers.
Wage earning from nearby stone quarries and other labor activities were the major coping
Caste Milk Butter milk (Ghee) VegetablesN D N D N D
General 9.0 5.2 0.66 0.35 2.24 1.16OBC 7.90 5.03 0.42 0.20 1.73 0.9SC 6.66 4.18 0.35 0.19 1.72 1.07ST 6.04 3.41 - - 1.47 0.8N: Normal year; D: Drought year.
Table 5. Food items consumed according to caste/community (average per capita intake in kg month-1)
Fig. 3. Debt preferences by villagers in the study area.

7INDICATORS OF DROUGHT
strategies in sample villages. The marginal, small and landless farmers opted more for the daily wage earnings from mines within a distance of 30-40 km. Migration to Gujarat for working in cotton mills to earn Rs. 4000 to 5000 per month was earlier one of the most preferred adjustment mechanisms in the sample villages.
After the introduction of MGNREGA villagers hope to earn at least Rs. 10000 during a year through labor in the vicinity of their villages. This has made this programme the most popular source of rural employment. The vulnerable groups of population now expect to have adequate cash flow and easy access to food and other important items during a drought. Villagers opined that due to the assured livelihood support from MGNREGA, the land owners would henceforth face labor shortage during field operations unless they provide competitive labor wage rate. Since MGNREGA aims at not only as a guarantee of wage earning to the villagers, but also strengthening of the natural resources endowment in rural India, it qualifies as a measure of drought proofing.
Among the different caste groups the average monthly income of the scheduled tribes in the sample villages was the lowest (Rs. 2383), followed by the scheduled castes (Rs. 3138). The average monthly income of the landless, marginal and small farmers was less than Rs. 3200. The later two categories also hold an average land size of 1.32 ha (against the average of 6.74 ha in western Rajasthan during 2000-01), with poor soil quality and inferior crop productivity.
Impact of Drought on Household Income
During drought years the income of rural people in arid areas generally reduces phenomenally, as majority of them depend on agriculture and allied activities. Narain and Kar (2005) reported that during the worst drought of 2002 the total income of sample farm families
in most of the districts in western Rajasthan fell generally by 12-46% from that in 2001. In Barmer district in the west of the desert the reduction in annual income of the sample farmers was by 46%, while in Churu district in the east of the desert it was by 39% and in Ganganagar district in the northwest by 12%. Income from agriculture (i.e., from croplands) was reduced the most, and varied with the average rainfall gradient from east to west. Thus, the income from agriculture in Barmer district was reduced by 79% from that in 2001, while in Churu district it was reduced by 42%, and in Hanumangarh district in the northeast by 13%. The reduction was more in case of the small, medium and marginal farmers. The large farmers managed to get some yield through better management practices.
In contrast to the croplands income, the contribution of income from livestock to a farmer’s annual income showed an increase during 2002, especially in the hands of the small and medium farmers (having mostly the small ruminants). In Barmer district 64% of the income from livestock sector during 2002 was received by the small farmers, while in Churu and Hanumangarh districts the maximum income from this sector was in the hands of the medium farmers (92% and 42%, respectively). By contrast, in all the three districts the income from livestock sector during normal year (2001) was in the hands of the large farmers (43% in Barmer district, 45% in Churu district, and 38% in Hanumangarh district). As Narain and Kar (2005) suggested, the pattern reflected relative stability of the farmers’ economy in different categories. Large farmers could keep the livestock during drought because of their higher capitals in hand, but the middle and small farmers could not, and hence, had to resort to distress sale (both the live animals and the milk). Despite the distress sale of livestock, however, the overall income from animal sector in the hands of the sample farmers declined during 2002 in the largely rainfed districts of Barmer (by 51%) and Churu (by 37%), while
Land holding category
Fodder availability Fodder purchaseNormal year Drought year Normal year Drought year
Landless - - - -Marginal 5200 2400 50 570Small 18100 8500 950 5370Semi-medium 38400 21950 2100 6750Medium 39200 7800 650 2240Large 8600 - 3000 1200
Table 6. Fodder available to sample land holders and market purchase (kg)
8 SAHA et al.
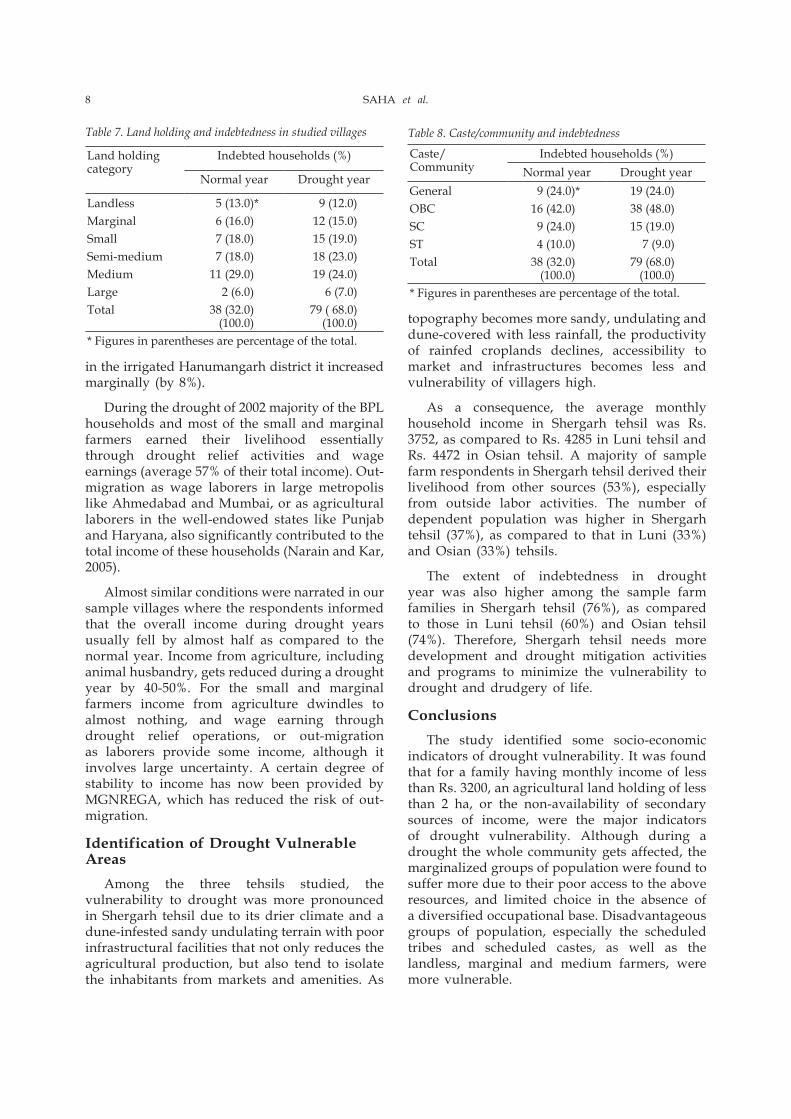
in the irrigated Hanumangarh district it increased marginally (by 8%).
During the drought of 2002 majority of the BPL households and most of the small and marginal farmers earned their livelihood essentially through drought relief activities and wage earnings (average 57% of their total income). Out-migration as wage laborers in large metropolis like Ahmedabad and Mumbai, or as agricultural laborers in the well-endowed states like Punjab and Haryana, also significantly contributed to the total income of these households (Narain and Kar, 2005).
Almost similar conditions were narrated in our sample villages where the respondents informed that the overall income during drought years usually fell by almost half as compared to the normal year. Income from agriculture, including animal husbandry, gets reduced during a drought year by 40-50%. For the small and marginal farmers income from agriculture dwindles to almost nothing, and wage earning through drought relief operations, or out-migration as laborers provide some income, although it involves large uncertainty. A certain degree of stability to income has now been provided by MGNREGA, which has reduced the risk of out-migration.
Identification of Drought Vulnerable Areas
Among the three tehsils studied, the vulnerability to drought was more pronounced in Shergarh tehsil due to its drier climate and a dune-infested sandy undulating terrain with poor infrastructural facilities that not only reduces the agricultural production, but also tend to isolate the inhabitants from markets and amenities. As
topography becomes more sandy, undulating and dune-covered with less rainfall, the productivity of rainfed croplands declines, accessibility to market and infrastructures becomes less and vulnerability of villagers high.
As a consequence, the average monthly household income in Shergarh tehsil was Rs. 3752, as compared to Rs. 4285 in Luni tehsil and Rs. 4472 in Osian tehsil. A majority of sample farm respondents in Shergarh tehsil derived their livelihood from other sources (53%), especially from outside labor activities. The number of dependent population was higher in Shergarh tehsil (37%), as compared to that in Luni (33%) and Osian (33%) tehsils.
The extent of indebtedness in drought year was also higher among the sample farm families in Shergarh tehsil (76%), as compared to those in Luni tehsil (60%) and Osian tehsil (74%). Therefore, Shergarh tehsil needs more development and drought mitigation activities and programs to minimize the vulnerability to drought and drudgery of life.
ConclusionsThe study identified some socio-economic
indicators of drought vulnerability. It was found that for a family having monthly income of less than Rs. 3200, an agricultural land holding of less than 2 ha, or the non-availability of secondary sources of income, were the major indicators of drought vulnerability. Although during a drought the whole community gets affected, the marginalized groups of population were found to suffer more due to their poor access to the above resources, and limited choice in the absence of a diversified occupational base. Disadvantageous groups of population, especially the scheduled tribes and scheduled castes, as well as the landless, marginal and medium farmers, were more vulnerable.
Land holding category
Indebted households (%)
Normal year Drought year
Landless 5 (13.0)* 9 (12.0)Marginal 6 (16.0) 12 (15.0)Small 7 (18.0) 15 (19.0)Semi-medium 7 (18.0) 18 (23.0)Medium 11 (29.0) 19 (24.0)Large 2 (6.0) 6 (7.0)Total 38 (32.0)
(100.0)79 ( 68.0)
(100.0)* Figures in parentheses are percentage of the total.
Table 7. Land holding and indebtedness in studied villages
Caste/Community
Indebted households (%)Normal year Drought year
General 9 (24.0)* 19 (24.0)OBC 16 (42.0) 38 (48.0)SC 9 (24.0) 15 (19.0)ST 4 (10.0) 7 (9.0)Total 38 (32.0)
(100.0)79 (68.0)
(100.0)* Figures in parentheses are percentage of the total.
Table 8. Caste/community and indebtedness

9INDICATORS OF DROUGHT
MGNREGA has gradually become one of the major sources of secondary occupation during the recent years, and it can be considered as a socio-economic criterion of drought-proofing. Other secondary employment opportunities, e.g., through small-scale handicrafts like basket making, raw woolen thread making and petty repairing, with proper market linkages, can also become a source of drought proofing, especially for the marginalized groups.
Financial borrowing is a ubiquitous feature in the region, irrespective of drought, and across all socio-economic groups. The loans are generally paid back in time through cash and/or kind soon after the improvement in household situations. Both institutional and non-institutional credits were found to play important roles in mitigating the impacts of drought. In most cases the loans are taken for spending on activities related more to crop cultivation, than to livestock rearing. Difficulties in access to the loans, especially during the droughts, make a family more vulnerable. Therefore, simplification of the processes of getting institutional loan will help the inhabitants in withstanding the impact of drought.
ReferencesAnonymous 2009. Manual for Drought Management.
Department of Agriculture and Cooperation, Ministry of Agriculture, Govt. of India, New Delhi, 192 p.
Babatunde, R.O., Omotesho, O.A., Olorunsanya, E.O. and Owotcki, G.M. 2008. Determinants of vulnerability to food insecurity: A gender-based analysis of farming households in Nigeria. Indian Journal of Agricultural Economics 63(1): 116-125.
Dai, A. 2011. Drought under global warming. Wiley Interdisciplinary Reviews: Climate Change 2(1): 45-65.
Downing, T.E., Aerts, J., Soussan, J., Barthemy, O., Bharwani, S., Hinkel, J., Ionescu, C., Klein, R.J.T., Mata, L.J., Matin, N., Moss, S., Purkey, D. and Ziervogel, G. 2005. Integrating Social
Vulnerability into Water Management. SEI Working Paper and Newater Working Paper No. 4. Stockholm Environment Institute, Oxford, 32 p.
Dwyer, A., Zoppou, C., Nielsen, O., Day, S. and Roberts, S. 2004. Quantifying Social Vulnerability: A Methodology for Identifying those at Risk to Natural Hazards. Geoscience Australia Record 2004/14, 92 p.
Jodha, N.S. 2008. Contemporary socio-economic scenario in the Indian arid region. In Diversification of Arid Farming Systems (Eds. Pratap Narain, M.P. Singh, Amal Kar, S. Kathju and Praveen Kumar). pp. 411-429. AZRAI, Jodhpur and Scientific Publishers (India), Jodhpur.
Kachchhawaha, O.P. 1985. Famines in Rajasthan. Hindi Sahitya Mandir, Jodhpur, 348 p.
Narain, P. and Kar, A. 2005. Drought in Western Rajasthan: Impact, Coping Mechanism and Management Strategies. Central Arid Zone Research Institute, Jodhpur, 104 p.
Rathore, M.S. 2005. State Level Analysis of Drought Policies and Impacts in Rajasthan, India. Working Paper 93, International Water Management Institute (IWMI), Colombo, 29 p.
Smakhtin, V.U. and Hughes, D.A. 2004. Review of Automated Estimation and Analysis of Drought Indices in South Asia. Working Paper 83, International Water Management Institute (IWMI), Colombo, 24 p.
Vittal, K.P.R., Kar, A. and Rao, A.S. 2010. Indicators for assessing drought hazard in arid regions of India. In Natural and Anthropogenic Disasters: Vulnerability, Preparedness and Mitigation (Ed. Madan Kumar Jha), pp. 237-255. Capital Publishing Co., New Delhi.
Wehbe, M.B., Seiler, R., Vincur, M.R., Eakin, H., Santos, C. and Civitaresi, H.M. 2005. Social Methods for Assessing Agricultural Producers’ Vulnerability to Climate Variability and Change based on the Notion of Sustainability. AIACC Working Paper No. 19, AIACC, UNEP, 20 p.
Wilhite, D.A. (Ed.). 2005. Drought and Water Crises: Science, Technology and Management Issues. CRC Press, Boca Raton, 406 p.
Printed in April 2013