characterizing drought using the reliability-resilience-vulnerability...
TRANSCRIPT
Characterizing Drought Using theReliability-Resilience-Vulnerability Concept
Rajib Maity1; Ashish Sharma2; D. Nagesh Kumar, M.ASCE3; and Kironmala Chanda4
Abstract: This study borrows the measures developed for the operation of water resources systems as a means of characterizing droughts in agiven region. It is argued that the common approach of assessing drought using a univariate measure (severity or reliability) is inadequate asdecision makers need assessment of the other facets considered here. It is proposed that the joint distribution of reliability, resilience, andvulnerability (referred to as RRV in a reservoir operation context), assessed using soil moisture data over the study region, be used to char-acterize droughts. Use is made of copulas to quantify the joint distribution between these variables. As reliability and resilience vary in anonlinear but almost deterministic way, the joint probability distribution of only resilience and vulnerability is modeled. Recognizing thenegative association between the two variables, a Plackett copula is used to formulate the joint distribution. The developed drought index,referred to as the drought management index (DMI), is able to differentiate the drought proneness of a given area when compared to otherareas. An assessment of the sensitivity of the DMI to the length of the data segments used in evaluation indicates relative stability is achievedif the data segments are 5 years or longer. The proposed approach is illustrated with reference to the Malaprabha River basin in India, usingfour adjoining Climate Prediction Center grid cells of soil moisture data that cover an area of approximately 12,000 km2. DOI: 10.1061/(ASCE)HE.1943-5584.0000639. © 2013 American Society of Civil Engineers.
CE Database subject headings: Droughts; Water resources; Decision making.
Author keywords: Drought; Reliability; Resilience; Vulnerability; Copula; Malaprabha basin.
Introduction
Drought is recognized as a prolonged below-normal supply ofwater. Due to its inherent complexity, variable spatial and temporalextent, and impact, a universally accepted definition of droughtsis not possible (Heim 2002). The American MeteorologicalSociety (1997) has classified droughts into four categories:meteorological, agricultural, hydrological, and socioeconomic.Meteorological drought is related to below-normal precipitation,agricultural drought is related to the shortfall of soil moisture,hydrological drought is related to the inadequacy of water resourcesto meet demands, and socioeconomic drought is based on ensuingeconomic consequences for the region. Considerable attention hasbeen focused on quantifying drought through a series of derivedattributes and is the focus of the research presented here.
In general, drought is quantified using indices that are derivedfrom incident precipitation and evapotranspiration for the region.These hydrologic variables influence the soil moisture status,which is a primary input for agricultural droughts. Onset of agri-cultural droughts is indicated if the soil moisture falls below a
predefined threshold value, such as the permanent wilting point.Since the early twentieth century, several indices have been devel-oped to characterize droughts (see Keyantash and Dracup 2002;Heim 2002; Mishra and Singh 2010, 2011; Dai 2011). A brief re-view is presented here with an emphasis on agricultural droughts,which is the main focus of this paper.
An approximate chronological development of meteorologicaldrought indices includes Munger’s index (Munger 1916), the pre-cipitation effectiveness index (Thornthwaite 1931), Blumenstock’sindex (Blumenstock 1942), the antecedent precipitation index(API) (McQuigg 1954; Waggoner and O’Connell 1956), thePalmer drought severity index (PDSI) (Palmer 1965), the rainfallanomaly index (RAI) (van Rooy 1965), the drought area index(Bhalme and Mooley 1980), the standardized precipitation index(SPI) (McKee et al. 1993) and effective precipitation (Byun andWilhite 1999). Thornthwaite (1948) also used precipitation minusevapotranspiration as a drought index. In API, both the amount andtiming of precipitation are incorporated, and although it was origi-nally designed to estimate soil moisture content for use in floodforecasting, more recent use has been to assess its impact on designfloods (Pui et al. 2011). This index is computed on a daily basis andthus can be a measure of short-term drought. The PDSI, along withthe Palmer hydrological drought index (PHDI) and the Palmermoisture anomaly index (PMAI) (aka Z Index) (Palmer 1965),can be treated as the first breakthrough in the development ofdrought indices. Even though the PDSI is perhaps the most promi-nent meteorological index used (Heim 2002), several criticismsand limitations have been noted in the literature (Alley 1984).Keyantash and Dracup (2002) showed that the PDSI is more ofa hydrological index, and the time scale of drought addressedby the PDSI is unclear. More recent assessments of drought haveutilized SPI as a probabilistic means of characterizing rainfallanomalies (Keyantash and Dracup 2002).
1Dept. of Civil Engineering, Indian Institute of Technology, Kharagpur721302, India (corresponding author). E-mail: [email protected]
2School of Civil and Environmental Engineering, Univ. of New SouthWales, Sydney, NSW 2052, Australia. E-mail: [email protected]
3Dept. of Civil Engineering, Indian Institute of Science, Bangalore560012, India. E-mail: [email protected]
4Dept. of Civil Engineering, Indian Institute of Technology, Kharagpur721302, India. E-mail: [email protected]
Note. This manuscript was submitted on January 12, 2012; approved onJuly 10, 2012; published online on August 6, 2012. Discussion period openuntil December 1, 2013; separate discussions must be submitted for indi-vidual papers. This paper is part of the Journal of Hydrologic Engineer-ing, Vol. 18, No. 7, July 1, 2013. © ASCE, ISSN 1084-0699/2013/7-859-869/$25.00.
JOURNAL OF HYDROLOGIC ENGINEERING © ASCE / JULY 2013 / 859
J. Hydrol. Eng. 2013.18:859-869.
Dow
nloa
ded
from
asc
elib
rary
.org
by
IND
IAN
IN
ST O
F SC
IEN
CE
- B
AN
GA
LO
RE
on
06/1
4/13
. Cop
yrig
ht A
SCE
. For
per
sona
l use
onl
y; a
ll ri
ghts
res
erve
d.
McGuire and Palmer (1957) developed the moisture adequacyindex (MAI) to measure agricultural drought. The MAI isexpressed as a percentage ratio of actual evapotranspiration andpotential evapotranspiration. The PMAI (aka Z Index), one ofthe three Palmer indices, is an intermediate term in the computationof PDSI (Keyantash and Dracup 2002). Palmer (1968) also devel-oped the Crop Moisture Index (CMI) to monitor the weekly changeof soil moisture condition. The value of this index changes veryrapidly, and the index is suitable only for very short-term droughtassessment. Bergman et al. (1988) developed another index knownas the Soil Moisture Anomaly Index (SMAI). The SMAI fluctuatesat a moderate rate as compared to the CMI (Bergman et al. 1988).The Vegetation Condition Index (VCI) (Kogan 1995, 1997; Liu andKogan 1996) allows drought detection by monitoring vegetationhealth. However, it is useful for summer seasons. During the coldseason, when vegetation is mostly in a dormant state, its utility islimited (Heim 2002; Mishra and Singh 2010). Among the differentexisting agricultural drought indices, the Computed Soil Moisture(CSM) (Huang et al. 1996) was identified as the most suitable oneby Keyantash and Dracup (2002) using predefined subjectiveweightage factors to different desirable aspects of a drought index.
Historical development of different indices for hydrologicaldroughts include the PHDI (Palmer 1965), the Total Water Deficit(TWD) (Dracup et al. 1980), the Surface Water Supply Index(SWSI) (Shafer and Dezman 1982), and the Cumulative Stream-flow Anomaly (CSA) (Keyantash and Dracup 2002). Detailed re-view of these indices is left out as our focus is on the agriculturaldrought indices. As a summary, an overall comparison betweendifferent indices by Keyantash and Dracup (2002) indicates thatthe suitability of agricultural drought indices (also hydrologicaldrought indices) is inferior with respect to that of meteorologicaldrought indices.
It can be further concluded from the overall review of differentdrought indices, that most of these drought-related indices indicatethe ongoing (current) status of the drought, as characterized using asingle metric. In this study, we attempt to quantify long-term char-acteristics of drought of a given area, which may change slowly (onsay a decadal time frame) owing to low-frequency variability andchange in the climate. In this context, a new index is proposed,which seeks to quantify the long-term drought characteristics ofa given area, providing catchment managers with a tool thatassesses the frequency (reliability), vulnerability, and ability torecover (resilience) from a drought. The reliability, resilience,and vulnerability concept was used earlier in the context of waterresources management. In this study, these measures are used in thecontext of drought; thus, the name of the index is proposed as thedrought management index (DMI). The proposed index rangesfrom 0 to 1, with higher values indicating higher drought pronenessof the area and vice versa.
Traditionally, most drought-related indices are based on one ortwo attributes of the hydrologic time series used in their formu-lation (i.e., time series of soil moisture in case of agriculturaldrought, time series of precipitation in case of meteorologicaldrought, and time series of streamflow/reservoir storage in caseof hydrological drought). And, in most of the cases, these particularattributes fall below a predefined threshold during drought events,which can be analogous to failure of the system. However, a systemfailure should be simultaneously characterized by its reliability,resilience, and vulnerability, as is done in the context of watersupply management with single or multiple reservoir systems.The joint behavior of these parameters should be considered whilecharacterizing the failure (drought). Whereas the reliability andresilience behave in a similar way (Hashimoto et al. 1982), the
interrelationship between resilience and vulnerability or reliabilityand vulnerability should be jointly used to characterize the drought.
The theory of copula is used to obtain the joint distribution be-tween resilience and vulnerability. In the recent past, copulas havebeen used for various hydrological analyses (De Michele andSalvadori 2003; Favre et al. 2004; De Michele et al. 2005; Grimaldiand Serinaldi 2006a, b; Zhang and Singh 2006, 2007; Renardand Lang 2007; Gebremichael and Krajewski 2007; Kao andGovindaraju 2007a, b; Maity and Nagesh Kumar 2008; Villariniet al. 2008; Zakaria et al. 2010; Vandenberghe et al. 2010). Appli-cation of multivariate joint distribution between drought variableshas gained popularity in the recent past (Bonaccorso et al. 2003;Nadarajah 2009; Mishra et al. 2009; Vangelis et al. 2011). For in-stance, Vangelis et al. (2011) used bivariate probability analysis toassess the severity of drought episodes assuming normal distribu-tion of precipitation and potential evapotranspiration. Probabilisticanalyses of drought duration, intensity, and return period also havebeen undertaken by many other researchers (Fernandez and Salas1999; Chung and Salas 2000; Cancelliere and Salas 2004;Nadarajah 2009), mostly using the time series of precipitation orstreamflow as the key variable. With improved understanding ofthe impacts of oceanic phenomena on drought characteristics,hydrologists have also studied the variation and characteristics ofhydrological droughts in relation to El Niño-Southern Oscillation(ENSO) events (Ryu et al. 2010; Wong et al. 2010). Meteorologicaland hydrological droughts are in turn linked to agriculturaldroughts. Even though the vulnerability of a region to agriculturaldroughts has been studied (Wilhelmi and Wilhite 2002), a compre-hensive analysis quantifying the risk of system failure (droughtevent) is lacking. In this context, the new index, DMI, is proposedhere to measure the extent of agricultural drought risk over a catch-ment. Resilience and vulnerability of the soil moisture series arecomputed to obtain the new index. Previous research shows thatthe dependence of correlated stochastic variables involved indroughts can be modeled successfully through copulas (Shiau2006; Shiau et al. 2007; Kao and Govindaraju 2008; Shiau andModarres 2009; Serinaldi et al. 2009; Song and Singh 2010a, b;Kao and Govindaraju 2010; Mikabari et al. 2010; AghaKouchaket al. 2010; Wong et al. 2010). For instance, Kao and Govindaraju(2008) demonstrated the suitability of Plackett copula (Plackett1965) for both positive and negative dependence while analyzingextreme rainfall events. Song and Singh (2010b) used meta-elliptical copulas to model the dependence of drought duration,severity, and interarrival time. Wong et al. (2010) studied droughtcharacteristics (intensity, duration, and severity) conditioned on dif-ferent ENSO states using Gumbel-Hougaard as well as t-copulas.Thus, copulas provide flexibility in terms of selecting suitablemarginals and dependence structure of variables. This makes cop-ula an attractive tool for modeling the joint distribution betweenreliability, resilience, and vulnerability, which is used in this study.The proposed method and computation of the DMI is illustrated inand around Malaprabha River basin considering four adjoiningCPC (Climate Prediction Center) grids of soil moisture data thatcovers an approximately 12,000 km2 area.
Methodology
The overall methodology can be broadly divided into three parts:(1) assessing reliability-resilience-vulnerability (RRV) for thehydrological time series, (2) fitting a suitable copula to obtainthe joint probability distribution between these measures, and(3) developing a copula-based DMI as a measure of long-termdrought characteristics over the region. These parts are elaborated
860 / JOURNAL OF HYDROLOGIC ENGINEERING © ASCE / JULY 2013
J. Hydrol. Eng. 2013.18:859-869.
Dow
nloa
ded
from
asc
elib
rary
.org
by
IND
IAN
IN
ST O
F SC
IEN
CE
- B
AN
GA
LO
RE
on
06/1
4/13
. Cop
yrig
ht A
SCE
. For
per
sona
l use
onl
y; a
ll ri
ghts
res
erve
d.
separately but in relation with each other in the followingsubsections.
Reliability-Resilience-Vulnerability of Soil MoistureTime Series
The concept of RRV was introduced by Hashimoto et al. (1982) inthe context of water resources systems. In this paper, the concept ofRRV is used in the context of agricultural drought through theanalysis of temporal variation of soil moisture. The failure or unsat-isfactory stage is considered as the depletion of soil moisture belowthe Permanent Wilting Point (PWP), which is an indicator of agri-cultural drought as mentioned earlier. The PWP is the minimumamount of soil moisture required for the plants not to wilt (Taizand Zeiger 1991). If the soil moisture falls below this limit, theplants can no longer come out of their drooping stage and eventu-ally die. PWP depends on the integrated effects of plant, soil andatmospheric conditions at a particular location. Let X1;X2; : : : ;Xnbe the time series of soil moisture having a data length n to assessthe RRV. If Xt ≥ PWP, it is considered a satisfactory stage, denotedas S and if Xt < PWP, it is considered an unsatisfactory stage,denoted as F.
Reliability
Reliability is defined by the probability that a system is in asatisfactory state (Hashimoto et al. 1982). In the context of soilmoisture, reliability may be defined as the probability that the soilmoisture is above a certain threshold (here PWP). Thus, thereliability α is stated as
α ¼ PðXt ∈ SÞ ð1Þwhere S = the satisfactory stage as stated before. From the timeseries, α can be computed as
α ¼ Ltn → ∞
1
n
Xnt¼1
Zt ð2Þ
where Zt ¼ 1 if Xt ∈ S and Zt ¼ 0 if Xt ∈ F.
Resilience
Resilience is a measure that indicates how quickly the system canreturn to a satisfactory stage after it has fallen below the satisfactorythreshold. This can be defined as the ratio of the probability oftransition from the unsatisfactory to the satisfactory stage andthe probability of failure, i.e.,
γ ¼ PðXt ∈ F;Xtþ1 ∈ SÞPðXt ∈ FÞ ð3Þ
where S and F are as defined earlier. The numerator, probabilityof transition from the unsatisfactory to the satisfactory stage isdenoted as ρ. In the long run, the number of times the systemtransforms from the satisfactory to the unsatisfactory stage andfrom the unsatisfactory to the satisfactory stage will be same.Thus, it can be eventually expressed as ρ ¼ PðXt ∈ F;Xtþ1 ∈ SÞ ¼PðXt ∈ S;Xtþ1 ∈ FÞ. From the time series, ρ can be computed as
ρ ¼ Ltn → ∞
1
n
Xnt¼1
Wt ð4Þ
where Wt = the event of transformation from the satisfactory tothe unsatisfactory stage (or vice versa) and Wt ¼ 1 if Xt ∈ Sand Xtþ1 ∈ F and Wt ¼ 0 otherwise. The denominator of
Eq. (3) can be expressed as PðXt ∈ FÞ ¼ 1 − PðXt ∈ SÞ. Again,PðXt ∈ SÞ is expressed as reliability α as explained before. Thus,Eq. (3) can be expressed as
γ ¼ ρ1 − α
ð5Þ
Vulnerability
Vulnerability is a measure of severity of a failure event, once it hasoccurred. It is defined as
ν ¼Xj∈F
sjej ð6Þ
where sj = the numerical indicator of severity for an observation xj,which belongs to the unsatisfactory state; ej = the probability ofthat xj, corresponding to sj, which is the most unsatisfactoryand severe outcome that occurs from the set of unsatisfactory states.In the context of soil moisture, vulnerability is a probabilityweighted average of the soil moisture deficits (with respect tothe PWP of the location) of failure events. Thus, the shortfall ofthe available soil moisture below the PWP is the severity indicator,and vulnerability is measured in terms of the mean soil moisturedeficit caused during the failure events, assuming that deficits ofdifferent magnitudes are equiprobable.
Interrelationships between Reliability-Resilience-Vulnerability and the Role of Copula
The interrelationship between reliability, resilience, and vulnerabil-ity needs to be considered while assessing drought characteristics.In order to do this, the theory of copulas is utilized. Many research-ers have successfully used copulas to perform multivariate hydro-logic analysis as reported earlier. Previous literature suggests thatnegative association between random variables can be effectivelycaptured by various copulas, which are explained in this section.
Joint Probability Distribution Using Copulas
A copula is a function that joins or couples together univariate mar-ginal distributions to form a multivariate joint distribution (Nelsen2006). Let us consider that X and Y are two continuous randomvariables with marginal Cumulative Distribution Functions (CDFs)FðxÞ and GðyÞ, respectively, and joint distribution functionHðx; yÞ. Sklar’s (1959) theorem states that, for a joint distributionfunction H with margins F and G, there exists a copula C for allðx; yÞ in the extended real line R̄ such that
Hðx; yÞ ¼ C½FðxÞ;GðyÞ� ð7ÞIf F and G are continuous, then C is unique; also C is unique on
the simultaneous range of F and G. In the context of RRVanalysis,X represents either reliability or resilience, Y represents vulnerabil-ity, and the objective is to develop their joint distribution.Recognizing the fact that these pairs possess negative association(shown later), Gaussian copula, Frank copula, and Plackett copulasare initially selected to compare their suitability to capture thejoint behavior between reliability-vulnerability and resilience-vulnerability. “Copula-Based Drought Management Index” pro-vides a brief mathematical background of these copulas.
Gaussian copula belongs to the class of elliptical copula, whichis able to take care of entire range of positive and negative asso-ciation between random variables. The bivariate Gaussian copula isdefined as
JOURNAL OF HYDROLOGIC ENGINEERING © ASCE / JULY 2013 / 861
J. Hydrol. Eng. 2013.18:859-869.
Dow
nloa
ded
from
asc
elib
rary
.org
by
IND
IAN
IN
ST O
F SC
IEN
CE
- B
AN
GA
LO
RE
on
06/1
4/13
. Cop
yrig
ht A
SCE
. For
per
sona
l use
onl
y; a
ll ri
ghts
res
erve
d.
CGðu; vÞ ¼Zφ−1ðuÞ
−∞
Zφ−1ðvÞ
−∞
1
2πð1 − ρ2Þ1=2 exp�− x2 − 2ρxyþ y2
2ð1 − ρ2Þ�dydx
ð8Þ
Dependence parameter of this copula ρ is related to theKendall’s tau, τ , by
τ ¼ 2
πsin−1ðρÞ ð9Þ
Among the popular Archimedean family of copulas, the Frankcopula (also a few others copulas) is able to capture the entire rangeof dependence. The Frank copula is defined as
CFðu; vÞ ¼ − 1
θFln
�1þ ðe−θFu − 1Þðe−θFv − 1Þ
ðe−θF − 1Þ�
ð10Þ
where θF = the dependence parameter, which is related to theKendall’s tau, τ , by
τ ¼ 1þ 4
θF½D1ðθFÞ − 1� ð11Þ
where D1 is the first-order Debye function, which is defined asD1ðθFÞ ¼ ∫ θF
0 ½t=ðet − 1Þ�dt for θF > 0 and D1ð−θFÞ ¼ D1ðθFÞ þð1=2Þ (Genest 1987; Zhang and Singh 2006).
Another copula, which is also able to capture both the positiveand the negative association between variates is known as Plackettcopula (Plackett 1965; Nelsen 2006). It is defined as
CPðu; vÞ ¼½1þ ðθp − 1Þðuþ vÞ� −
ffiffiffiffiffiffiffiffiffiffiffiffiffiffiffiffiffiffiffiffiffiffiffiffiffiffiffiffiffiffiffiffiffiffiffiffiffiffiffiffiffiffiffiffiffiffiffiffiffiffiffiffiffiffiffiffiffiffiffiffiffiffiffiffiffiffiffiffiffiffiffiffiffiffiffiffiffiffi½1þ ðθp − 1Þðuþ vÞ�2 − 4uvθpðθp − 1Þ
q2ðθp − 1Þ ð12Þ
where θp = the dependence parameter of this copula, which is thecross product ratio between the random variables. θp can beestimated by the pseudo likelihood function (Genest et al.1995). It can also be estimated directly from the observationsand sample medians (Mardia 1970). The sample medians dividethe observations into four quadrants: (1) where observations of boththe variables are greater than their respective median values,(2) where observations are less than the median for the firstmarginal and greater than the median for the second marginal,(3) where observations of both the variables are less than their re-spective median values, and (4) where observations are greater thanthe median for the first marginal and less than the median for thesecond marginal. If θ̂p is the cross product ratio estimated fromobservations, then it can be expressed as Eq. (13):
θ̂p ¼ n00n11n01n10
ð13Þ
where n11, n01, n00, and n10 are the number of observations in thefirst, second, third, and fourth quadrants, respectively. The possiblerange of θ̂p is between zero and infinity. A value less than one in-dicates a negative association, whereas the positive association isindicated by the values greater than or equal to one. For a detailedtheoretical derivation, readers may refer to Kao and Govindaraju(2008). Their findings showed that the theory of constant crossproduct ratio, on which the Plackett copula is based, is applicablefor both discrete and continuous random variables. In this study, abivariate Plackett copula model is also adopted due to its ability tocapture negative association between variates.
Copula-Based Drought Management Index
Based on the joint distribution between resilience and vulnerability,an index is to be developed that will convey the simultaneousinformation of resilience and vulnerability. It is clear from theprevious discussion that more favorable conditions can be indicatedwith the increase in resilience. Here, drought is identified as anunfavorable phenomenon. On the other hand, conditions are less
favorable with the increase in vulnerability. Thus, the proposedDMI should increase with the increase in vulnerability and withthe decrease in resilience and vice versa. This can be achievedby a joint measure of probability that indicates exceedence inresilience and nonexceedence in vulnerability. Thus, the DMI isdefined as
DMI ¼ PðR > r;V ≤ vÞ ð14Þwhere Pð · · · Þ = probability of the event ð · · · Þ, R = resilience, V =vulnerability, and r and v = the reduced resilience and reduced vul-nerability (see the appendix for further information), respectively,calculated from the observed soil moisture series using a suitablethreshold. As mentioned earlier, this threshold cannot be adoptedrandomly. The PWP is a suitable threshold based on the soil-cropcombination at a particular location. To obtain actual values of DMIfor a location, the PWP pertaining to that location must be used.
Assessment of DMI for Malaprabha River Basin
Study Area and Data Used
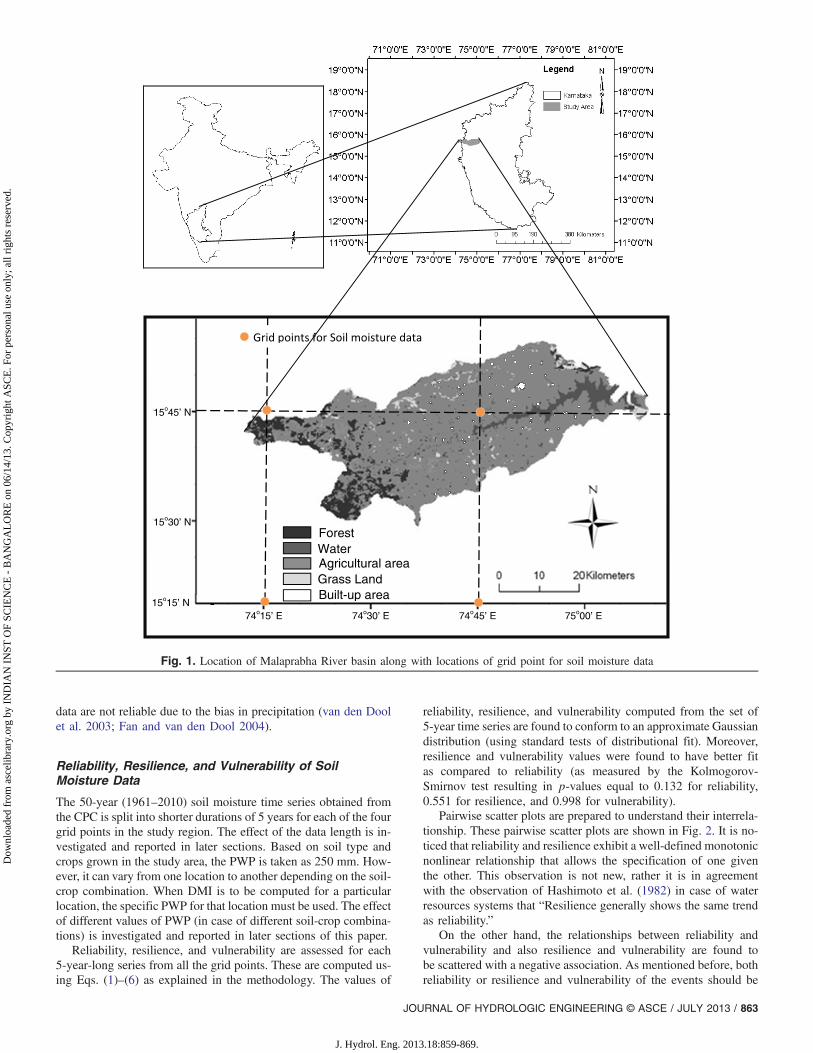
Soil moisture data from the CPC from 1961 to 2010 for four gridpoints in and around the Malaprabha River basin (up to the Mal-aprabha reservoir, Fig. 1) are used for this analysis. For the purposeof testing the newly proposed index, soil moisture series for fiveother locations (26°15 000 0 0 lat × 72°15 000 0 0 long, 22°15 000 0 0 lat×78°15 000 0 0 long, 30°15 000 0 0 lat × 76°15 000 0 0 long, 12°15 000 0 0 lat×75°45 000 0 0 long, 26°15 000 0 0 lat × 90°45 000 0 0 long), having widelydifferent climate regimes, have also been used. Monthly griddedsoil moisture data has been reconstructed by Fan and van den Dool(2004) with a spatial resolution of 0.5° × 0.5°. The monthly data setis averaged soil moisture equivalent to standing water height. CPCsoil moisture data (in millimeters) is provided by the NOAA/OAR/ESRL PSD, Boulder, Colorado, USA, from their website at http://www.esrl.noaa.gov/psd/. Readers may note that this is not reanal-ysis data, and it is argued that the soil moisture data from reanalysis
862 / JOURNAL OF HYDROLOGIC ENGINEERING © ASCE / JULY 2013
J. Hydrol. Eng. 2013.18:859-869.
Dow
nloa
ded
from
asc
elib
rary
.org
by
IND
IAN
IN
ST O
F SC
IEN
CE
- B
AN
GA
LO
RE
on
06/1
4/13
. Cop
yrig
ht A
SCE
. For
per
sona
l use
onl
y; a
ll ri
ghts
res
erve
d.
data are not reliable due to the bias in precipitation (van den Doolet al. 2003; Fan and van den Dool 2004).
Reliability, Resilience, and Vulnerability of SoilMoisture Data
The 50-year (1961–2010) soil moisture time series obtained fromthe CPC is split into shorter durations of 5 years for each of the fourgrid points in the study region. The effect of the data length is in-vestigated and reported in later sections. Based on soil type andcrops grown in the study area, the PWP is taken as 250 mm. How-ever, it can vary from one location to another depending on the soil-crop combination. When DMI is to be computed for a particularlocation, the specific PWP for that location must be used. The effectof different values of PWP (in case of different soil-crop combina-tions) is investigated and reported in later sections of this paper.
Reliability, resilience, and vulnerability are assessed for each5-year-long series from all the grid points. These are computed us-ing Eqs. (1)–(6) as explained in the methodology. The values of
reliability, resilience, and vulnerability computed from the set of5-year time series are found to conform to an approximate Gaussiandistribution (using standard tests of distributional fit). Moreover,resilience and vulnerability values were found to have better fitas compared to reliability (as measured by the Kolmogorov-Smirnov test resulting in p-values equal to 0.132 for reliability,0.551 for resilience, and 0.998 for vulnerability).
Pairwise scatter plots are prepared to understand their interrela-tionship. These pairwise scatter plots are shown in Fig. 2. It is no-ticed that reliability and resilience exhibit a well-defined monotonicnonlinear relationship that allows the specification of one giventhe other. This observation is not new, rather it is in agreementwith the observation of Hashimoto et al. (1982) in case of waterresources systems that “Resilience generally shows the same trendas reliability.”
On the other hand, the relationships between reliability andvulnerability and also resilience and vulnerability are found tobe scattered with a negative association. As mentioned before, bothreliability or resilience and vulnerability of the events should be
15o15’ N
Forest
Agricultural area Grass Land
Water
Built-up area
74o15’ E 74o30’ E 74o45’ E 75o00’ E
15o30’ N
15o45’ N
Fig. 1. Location of Malaprabha River basin along with locations of grid point for soil moisture data
JOURNAL OF HYDROLOGIC ENGINEERING © ASCE / JULY 2013 / 863
J. Hydrol. Eng. 2013.18:859-869.
Dow
nloa
ded
from
asc
elib
rary
.org
by
IND
IAN
IN
ST O
F SC
IEN
CE
- B
AN
GA
LO
RE
on
06/1
4/13
. Cop
yrig
ht A
SCE
. For
per
sona
l use
onl
y; a
ll ri
ghts
res
erve
d.
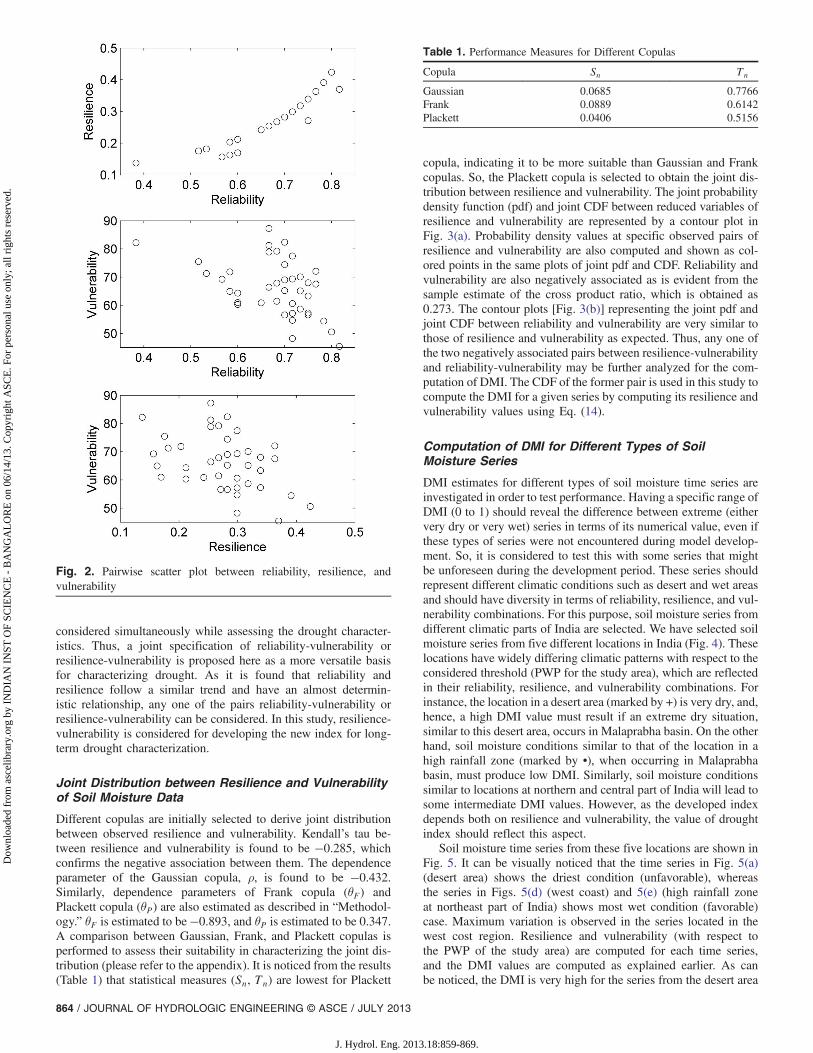
considered simultaneously while assessing the drought character-istics. Thus, a joint specification of reliability-vulnerability orresilience-vulnerability is proposed here as a more versatile basisfor characterizing drought. As it is found that reliability andresilience follow a similar trend and have an almost determin-istic relationship, any one of the pairs reliability-vulnerability orresilience-vulnerability can be considered. In this study, resilience-vulnerability is considered for developing the new index for long-term drought characterization.
Joint Distribution between Resilience and Vulnerabilityof Soil Moisture Data
Different copulas are initially selected to derive joint distributionbetween observed resilience and vulnerability. Kendall’s tau be-tween resilience and vulnerability is found to be −0.285, whichconfirms the negative association between them. The dependenceparameter of the Gaussian copula, ρ, is found to be −0.432.Similarly, dependence parameters of Frank copula (θF) andPlackett copula (θP) are also estimated as described in “Methodol-ogy.” θF is estimated to be −0.893, and θP is estimated to be 0.347.A comparison between Gaussian, Frank, and Plackett copulas isperformed to assess their suitability in characterizing the joint dis-tribution (please refer to the appendix). It is noticed from the results(Table 1) that statistical measures (Sn, Tn) are lowest for Plackett
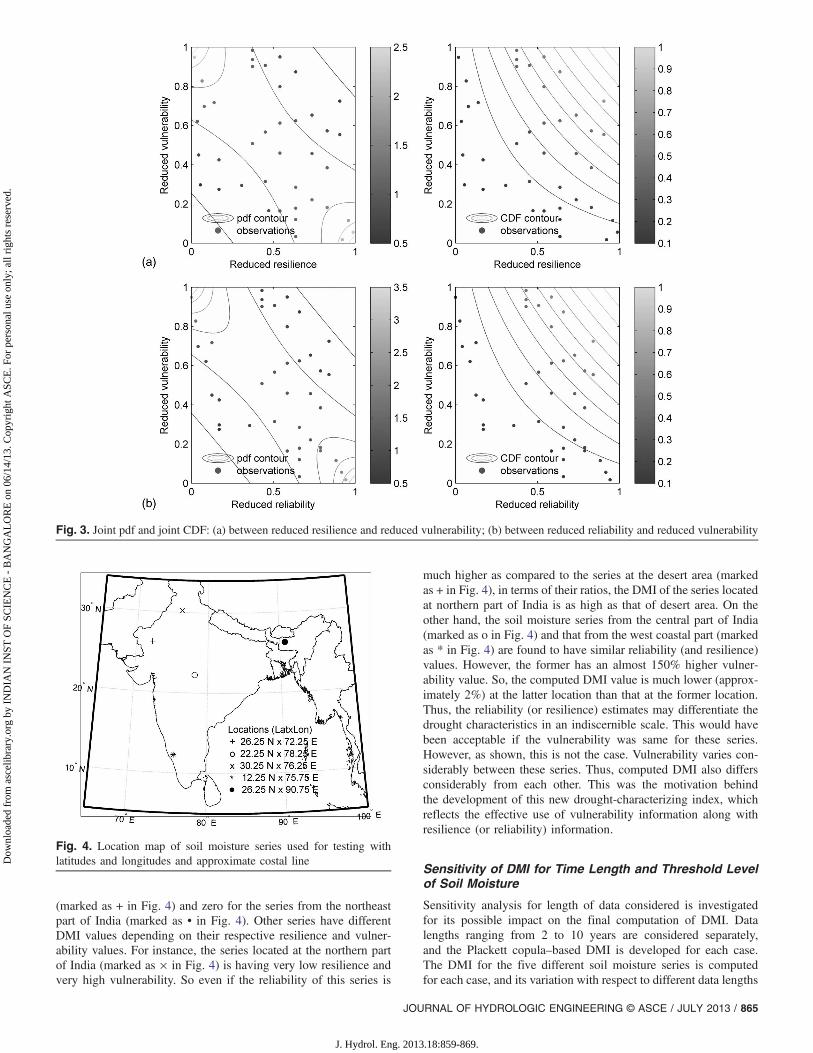
copula, indicating it to be more suitable than Gaussian and Frankcopulas. So, the Plackett copula is selected to obtain the joint dis-tribution between resilience and vulnerability. The joint probabilitydensity function (pdf) and joint CDF between reduced variables ofresilience and vulnerability are represented by a contour plot inFig. 3(a). Probability density values at specific observed pairs ofresilience and vulnerability are also computed and shown as col-ored points in the same plots of joint pdf and CDF. Reliability andvulnerability are also negatively associated as is evident from thesample estimate of the cross product ratio, which is obtained as0.273. The contour plots [Fig. 3(b)] representing the joint pdf andjoint CDF between reliability and vulnerability are very similar tothose of resilience and vulnerability as expected. Thus, any one ofthe two negatively associated pairs between resilience-vulnerabilityand reliability-vulnerability may be further analyzed for the com-putation of DMI. The CDF of the former pair is used in this study tocompute the DMI for a given series by computing its resilience andvulnerability values using Eq. (14).
Computation of DMI for Different Types of SoilMoisture Series
DMI estimates for different types of soil moisture time series areinvestigated in order to test performance. Having a specific range ofDMI (0 to 1) should reveal the difference between extreme (eithervery dry or very wet) series in terms of its numerical value, even ifthese types of series were not encountered during model develop-ment. So, it is considered to test this with some series that mightbe unforeseen during the development period. These series shouldrepresent different climatic conditions such as desert and wet areasand should have diversity in terms of reliability, resilience, and vul-nerability combinations. For this purpose, soil moisture series fromdifferent climatic parts of India are selected. We have selected soilmoisture series from five different locations in India (Fig. 4). Theselocations have widely differing climatic patterns with respect to theconsidered threshold (PWP for the study area), which are reflectedin their reliability, resilience, and vulnerability combinations. Forinstance, the location in a desert area (marked by +) is very dry, and,hence, a high DMI value must result if an extreme dry situation,similar to this desert area, occurs in Malaprabha basin. On the otherhand, soil moisture conditions similar to that of the location in ahigh rainfall zone (marked by •), when occurring in Malaprabhabasin, must produce low DMI. Similarly, soil moisture conditionssimilar to locations at northern and central part of India will lead tosome intermediate DMI values. However, as the developed indexdepends both on resilience and vulnerability, the value of droughtindex should reflect this aspect.
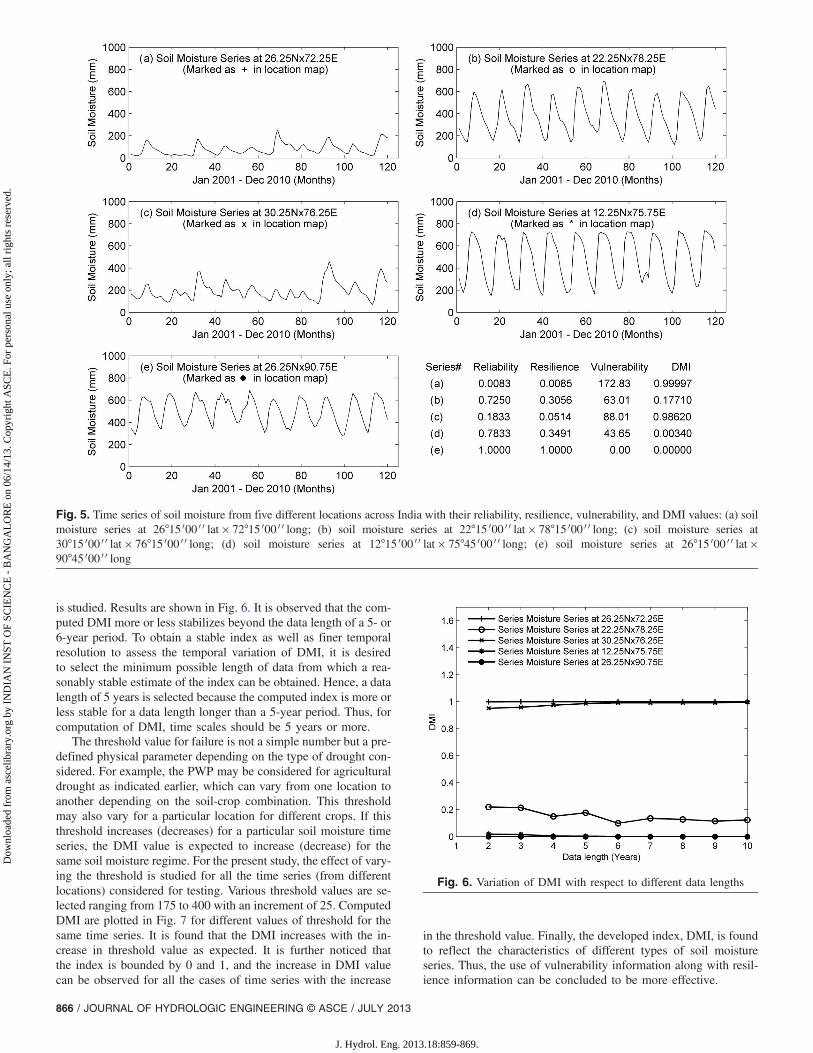
Soil moisture time series from these five locations are shown inFig. 5. It can be visually noticed that the time series in Fig. 5(a)(desert area) shows the driest condition (unfavorable), whereasthe series in Figs. 5(d) (west coast) and 5(e) (high rainfall zoneat northeast part of India) shows most wet condition (favorable)case. Maximum variation is observed in the series located in thewest cost region. Resilience and vulnerability (with respect tothe PWP of the study area) are computed for each time series,and the DMI values are computed as explained earlier. As canbe noticed, the DMI is very high for the series from the desert area
Fig. 2. Pairwise scatter plot between reliability, resilience, andvulnerability
Table 1. Performance Measures for Different Copulas
Copula Sn Tn
Gaussian 0.0685 0.7766Frank 0.0889 0.6142Plackett 0.0406 0.5156
864 / JOURNAL OF HYDROLOGIC ENGINEERING © ASCE / JULY 2013
J. Hydrol. Eng. 2013.18:859-869.
Dow
nloa
ded
from
asc
elib
rary
.org
by
IND
IAN
IN
ST O
F SC
IEN
CE
- B
AN
GA
LO
RE
on
06/1
4/13
. Cop
yrig
ht A
SCE
. For
per
sona
l use
onl
y; a
ll ri
ghts
res
erve
d.
(marked as + in Fig. 4) and zero for the series from the northeastpart of India (marked as • in Fig. 4). Other series have differentDMI values depending on their respective resilience and vulner-ability values. For instance, the series located at the northern partof India (marked as × in Fig. 4) is having very low resilience andvery high vulnerability. So even if the reliability of this series is
much higher as compared to the series at the desert area (markedas + in Fig. 4), in terms of their ratios, the DMI of the series locatedat northern part of India is as high as that of desert area. On theother hand, the soil moisture series from the central part of India(marked as o in Fig. 4) and that from the west coastal part (markedas * in Fig. 4) are found to have similar reliability (and resilience)values. However, the former has an almost 150% higher vulner-ability value. So, the computed DMI value is much lower (approx-imately 2%) at the latter location than that at the former location.Thus, the reliability (or resilience) estimates may differentiate thedrought characteristics in an indiscernible scale. This would havebeen acceptable if the vulnerability was same for these series.However, as shown, this is not the case. Vulnerability varies con-siderably between these series. Thus, computed DMI also differsconsiderably from each other. This was the motivation behindthe development of this new drought-characterizing index, whichreflects the effective use of vulnerability information along withresilience (or reliability) information.
Sensitivity of DMI for Time Length and Threshold Levelof Soil Moisture
Sensitivity analysis for length of data considered is investigatedfor its possible impact on the final computation of DMI. Datalengths ranging from 2 to 10 years are considered separately,and the Plackett copula–based DMI is developed for each case.The DMI for the five different soil moisture series is computedfor each case, and its variation with respect to different data lengths
Fig. 3. Joint pdf and joint CDF: (a) between reduced resilience and reduced vulnerability; (b) between reduced reliability and reduced vulnerability
Fig. 4. Location map of soil moisture series used for testing withlatitudes and longitudes and approximate costal line
JOURNAL OF HYDROLOGIC ENGINEERING © ASCE / JULY 2013 / 865
J. Hydrol. Eng. 2013.18:859-869.
Dow
nloa
ded
from
asc
elib
rary
.org
by
IND
IAN
IN
ST O
F SC
IEN
CE
- B
AN
GA
LO
RE
on
06/1
4/13
. Cop
yrig
ht A
SCE
. For
per
sona
l use
onl
y; a
ll ri
ghts
res
erve
d.
is studied. Results are shown in Fig. 6. It is observed that the com-puted DMI more or less stabilizes beyond the data length of a 5- or6-year period. To obtain a stable index as well as finer temporalresolution to assess the temporal variation of DMI, it is desiredto select the minimum possible length of data from which a rea-sonably stable estimate of the index can be obtained. Hence, a datalength of 5 years is selected because the computed index is more orless stable for a data length longer than a 5-year period. Thus, forcomputation of DMI, time scales should be 5 years or more.
The threshold value for failure is not a simple number but a pre-defined physical parameter depending on the type of drought con-sidered. For example, the PWP may be considered for agriculturaldrought as indicated earlier, which can vary from one location toanother depending on the soil-crop combination. This thresholdmay also vary for a particular location for different crops. If thisthreshold increases (decreases) for a particular soil moisture timeseries, the DMI value is expected to increase (decrease) for thesame soil moisture regime. For the present study, the effect of vary-ing the threshold is studied for all the time series (from differentlocations) considered for testing. Various threshold values are se-lected ranging from 175 to 400 with an increment of 25. ComputedDMI are plotted in Fig. 7 for different values of threshold for thesame time series. It is found that the DMI increases with the in-crease in threshold value as expected. It is further noticed thatthe index is bounded by 0 and 1, and the increase in DMI valuecan be observed for all the cases of time series with the increase
in the threshold value. Finally, the developed index, DMI, is foundto reflect the characteristics of different types of soil moistureseries. Thus, the use of vulnerability information along with resil-ience information can be concluded to be more effective.
Fig. 6. Variation of DMI with respect to different data lengths
Fig. 5. Time series of soil moisture from five different locations across India with their reliability, resilience, vulnerability, and DMI values: (a) soilmoisture series at 26°15 000 0 0 lat × 72°15 000 0 0 long; (b) soil moisture series at 22°15 000 0 0 lat × 78°15 000 0 0 long; (c) soil moisture series at30°15 000 0 0 lat × 76°15 000 0 0 long; (d) soil moisture series at 12°15 000 0 0 lat × 75°45 000 0 0 long; (e) soil moisture series at 26°15 000 0 0 lat ×90°45 000 0 0 long
866 / JOURNAL OF HYDROLOGIC ENGINEERING © ASCE / JULY 2013
J. Hydrol. Eng. 2013.18:859-869.
Dow
nloa
ded
from
asc
elib
rary
.org
by
IND
IAN
IN
ST O
F SC
IEN
CE
- B
AN
GA
LO
RE
on
06/1
4/13
. Cop
yrig
ht A
SCE
. For
per
sona
l use
onl
y; a
ll ri
ghts
res
erve
d.

5-Year Variation of DMI over Last 50 Years for theStudy Area Considered during Model Development
In “Sensitivity of DMI for Time Length and Threshold Level ofSoil Moisture,” DMI was computed for the five different soil mois-ture time series from five different locations from India. It wasfound to represent all types of drought characteristics. In this sec-tion, DMI is computed for the soil moisture data for the area in andaround Malaprabha basin using the copula function developed in“Joint Distribution between Resilience and Vulnerability of SoilMoisture Data” [refer to Figs. 3(a and b)]. As mentioned earlier,DMI values are found to stabilize when a data segment of at least5 years is considered. Hence, the soil moisture data from the studyregion for the period 1961–2010 is segmented into 5-year windowsand DMI is computed for each of them. The DMI is considered toassess the drought characteristics of the basin for each 5-year periodstarting from 1961. Results are shown in Fig. 8. It is observed thatthe DMI varies in a cyclic pattern. Either the rising or falling phaseis approximately a decade long. An overall mild increasing trend isalso observed with a rate of 0.0048 per 5-year period or approx-imately 0.01 per decade. This is from the equation of the overalltrend line with the slope of 0.0048 as shown in Fig. 8. However, thecyclic pattern is more prominent as compared to the overall increas-ing trend. Thus, the drought characteristics of the study regionfollow a cyclic pattern with a slow increasing trend. It is furthernoticed that currently the basin is in the rising phase of DMI. It isexpected that the same may be in the falling phase a decade later asis evident from Fig. 8.
Before concluding, it is worthwhile to mention here that the useof PWP as a threshold is analogous to standardization with respectto the soil moisture regime of that region since it allows a compari-son of drought risks of different locations relative to their naturalregimes. The regular standardization procedure followed in otherdrought indices such as the SPI is avoided here since it has certaindrawbacks. For instance, even a small deficit in precipitation maybe reflected as a large negative value for the locations with smallvariation in precipitation (or any other hydrologic variable fordrought) (Mallya et al. 2011). However, DMI does not suffer fromsuch shortcomings as the PWP is a specific quantity at a region for aparticular crop. Moreover, the SPI is ineffective for longer timescales due to very high temporal overlap (Mallya et al. 2011).On the other hand, DMI is designed to capture the long-termdrought characteristics.
Conclusions
The reliability, resilience, and vulnerability derived from soil mois-ture data are investigated in this paper. A new index to characterizethe drought proneness of a catchment is developed using the jointinformation of resilience and vulnerability. Plackett copula is usedto obtain the joint distribution of resilience and vulnerability of soilmoisture time series. The developed index, DMI considers the in-formation of both resilience and vulnerability. This is importantfrom an effective drought characterization point of view as this in-dex simultaneously considers the frequency/recovery period as wellas the severity of droughts—once a drought has occurred. For fivedifferent soil moisture time series from different locations, it is ob-served that even for same resilience intervals, the obtained DMIvalues depend on their vulnerability values. DMI is found to sta-bilize over a time period of 5 years or more, suggesting the use of a5-year period for assessment of DMI variability. While investigat-ing the temporal variation of DMI for the study area, a cyclic pat-tern was observed with a slight increasing trend. Current status ofMalaprabha was found to be in rising phase with an indication offalling trend a decade later. The study can be extended to investi-gate spatial variation of DMI, which will be useful for analysisover a larger area, say a country. However, soil moisture data atdifferent spatial points, preferably gridded, is required. Further ex-tensions to assess the changes due to global warming as simulatedby General Circulation Models are in progress and will be reportedin the future.
Appendix. Identification of the Appropriate Copula
For all the data points (reduced variable of resilience, u1 andvulnerability, u2), values of empirical CDF are obtained anddenoted as Cn. For the bivariate case considered in this study,Cn is estimated as
CnðuÞ ¼1
n
Xni¼1
IðUi1 ≤ u1;Ui2 ≤ u2Þ ð15Þ
where u ¼ ½u1; u2� = the reduced variable of resilience (u1) andvulnerability (u2), IðAÞ ¼ 1 if A is true, and IðAÞ ¼ 0 if A is false.Reduced variables are obtained after transforming through theirmarginal distribution, i.e., u1 ¼ ϕ−1ðRÞ and u2 ¼ ϕ−1ðVÞ, whereR = the resilience, V = the vulnerability, and ϕ−1 = the inverseof cumulative normal distribution. Uijði ¼ 1; : : : ; n and j ¼1; 2Þ are known as pseudo-observations. These are obtained asUij ¼ Rij=ðnþ 1Þ where Rij = the ranks of the data.
Fig. 7. Variation of DMI with respect to different threshold values
Fig. 8. Variation of 5-year DMI for the study region over last 50 years
JOURNAL OF HYDROLOGIC ENGINEERING © ASCE / JULY 2013 / 867
J. Hydrol. Eng. 2013.18:859-869.
Dow
nloa
ded
from
asc
elib
rary
.org
by
IND
IAN
IN
ST O
F SC
IEN
CE
- B
AN
GA
LO
RE
on
06/1
4/13
. Cop
yrig
ht A
SCE
. For
per
sona
l use
onl
y; a
ll ri
ghts
res
erve
d.

Values of Cn are arranged in an ascending order and plotted asa solid line in Fig. 9. For each value of empirical CDF, values ofCDF using Gaussian (CG), Frank (CF), and Plackett (CP) copulasare also obtained for the corresponding data. These values are alsoplotted on the same plot (Fig. 9).
The suitable copula will produce the values of resulting cdfclose to those obtained by empirical copula. Genest et al. (2009)suggested metrics, such as, Sn ¼ ∫ ½0;1�2DnðuÞ2dCnðuÞ and
Tn ¼ supu∈½0;1�2 jDnðuÞj, where DnðuÞ ¼ffiffiffin
p ðCn − CÞ and n =the number of data points. Superscripts of Cθn are omitted to makeit general (i.e., applicable to all the copulas). The values of Sn andTn are given in Table 1.
Acknowledgments
Financial support from Australia India Strategic Research Fund(AISRF) (project no. DST/INT/AUS/P-27/2009) is acknowledged.The authors acknowledge the help extended by Dr. S.C. Kao,Environmental Sciences Division, Oak Ridge National Laboratory,Oak Ridge, Tennessee.
References
AghaKouchak, A., Bárdossy, A., and Habib, E. (2010). “Conditionalsimulation of remotely sensed rainfall data using a non-Gaussianv-transformed copula.” Adv. Water Resour., 33(6), 624–634.
Alley, W. M. (1984). “The Palmer Drought Severity Index: Limitations andassumptions.” J. Clim. Appl. Meteorol., 23(7), 1100–1109.
American Meteorological Society. (1997). “AMS policy statement onmeteorological drought.” ⟨http://www.ametsoc.org/policy/drought2.html⟩.
Bergman, K. H., Sabol, P., and Miskus, D. (1988). “Experimental indicesfor monitoring global drought conditions.” Proc., 13th AnnualClimate Diagnostics Workshop, U.S. Dept. of Commerce, Cambridge,Massachusetts, 190–197.
Bhalme, H. N., and Mooley, D. A. (1980). “Large-scale droughts/floodsand monsoon circulation.” Mon. Weather Rev., 108(8), 1197–1211.
Blumenstock, G., Jr. (1942). “Drought in the United States analyzed bymeans of the theory of probability.” USDA Technical Bull., 819, 1–64.
Bonaccorso, B., Cancelliere, A., and Rossi, G. (2003). “An analytical for-mulation of return period of drought severity.” Stoch. Environ. Res. RiskAssess., 17(3), 157–174.
Byun, H. R., and Wilhite, D. A. (1999). “Objective quantification ofdrought severity and duration.” J. Clim., 12(9), 2747–2756.
Cancelliere, A., and Salas, J. D. (2004). “Drought length properties forperiodic-stochastic hydrologic data.” Water Resour. Res.. 40(2),W02503.
Chung, C., and Salas, J. D. (2000). “Drought occurrence probabilitiesand risks of dependent hydrologic processes.” J. Hydrol. Eng., 5(3),259–268.
Dai, A. (2011). “Drought under global warming: A review.” Wiley Inter-discip. Rev.: Clim. Change, 2(1), 45–65.
De Michele, C., and Salvadori, G. (2003). “A generalized Pareto intensity-duration model of storm rainfall exploiting 2-copulas.” J. Geophys.Res., 108(D2), 15-1–15-11.
De Michele, C., Salvadori, G., Canossi, M., Petaccia, A., and Rosso, R.(2005). “Bivariate statistical approach to check adequacy of damspillway.” J. Hydrol. Eng., 10(1), 50–57.
Dracup, J. A., Lee, K. S., and Paulson, E. G., Jr. (1980). “On the definitionof droughts.” Water Resour. Res., 16(2), 297–302.
Fan, Y., and van den Dool, H. (2004). “Climate Prediction Center globalmonthly soil moisture data set at 0.5 degree resolution for 1948 topresent.” J. Geophys. Res., 109(10), D10102.
Favre, A.-C., El Adlouni, S., Perreault, L., Thiemonge, N., and Bobee, B.(2004). “Multivariate hydrological frequency analysis using copulas.”Water Resour. Res., 40(1), W01101.
Fernandez, B., and Salas, J. D. (1999). “Return period and risk ofhydrologic events. I: Mathematical formulation.” J. Hydrol. Eng.,4(4), 297–307.
Gebremichael, M., and Krajewski, W. F. (2007). “Application of copulasto modeling temporal sampling errors in satellite-derived rainfallestimates.” J. Hydrol. Eng., 12(4), 404–408.
Genest, C. (1987). “Frank’s family of bivariate distributions.” Biometrika,74(3), 549–555.
Genest, C., Ghoudi, K., and Rivest, L.-P. (1995). “A semiparametric esti-mation procedure of dependence parameter in multivariate families ofdistributions.” Biometrika, 82(3), 543–552.
Genest, C., Rémillard, B., and Beaudoin, D. (2009). “Goodness-of-fit testsfor copulas: A review and a power study.” Insur. Math. Econ., 44(2),199–213.
Grimaldi, S., and Serinaldi, F. (2006a). “Asymmetric copula in multivariateflood frequency analysis.” Adv. Water Resour., 29(8), 1155–1167.
Grimaldi, S., and Serinaldi, F. (2006b). “Design hyetograph analysis with3-copula function.” Hydrol. Sci. J., 51(2), 223–238.
Hashimoto, T., Stedinger, J. R., and Loucks, D. P. (1982). “Reliability, resil-iency, and vulnerability criteria for water resource system performanceevaluation.” Water Resour. Res., 18(1), 14–20.
Heim, R. R., Jr. (2002). “A review of twentieth-century drought indicesused in the United States.” Bull. Am. Meteorol. Soc., 83(8), 1149–1165.
Huang, J., van den Dool, H., and Georgakakos, K. P. (1996). “Analysisof model-calculated soil moisture over the United States (1931–93)and application to long-range temperature forecasts.” J. Clim., 9(6),1350–1362.
Kao, S.-C., and Govindaraju, R. S. (2007a). “A bivariate rainfall frequencyanalysis of extreme rainfall with implications for design.” J. Geophys.Res., 112(D13), D13119.
Kao, S.-C., and Govindaraju, R. S. (2007b). “Probabilistic structureof storm surface runoff considering the dependence between averageintensity and storm duration of rainfall events.” Water Resour. Res.,43(6), W06410.
Kao, S.-C., and Govindaraju, R. S. (2008). “Trivariate statistical analysisof extreme rainfall events via the Plackett family of copulas.” WaterResour. Res., 44(2), W02415.
Kao, S.-C., and Govindaraju, R. S. (2010). “A copula based joint deficitindex for droughts.” J. Hydrol., 380(1–2), 121–134.
Keyantash, J., and Dracup, J. A. (2002). “The quantification of drought:an evaluation of drought indices.” Bull. Am. Meteorol. Soc., 83(8),1167–1180.
Kogan, F. N. (1995). “Droughts of the late 1980s in the United States asderived from NOAA polar-orbiting satellite data.” Bull. Am. Meteorol.Soc., 76(5), 655–668.
Fig. 9. Performance of different copulas to represent the empiricalCDF and joint CDFs between resilience and reliability
868 / JOURNAL OF HYDROLOGIC ENGINEERING © ASCE / JULY 2013
J. Hydrol. Eng. 2013.18:859-869.
Dow
nloa
ded
from
asc
elib
rary
.org
by
IND
IAN
IN
ST O
F SC
IEN
CE
- B
AN
GA
LO
RE
on
06/1
4/13
. Cop
yrig
ht A
SCE
. For
per
sona
l use
onl
y; a
ll ri
ghts
res
erve
d.
Kogan, F. N. (1997). “Global drought watch from space.” Bull. Am.Meteorol. Soc., 78(4), 621–636.
Liu, W. T., and Kogan, F. N. (1996). “Monitoring regional droughtusing the vegetation condition index.” Int. J. Remote Sens., 17(14),2761–2782.
Maity, R., and Kumar, N. D. (2008). “Probabilistic prediction of hydrocli-matic variables with nonparametric quantification of uncertainty.”J. Geophys. Res., 113(D14), D14105.
Mallya, G., Tripathi, S., and Govindaraju, R. S. (2011). “A machine learn-ing approach for probabilistic drought classification.” Conf. on Intel-ligent Data Understanding, The National Aeronautics and SpaceAdministration: The Aviation Safety Program and The Engineeringand Safety Center, Mountain View, CA, 263–275.
Mardia, K. V. (1970). Families of bivariate distributions, Griffin, London.McGuire, J. K., and Palmer, W. C. (1957). “The 1957 drought in the eastern
United States.” Mon. Weather Rev., 85(9), 305–314.McKee, T. B., Doesken, N. J., and Kleist, J. (1993). “The relationship of
drought frequency and duration to time scales.” Eighth Conf. on AppliedClimatology, Anaheim, CA.
McQuigg, J. (1954). “A simple index of drought conditions.”Weatherwise,7(3), 64–67.
Mikabari, M., Ganji, A., and Fallah, S. R. (2010). “Regional bivariate fre-quency analysis of meteorological droughts.” J. Hydrol. Eng., 15(12),985–1000.
Mishra, A. K., and Singh, V. P. (2010). “A review of drought concepts.”J. Hydrol., 391(1–2), 202–216.
Mishra, A. K., and Singh, V. P. (2011). “Drought modeling—A review.”J. Hydrol., 403(1–2), 157–175.
Mishra, A. K., Singh, V. P., and Desai, V. R. (2009). “Drought characteri-zation: A probabilistic approach.” Stoch. Environ. Res. Risk Assess.,23(1), 41–55.
Munger, T. T. (1916). “Graphic method of representing and comparingdrought intensities.” Mon. Weather Rev., 44(11), 642–643.
Nadarajah, S. (2009). “A bivariate pareto model for drought.” Stoch.Environ. Res. Risk Assess., 23(6), 811–822.
Nelsen, R. B. (2006). An introduction to copulas, Springer, New York.Palmer, W. C. (1965). “Meteorological drought.” Res. Paper No. 45,
Weather Bureau, Washington, DC.Palmer, W. C. (1968). “Keeping track of crop moisture conditions, nation-
wide: the new crop moisture index.” Weatherwise, 21(4), 156–161.Plackett, R. L. (1965). “A class of bivariate distributions.” J. Am. Stat.
Assoc., 60(310), 516–522.Pui, A., Lal, A., and Sharma, A. (2011). “How does the Interdecadal Pacific
Oscillation affect design floods in Australia?” Water Resour. Res.,47(5), W05554.
Renard, B., and Lang, M. (2007). “Use of Gaussian copula for multivariateextreme value analysis: Some case studies in hydrology.” Adv. WaterResour., 30(4), 897–912.
Ryu, J. H., Svoboda, M. D., Lenters, J. D., Tadesse, T., and Knutson, K. L.(2010). “Potential extents for ENSO-driven hydrologic drought fore-casts in the United States.” Clim. Change, 101(3–4), 575–597.
Serinaldi, F., Bonaccorso, B., Cancelliere, A., and Grimaldi, S. (2009).“Probabilistic characterization of drought properties through copulas.”Phys. Chem. Earth, 34(10–12), 596–605.
Shafer, B. A., and Dezman, L. E. (1982). “Development of a surface watersupply index (SWSI) to assess the severity of drought conditions in
snowpack runoff areas.” 50th Annual Western Snow Conf., ColoradoState Univ., Reno, NV, 164–175.
Shiau, J. T. (2006). “Fitting drought duration and severity with twodimensional copulas.” Water Resour. Manage., 20(5), 795–815.
Shiau, J. T., Feng, S., and Nadarajah, S. (2007). “Assessment of hydrolog-ical drought for the Yellow river, China, using copulas.” Hydrol.Process., 21(16), 2157–2163.
Shiau, J. T., and Modarres, R. (2009). “Copula-based drought severity-duration-frequency analysis in Iran.” Meteorol. Appl., 16(4), 481–489.
Sklar, A. (1959). “Fonctions de répartition à n dimensions et leurs marges.”Publications de l’Institut de Statistique de l’Université de Paris,8, 229–231.
Song, S., and Singh, V. P. (2010a). “Frequency analysis of droughts usingthe Plackett copula and parameter estimation by genetic algorithm.”Stoch. Environ. Res. Risk Assess., 24(5), 783–805.
Song, S., and Singh, V. P. (2010b). “Meta-elliptical copulas for droughtfrequency analysis for periodic hydrologic data.” Stoch. Environ.Res. Risk Assess., 24(3), 425–444.
Taiz, L., and Zeiger, E. (1991). Plant physiology, Benjamin/Cummings,Redwood City, California.
Thornthwaite, C. W. (1931). “The climate of North America according to anew classification.” Geogr. Rev., 21(4), 633–655.
Thornthwaite, C. W. (1948). “An approach toward a rational classificationof climate.” Geogr. Rev., 38(1), 55–94.
Vandenberghe, S., Verhoest, N. E. C., and De Baets, B. (2010). “Fittingbivariate copulas to the dependence structure between storm character-istics: A detailed analysis based on 105 year 10 min rainfall.” WaterResour. Res., 46(1), W01512.
van den Dool, H., Huang, J., and Fan, Y. (2003). “Performance and analysisof the constructed analogue method applied to US soil moisture appliedover 1981–2001.” J. Geophys. Res., 108(D16), 1–16.
Vangelis, H., Spiliotis, M., and Tsakiris, G. (2011). “Drought severityassessment based on bivariate probability analysis.” Water Resour.Manage., 25(1), 357–371.
van Rooy, M. P. (1965). “A rainfall anomaly index independent of time andspace.” Notos, 14, 43–48.
Villarini, G., Serinaldi, F., and Krajewski, W. F. (2008). “Modeling radar-rainfall estimation uncertainties using parametric and non-parametricapproaches.” Adv. Water Resour., 31(12), 1674–1686.
Waggoner, M. L., and O’Connell, T. J. (1956). “Antecedent precipitationindex.” Wkly. Weather Crop Bull., XLIII, 6–7.
Wilhelmi, O. V., and Wilhite, D. A. (2002). “Assessing vulnerability toagricultural drought: A Nebraska case study.” Nat. Hazards, 25(1),37–58.
Wong, G., Lambert, M. F., Leonard, M., and Metcalfe, A. V. (2010).“Drought analysis using trivariate copulas conditional on climaticstates.” J. Hydrol. Eng., 15(2), 129–141.
Zakaria, R., Metcalfe, A., Piantadosi, J., Boland, J., and Howlett, P. (2010).“Using the skew-t copula to model bivariate rainfall distribution.”ANZIAM J., 51, C231–C246.
Zhang, L., and Singh, V. P. (2006). “Bivariate flood frequency analysisusing the copula method.” J. Hydrol. Eng., 11(2), 150–164.
Zhang, L., and Singh, V. P. (2007). “Bivariate rainfall frequency distribu-tions using Archimedean copulas.” J. Hydrol. Eng., 332(1–2), 93–109.
JOURNAL OF HYDROLOGIC ENGINEERING © ASCE / JULY 2013 / 869
J. Hydrol. Eng. 2013.18:859-869.
Dow
nloa
ded
from
asc
elib
rary
.org
by
IND
IAN
IN
ST O
F SC
IEN
CE
- B
AN
GA
LO
RE
on
06/1
4/13
. Cop
yrig
ht A
SCE
. For
per
sona
l use
onl
y; a
ll ri
ghts
res
erve
d.