indian container market report 2016 - containersindia.in container market report-2… · president,...
TRANSCRIPT

www.maritimegateway.com
by &
IndIan ContaInermarket report2016


FOREWORD
I feel proud to present the 4th edition of Containers India Market Report 2016 to all stakeholders of maritime industry.
Previous year we have estimated that container market in India will see 10 per cent growth. But reality turned out to be different. Weak global demand and continuous downtrend in exports have impacted trade. Government’s policy decisions could not provide the expected fillip for the industry.
Indian Container Market has witnessed 6.1 per cent growth in FY16 with combined traffic handled at all Indian ports at 12.53 Million TEUs. There have been new capacity additions on both eastern and western coasts of India to ease the congestion at the major ports and also to serve the ever increasing demand from the industry. In spite of bleak global shipping scenario, industry was able to register modest growth during last financial year.
Container market growth in India predominately depends on west coast of India with its large contribution of 73 per cent to the overall Indian container market. Newbies on the east coast of India have been trying hard to grab their share by concentrating on their hinterland which was hitherto being served by west coast ports. But less mainline calls and lack of manufacturing activity remain key challenges for eastern terminals.
However East coast terminals are still able to register growth because of their aggressive marketing strategies and foraying into global markets.
Containerization levels are also on upward trend. There has been sustained attention from the central government to aid the shipping industry by announcing better policies and amending the existing policies.
In this backdrop, this year’s report focusses on major commodity profiles, container terminals data along with perspectives of some experts on industry trends.
We appreciate Drewry’s continued association and efforts in bringing out this report.
Sincerely
RamprasadEditor-in-chief and PublisherMaritime Gateway

Drewry is proud to be associated with Maritime Gateway as Knowledge Partner for Containers India 2016. It is our pleasure to present this report.
Indian economy, after its liberalisation in 1990s, has undergone tremendous change. The export and import portfolio of the economy has undergone many visible and not so visible changes since then. This paper attempts to look at some of the major containerised or containerisable commodities of India’s global trade especially during the last five years (2011-15). Apart from looking at the major export and import commodities in India’s trade profile, the paper also identifies few fast growing commodities both on the export and import sides.
Author: Dr. Subrata K Behera
Dr. Subrata Kumar Behera (Manager – Ports and Containers Research) with an industry experience of nine years is well versed in international trade and transport. He works in the container and ports team at Drewry. He has worked on the India and other emerging market Container Business Analysis. He is a Doctorate from the School of International Studies, Jawaharlal Nehru University, New Delhi. Besides his doctoral thesis, he has number of research publications to his credit.
FOREWORD

C O N T E N T S1. PerspectIves 04
2. Indian Container Market: An Overview 18
3. Commodity Profiles - Research Methodology 20
• Major Commodities by Volume - Top 5 Exports 21
• Major Commodities by high growth - Top 5 Exports 27
• Major Commodities by Volume - Top 5 Imports 33
• Major Commodities by high growth - Top 5 Imports 39
5. Indian Container Terminals Fact Sheet 45
Terminals Ranking 46
Terminals Performance 48
Terminals Profile
• APM Terminals Mumbai 49
• Jawaharlal Nehru Port Container Terminal 50
• Adani International Container Terminal 51
• Nhava Sheva International Container Terminal - DP world 52
• Mundra International Container Terminal - DP world 53
• Adani Mundra Container Terminal 54
• Chennai Container Terminal - DP world 55
• Chennai International Terminal - PSA 56
• APM Terminals Pipavav 57
• Bharat Kolkata Container Terminal 58
• Tuticorin Container Terminal - PSA SICAL 59
• Vallarpadam International Container Transshipment Terminal 60
• Adani Hazira Container Terminal 61
• Visakha Container Terminal 62
• Nhava Sheva India Gateway Terminal 63
• Krishnapatnam Port Container Terminal 64
• Kattupalli International Container Terminal 65
• Dakshin Bharat Gateway Terminal 66
• Haldia International Container Terminal 67
• Kandla International Container Terminal 68
This report is a proprietary of Maritime Gateway and no part of this report may be copied/reproduced in any form or any manner whatsoever without a written consent by us. We have taken utmost care in preparing this report. Information has been obtained from sources considered to be reliable. However, we do not guarantee the accuracy, adequacy or completeness of information and is not responsible for any errors in transmission.
C O N T E N T S

PERSPECTIVESV KALYANA RAMA
DIRECTOR (PROJECTS & SERVICES), CONTAINER CORPORATION OF INDIA LTD
ANIL SINGH SR VP & MANAGING DIRECTOR, INDIAN SUBCONTINENT, DP WORLD
VIVEK KELEPRESIDENT, AMTOI
CAPT A K KAURAPRESIDENT, NORTHERN INDIA STEAMER AGENTS ASSCOAITION
CAPT DHEERAJ BHATIAMANAGING DIRECTOR, HAPAG LLOYD INDIA.
CAPT VK SINGHCEO, SHREYAS SHIPPING & LOGISTICS LIMITED
ENNARASU KARUNESANCEO – APSEZ MUNDRA & TUNA PORTS, ADANI PORTS & SEZ LTD
04

Indian container market: CONCOR view
Indian container ports handled 11.9 Million TEUs of Exim container traffic in FY 2015-16, which was 3.83 per cent higher than 2014-15. It is expected that the current trend will be continued with modest increase in the first quarter of 2015-16 wherein the total handled volume was 3.16 Million TEUs, which is 7.37 per cent higher than the corresponding figure of 2015-16.
Usage of rail transporatation for containers movement to/from terminals decreased in the first quarter of the current Financial Year. For example, JNPT’s rail coefficient is down from 18 per cent in 2014-15 to 17.6 per cent in 2015-16 and 16 per cent in the 1st Quarter of 2016-17. This downward trend not only creates a situation of underutilization of ICDs in the hinterland but also create congestion at the port side CFSs. However, various initiatives like Double stack rakes, rationalization of empty containers tariffs can spur the industry,
Outlook for 2017
It is expected that the Port volumes will flourish with various positive steps such as the notifica-tion on Service Tax (CENVAT Credit) and removal of Port Congestion Charges, increase not only the volumes handled by ICDs but also the Rail Coefficiency.
Further, revival in select domestic industries such as Steel, which improve scrap for manufactur-ing and pick up in domestic consumption owing to a better monsoon would help in achieving a positive growth trend.
Growth prospects
Increased capacities on east coast is going to be a major player in the Logistics scenario. How-ever, since the Exim traffic is majorly derived by Industrial, Manufacturing & other Trade Sectors. Developments in these sectors can aid to register substantial growth on East-Coast. However, the West Coast and hinterland movement from Maharashtra, Gujarat, the Northern & North Western Regions will continue to grow with the expected commissioning of DFC by 2018 and envisaged industrialization along the DMIC Corridor.
Government initiatives
Various Government initiatives such as the Sagarmala National Perspective Plan, the moderniza-tion undertaken of Ports, Connectivity Projects of Railways, Highways & Inland Waterways, Coastal Shipping and development of Coastal Economic Zones will definatley augment the market.
V KALYANA RAMADIRECTOR (PROJECTS & SERVICES), CONTAINER CORPORATION OF INDIA LTD
05

Sagarmala and containerization in India
The Sagarmala programme propounded by the Modi government can undoubtedly be considered to be one of the best shipping and ports related initiatives to have emerged at national level in the period since India’s Independence.
Sagarmala is centered on the modernisation of the country’s ports and development of in-frastructure that can move goods to and from ports quickly, efficiently and cost effectively, to increase the competitiveness of the country’s export sector by cutting logistics costs. Port hinterlands are to be industrialised and lead an economic transformation of the country’s coastal regions, which already account for more than 60 per cent of national GDP.
At the heart of the Sagarmala initiative is the swift and unfettered movement of cargo from the country’s ports. Yet, the export-import container trade in a country the size of India is just 10.7 million TEU (twenty foot equivalent units), with 95 per cent of this EXIM (Export – Import) traffic being handled by seven ports, and 45 per cent of the throughput handled by a solitary port – Jawaharlal Nehru port (JNPT), off the Mumbai coast.
A few European countries that are smaller than any single Indian state like Maharashtra or Tamil Nadu handle twice that quantum of container throughput. If we compare India with Germany, for example, this country’s biggest port, JNPT, has nine railway sidings, whereas Hamburg port has 135 railway sidings!
In recent times, fueled by initiatives like ‘Make in India’ and higher consumption demand, the container trade in the country is expected to grow at a rate more than 5 per cent of GDP growth. Steps are increasingly being taken to improve the flow of container traffic in and out of India, partly through the proposed setting up of a container transhipment hub port in Enayam, near Colachel in Tamil Nadu. In February 2011 a transhipment hub at Cochin was initiated, a port that is fairly close to the southernmost tip of India, and within reasonable distance of the main East-West shipping lines.
In more recent times, there have been efforts to develop Vizhinjam, also in Kerala, as a container transhipment hub port with acceptable draft to accommodate the latest generation container vessels. With Vizhinjam and Vallarpadam already there, it becomes a point to think about whether scarce resources need to be employed in setting up a third transhipment port
ANIL SINGH SR VP & MANAGING DIRECTOR, INDIAN SUBCONTINENT, DP WORLD
06

in Colachel. One must think, what impact will Colachel have on the two existing tranship-ment ports? Instead, would it not be advisable to employ resources to promote Vallarpadam and Vizhinjam, and take steps to boost trade and traffic for the southern Indian hinterland by putting incentives in place to attract international shipping lines and building the support infrastructure?
Much thought and effort has gone in the past year to promote coastal shipping and cargo move-ment along inland waterways, and several incentives have been taken to boost traffic along the coast. It might make eminent sense to extend similar incentives to shipping lines that use the facilities of Vallarpadam and Vizhinjam.
The Ministry has been aiming for annual container throughput of 20 million TEUs, i.e. nearly double the current national throughput. A coordinated master plan must be in place to ensure that the country’s road and rail network is able to handle this increased load. Several initiatives have been brought in from time to time, but would be ideal if they form part of a coherent and comprehensive policy.
Weak hinterland connectivity has been a challenge for most Indian ports, reducing accessibility. Despite investments from the private sector that are encouraging the modernisation and devel-opment of ports, infrastructure continues to be a big issue.
Then there are issues with regard to the tariff policy that port operators are saddled with by the Tariff Authority for Major Ports (TAMP). If four competing terminals at a single port are required by TAMP to charge different rates without there being cogent reasons for the tariff differential, it hardly becomes a level playing field for harmonious co-existence. Even those who have now operationalised terminals under the new 2008/2013 guidelines find themselves badly impacted on account of the lack of a level playing field. The government must swiftly move towards a market denominated tariff to let all compete on equal terms else the sector could be headed for far worse situation then it currently is.
In the current Indian market, the exim trade is looking for reliability and predictability of services, hinterland penetration and capability of costs. The new private players in the rail transport logis-tics sector should collaborate and cooperate with existing players, avoiding attrition, duplication of structural infrastructure and work together to bring down logistics cost. Nearly a decade down the line since the railways issued licenses to the operators but this sector continues to struggle on account of continuous price rises being passed on to them by railways making them uncom-petitive to road transport. Surely the Ministry of Railways must seriously consider the operators difficulties and find a solution.
By ensuring faster evacuation of cargo from ports, good port connectivity reduces the overall logistics cost of the shippers and ensures faster delivery of cargo to customers, increasing the profitability of their businesses. In the process, the capacity of the ports also increases.
As per Foreign Trade Policy 2015-20 released by the Ministry of Commerce, the Indian govern-ment aims to increase exports from US$ 315 billion in fiscal 2015-16 to US$ 900 billion by the financial year 2019-20. Such huge expansion requires investment in port infrastructure to meet the projected growth. Most of this investment will have to come under the public-private partner-ship (PPP) scheme, involving foreign capital; hence, global competitiveness will be the deciding factor.
07

With a view to enhancing port connectivity and boost the performance of Indian ports, the gov-ernment’s Maritime Agenda 2020 defines the minimum required connectivity to the major ports as four-lane approach roads and double line rail connectivity.
An efficient and modern intermodal system is crucial to any port’s success. And the secret to this success is to make the transfer between ship, rail and truck as seamless as possible. As a key link in the intermodal chain, ports must continuously take measures to help their shipping lines and other partners within the port system to battle increased competition and adjust to new trends in world trade.
As for other means of intermodal transport, the Dedicated Freight Corridor needs to be completed on priority basis, and the inland waterways system needs to be spruced up so that cargo evacua-tion by water is cheaper and cleaner, reduces costs and port congestion, and brings in efficiency. The shifting of cargo from road to train and waterways will be environment-friendly, and will also help to lower carbon emissions.
The port community system – an electronic platform that connects the multiple systems oper-ated by a variety of users such as shipping lines, hauliers, freight forwarders and government agencies, to manage information better and synchronise their complex operational processes – needs encouragement.
Single-window clearance is required for ease of doing business. Private port operators are already introducing automation and technological advancements; this should be complemented by improvement in customs procedures.
As proposed by the government in the draft major port authority bill 2014, corporatisation of the country’s 12 major ports (amongst which Ennore has already been corporatised) will allow their governing boards to be more pro-active to market needs, and will also allow them to raise funds more easily and at cheaper rates.
To further facilitate containerisation, it is important to have a collaborative approach. It is time India looks in great detail at setting up of more logistics hubs, establishment of industries and manufacturing clusters to be served by ports in the EXIM and domestic trade for further solving the existing challenges faced by those who have invested in various PPP opportunities in ports and rail.
08

Government’s initiatives in connectivity
The government’s intent is in the right place and it has taken a number of positive steps at the policy level. They have wanted to implement a lot of projects such as the Sagarmala project, the 111 inland waterways project and initiatives for coastal shipping. On the land side or transport side, the dedicated freight corridor has been envisioned too. In the next one and a half years, we should have the North-West and North-East dedicated freight corridor too. The Rail Vikas Nigam Limited has been incorporated and other small patches of road have been undertaken by NHAI to improve the last mile connectivity. So, efforts on various fronts have been adopted. What is lacking is a unified approach. At a policy level, the intent is very good. But at the ground level, how the operational aspects of these projects will pan out is unclear. They have envisioned all of the projects, but the government needs to identify the right people who can see these projects through. This is where the expertise and wisdom of the industry can come through. At the same time, there needs to be a platform created where the industry can connect with the government for implementation.
Need for task force
To begin with you need to have inter ministerial committee or a task force with dedicated re-sources at the joint secretary level to see how to operationalise the assets that are being created. Unless there is concentrated effort that is being put for doing this, there will be huge cost and time overlays. There is also a chance of a lot of infrastructure lying idle and we will not be able to use them productively. The return of investment will not come in fast unless this is not solved. So, a task force with the key ministries of finance, road transport, shipping, commerce and railways needs to be created for better asset utilisation.
Balancing transport
To begin with, if you want to promote multi modal transportation, you need to increase the use of containers, the ISO approved ones. These containers can travel across all modes. For the industry to do that, you need to have cost effective models with ready infrastructure. So if you want to move from road to rail to water to road again or coastal and inland waters, you need to have infrastructure that can support seamless movement of cargo across all modes without any delay. We need to create common user facilities where these models can be executed efficiently at a nominal cost. This is where multi modal transportation will gain favour and people will be attract-
VIVEK KELEPRESIDENT, AMTOI
09

ed to it. Currently a cargo owner does not have enough awareness that his goods can be moved using different modes of transport. In India, road is still required for first and last mile transport. Before reducing the dependence on road transportation, promotion of other modes of transport with infrastructure created for the same is required.
Because of our industrial development policy over the years has led industries to come up in the hinterlands across India, there are none along the ports. So, if we have to promote coastal transportation and the industries are deep in the hinterland, it becomes a challenge. So, that is the hard ground you are beginning with. You need a policy like Sagarmala, but its effect will be seen only in the next 15 years or so.
Aspects of transportation
Our approach has been unimodal so far with each ministry promoting its own sector. There has to be a conscious effort from the government to ensure all of these ministries work together in promoting multi modal transportation. I think if we are able to create a platform or department to look in to this, it will be helpful for trade. We need logisticians who can guide the industry on the best way to move cargo in India in different terrains.
Secondly, we need a dedicated logistics cadre who can take charge and run ports, IWT and other new infrastructure that is coming up. A similar cadre like IRTS can be created to the officers work across the different modes of transport and work in unison to drive growth of multi-modal transportation.
Container market view
The growth is flat as there is still excess supply of tonnage. And with no major rise in consump-tion globally, the growth patterns are not going to change. So from what we see, we are going to have a similar situation of depressed freight rates in the next six months to a year.
Organising the sector
GST will change the transportation sector as the warehousing and storage patterns will change. Two, they are looking at introducing the e-pass system at toll gates. Three, the government is pushing skill development and so in a few years from now, we will probably have better quality truck drivers. All this is going to bring in efficiency and sophistication in the transportation system. But these initiatives being successful will depend on the suc-cess of the GST coming through.
10

India has emerged as the fastest growing major economy in the world. According to the Econom-ic Survey 2015-16, the Indian economy will continue to grow more than 7 per cent in 2016-17. As per the global consumer confidence index created by Nielsen. India’s consumer confidence in Q1 2016 highest since pre-global recessions levels. Do not see any improvement in India’s export performance as the uncertainty in the global economy continues to persist and there is no sign of global demand picking up. Industry is looking forward to domestic reforms like implementation of GST at the earliest aimed at improving export competitiveness. Currently market is going through difficult period where rates have rock bottomed and inventory is surplus. Volumes have dropped due to global slowdown. Imbalance in Exim trade continues to add on the operating cost. For Inland ICDs rail cost is a major concern. Due lack of cargo and proper infrastructure at hinterland, multiple handling of equipment is leading to increase in the cost. Long staying containers has been one of the major issue at major ICD in North India and till date no solution has been provid-ed by the concerned authorities. Since this issue is localized, all is need a dedicated task force with timeline to address old cases and put SOP in place for future.
Year 2017 though some improvement is expected. Following factors will play important role on shipping at North:
• Gap in supply and demand
• New alliances
• Consolidation
Industry is upbeat about expected rise in domestic consumption once GST is implemented but increase in export volumes will depend upon global market conditions. Good rains are expected this year which may drive increase in agri export. At Inland, with number of ICDs no proper common storage place with reasonable cost and repair facility adding to the cost.
CAPT A K KAURAPRESIDENT, NORTHERN INDIA STEAMER AGENTS ASSCOAITION
11

Container market outlook
I think in the Indian perspective if you look at the first six months, there has been an increase in the volume. If we look at Europe, there is a ten percent increase in volumes compared to last year. What we find is that volumes to China and Far East are this year are lower than last year because the whole slow down in China. China is sourcing less of commodities. That market is down. What is hitting us is over capacity. That is the main culprit.
If you look at India, everybody has increased vessel size as shipping lines are trying to cut costs. We have bigger vessels now too and that will affect the market. If the growth in the market is not greater than the demand and supply mismatch, then I do not think it will be beneficial for the industry. So, there is growth in volume, but we are unable to reap the benefits because of excess tonnage. So, in the first half, volumes have grown in the major direction. US, Europe there has been small growth. In most trades, the rates have come down by last year by 60 percent because of overcapacity.
Growth opportunities
So our estimates on the first half of India like I said is in the close to ten percent range up to to May. The reefer business has done well compared to last year with fruit. I think sourcing from India is increasing and the country seems to be a bigger market for everyone. This is one market that looks positive and they are trying to put in more vessels here. There is a gradual increase in the size of vessels as they bring in bigger ships they are trying to cut costs and aim for growth.
Containerisation of commodities
So, this year the reefer season has been pretty good in the first quarter from Feb to May. Grapes from India, particularly. Everything else is on a rise apart and Hapag Llyod is doing better on all fronts compared to the others with project cargo growing too. Commodities such as sugar, gran-ite and cotton can completely shift to getting containerised. But it depends on the freight rates of bulk vessels. But the lines are not after containerising cargo.
Challenges in Indian market
I think the biggest challenge is infrastructure, the frequent shutdowns and other issues. On an average a shipping line executive in India spends time resolving issues of the customers than on
CAPT DHEERAJ BHATIAMANAGING DIRECTOR, HAPAG LLOYD INDIA.
12

building business. Because of poor infrastructure all the way, there is a lot of work that happens behind the scenes to make things work. The other challenge is connectivity because even today 50 percent of our volumes are going towards far east which is towards the right and 40 per cent of the cargo comes from Delhi and NCR and we are having to bring the vessel to Nhava Sheva or Mundra. The government should improve the roads and rail connectivity to the East Coast so cargo can go to China directly. It is also because the trade is used to going towards the Western India.
Hapag Lloyd’s business focus
In general, the second half of the year is better. To Europe and US we do expect the volumes to be better. The outlook has to be looked at in two ways. How the volume is growing and compare that against the demand and supply. How much this situation will improve, I have my doubts. But I do think volumes are growing. Not by a large percentage, but just by three or four percent globally and in India by seven to eight percent/ The Far East is showing poor signs this year. Because we are having better monsoons and better rains. This impact will be seen next year and not immediately.
Government initiatives
As a shipping line, we welcome more attention to this sector. But there are too many knots to untie and too many links to this business. Ports, logistics, roads are linked to this business and more than anything it is manufacturing. How can we expect this industry to take off without any uptick in manufacturing? So, the new government has all the plans to improve the manufacturing sector; we need to see that grow. Port-led industrial development and infrastructure within and outside the port are crucial for customers to benefit from. Internal transportation is where we will need more investments.
13

Current market scenerio
The market is a little challenging and it will remain so. We foresee the market to continue like this for some more time, at least all of 2016 with no changes there. Hopefully, something can come in by 2017.
Freight rates
The recovery again depends on the market’s performance. I don’t think anything is being done for the market to recover. We have to analyse why the market went down. For one, there has been an excess tonnage in the container industry and the business has dropped. The global economy too has not been doing great. Except for the tankers that are doing better, offshore, bulk and containers have been a bit of a drag. The container segment has just about been managing to continue with better prospects till last year. But now it has come to a low level and unless the global economy revives or tonnages or new orders are scaled down, I do not see the industry recovering immediately. If new vessels come by in the larger segments, then the freight rates will get depressed again. May be the lower segment up to 2,000 teu will do well because not many vessels have been ordered in this space. But overall, when the freight is depressed, we don’t find the freights going up on the smaller vessels on the small hauls as well. That’s the effect on us as regional, coastal players feel.
Coastal shipping market
Of late, even in Indian container scenario or the coastal scenario, a similar effect is being felt. We are feeling the pinch. But this was of course expected. If you see our performance in 2015, there were lots of opportunities on the coast. Here the market is very small; if you increase the capac-ity even by a little, there will be an imbalance and with that, the gap becomes wider. The coastal shipping market too will mimic the the exim trade’s pattern.
Because if you exactly see the coastal trade overall, we are doing something around 3.5mn tonnes of domestic volumes on the containers on the coast for the year. If you look at the tonnage availability today, it is in excess of 0.5 million a month on one leg. That means 12 million tonnes capacity of tonnage per month. Unless this capacity is absorbed, we go the main lines way.
CAPT VK SINGHCEO, SHREYAS SHIPPING & LOGISTICS LIMITED
14

Drawbacks for coastal trade
Absence of cargo is the major drawback. About 60 per cent that we carry is out of one industry which is situated closer to the coast in hinterland. So, we need many more industries along the coastline. If we have industries deeper in the hinterland, then coastal shipping will not work be-cause if you have a larger first mile or last mile distance, there’s no point of talking about coastal movement. Coastal movement is not about moving cargo from port to port. It is movement of cargo from the industry to the final destination. Also, India’s geographical layout is peninsular. So, if cargo were to move from Gujarat to West Bengal, the distance by road is 2,300km and by sea is 8,500 km. So, if you want to move 3.5 times the distance, why would one want to shift to sea mode unless it is cheaper and faster? So, India’s coast is not like China’s. So you cannot say that China is moving 30 per cent of cargo is moving by sea, so India’s also should move at the same pace. We do not have return cargo, so our costs would go up. Here the burden is on one way. To add to it, port costs are expensive. This makes coastal shipping expensive.
Not an easy market
They made sound so because we had a first mover advantage. When we were controlling the market and tonnage, we were growing. Today if I say, 60 to 70 per cent of tonnage is on the east coast, it might seem unbelievable. They sought similar growth too. But after coming in, they’re realising that it’s not that easy. In India we have grown because we have taken the plunged, absorbed the cost and taken a beating and yet done business on the east coast which was a tough market. Secondly, they find India a suitable home for their vessels as they’ve not been so profitable in the other regions.
Coastal cargo
On the domestic side, it is mainly it is big cargo. Construction material to start with, tiles and granite form the bulk of containerised cargo. Marble from Rajasthan, cotton and cement have started coming in too. Some minerals and food grains do get containerised too on a easonal basis
Unless we do something drastic about developing industrial belts along the coast, the industry will not pick up. Although the Sagarmala project has been envisioned this for this particular reason, it may take a few years before we see it happening. The government is looking at a modal shift of cargo and it has to provide a little more incentive for the shift to happen. There is greater awareness of coastal shipping on the eastern region now and any help from the government will aid growth.
15

Drivers for container growth
India’s GDP has grown progressively over the past two decades due to a combination of factors, including the export-import (EXIM) trade volume, which has been increasing at a higher rate than the GDP. This has driven growth in container traffic, as shippers are increasingly digressing from general or bulk shipping to container transport. Rising containerisation levels for erstwhile break-bulk commodities have increased India’s share in global container traffic.
From my view, I see that trade has begun to pick up from the second quarter of the year 2016 in comparison to the previous quarter. We can expect a positive outlook in the third and fourth quarters as well and further.
Containerisation levels
About 22 per cent of general cargo is containerised in India where as in China, the scope of containerisation is 65 per cent. All other developed nations have 80 per cent containerised cargo. This tells us that there is a huge gap between containerised cargo and general cargo in India. Containerised cargo is proven to be more efficient and cost effective by providing faster mode of transportation.
Challenges of Indian market
The three main challenges as I view it are speedy evacuation of cargo/containers i.e. to and from the port, absence of a sound inland waterways transportation system and a well connected coastal shipping and transportation system to ensure faster movement of cargo between the ports.
Government initiatives
All developing countries are keen to attract foreign investment and the current Indian government is taking appropriate steps by opening new sectors to FDI, by opening eight to nine sectors for receiving investment from other destinations and institutions. The whole of Indian Inc. welcomes the government’s decision of easing FDI norms. It sends a positive signal to investors. Liberalisa-tion of FDI in important sectors such as Defence, Manufacturing among others will bring in much - needed technology into the country which can then be leveraged to make India an exporting nation in the high-tech engineering industries. And yes, definitely the ports and shipping indus-tries will be a beneficiary of FDI opened to major sectors by establishing port based industries.
ENNARASU KARUNESANCEO – APSEZ MUNDRA & TUNA PORTS, ADANI PORTS & SEZ LTD
16

This is again an affirmation of the government’s commitment to strengthen the economy.
My first steps would be to revamp the policy to adopt the current economic conditions. Next would be to create more awareness on the ports sector for people to come and invest and finally create and offer a collaborative approach for the government and private players to work together.
New SOLAS guidelines
A welcome step for India is the new SOLAS rule to enforce container weighment. To support a safety-conscious culture, the cargo owners should declare the exact weight of container and terminal equipment can facilitate the same.
Competition from neighbours
Competition is always there in every operating system. Let’s get our acts together to facilitate the India EXIM trade for the benefit of our consignees or shippers.
17

Growth of Container Traffic in IndiaContainer handling at Indian ports has grown at a CAGR of 8 per cent over the last 10 years. In terms of throughput top three container ports are JNPT, Mundra and Chennai together controlling almost 75 per cent of India’s total container traffic.
30%
25%
20%
15%
10%
5%
0%
-5%
-10%
14
12
10
8
6
4
2
02005
14% 17%
26%
10%
-5%
2006 2007 2008 2009 2010 2011 2012 2013
(Thr
ough
put (
mill
ion
teu)
Y-o-
Y gr
owth
in %
2014 2015
18%
7%
3%
5%
12%
2%
Fig 1: India’s historical container traffic (million teu)
INDIAN CONTAINER MARKET: AN OVERVIEW
Calender year
Throughput Annual growth - RHS
18
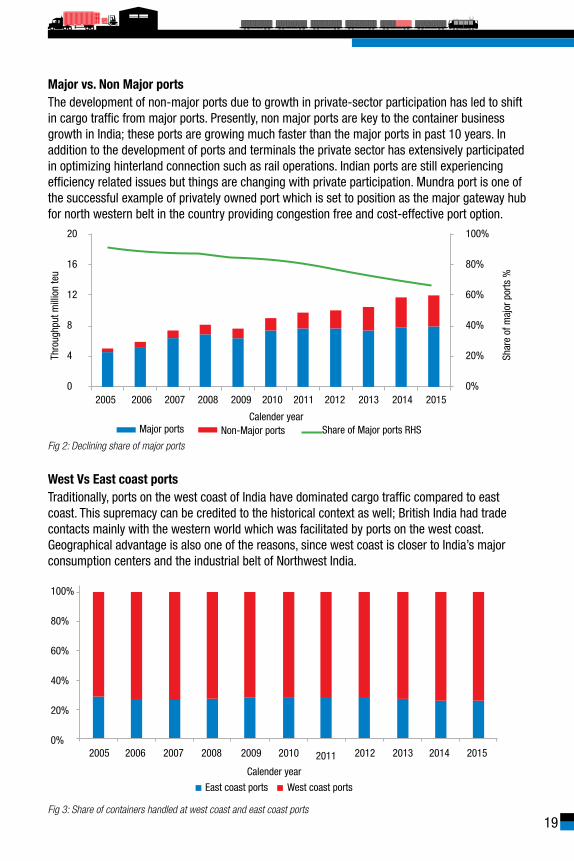
Major vs. Non Major portsThe development of non-major ports due to growth in private-sector participation has led to shift in cargo traffic from major ports. Presently, non major ports are key to the container business growth in India; these ports are growing much faster than the major ports in past 10 years. In addition to the development of ports and terminals the private sector has extensively participated in optimizing hinterland connection such as rail operations. Indian ports are still experiencing efficiency related issues but things are changing with private participation. Mundra port is one of the successful example of privately owned port which is set to position as the major gateway hub for north western belt in the country providing congestion free and cost-effective port option.
West Vs East coast portsTraditionally, ports on the west coast of India have dominated cargo traffic compared to east coast. This supremacy can be credited to the historical context as well; British India had trade contacts mainly with the western world which was facilitated by ports on the west coast. Geographical advantage is also one of the reasons, since west coast is closer to India’s major consumption centers and the industrial belt of Northwest India.
Fig 3: Share of containers handled at west coast and east coast ports
Fig 2: Declining share of major ports
Shar
e of
maj
or p
orts
%
Thro
ughp
ut m
illio
n te
u
100%
80%
60%
40%
20%
0%
20
16
12
8
4
02005 2006 2007 2008 2009 2010 2011 2012 2013 2014 2015
Major ports Non-Major ports Share of Major ports RHS
East coast ports West coast ports
100%
80%
60%
40%
20%
0%2005 2006 2007 2008 2009 2010 2011 2012 2013 2014 2015
Calender year
Calender year
19

UNCOMTRADE database was used for getting the trade figures
for India’s exports and imports. The data was extracted at the
HS2 digit (Chapter) level of the Harmonised System (HS) 2002.
After data extraction, pure bulk commodities (e.g., Ores, Crude oil)
were eliminated from the list. Only containerised/containerisable
commodities were considered in the list. Data was sorted on the
basis of volume (in tonnes) to get the high volume goods. For high
growth goods, CAGR of 5 years (2011 to 2015) was used with a
minimum threshold value of 0.5 million tonnes in 2015. All the pie
charts (partner profiles) are based on 2015 data.
Although the classifications were purely based on HS2 digit
products, similar commodities were clubbed together. Chapter 72
& 73 were clubbed together and named as Iron and steel prod-
ucts. Further, Chapter 50 to 63 were clubbed together and named
as Textiles & garments. All volumes and values mentioned in the
commodity profiles are based on calender year data.
COMMODITY PROFILES - RESERACH
METHODOLOGY
20

MAJOR COMMODITIES BY VOLUME -
TOP 5 EXPORTS
21

EXPORT VOLUMES
1 CEREALS
Cereals constitute a share of 7.2% share in India’s total exports in terms of volume. It has grown with a CAGR of 7% during the last five years (CY2011-CY2015). India is a major exporter of cereals and second largest producer of rice. Rice (including Basmati and Non- Basmati) occupy major share (about 65%) in India's total cereals export while other cereals including wheat represent 35% share. Major states producing rice are Punjab, Uttarakhand, and Uttar Pradesh. Likewise, the major importing countries of India's cereals during this period were Bangladesh, Saudi Arabia, and UAE.
OVERVIEW
MAJOR DESTINATIONS
9.7
19.8 21.0 19.4
12.9 5.4
8.7
10.9 10.1
6.8
0
3
6
9
12
0
6
12
18
24
2011 2012 2013 2014 2015
Billi
on U
S$
Mill
ion
Tonn
es
Volume (Million Tonnes) Value (Billion US$)-RHS
Bangladesh 10%
Saudi Arabia 9%
Nepal 7%
UAE 7%
Senegal 7%
Iran 7%Benin 4%
Iraq 4%
Cote d'Ivoire 3%
Guinea 3%
Others 39%
22

OVERVIEW
EXPORT VOLUMES
2 IRON AND STEEL PRODUCTS
The steel industry in India witnessed a rapid rise in production over the past few years on the backdrop of capacity enhancement. This has resulted in India becoming the third largest producer of crude steel. Turbulence in global economy has affected adversely on the global steel demand. This has resulted in decline in steel and steel products exports in recent years. Recently the government has raised the import tariff on steel to protect domestic steel manufacturers from cheap Chinese steel. However, the engineering and manufacturing firms in the country are now demanding to lift the tariff to reduce raw material cost and make the end products competitive in the international market.
MAJOR DESTINATIONS
12.4 12.2
16.1 14.9
11.6
14.4 15.4
17.6 16.6
12.8
0
5
10
15
20
0
5
10
15
20
2011 2012 2013 2014 2015
Billi
on U
S$
Mill
ion
Tonn
es
Volume (Million Tonnes) Value (Billion US$)-RHS
USA 9%UAE 8%
Nepal 6%
Italy 6%
Iran 5%
Bangladesh 5%
Saudi Arabia 3%
Thailand 3%Belgium 3%
Korea 2%Spain 2%
Sri Lanka 2%
Iraq 2%
Japan 2%
Germany 2%
Malaysia 2%
China 2%
Others 37%
23

EXPORT VOLUMES
3 TEXTILES & GARMENTS
India is one of the largest producer and exporter of textile and garment in the world. The industry has a very strong base in the country with wide range of fibre/yarns from natural fibres like cotton, jute, silk, wool and synthetic /man fibres. India is the second largest producer of raw cotton and cotton yarn. Asian countries including China dominate the apparel and textile exports and India not far behind. However, with the escalating cost and increasing domestic demand in China, its export growth is expected to come down. This can be an opportunity for India to tap additional market share.
MAJOR DESTINATIONS
6.1 6.5
9.1
6.9 6.6 33.4 32.7 40.2 38.6 37.2
0
10
20
30
40
50
0
2
4
6
8
10
2011 2012 2013 2014 2015
Billi
on U
S$
Mill
ion
Tonn
es
Volume (Million Tonnes) Value (Billion US$)-RHS
China 19%
Bangladesh 12%
USA 10%
Pakistan 6%
Turkey 5%Korea 3%
Vietnam 3%
UAE 2%
Egypt 2%
Others 38%
OVERVIEW
24

EXPORT VOLUMES
4 SUGARS AND SUGAR CONFECTIONERY
India is one of the major global producers of sugar along with Brazil, and China. Major sugar producing states are Uttar Pradesh, Maharashtra, Karnataka, Tamil Nadu, Andhra Pradesh, Telangana, Bihar, Gujrat and Uttarakhand.
MAJOR DESTINATIONS
3.2
4.1
2.4 2.8
3.6
2.1 2.2
1.2 1.3 1.4
0
1
2
3
4
5
0
1
2
3
4
5
2011 2012 2013 2014 2015
Billi
on U
S$
Mill
ion
Tonn
es
Volume (Million Tonnes) Value (Billion US$)-RHS
Sudan 14%
Myanmar 13%
Somalia 9%
Sri Lanka 7%
UAE 5% Netherlands 5%
Tanzania 3%
South Africa 3%
Pakistan 3%
Others 38%
OVERVIEW
25

EXPORT VOLUMES
5 PLASTIC PRODUCTS
India is one of the major exporters of plastic in the developing world. The products range from raw materials to finished goods, such as, polyester films, plastic woven sacks and bags, electrical accessories etc. Exports of plastic finished goods have increased double fold during 2007 to 2012. But fierce competition from countries such as China, Taiwan and other regional countries are restricting growth. Exports during 2011 till 2015 have hovered around 5.5 million tonnes. The exports of value added plastic products could be a huge growth opportunity for India as the country has excellent potential in terms of capacity, infrastructure and cheap labour availability. The industry is less dependent on imports as the raw materials, including polypropylene, high-density polyethylene, PVC are manufactured domestically.
MAJOR DESTINATIONS
3.0 2.6
3.7
2.7 2.9
5.5 5.0
6.3 5.5
5.1
0
2
4
6
8
0
2
4
6
8
2011 2012 2013 2014 2015
Billi
on U
S$
Mill
ion
Tonn
es
Volume (Million Tonnes) Value (Billion US$)-RHS
China 8%USA 8%
Turkey 6%Italy 5%
UAE 5%Bangladesh 4%
Nepal 3%
Pakistan 3%Saudi Arabia 2%
Egypt 2%Vietnam 2%UK 2%
Germany 2%
Nigeria 2%
Indonesia 2%
Sri Lanka 2%
Israel 2%
Others 38%
OVERVIEW
26

MAJOR COMMODITIES
BY HIGH GROWTH - TOP 5 EXPORTS
27

EXPORT VOLUMES
1 ALUMINIUM PRODUCTS
In India’s total export volume, aluminium registered a CAGR of 24% during CY2011-15. In line with rising aluminium exports, production capacity rose to 2.65 million tonnes in 2015-16 from 1.8 million tonnes in 2013-14, with a y-o-y increase of 21%. Aluminium production is mainly concentrated around Chhattisgarh, Madhya Pradesh, Odisha, Uttar Pradesh and Tamil Nadu. High growth in exports in 2015 is also attributed to the slowing aluminium demand within the country. During FY2015-16, Hindalco, one of the major aluminium producers in the country exported half of its production compared to a fifth in the previous year.
MAJOR DESTINATIONS
0.5 0.6 0.7
1.0 1.1
1.4 1.6
2.1
2.6 2.7
0
1
2
3
4
0.0
0.5
1.0
1.5
2.0
2011 2012 2013 2014 2015
Billi
on U
S$
Mill
ion
Tonn
es
Volume (Million Tonnes) Value (Billion US$)-RHS
Korea 26%
Mexico 10%
USA 8%
Malaysia 7%Taiwan 4%
Turkey 4%
Singapore 3%
Others 38%
OVERVIEW
28

EXPORT VOLUMES
2 ANIMAL & VEGETABLE FATS, OILS
Animal & vegetable fats and oil exports grew at a CAGR of 7% during CY2011-CY2015. Karnataka, Andhra Pradesh Maharashtra and Bihar are the major states producing oil seeds which are processed into vegetable fat. Vegetable fat is the major export item. India exports particularly oilcakes and oilseeds to advance countries like China, Netherlands, France USA and Malaysia.
MAJOR DESTINATIONS
0.5 0.6
0.7 0.6 0.7
1.0 1.0 1.0 0.9 0.9
0.0
0.5
1.0
1.5
2.0
0.0
0.5
1.0
1.5
2.0
2011 2012 2013 2014 2015
Billi
on U
S$
Mill
ion
Tonn
es
Volume (Million Tonnes) Value (Billion US$)-RHS
China 33%
Netherlands 13%
France 10%
USA 10%
Malaysia 7%
Others 27%
OVERVIEW
29

EXPORT VOLUMES
3 PAINTS & DYEING MATERIALS
Exports of paints & dyeing materials grew at a CAGR of 6% during CY2011-CY2015. Maharashtra and Gujarat account for majority of dyestuff production due to availability of raw materials and dominance of textile industry. India already has a strong presence in the export market of the sub-segments of dyes, pharmaceuticals and agro chemicals. Exports of dyes are also expected to increase due to the shift of production bases from developed countries to India on account of stringent pollution control measures being adopted in those countries. India exports dyes to Germany, UK, US, Bangladesh, Spain, Turkey, Singapore and Japan.
MAJOR DESTINATIONS
0.5 0.6 0.7 0.7 0.6
1.2
1.5 1.6
1.4 1.4
0.0
0.5
1.0
1.5
2.0
0.0
0.5
1.0
1.5
2.0
2011 2012 2013 2014 2015
Billi
on U
S$
Mill
ion
Tonn
es
Volume (Million Tonnes) Value (Billion US$)-RHS
Bangladesh 7%Germany 7%
USA 6%
Turkey 6%
China 4%
Brazil 3%
Italy 3%
Indonesia 3%
Korea 3%UAE 3%
Pakistan 3%Thailand 3%Egypt 2%
Singapore 2%
Netherlands 2%
Sudan 2%
Spain 2%
Others 38%
OVERVIEW
30

EXPORT VOLUMES
4 ELECTRICAL & ELECTRONIC EQUIPMENTS
The Indian Electrical Equipment (IEE) industry, which includes power generation and transmission & distribution (T&D) equipment, is very matured. There is huge transformer manufacturing capacity and India is catering to the need of many developing nations around the world. Similarly, insulated wire exports are also increasing.
MAJOR DESTINATIONS
0.6 0.6 0.6 0.7
0.6
11.7 10.8 11.2
9.0 7.9
0
5
10
15
0.0
0.5
1.0
1.5
2011 2012 2013 2014 2015
Billi
on U
S$
Mill
ion
Tonn
es
Volume (Million Tonnes) Value (Billion US$)-RHS
UAE 12%USA 11%
Germany 7%
UK 5%
Saudi Arabia 4%
Singapore 3%
Iran 2%
Oman 2%
Turkey 2%Nigeria 2%
Bangladesh 2%France 2%
Spain 2%
Myanmar 2%
Australia 1%
Sri Lanka 1%
Others 40%
OVERVIEW
31

EXPORT VOLUMES
5 ART OF STONE, PLASTER, CEMENT, ETC
India has been known for decades for its stone industry and it is one of the biggest exporters of natural stone and monuments in the world. The majority of factories are in Tamil Nadu. The demand for artefacts especially carved work is on the rise all over the world. These include articles made up of granite, marble, plasters and cement. The main markets are USA, UAE, Turkey and Saudi Arabia.
MAJOR DESTINATIONS
1.9 1.7
2.2 2.2 2.1
1.0 1.1 1.4 1.4 1.3
0
1
2
3
0
1
2
3
2011 2012 2013 2014 2015
Billi
on U
S$
Mill
ion
Tonn
es
Volume (Million Tonnes) Value (Billion US$)-RHS
USA 20%
UAE 10%
Turkey 6%
Saudi Arabia 6%
Egypt 4%Germany 4%UK 4%
Vietnam 3%
Italy 2%
Poland 2%
Others 39%
OVERVIEW
32

MAJOR COMMODITIES BY VOLUME -
TOP 5 IMPORTS
33

IMPORT VOLUMES
1 IRON AND STEEL PRODUCTS
Import of iron and steel products rose at a CAGR of 6% during CY2011-CY2015 to reach 21.2 million tonnes. Iron imports rose moderately till 2014. However, there was a sharp rise of 32% year-on-year in 2015. Steel scrap constitutes about 30% of this import. India's steel industry is expected to boost its scrap consumption over the next few years. Imports of steel scraps are expected to rise in coming years due to strong demand for steel.
MAJOR SOURCES
16.8
19.5
14.5 16.1
21.2 17.4
18.0
13.9 15.4
15.5
0
6
12
18
24
0
6
12
18
24
2011 2012 2013 2014 2015
Billi
on U
S$
Mill
ion
Tonn
es
Volume (Million Tonnes) Value (Billion US$)-RHS
China 23%
Korea 15%
Japan 12%
UAE 5%South Africa 5%
USA 5%
Others 35%
OVERVIEW
34

IMPORT VOLUMES
2 ANIMAL & VEGETABLE FATS & OILS
Imports of Animal/vegetable fats and oil rose at a CAGR of 18% during last five years. India, the world's leading buyer of vegetable oil, mostly imports palm oil followed by soybean and sunflower oil. Imports are getting cheaper following measures taken by Indonesia and Malaysia – two of the world's top palm oil producers to clear their huge stock. Domestic demand is expected to rise as household consumption of oil is bound to increase due to the demographic change.
MAJOR SOURCES
7.8
10.1 11.0
12.2
15.1
9.2
11.0
9.8 10.6 10.5
0
4
8
12
16
0
4
8
12
16
2011 2012 2013 2014 2015
Billi
on U
S$
Mill
ion
Tonn
es
Volume (Million Tonnes) Value (Billion US$)-RHS
Indonesia 39%
Malaysia 25%
Argentina 17%
Ukraine 10%
Brazil 5% Others 4%
OVERVIEW
35

IMPORT VOLUMES
3 PLASTIC PRODUCTS
Import of plastic products rose at a CAGR of 15% in the last five years’ (CY2011-CY2015). Ethylene and Polyvinyl Chloride (PVC) are major products. In India, demand for PVC is driven by the agriculture and construction sector. PVC pipes for irrigation and water distribution account for a bulk of the country’s demand as domestic production fails to keep pace. Demands for such plastic products are expected to rise further in coming years. PVC is consumed by a large number of small and medium sized manufacturers to make finished products.
MAJOR SOURCES
3.8
5.0 5.2 6.1
6.7
8.0 9.3
10.0
11.8 11.4
0
3
6
9
12
0
2
4
6
8
2011 2012 2013 2014 2015
Billi
on U
S$
Mill
ion
Tonn
es
Volume (Million Tonnes) Value (Billion US$)-RHS
Korea 12%
China 12%
Saudi Arabia 11%
Taiwan 9%
UAE 8%Singapore 7%
Thailand 6%
Others 35%
OVERVIEW
36

IMPORT VOLUMES
4 EDIBLE VEGETABLES, ROOTS & TUBERS
Import of edible vegetables, roots & tubers increased at a CAGR of 14% during CY2011-CY2015. Leguminous vegetables, dried shelled fruits continue to be largest segment of import trade. India is also one of the major importers of leguminous vegetables like Peas, Lentils Seeds, Broad beans, kidney beans etc. Major import sources are Canada, Myanmar and Australia.
MAJOR SOURCES
3.2 3.8 3.8
4.5
5.5
1.9 2.3 2.3
2.7
3.7
0
2
4
6
0
2
4
6
2011 2012 2013 2014 2015
Billi
on U
S$
Mill
ion
Tonn
es
Volume (Million Tonnes) Value (Billion US$)-RHS
Canada 45%
Myanmar 15%
Australia 10%
Russia 8%
USA 4%
Others 18%
OVERVIEW
37

IMPORT VOLUMES
5 PULP OF WOOD OR OTHER FIBROUS MATERIAL
Import of wood pulp grew at a CAGR of 10% during CY2011-CY2015. India is a wood fiber deficient country, with the domestic demand and supply widening every year. Therefore, domestic manufacturers are looking towards cheaper imports to fulfill their demand.
MAJOR SOURCES
3.0 3.3 3.6
4.4 4.4
1.3 1.3 1.4 1.7 1.6
0
1
2
3
0
2
4
6
2011 2012 2013 2014 2015
Billi
on U
S$
Mill
ion
Tonn
es
Volume (Million Tonnes) Value (Billion US$)-RHS
USA 33%
UAE 8%
UK 6%Canada 5%South Africa 5%
Sweden 4%
Indonesia 4%
Others 35%
OVERVIEW
38

MAJOR COMMODITIES
BY HIGH GROWTH - TOP 5 IMPORTS
39

IMPORT VOLUMES
1 SUGARS AND SUGAR CONFECTIONERY
Sugar and sugar confectionary imports increased at an astounding CAGR of 93% during CY2011-CY2015. International price of sugar is currently low which is offering incentive for importers to replace domestic supply of beet sugar with cheaper imports for producing finished goods. Substantial part of India’s sugar imports came from Brazil (more than 90%).
MAJOR SOURCES
0.1
0.80.9
1.51.7
0.1
0.5 0.50.6 0.6
0.0
0.5
1.0
1.5
2.0
0.0
0.5
1.0
1.5
2.0
2011 2012 2013 2014 2015
Billi
on U
S$
Mill
ion
Tonn
es
Volume (Million Tonnes) Value (Billion US$)-RHS
Brazil 94%
Nepal 2%
China 2%
United States 0% Germany 0%Others 2%
OVERVIEW
40
IMPORT VOLUMES
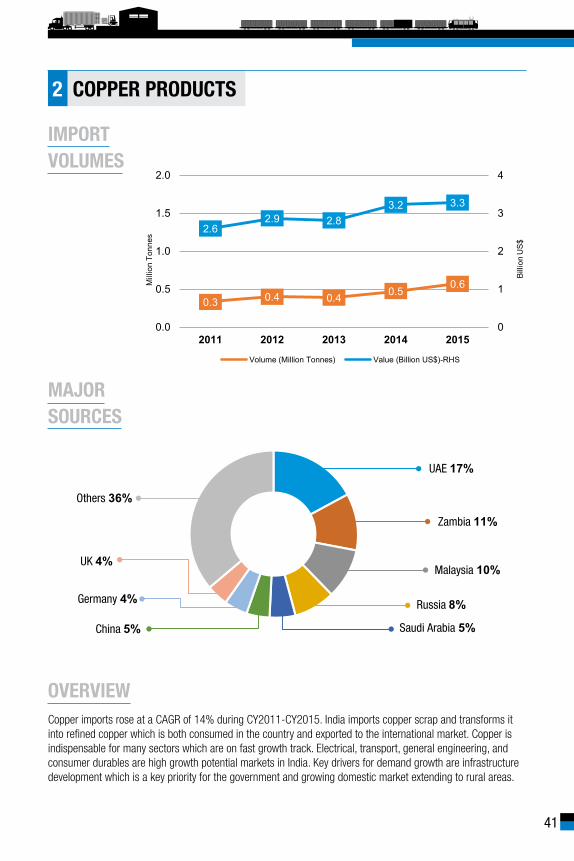
2 COPPER PRODUCTS
Copper imports rose at a CAGR of 14% during CY2011-CY2015. India imports copper scrap and transforms it into refined copper which is both consumed in the country and exported to the international market. Copper is indispensable for many sectors which are on fast growth track. Electrical, transport, general engineering, and consumer durables are high growth potential markets in India. Key drivers for demand growth are infrastructure development which is a key priority for the government and growing domestic market extending to rural areas.
MAJOR SOURCES
0.3 0.4 0.4 0.50.6
2.62.9 2.8
3.2 3.3
0
1
2
3
4
0.0
0.5
1.0
1.5
2.0
2011 2012 2013 2014 2015
Billi
on U
S$
Mill
ion
Tonn
es
Volume (Million Tonnes) Value (Billion US$)-RHS
UAE 17%
Zambia 11%
Malaysia 10%
Russia 8%
Saudi Arabia 5%China 5%
Germany 4%
UK 4%
Others 36%
OVERVIEW
41

IMPORT VOLUMES
3 RUBBER PRODUCTS
Imports of rubber products increased at a CAGR of 10% in the last five years (CY2011-CY2015). Indian rubber industry is unique in the sense it is a major producer and consumer of natural rubber. Major import sources are Indonesia, Korea and UK.
MAJOR SOURCES
0.81.0 1.1
1.3 1.4
3.53.9
3.5 3.42.9
0
1
2
3
4
0.0
0.5
1.0
1.5
2.0
2011 2012 2013 2014 2015
Billi
on U
S$
Mill
ion
Tonn
es
Volume (Million Tonnes) Value (Billion US$)-RHS
Indonesia 16%
Korea 14%
UK 12%
Thailand 11%Vietnam 6%
Russia 5%
Others 36%
OVERVIEW
42

IMPORT VOLUMES
4 ALUMINIUM PRODUCTS
Indian import of aluminium grew at a CAGR of 12% during CY2011-CY2015. Although India has large bauxite reserves, converting the metal for its scraps is always cost effective. Therefore, about half of the India’s imports in this category is scrap. As discussed above, this metal and its products are also categorised in high growth exports mostly unwrought aluminium.
MAJOR SOURCES
1.0 1.3
1.4 1.5
1.7 2.8
3.1 3.2 3.6 3.6
0
1
2
3
4
0.0
0.5
1.0
1.5
2.0
2011 2012 2013 2014 2015
Billi
on U
S$
Mill
ion
Tonn
es
Volume (Million Tonnes) Value (Billion US$)-RHS
China 15%
UAE 13%
UK 7%
Saudi Arabia 7%
Malaysia 6%USA 5%
Australia 4%
South Africa 4%
Others 39%
OVERVIEW
43

IMPORT VOLUMES
5 TEXTILES & GARMENTS
Indian import of textiles and garments rose at a CAGR of 8% during CY2011-CY2015. Imports in this category mostly constitute yarns, bed accessories and other furnishings fabrics. China, Bangladesh and USA are among major import partners of India.
MAJOR SOURCES
1.5 1.7 1.7
1.9 2.1
4.9 5.2 5.4 5.9 5.9
0
2
4
6
0
1
2
3
2011 2012 2013 2014 2015
Billi
on U
S$
Mill
ion
Tonn
es
Volume (Million Tonnes) Value (Billion US$)-RHS
China 23%
Bangladesh 15%
USA 13%
Indonesia 3%Korea 3%
Thailand 3%
Others 40%
OVERVIEW
44

INDIAN CONTAINER TERMINALS FACT SHEET
45

46

47

Names Volume Handled Annual Growth
APM Terminals Pipavav Medium Low
Mundra International Container Terminal Medium Low
Adani Mundra Container Terminal Medium High
Adani International Container Terminal High High
Adani Hazira Container Terminal Low High
Paradip Container Terminal Low High
Chennai Container Terminal Medium Medium
PSA Chennai International Terminal Medium Low
Visakha Container Terminal Low High
Krishnapatnam Port Container Terminal Low High
Kattupalli International Container Terminal India Low High
Jawaharlal Nehru Port Container Terminal High Low
JNPT - SWB Low High
Nhava Sheva International Container Terminal Medium Low
Nhava Sheva (India) Gateway Terminal Low High
APM Terminals Mumbai High Low
Bharat Kolkata Container Terminal Medium Medium
Haldia International Container Terminal Low Low
Vallarpadam ICTT Low High
Mumbai Port - Containers Low Low
PSA SICAL Tuticorin Container Terminal Medium Low
Dakshin Bharat Gateway Terminal Low High
New Mangalore Port - Containers Low High
Mormugao Port - Containers Low Medium
Volume(Mi TEUs)* Annual Growth
Low 0-0.5 <5%
Medium 0.5-1 5-10%
High >1 10%+
Reference
* Mi TEUs - Million Twenty Foot Equivalent Unites
PERFORMANCE OF INDIAN CONTAINER TERMINALS (FY 2015-16)
48

DRAFT
QUAY LENGTH(meters)
QUAY CRANES
CARRIERSCALLING
REACH STACKERS
FORK LIFTS
GROUND SLOTS (TEUs)
RMG CRANES
REEFER PLUGS
RTGCRANES
RAILCONNECTIVITY
THROUGHPUT(TEUs)
INSTALLED CAPACITY
(million TEUs) CAPACITYUTILIZATION(percentage)
CARGO PROFILEChemicals, Machinery, Plastics, Vegetable oils, Electrical equipments, Aluminum, Non-ferrous metals, Equipments, Motor Vehicles, RMG, Sporting products, Carpets and other Home textile, Embroidery equipments, Frozen meat, and Engineering goods
MSC, CMT, OEL, Sima Marine, Sea Consortium, CMA CGM, Maersk Line, GLD, Emirates, NYK Line, HSI, HLI, CSAV Group, SCI, X -Press Feeders, Sea Consortium, SMS, MOL, UASC, HJS, OOCL, Hamburg Sud MSP, Hanjin, KMD, HMM, EGI, Wanhai, APL, Yangming
Operated approximatley 150 trains in a month and 90% of this terminal's EXIM handled
by CONCOR's rail connectivity. 15 export trains are placed on daily basis to Delhi, Ludhiana,
Mulund, Ahmedabad, Hyderabad, Nagpur,Jodhpur, Aurangabad,
Vadodara, etc.
AVERAGETURNAROUNDTIME (DAYS)
AVERAGE CRANEMOVES PER HOUR
BERTHS14.0
02712
02
06
03880
52
9723
401,860,283
1.81.4
30
APM TERMINALS MUMBAI
(meters)
YARD AREA(hectares)
00.0
POST PANAMAX 10
103
APM Terminals Mumbai (APMT) Mumbai is India’s largest container terminal handling facility in terms of container throughput and installed capacity. APMT volumes handled in FY 2016 represents approximately 41.42 per cent of JNPT's total capacity. This terminal has witnessed a CAGR of 3.32 per cent during FY2011- FY 2016. APMT contributes approximately 16 per cent to the total Indian containers volumes handled in FY16.
49

1,429,277
DRAFT
QUAY LENGTH(meters)
CARRIERSCALLING
REACH STACKERS
FORK LIFTS
GROUND SLOTS (TEUs)
RMG CRANES
REEFER PLUGS
RTGCRANES
RAILCONNECTIVITY
THROUGHPUT(TEUs)
INSTALLED CAPACITY
(million TEUs) CAPACITYUTILIZATION(percentage)
CARGO PROFILEChemicals, Machinery, Plastics, Vegetable oils, Electrical Equipments, Aluminum, Non-ferrous metals, Motor Vehicles, Knitted garments, Sporting products, Readymade Garments, Carpets, Other home textile, Embroidery equipments, Frozen meat, Medicaments and Engineering goods
HLI, OOCL, NYK Line, CMA CGM, APL Newark, Norfolk, Savannah, Charleston, Port Said, Jeddah
90% of this terminal's EXIM handled by CONCOR's rail
connectivity. 15 export trains are placed on daily basis to Delhi,
Ludhiana, Mulund, Ahmedabad, Hyderabad, Nagpur,Jodhpur,
Aurangabad, Vadodara, Moradabad etc. Direct rail connecitivity to 46 ICDs.
Jawaharlal Nehru Port Container Terminal (JNPCT) is a port owned container terminal of JNPT, largest major port in india. JNPCT has registered a 10.45 per cent growth in FY 2016. Despite, exhausted installed capacity, congestion across the port and tough competition from its peers, still the port maintained impressive growth. This terminal has an excellent connectivity by rail and road to the hinterland with backup infrastructure of 34 CFSs and connectivity with 46 ICDs. With the current trend, JNPCT is projecting to handle around 1,600,000 TEUs during the year 2016-17, which will again result 10 per cent increase over the previous year.
AVERAGETURNAROUNDTIME (DAYS)
AVERAGE CRANEMOVES PER HOUR
BERTHS14.0
03680
08
03
05390
62
10482
18
1.2 114
1.4
18
JAWAHARLAL NEHRU PORT CONTAINER TERMINAL
(meters)
YARD AREA(hectares)
SUPER POST
PANAMAX 09QUAY CRANES
50

82.59
DRAFT
QUAY LENGTH(meters)
CARRIERSCALLING
REACH STACKERS
GROUND SLOTS (TEUs)
REEFER PLUGS
RTGCRANES
RAILCONNECTIVITY
THROUGHPUT(TEUs)
INSTALLED CAPACITY
(million TEUs) CAPACITYUTILIZATION(percentage)
CARGO PROFILEMica, Talcum Powder, Feldspar Powder, Magnesium Silicate, Granite, Ceramic Tiles & Sanitary Wares, Agri Commodities, Speciality Chemicals, Rice , Metals, Minarals, Aluminium Scrap, Chemicals, Wood Products
MSC, UASC, MSC Agency, CSAV Group (CIN), SCI,RSA, J.M.Baxi,USC,RSA, SSG, UASC
Connectivity to all major North & West India ICDs
and operates double stack container trains to ICD Patli & others ICDs in NCR zone.
Adani International Container Terminal(AICT), a joint venture of MSC S. A. and Adani Ports & SEZ Ltd(APSEZ), is emerging as a transshipment hub on Indian West Coast with direct connections to Middle East, South Asia markets. Strategic joint venture with MSC, is a fillip to handle highest transshipment volumes of around 30 per cent in the FY 15 when compared with all the other Indian terminals. This terminal recorded an impressive CAGR of 16.73 per cent during FY 2013- FY 2016 with growth of 18 per cent in total volume handled in FY 16. The major advantages of this terminal include deep draft to handle large container ships & seamless rail and road connectivity to the cargo catchment centres in Northern and Western hinterland.
AVERAGETURNAROUNDTIME (DAYS)
AVERAGE CRANEMOVES PER HOUR
BERTHS16.0
02810
03
4058260
181,073,728
1.30.8
30
ADANI INTERNATIONAL CONTAINER TERMINAL
(meters)
82.6
QUAY CRANESSUPER POST
PANAMAX 06
51

66.65
DRAFT
QUAY LENGTH(meters)
QUAY CRANES
CARRIERSCALLING
REACH STACKERS
FORK LIFTS
GROUND SLOTS (TEUs)
RMG CRANES
REEFER PLUGS
RTGCRANES
RAILCONNECTIVITY
THROUGHPUT(TEUs)
INSTALLED CAPACITY
(million TEUs) CAPACITYUTILIZATION(percentage)
CARGO PROFILEChemicals, Machinery, Plastics, Vegetable oils, Electrical equipments, Aluminum, Non-ferrous metals, Motor Vehicles, RMG, Sporting products, Cotton shirts, Carpets and other Home textile, Embroidery equipments, Frozen meat, and Engineering goods
MSC, CMA CGM, Maersk Line, OOCL, Master Group, APL, UASC, Hanjin, Emirates, MSP, KMD, PIL, ZIM
90% of this terminal's EXIM handled by CONCOR's rail
connectivity. 15 export trains are placed on daily basis
to Delhi, Ludhiana, Mulund, Ahmedabad, Hyderabad,
Nagpur,Jodhpur, Aurangabad, Vadodara, Moradabad etc. direct
rail connecitivity to 46 ICDs.
Nhava Sheva International Container Terminal (NSICT) is DP World's flagship container terminal facility located in JNPT. NCSIT witnessed slight dip in handled volume in FY 16, but on flip side commencement of there another terminal near to existing facility recorded combined throughput of more than 1.2 million teus in FY-16. DP World Nhava Sheva contributes to 18 per cent of India's total container trade from one of the small capacities. DP World Nhava Sheva links to a wide network of ICDs in Pune, Nagpur, Ahmadabad, Hyderabad, Ludhiana and New Delhi through two sets of railway sidings ensures efficient operation. Further the terminal is connected to India’s major highway and rail networks, which give access to all its neighbouring states.
AVERAGETURNAROUNDTIME (DAYS)
AVERAGE CRANEMOVES PER HOUR
BERTHS14.0
02600
03
02
03778
26
6222
29999,680
1.51.4
22
NHAVA SHEVA INTERNATIONAL CONTAINER TERMINAL
(meters)
YARD AREA(hectares)
66.7
POST PANAMAX
SUPER POST
PANAMAX 0206
52

89.60
DRAFT
QUAY LENGTH(meters)
CARRIERSCALLING
REACH STACKERS
FORK LIFTS
GROUND SLOTS (TEUs)
RMG CRANES
REEFER PLUGS
RTGCRANES
RAILCONNECTIVITY
THROUGHPUT(TEUs)
INSTALLED CAPACITY
(million TEUs) CAPACITYUTILIZATION(percentage)
CARGO PROFILEGranite / Marble, HMS, Non Ferrous Scrap (High Value), Auto Parts, Solar Panels, Used Clothing (Rags), Waste Paper, Rubber, Resin , Logs, Minerals
NYK, OOCL, RCL, KMTC, IRISL, NVOCC, HDS, HLL, MBK, XPF, PMA, OEL, Master Marine, RSA, Mater Marine, MBK, ESA, SSK, MSP, HJN,
Handles 160 trains monthly, 80 trains to the NCR Region
(Tuglakabad, Loni, Dadri, Faridabad, Patli, Garhi
Harsaru)
Mundra International Container Terminal Pvt Ltd (MICT), DP World facility in the privately owned largest port of Adani, is one of the most technically advanced port facilities in the Indian Subcontinent. This terminal is reported a steady growth with CAGR of 6.44 per cent during FY 2013- FY 2016. MICT is totally automated and uses a real time tracking system which helps the customers to access status reports on Vessel and Yard electronically. MICT has the maximum rail connectivity to major markets in the hinterland amongst all ports in Gujarat. This terminal constantly invests in infrastructure, equipment, technology and training to increase operational efficiency to ensure a fast turnaround of vessels.
AVERAGETURNAROUNDTIME (DAYS)
AVERAGE CRANEMOVES PER HOUR
BERTHS14.5
02632
02
04
02366
24
5400
18985,627
1.10.5
31
MUNDRA INTERNATIONAL CONTAINER TERMINAL
(meters)
YARD AREA(hectares)
89.6
QUAY CRANES
POST PANAMAX
SUPER POST
PANAMAX 0602
53

93.66
DRAFT
QUAY LENGTH(meters)
CARRIERSCALLING
REACH STACKERS
GROUND SLOTS (TEUs)
REEFER PLUGS
RTGCRANES
RAILCONNECTIVITY
THROUGHPUT(TEUs)
INSTALLED CAPACITY
(million TEUs) CAPACITYUTILIZATION(percentage)
Mica, Talcum Powder Feldspar, Powder, Magnesium Silicate, Granite, CeramicTiles & Sanitary wares, Agri Commodities, speciality chemicals, Rice Metals, Minarals, Aluminium Scrap, Chemicals, specilaity Chemicals, Wood Products,..etc
UASC, CMA CGM S.A., MARINE CONTAINER SERVICES (I). PVT. LTD, TCI SEAWAYS, MBK, SAI, ESA, SSG, SCI, PML, MOL, ULS, ZIM Lines, TCI, JWL, HJS, COSCO, WAN HAI , EMC, NYK, PMA, OOCL, YML, HLL, Simatech, SSK, TSL
Connectivity to all major North & West India ICDs and operates
double stack container trains to ICD Patli & others ICDs in
NCR zone.
AVERAGETURNAROUNDTIME (DAYS)
AVERAGE CRANEMOVES PER HOUR
BERTHS14.5
02631
03
366 4014
20936,599
1.00.78
30
ADANI MUNDRA CONTAINER TERMINAL
(meters)
93.6
CARGO PROFILE
QUAY CRANESSUPER POST
PANAMAX 06
Adani owned Mundra Port is emerged as an alternative gateway for the country's container trade. The port owned container terminal "Adani Mundra Container Terminal (AMCT)" registered a CAGR of 11.58 per cent during FY 2011 - FY 2016 with growth of 12.09 per cent traffic handled in FY 16. This exponential growth is derived from the increase in services, enhanced rail connectvity, especially from north indian inland container depots (ICDs) and the world class operational efficiencies, complemented by the Port's ideal location.
54

72.30
DRAFT
QUAY LENGTH(meters)
QUAY CRANES
SUPER POST
PANAMAX
CARRIERSCALLING
REACH STACKERS
FORK LIFTS
GROUND SLOTS (TEUs)
RMG CRANES
REEFER PLUGS
RTGCRANES
RAILCONNECTIVITY
THROUGHPUT(TEUs)
INSTALLED CAPACITY
(million TEUs) CAPACITYUTILIZATION(percentage)
CARGO PROFILEChemicals, Electrical & Electronic goods, Auto parts & spares, Newsprint, Fruits, Granite, Stones, Onions, Agri products and Automobiles
CMA CGM, Hapag LIoyd, MAERSK LINE, MSC, Hanjin, Simatech, TS Lines, BTL, SCI, Sea Horse, CCG, Seacon, HMM, NYK, RCL, Samudera, APL, Wan Hai, OEL and MSC
Currently using the CONCOR Rail Connectivity 1 km away
from the terminal for Bangalore Market
Chennai Container Terminal - DP World (CCT) has witnessed a CAGR of 8.64 per cent during FY 2013 to FY 2016 with handled volume growth of 5 per cent in FY2016. CCT is trying to attract the hinterland with many effective ways by expanding rail connectivity for the seemless flow of cargo and improvment in vessel turnaround time which has reduced from 7 days in 2001 to less than 24 hours today. This terminal is serving the trade with 8 mainline services connecting over 56 ports in the world and direct services to Europe and the Far East. DP World Chennai supports 60 per cent of South India’s container market and one of the preferred choices for South India’s booming trade.
AVERAGETURNAROUNDTIME (DAYS)
AVERAGE CRANEMOVES PER HOUR
BERTHS13.4
04885
0802
01
03355
18
3960
23867,549
1.21.00
27
CHENNAI CONTAINER TERMINAL
(meters)
YARD AREA(hectares)
72.3
55

55.65
695,611
DRAFT
QUAY LENGTH(meters)
CARRIERSCALLING
REACH STACKERS
GROUND SLOTS (TEUs)
REEFER PLUGS
RTGCRANES
RAILCONNECTIVITY
THROUGHPUT(TEUs)
INSTALLED CAPACITY
(million TEUs) CAPACITYUTILIZATION(percentage)
CARGO PROFILEAutomobile, pharmaceuticals, textile, leather, light engineering and chemical
MOL, RCL, HMM, Nyk line, RCL, NYK Line, Wan Hai, Hyundai, OOCL, COSCO,
Concor runs 1-2 rakes per day from Bangalore to
Chennai, DLI runs weekly service from Bangalore
and Hyderabad to chennai, Nagpur, Delhi, Vijayawada,
ICD Tondiarpet.
Chennai International Terminal (CITPL), is ideally positioned to tap the high growth chennai region. CITPL registered a CAGR of 8.18 per cent during FY11 to FY 16 while registering a slight dip in growth of traffic handled in FY 16. This terminal is catering to the fast growing industries namely automobile, pharmaceuticals, textile, leather, light engineering and chemical manufacturing units. This terminal is connected Inland Container Deports with on-dock rail siding within its premises to offer seamless rail services to its customers for both Imports & Exports.
AVERAGETURNAROUNDTIME (DAYS)
AVERAGE CRANEMOVES PER HOUR
BERTHS15.5
03832
06
306
355424
18
1.21.2
27
CHENNAI INTERNATIONAL TERMINAL
(meters)
YARD AREA(hectares)
55.6
SUPER POST
PANAMAX 04QUAY CRANES
POST PANAMAX03
56

51.5
DRAFT
QUAY LENGTH(meters)
CARRIERSCALLING
REACH STACKERS
FORK LIFTS
GROUND SLOTS (TEUs)
RMG CRANES
REEFER PLUGS
RTGCRANES
RAILCONNECTIVITY
THROUGHPUT(TEUs)
INSTALLED CAPACITY
(million TEUs) CAPACITYUTILIZATION(percentage)
CARGO PROFILEAutomobiles, electronics rice, white goods, scrap waste paper, chemicals agri commodities and engineering goods
Maersk Line, Safmarine, GSL, TSL, Hyundai, OCL, ESA, APL, MOL, HSUD, HLL, NYK, Seacon, SRS, SCI, MSC, PIL, PMA, OMS, MBK, Simatech, MCS, HLL, NYK, XPF, SSA, Jindal, SSL, RCL, Wan Hai, YML, KMTC, Hanjin, CCA, ANL, ULS, OMS, and CNC
"Dadri, Loni, Moradabad, Tughalakabad, Vododra,
Khodiyar, Jamnagar, Ankleshwar, Sanand, Amritsar, Ludhiana,
Sahnewal, Jaipur, Jodhpur, Kota, Faridabad, Patli, Garhi Harsaru,
BallabhgarhRewari, Dronagiri, Malanpur”
APM Terminals Pipavav(APMT) is located near to the important maritime trade route which connects India with international destinations such as the Far East, Middle East, Africa, Europe and the US. This terminal witnessed a sustainable upward CAGR of 6.92 per cent during 2011 FY to 2016 FY. The investments made in the last financial year triggered the better efficiency and productivity. The enhancements mainly includes strengthening of the existing berths, dredging, and the improvement of the container yard and internal roads at the port. Nearly 70 per cent of the total container volume handled is evacuated by rail and the number of high cube double stack trains handled has also steadily increased.
AVERAGETURNAROUNDTIME (DAYS)
AVERAGE CRANEMOVES PER HOUR
BERTHS14.5
02735
09
02
04526
13
3,409
18694,612
1.350.53
29
APM TERMINALS – PIPAVAV
(meters)
YARD AREA(hectares)
51.5
QUAY CRANES
POST PANAMAX
SUPER POST
PANAMAX 0503
57

67.88
577,000
DRAFT
QUAY LENGTH(meters)
CARRIERSCALLING
REACH STACKERS
GROUND SLOTS (TEUs)
RAILCONNECTIVITY
THROUGHPUT(TEUs)
INSTALLED CAPACITY
(million TEUs)
CAPACITYUTILIZATION(percentage)
CARGO PROFILEPeas, Metal scrap, Raw asbestos, Resins, Electronic goods, Machineries, Chemicals, Jute & Jute products, CI goods, Aluminium products, Ateel and Ferrochrome.
Far Shipping, Samudera Shipping, X-Press/BTL
Sealdah-Budge Budge - KDS, KDS-Diamond
Harbour Station
Bharat Kolkata Container Terminals (BKCT) is located in the riverine Kolkata Port with a 203km channel leading to the sea. This terminal is reported a upward CAGR of 8.88 per cent during FY2011-FY2016. Many large Indian corporations set up their industrial units in Kolkata, producing a wide range of products including electronics, electrical equipment, engineering products, automobiles, tea, pharmaceuticals, chemicals, food products, jute products and more. The city has recently been transformed into one of India’s major information technology hub which can further bolster the growth of container volumes. BKCT is a gateway to the hinterland comprising eastern and northeastern India as well as two land-locked neighbouring countries – Nepal and Bhutan. It is well connected by the national highways and railway lines to key cities in the region.
AVERAGETURNAROUNDTIME (DAYS)
AVERAGE CRANEMOVES PER HOUR
BERTHS
8.5
05
812
09
133000
0.8
4.0
30
BHARAT KOLKATA CONTAINER TERMINAL
(meters)
YARD AREA(hectares)
67.9
58

DRAFT
QUAY LENGTH(meters)
QUAY CRANES
CARRIERSCALLING
REACH STACKERS
FORK LIFTS
GROUND SLOTS (TEUs)
REEFER PLUGS
RTGCRANES
RAILCONNECTIVITY
THROUGHPUT(TEUs)
INSTALLED CAPACITY
(million TEUs)
CARGO PROFILERaw Cashew, Timber, Machinery, Waste Paper, Cotton, Metal scrap, Chemicals, Rubber products, Textile, Garments, Paper, Cashew processed, Minerals, Garnet Sand, Cotton Yarn, Handlooms, Machinery, Sea Food, Granite and Coir pith etc.
JFS, X Press Feeder, BTL, Seacon, Shreyas, RSA, Wan Hai
Two CONCOR rail services per week linking Tuticorin
to Bangalore. Also linked to ICDs at Madurai, Tirupur,
Karur, Salem, Coimbatore, Chennai and Bangalore.
Tuticorin Container Terminal (TCT) is operating at south-eastern tip of the state of Tamil Nadu in India has an advantage of very less voyage time to ferries the cargo to Colombo. TCT has registered a CAGR of 2.14 per cent during FY 2011 to FY 2016. The port possesses one ICD and thirteen CFS's in its vicinity ensures seamless flow of containers to and from the port. PSA SICAL Container Terminal runs 8 services a week, of which 6 are operated between Tuticorin and Colombo, 1 coastal service (Tuticorin, Hazira, Mundra, Cochin, Tuticorin) and 1 Smile service connecting Tuticorin, Colombo, Mundra, Jebel Ali, Mundra, Pipavav, Cochin and Tuticorin. The terminal is well linked to the major trade hinterland industrial clusters and cities such as Bengaluru, Chennai, Cochin, Coimbatore, Madurai and Tirupur by state by national highways and rail connections.
AVERAGETURNAROUNDTIME (DAYS)
AVERAGE CRANEMOVES PER HOUR
BERTHS10.9
01370
02
01
84
10 1000
08
495,0000.4
0.5
40
TUTICORIN CONTAINER TERMINAL - PSA SICAL
(meters)
YARD AREA(hectares)
PANAMAX 03
59

42.90
429,000
DRAFT
QUAY LENGTH(meters)
CARRIERSCALLING
REACH STACKERS
GROUND SLOTS (TEUs)
REEFER PLUGS
RTGCRANES
RAILCONNECTIVITY
THROUGHPUT(TEUs)
INSTALLED CAPACITY
(million TEUs)CAPACITY
UTILIZATION(percentage)
CARGO PROFILESanitary ware, Raw Cashew nuts, Construction Materials, Interior decoratives, Lighting Products, Plastic products, Ceramic derivatives, Cotton Yarn, Plastic Products, Processed Foods, Agri Ingredients, Coir, Oils, Food Ingredients, Food products and Frozen foods,
JM Baxi, Simatech, Hapag Lloyd, KMT, Emirates Shpg, TCI SEAWAYS, RELAY SHIPPING, ISS SHIPPING, SHREYAS SHIPPING, ZIM INTEGRATED, EMIRATES SHIPPING, MBK LOGISTIX, JAIRAM & SONS, PIL(INDIA)PVT.LTD, EVERGREEN SHIPPING, SEAHORSE, MAERSK INDIA PVT. LTD, ESL, KMTC, RCL and Hanjin
ICD-Whitefield, Bengaluru to Vallarpadam ICTT on
every Monday, Every firday from ICD Irugur,
ICD
DP World - International Container Transhipment Terminal (ICTT) is strategically located 11 nautical miles away from the direct Middle East - Far East sea-route. This terminal serves as the natural gateway to the vast industrial and agricultural produce markets of the south and west of India. This terminal has registered a whopping growth of 17.5 per cent in total traffic handled in the FY 2016 while crossing the mark of 4 lakh TEUs. This terminal has shown impressive performance in April 2016 with 32 per cent growth in volumes handled in the first quarter of the current calendar year (January to March 2016). Connectivity for all mainline carriers on the East-West shipping routes and regular scheduled train services to Inland Container Depots (ICDs) located in Irugur (Coimbatore) and Whitefield (Bengaluru) are catalysts for the impressive growth.
AVERAGETURNAROUNDTIME (DAYS)
AVERAGE CRANEMOVES PER HOUR
BERTHS14.5
02605
03
450
40 2500
15
1.01.7
31
VALLARPADAM ICTT
(meters)
YARD AREA(hectares)
42.9
SUPER POST
PANAMAX 04QUAY CRANES
60

40.37
DRAFT
QUAY LENGTH(meters)
QUAY CRANES
POST PANAMAX
SUPER POST
PANAMAX
CARRIERSCALLING
REACH STACKERS
GROUND SLOTS (TEUs)
REEFER PLUGS
RTGCRANES
RAILCONNECTIVITY
THROUGHPUT(TEUs)
INSTALLED CAPACITY
(million TEUs) CAPACITYUTILIZATION(percentage)
CARGO PROFILEChemicals, Metals, Wood Pulp, Waste Paper, Scrap, Food Products, Copper and Copper Alloys, Cotton Yarn, Fibers and Rubber Products
Maersk, MSC, CMA CGM, OOCL, PIL, Simatech, Emirates, UASC, Perma Shipping, Freight Connection, Caravel, Balaji, Trans Asia, IAL are offering weekly service to worldwide destinations.
ICD Pithampur, ICD Ratlam, ICD TKD, ICD Dadri , and
Nagpur ICDs
Adani Hazira Container Terminal (AHCT) is situated in the middle of India’s biggest chemical manufacturing corridor i.e. South Gujarat (from Vapi to Vadodra). AHCT recorded high growth of 96 per cent for the FY 2015-16. This terminal is located close to the Delhi-Mumbai Industrial Corridor (DMIC) along the West coast of India which accounts major part of the Indian trade. Multimodal connectivity to the northern, north-western and central parts of India, makes this terminal well connected with the key traders. AHCT has an agreement with Kribhco to use its rail siding located at a distance of 14 km from the terminal and capable of handling 6-8 trains a day.
AVERAGETURNAROUNDTIME (DAYS)
AVERAGE CRANEMOVES PER HOUR
BERTHS13.0
02637
020402
120
3500
16
302,755
0.80.55
30
ADANI HAZIRA CONTAINER TERMINAL
(meters)
40.4
61

DRAFT
QUAY LENGTH(meters)
QUAY CRANES
CARRIERSCALLING
REACH STACKERS
FORK LIFTS
GROUND SLOTS (TEUs)
REEFER PLUGS
RTGCRANES
RAILCONNECTIVITY
THROUGHPUT(TEUs)
INSTALLED CAPACITY
(million TEUs) CAPACITYUTILIZATION(percentage)
CARGO PROFILERefractories, Scrap, Machinery, Cashew, Paper, Minerals & Alloys, Quick Lime, Pharmaceuticals(Chemicals), Wood pulp, Ferro Alloys, Aluminum Products, Sea Foods, Steel, Agri Products, Minerals, Granite, Refractory, Paper, Chemicals and Pharma(finished goods)
BTL, NYK, Maersk, BTL, Far Shipping, Simatech, Evergreen, NYK, MOL,RCL, Xpress Feeders,Shreyas Shipping, HJN, HSL
Connected with ICD Raipur, Nagpur, Kalinganagar, Delhi (NCR), Birgunj ICD (Nepal).
Approximately handles 25 trains per month.
Visakha Container Terminal (VCTPL) achieved a growth rate of 18 per cent in this FY 2016. VCTPL is ideally located on the center of the East Coast of India to cater vast hinterland of Andhra Pradesh, Odisha, Chhattisgarh, Jharkhand, MP, UP, North India and West Bengal. With excellent rail and road connectivity, it is an ideal alternative especially for shipments to and from Far East and South East Asian regions to Delhi and other nearby ICDs of Hyderabad, Nagpur and Raipur. Presently, this is the only container terminal on the east coast, serving as a transhipment hub with approximatley 18 per cent of total traffic handled in the last year is transhipmment cargo. Terminal is projecting to reach 3.6 - 4 lakh TEUs volume in the FY 17 year as it is already crossed highest mark of 35000 TEUs in a month of July 16.
AVERAGETURNAROUNDTIME (DAYS)
AVERAGE CRANEMOVES PER HOUR
BERTHS16.5
02450
05
03
204
162500
06293,000
0.60.82
25
VISAKHA CONTAINER TERMINAL
(meters)
YARD AREA(hectares)
PANAMAX POST
PANAMAX 0202
48.83 48.8
62

25.29
202,328
DRAFT
QUAY LENGTH(meters)
CARRIERSCALLING
REACH STACKERS
REEFER PLUGS
RTGCRANES
RAILCONNECTIVITY
THROUGHPUT(TEUs)
INSTALLED CAPACITY
(million TEUs)
CAPACITYUTILIZATION(percentage)
CARGO PROFILEChemicals, Machinery, Plastics, Vegetable oils, Electrical Equipments, Aluminum, Non-ferrous metals, Motor Vehicles, Knitted garments, Sporting products, Readymade Garments, Carpets, other Home textile, Embroidery equipments, Frozen meat, Medicaments and Engineering goods
MSC, CMA CGM, Maersk Line, OOCL, Master Group, APL, UASC, Hanjin, Emirates, MSP, KMD, PIL, ZIM
90% of this terminal's EXIM handled by CONCOR's rail
connectivity. 15 export trains are placed on daily basis
to Delhi, Ludhiana, Mulund, Ahmedabad, Hyderabad,
Nagpur,Jodhpur, Aurangabad, Vadodara, Moradabad etc. direct
rail connecitivity to 46 ICDs.
Nhava Sheva India Gateway Terminal (NSIGT) is commemced operations in FY 16 and reported high volumes in its initial year of operations. This terminal possesses remote opearted quay cranes capable to handle next generation large size vessels. NSIGT hosted the largest container vessel MSC Francesca with a length of 363 metre, can carries more than 11,000 TEUs is deployed on the Himalaya Express (HEX) Service to ever call at India’s premier container gateway, Jawaharlal Nehru Port (JNPT). NSIGT will be in a position to handle 14000 TEU vessels as it is equipped with the latest technology and terminal equipment with a draft of 16m alongside.
AVERAGE CRANEMOVES PER HOUR
BERTHS14.0
01330
01
336 27
12
0.830
NHAVA SHEVA INDIA GATEWAY TERMINAL
(meters)
YARD AREA(hectares)
25.0
04QUAY CRANES
63

118,623
DRAFT
QUAY LENGTH(meters)
CARRIERSCALLING
REACH STACKERS
FORK LIFTS
GROUND SLOTS (TEUs)
REEFER PLUGS
RTGCRANES
RAILCONNECTIVITY
THROUGHPUT(TEUs)
INSTALLED CAPACITY
(million TEUs) CAPACITYUTILIZATION(percentage)
CARGO PROFILEGranite, Paper, Automobile Parts, Fruits, Billets, Cement, Chillies, Coffee, Coir Fibre bales, Cotton Linters / Hull / Yarn, Empty Bottles, Granite, Maize, Mica Powder, Minerals, Pipes, Raw cotton, Rice, Shrimps, Sugar, Tobacco, Pulses, Rubber Scrap, Soda Ash, Steel Sheets, Timber, Used Tyre, Waste Paper
Seahorse& Smart Marine, Maersk, Safmarine, MSC, SCI, HMM, Evergreen, APL, MOL, Ben Line, Star Line, Seapol, Focus-Trans, Radiant Maritime, St.John, Victor Express Line, Trans Asia, Forbes, Shreyas
New connectivity started to Bangalore Whitefield ICD,
apart from the existing connectivity to hyderabad
ICD
Krishnapatnam Port Container Terminal (KPCT), fastest growing private container terminal on the east coast, has registered a whopping CAGR of 49.36 per cent during the last five years. KPCT broke through the 1 Lakh TEUs barrier in FY 16 with growth of 30 per cent in volume handled. Terminal is also envisaged to keep up the brisk pace in its growth with its enhancement of rail and road connectivity to serve the farmost hinterland. A new rail service from ICD Bengaluru Whitefield to KPCT. Apart from ramping up the land side connectivity, recent launch of weekly vessel service of MV Maersk Bentonville connects Krishnapatnam with Salalah (Oman) and another service MV Harbour-1 connects KPCT with Bangladesh will further create a spurt in trade.
AVERAGETURNAROUNDTIME (DAYS)
AVERAGE CRANEMOVES PER HOUR
BERTHS13.5
02650
10
02
400
36 4600
04
1.20.4
32
KRISHNAPATNAM PORT CONTAINER TERMINAL
(meters)
YARD AREA(hectares)
SUPER POST
PANAMAX 05QUAY CRANES
9.89 9.8
64

16.86
DRAFT
QUAY LENGTH(meters)
QUAY CRANES
CARRIERSCALLING
REACH STACKERS
FORK LIFTS
GROUND SLOTS (TEUs)
REEFER PLUGS
RTGCRANES
RAILCONNECTIVITY
THROUGHPUT(TEUs)
INSTALLED CAPACITY
(million TEUs) CAPACITYUTILIZATION(percentage)
CARGO PROFILEAutomobile accessories, Iron and Steel products, Meat Products, Frozen Products, Cotton Yarn, Rubber, Valves, Plastics
Shreyas, SCI, HMM, COSCO, Maersk, SHR, SIM, Hyundai, Wan Hai, NYKL and EMC.
New rail connectivity started from Bangalore to Kattupalli.
Kattupalli International Container Terminal (KICT) has registered exponential growth in the FY 2016 under the category of low volume handling ports on east coast. This new terminal has recently joined an umbrella of Adani's container terminals in India. KICT has been struggling for survival since its commercial launch in April 2013 amid slumping cargo volumes and growing overcapacity on India’s east coast with the addition of new non-major ports. Despite, this terminal managed to report the upward growth in the last financial year and poised to handled more volumes than presently handled in the next year.
AVERAGETURNAROUNDTIME (DAYS)
AVERAGE CRANEMOVES PER HOUR
BERTHS14.0
02710
03
04
360
25 5120
15115,227
1.20.4
28
KATTUPALLI INTERNATIONAL CONTAINER TERMINAL
(meters)
YARD AREA(hectares)
16.8
SUPER POST
PANAMAX 06
65

20.67
103,375
DRAFT
QUAY LENGTH(meters)
CARRIERSCALLING
REACH STACKERS
GROUND SLOTS (TEUs)
RAILCONNECTIVITY
THROUGHPUT(TEUs)
INSTALLED CAPACITY
(million TEUs) CAPACITYUTILIZATION(percentage)
CARGO PROFILERaw Cashew, Timber, Machinery, Waste Paper, Cotton, Metal scrap, Chemicals, Rubber products, Textile, Garments, Paper, Cashew processed, Minerals, Garnet Sand, Cotton Yarn, Handlooms, Machinery, Sea Food, Granite and Coir pith etc.
Seacon, OEL, SCI, Simatech, Shreyas, PIL, BOX Consortium (BTL, OEL and X-Press Feeders)
Concor's rail connectivity is just 1 km away from the
terminal
Dakshin Bharat Gateway Terminal (DBGT) is strategically located near to the east west international sea-route. DBGT has registered a whopping growth in the last financial year under the low volume handing container terminals on east coast. This terminal now has two weekly services (Simatech) to Colombo. The new BOX Consortium (BTL, OEL and X-Press Feeders) has announced a third string calling at DBGT, Tuticorin. This service would be operated twice a week to Colombo. The maiden call of the service, by M.V. Bauhinia, commenced on February 1, 2015. With the commencement of 2 BOX Consortium services and the existing 2 Simatech services, the terminal would be operating 4 services every week to Colombo.
AVERAGETURNAROUNDTIME (DAYS)
BERTHS12.8
01
34502
10400
0.51.0
DAKSHIN BHARAT GATEWAY TERMINAL
(meters)
YARD AREA(hectares)
20.7
RTGCRANES
09PLANNED
PLANNED 03QUAY CRANES
66

28.33
DRAFT
QUAY LENGTH(meters)
QUAY CRANES
CARRIERSCALLING
REACH STACKERS
GROUND SLOTS (TEUs)
REEFER PLUGS
RTGCRANES
RAILCONNECTIVITY
THROUGHPUT(TEUs)
INSTALLED CAPACITY
(million TEUs) CAPACITYUTILIZATION(percentage)
CARGO PROFILEPeas, Metal scrap, Raw asbestos, Resins, Electronic goods, Machineries, Chemicals, Jute & Jute products, CI goods, Aluminium products, Ateel and Ferrochrome.
Far Shipping, Seacon, OEL, SCI, Simatech, Shreyas, PIL, BOX Consortium (BTL, OEL and X-Press Feeders)
Haldia - Panskura, Haldia - Rajgoda
Kolkata Port Trust awarded the operation and maintenance contract for Haldia Container Terminal to HICT(JM Baxi Group) for Integrated Container Handling operations for a period of 10yrs. HICT registered a negative growth in the total volume handled during FY 2011 to FY 2016. This container terminal is envisaged for positive growth after it is being awarded O & M contract to United Liner Agencies of India (P) Ltd of J M Baxi Group. Ongoing upgradation, enhancements, revamping the cargo handling equipements apart from improving the connectivity are the major key drivers for the expected positive growth.
AVERAGETURNAROUNDTIME (DAYS)
AVERAGE CRANEMOVES PER HOUR
BERTHS8.5
02432
02
8
09 3000
0485,000
0.31.5
23
HALDIA INTERNATIONAL CONTAINER TERMINAL
(meters)
YARD AREA(hectares)
28.3
PANAMAX 02
67

DRAFT
QUAY LENGTH(meters) REACH STACKERS
REEFER PLUGS
RTGCRANES
RAILCONNECTIVITYTHROUGHPUT
(TEUs)
INSTALLED CAPACITY(million TEUs)
CARGO PROFILEChemicals and Speciality Chemicals, Rice, Agri commodities, Salt, Quartz Powder, Granite Blocks, Tiles, Ceramics, Sanitary wares, Automobile Parts
Connected by BG link to Mumbai and Delhi via Ahmedabad. Longest route i.e. via Viramgam-Ahmedabad Godhra-Ratlan-Bayana-Jamuna Bridge to Delhi. The second route is via Viramgam-KhodiyarMehsana-Palanpur-Ajmer to Delhi. In addition, Port has MG connectivity with Palanpur.New Developments• Double Track broad gauge connectivity from Gandhidham
to Kandla as a part of SPV of Gandhidham-Palanpur Conversion.
• By-pass at Gandhidham for Mundra/Bhuj Lines and providing of additional Loop lines for handling facilities at Adipur.
• Provision of railways sidings from Gandhidham to Tuna (10 km).
Kandla International Container Terminal (KICT) is situated on the shores of the Kandla creek which runs into the Gulf of Kutch at a distance of 90 nautical miles from the Arabian Sea. KICT serves as a critical gateway port for the western and north western hinterland of India on international trade routes to Middle East and Upper Gulf. This terminal is poised to bring back its lost market, after a halted for almost 2 -3 years due to isssues with previous contract in between Kandla Port and operator ABG. The existing railway siding No.12 available behind the backup area of berth Nos.11 and 12 will be the dedicated Railway Corridor to the container terminal. This will enhance the viability of the project by attracting rail-borne cargo.
BERTHS13.0
02545 04
48 19
08
3,000
0.6
KANDLA INTERNATIONAL CONTAINER TERMINAL
(meters)
YARD AREA(hectares)
QUAY CRANESSUPER POST
PANAMAX 04
68

www.maritimegateway.com
by &
IndIan ContaInermarket report2016