india and the brics countries: issues of trade and …wtocentre.iift.ac.in/fa/india and the brics...
TRANSCRIPT

1
INDIA AND THE BRICS COUNTRIES: ISSUES
OF
TRADE AND TECHNOLOGY
Prof. Manoj Pant
Centre for International Trade and Development
School of International Studies, JNU
Principal Researchers: Amit Sadhukhan, Ph.D. student, CITD/SIS/JNU
Jatinder Singh, Ph.D. student, CESP/SSS/JNU
December 2011
Prepared for the Centre for WTO Studies
Indian Institute of Foreign Trade
New Delhi
2
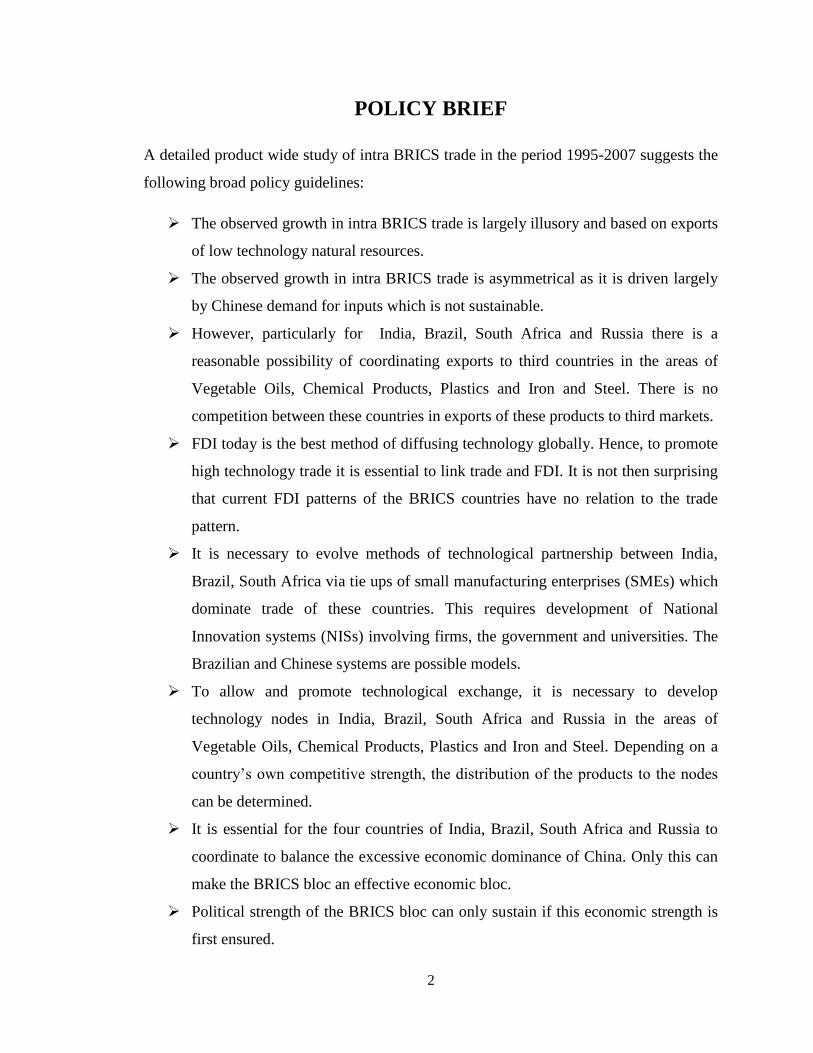
POLICY BRIEF
A detailed product wide study of intra BRICS trade in the period 1995-2007 suggests the
following broad policy guidelines:
The observed growth in intra BRICS trade is largely illusory and based on exports
of low technology natural resources.
The observed growth in intra BRICS trade is asymmetrical as it is driven largely
by Chinese demand for inputs which is not sustainable.
However, particularly for India, Brazil, South Africa and Russia there is a
reasonable possibility of coordinating exports to third countries in the areas of
Vegetable Oils, Chemical Products, Plastics and Iron and Steel. There is no
competition between these countries in exports of these products to third markets.
FDI today is the best method of diffusing technology globally. Hence, to promote
high technology trade it is essential to link trade and FDI. It is not then surprising
that current FDI patterns of the BRICS countries have no relation to the trade
pattern.
It is necessary to evolve methods of technological partnership between India,
Brazil, South Africa via tie ups of small manufacturing enterprises (SMEs) which
dominate trade of these countries. This requires development of National
Innovation systems (NISs) involving firms, the government and universities. The
Brazilian and Chinese systems are possible models.
To allow and promote technological exchange, it is necessary to develop
technology nodes in India, Brazil, South Africa and Russia in the areas of
Vegetable Oils, Chemical Products, Plastics and Iron and Steel. Depending on a
country‟s own competitive strength, the distribution of the products to the nodes
can be determined.
It is essential for the four countries of India, Brazil, South Africa and Russia to
coordinate to balance the excessive economic dominance of China. Only this can
make the BRICS bloc an effective economic bloc.
Political strength of the BRICS bloc can only sustain if this economic strength is
first ensured.
3
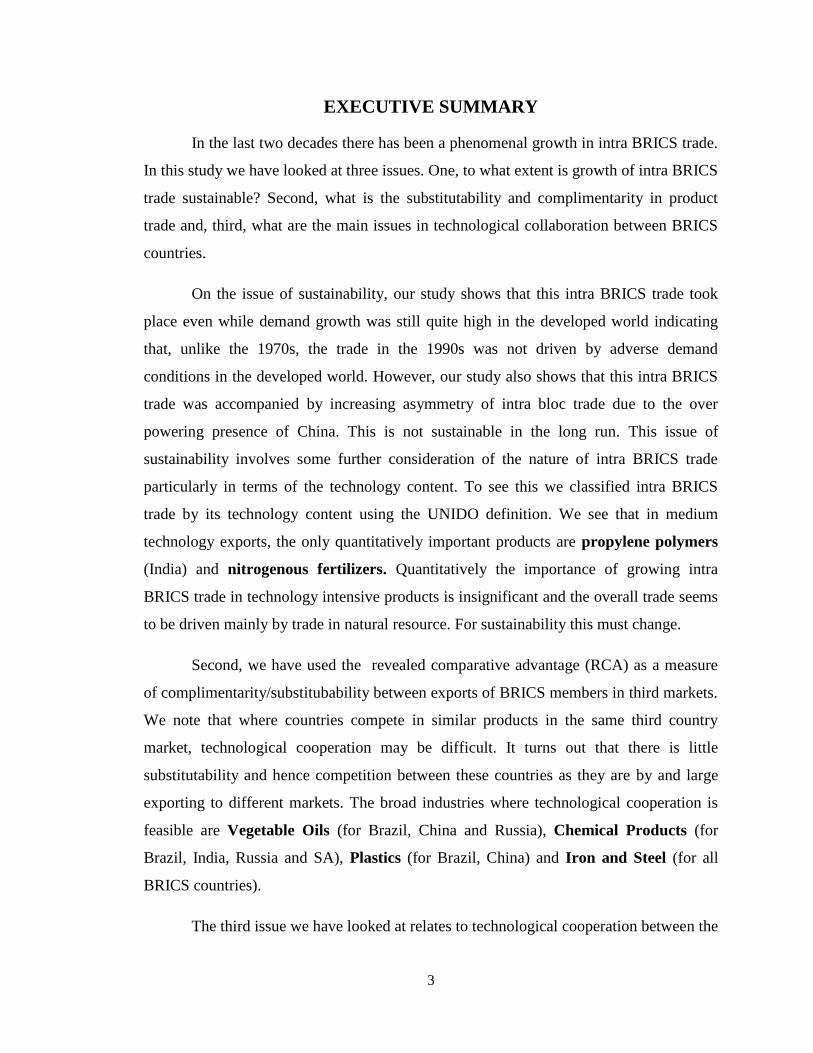
EXECUTIVE SUMMARY
In the last two decades there has been a phenomenal growth in intra BRICS trade.
In this study we have looked at three issues. One, to what extent is growth of intra BRICS
trade sustainable? Second, what is the substitutability and complimentarity in product
trade and, third, what are the main issues in technological collaboration between BRICS
countries.
On the issue of sustainability, our study shows that this intra BRICS trade took
place even while demand growth was still quite high in the developed world indicating
that, unlike the 1970s, the trade in the 1990s was not driven by adverse demand
conditions in the developed world. However, our study also shows that this intra BRICS
trade was accompanied by increasing asymmetry of intra bloc trade due to the over
powering presence of China. This is not sustainable in the long run. This issue of
sustainability involves some further consideration of the nature of intra BRICS trade
particularly in terms of the technology content. To see this we classified intra BRICS
trade by its technology content using the UNIDO definition. We see that in medium
technology exports, the only quantitatively important products are propylene polymers
(India) and nitrogenous fertilizers. Quantitatively the importance of growing intra
BRICS trade in technology intensive products is insignificant and the overall trade seems
to be driven mainly by trade in natural resource. For sustainability this must change.
Second, we have used the revealed comparative advantage (RCA) as a measure
of complimentarity/substitubability between exports of BRICS members in third markets.
We note that where countries compete in similar products in the same third country
market, technological cooperation may be difficult. It turns out that there is little
substitutability and hence competition between these countries as they are by and large
exporting to different markets. The broad industries where technological cooperation is
feasible are Vegetable Oils (for Brazil, China and Russia), Chemical Products (for
Brazil, India, Russia and SA), Plastics (for Brazil, China) and Iron and Steel (for all
BRICS countries).
The third issue we have looked at relates to technological cooperation between the

4
BRICS countries. One major vehicle of technology transfer and trade today is foreign
direct investment (FDI). Analysis of FDI patterns indicates that with the exception of
China and Brazil, the pattern of FDI from BRICS countries has not been conducive
to promoting intra bloc trade. FDI patterns have largely promoted the traditional trade
pattern. Here the Chinese strategy is worth noting. China tends to push infrastructure
development in far off countries via loans which are then linked to preferential treatment
to Chinese companies in specific sectors.
One of the factors often ignored in looking at BRICS trade is the dominance of
small scale establishments (SSIs) in exportss. Here, the role of the government in
promoting global value chains is crucial given the low resource base of these firms.
Finally, the role of the government in promoting technological development via
university-industry partnership is crucial particularly in making new technologies
available to the SSIs. Here, only Brazil and China have any developed systems. The
other countries need to develop such National Innovation Systems. There is also no
institutional mechanism for intra BRICS coordination in technological
partnerships. Some such mechanism must be developed.
Technological cooperation seems particularly important for the four countries
India, South Africa, Brazil, and Russia. In this one possible method is to develop
technology nodes in these four countries with specialization in specific areas of
cooperative advantage of these countries.

5
Contents------------------------------------------------------------------------------------------Page
I. Introduction----------------------------------------------------------------------------------------1
II. Methodology---------------------------------------------------------------------------------------4
II.A. The Theory----------------------------------------------------------------------------------4
II.B. The Data-------------------------------------------------------------------------------------7
II.C. Analytical Framework--------------------------------------------------------------------7
III. Empirical Analysis--------------------------------------------------------------------------9
III.A. Macro Issues in Sustainability-----------------------------------------------------9
III.B. Trade and Sustainability of BRICS trade----------------------------------------13
III.C. Complementarity and Substitutability-------------------------------------------22
IV. Technology, FDI and Cooperation------------------------------------------------------29
IV.A. Intra BRICS Foreign Direct Investment----------------------------------------30
IV.B. Geographical and Sectoral Composition of FDI flows from BRICS--------33
IV.C. FDI Strategies-----------------------------------------------------------------------36
IV.D. Institutional Arrangements for Technology Collaboration-------------------38
IV.D. Role of Government in Technical Collaboration------------------------------42
V. Conclusion----------------------------------------------------------------------------------43
VI. References----------------------------------------------------------------------------------48
VII. Appendix -----------------------------------------------------------------------------------51
VIII. List of Tables
IX. Table 1: Intra and Extra-BRICS Exports (US $ Millions), 1995-2007----------- 2
X. Table 2: Intra and Extra-BRICS Imports (US $ Millions), 1995-2007----------- 3
XI. Table 3: Economic and Demographic Characteristics of BRICS Countries-------- 9
XII. Table 4: Economic and Demographic Characteristics of few Developed
Countries------- 10
XIII. Table 5: Trade Symmetry in Bilateral and Intra-BRICS Trade--------------- 11
XIV. Table 6: Percentage Share of Intra-BRICS Exports, 1995-2009------------- 14
XV. Table 7: Percentage Share of Intra-BRICS Imports, 1995-2009------------- 15
XVI. Table 8: Share of Intra BRICS Exports to World Exports, 2000 to 2007
(in %)------------- 16
XVII. Table 9: Ratio of Net Intra BRICS Trade to Trade with Rest of the World,

6
XVIII. 2000 and 2007 (in %)--------------------------------------------------------------- 17
XIX. Table 10: Percentage Share of India's Intra BRICS to Total Exports during
XX. 2000 and 2007---------------------------------------------------------------------- 19
XXI. Table 11: Share in Intra BRICS exports, 2000 to 2007: Technological
Classification----- 20
XXII. Table 12: Important and Increasingly Important Commodities for BRICS,
XXIII. 2000 to 2007------------------------------------------------------------------------ 21
XXIV. Table 13: Product Substitutability among BRICS Countries, 2007--------- 24
XXV. Table 14: Product Complementarity among BRICS Countries, 2007------ 27
XXVI. Table 15: BRICS FDI inflows, outflows (in % to world) and net to World
XXVII. (Billion US$)-------------------------------------------------------------------- 31
XXVIII. Table 16: Distribution of FDI by region, 1980-2005--------------------- 32
XXIX. Table 17: Main outward investing and inward receiving industries by
country------------ 35
XXX. Table 18: Total Bilateral Investment Treaties and Double Taxation
Agreements
XXXI. Concluded, 1 June 2011----------------------------------------------------------- 40
XXXII. Table19: Regional Trade Agreements among BRICS Countries--------- 41
XXXIII. Table 20: Contribution by small and medium-sized enterprises in selected
economies--- 42
XXXIV.
XXXV.
XXXVI.
XXXVII.
XXXVIII. List of Boxes
XXXIX. Box 1: Most inflows went into services, but the sharpest rise in FDI was in
XL. natural resources-----------------------------------------------------------------------34
XLI. Box 2. There has been a significant increase in developing-country firms
XLII. in the universe of transnational corporations -------------------------------- 37

7
I. Introduction.
The shifts in the pattern of world trade since about 1995 have been momentous.
This was particularly true in the decade or so after the WTO agreement of 1995. This has
now been extensively documented (see, UNCTAD, 2009). Some of these shifts need
specific mention.
Define the South (S) countries as all countries excluding NAFTA countries, the
EU27, the UK, Russia, Australia, New Zealand and Japan. The most momentous change
then has been the revival of South-South trade (SS trade). It accounted for 32 percent of
world trade in 2005. Even more important, about 50 percent of exports of countries of the
South have gone to other South countries. In addition, this trade has grown faster than
world trade in both value and volume terms. Third, this SS trade growth has been
radically different from a similar expansion in the 1970s when SS trade went up to about
25 percent of world trade. At that time, SS trade expansion was mainly due to a rise in the
price of oil which led to a major transfer of purchasing power from developed countries
to countries of the South. However, the expansion of this SS trade lasted for a short time
and was back at 20 percent of world trade by the mid 1980s. On the other hand, the recent
expansion of SS trade has taken place in a period when there were no major exogenous
changes in the world trading environment. In fact, the only major exogenous factor, the
East Asian crisis of the late 1990s should actually have limited this SS trade. During this
period in fact developed countries were enjoying a period of relative boom and it cannot
be argued that any SS trade expansion in this period can be attributed to a demand crisis
in the N countries. Hence, it is worthwhile to see if this expansion in SS trade will go the
same way as in the 1970s. In other words, is the dramatic change in SS trade in recent
years sustainable?
The other feature of this SS trade since about 1995 was the emergence of Asia as
the major growth pole among the S countries. In 2005, the Asian region accounted for
about 85 percent of total exports of the S countries. Second, there seemed to have been
some development of regional specialization with the Americas dominating in
agricultural goods (Brazil, Argentina etc), Africa in natural resources and Asia in
manufactures. It is interesting to note that exports of textiles, clothing and agricultural
8
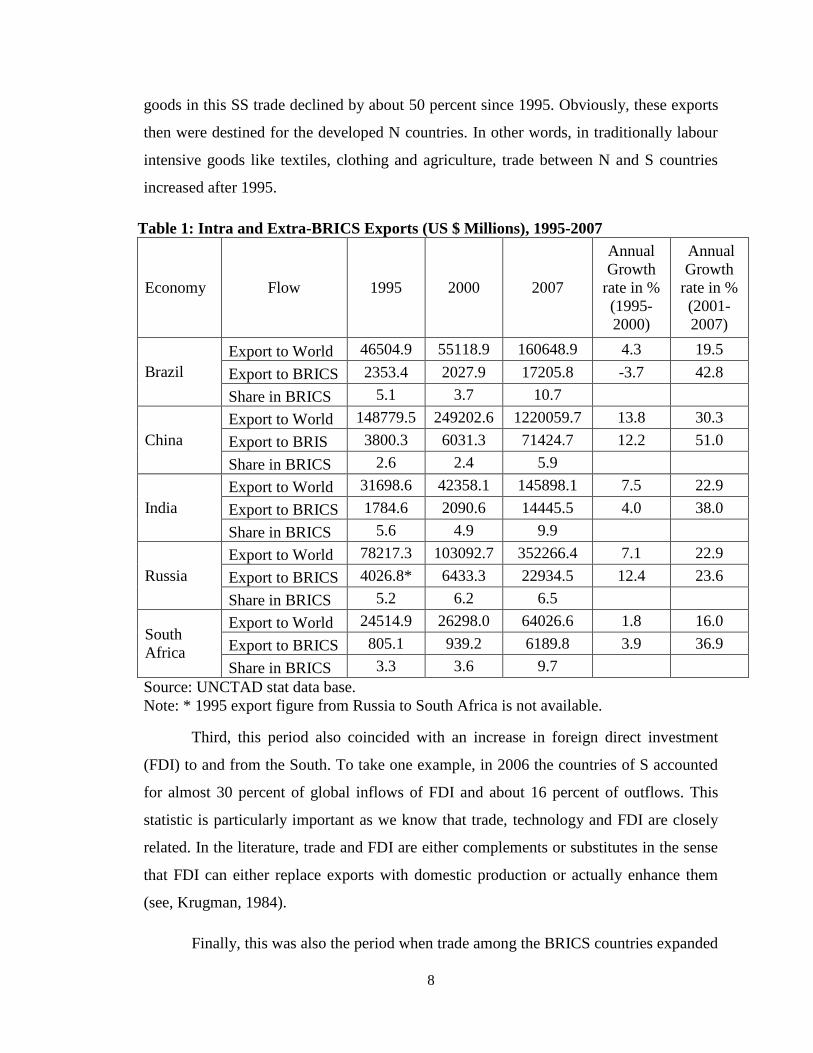
goods in this SS trade declined by about 50 percent since 1995. Obviously, these exports
then were destined for the developed N countries. In other words, in traditionally labour
intensive goods like textiles, clothing and agriculture, trade between N and S countries
increased after 1995.
Table 1: Intra and Extra-BRICS Exports (US $ Millions), 1995-2007
Economy Flow 1995 2000 2007
Annual
Growth
rate in %
(1995-
2000)
Annual
Growth
rate in %
(2001-
2007)
Brazil
Export to World 46504.9 55118.9 160648.9 4.3 19.5
Export to BRICS 2353.4 2027.9 17205.8 -3.7 42.8
Share in BRICS 5.1 3.7 10.7
China
Export to World 148779.5 249202.6 1220059.7 13.8 30.3
Export to BRIS 3800.3 6031.3 71424.7 12.2 51.0
Share in BRICS 2.6 2.4 5.9
India
Export to World 31698.6 42358.1 145898.1 7.5 22.9
Export to BRICS 1784.6 2090.6 14445.5 4.0 38.0
Share in BRICS 5.6 4.9 9.9
Russia
Export to World 78217.3 103092.7 352266.4 7.1 22.9
Export to BRICS 4026.8* 6433.3 22934.5 12.4 23.6
Share in BRICS 5.2 6.2 6.5
South
Africa
Export to World 24514.9 26298.0 64026.6 1.8 16.0
Export to BRICS 805.1 939.2 6189.8 3.9 36.9
Share in BRICS 3.3 3.6 9.7
Source: UNCTAD stat data base.
Note: * 1995 export figure from Russia to South Africa is not available.
Third, this period also coincided with an increase in foreign direct investment
(FDI) to and from the South. To take one example, in 2006 the countries of S accounted
for almost 30 percent of global inflows of FDI and about 16 percent of outflows. This
statistic is particularly important as we know that trade, technology and FDI are closely
related. In the literature, trade and FDI are either complements or substitutes in the sense
that FDI can either replace exports with domestic production or actually enhance them
(see, Krugman, 1984).
Finally, this was also the period when trade among the BRICS countries expanded
9
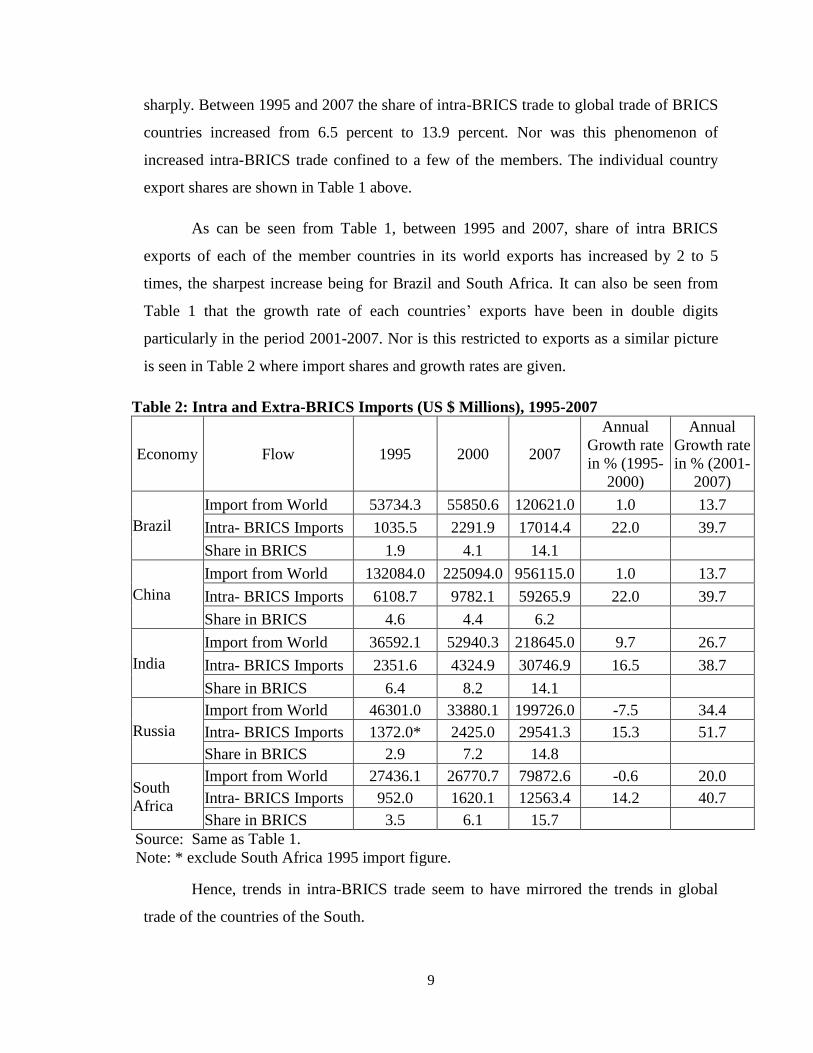
sharply. Between 1995 and 2007 the share of intra-BRICS trade to global trade of BRICS
countries increased from 6.5 percent to 13.9 percent. Nor was this phenomenon of
increased intra-BRICS trade confined to a few of the members. The individual country
export shares are shown in Table 1 above.
As can be seen from Table 1, between 1995 and 2007, share of intra BRICS
exports of each of the member countries in its world exports has increased by 2 to 5
times, the sharpest increase being for Brazil and South Africa. It can also be seen from
Table 1 that the growth rate of each countries‟ exports have been in double digits
particularly in the period 2001-2007. Nor is this restricted to exports as a similar picture
is seen in Table 2 where import shares and growth rates are given.
Table 2: Intra and Extra-BRICS Imports (US $ Millions), 1995-2007
Economy Flow 1995 2000 2007
Annual
Growth rate
in % (1995-
2000)
Annual
Growth rate
in % (2001-
2007)
Brazil
Import from World 53734.3 55850.6 120621.0 1.0 13.7
Intra- BRICS Imports 1035.5 2291.9 17014.4 22.0 39.7
Share in BRICS 1.9 4.1 14.1
China
Import from World 132084.0 225094.0 956115.0 1.0 13.7
Intra- BRICS Imports 6108.7 9782.1 59265.9 22.0 39.7
Share in BRICS 4.6 4.4 6.2
India
Import from World 36592.1 52940.3 218645.0 9.7 26.7
Intra- BRICS Imports 2351.6 4324.9 30746.9 16.5 38.7
Share in BRICS 6.4 8.2 14.1
Russia
Import from World 46301.0 33880.1 199726.0 -7.5 34.4
Intra- BRICS Imports 1372.0* 2425.0 29541.3 15.3 51.7
Share in BRICS 2.9 7.2 14.8
South
Africa
Import from World 27436.1 26770.7 79872.6 -0.6 20.0
Intra- BRICS Imports 952.0 1620.1 12563.4 14.2 40.7
Share in BRICS 3.5 6.1 15.7
Source: Same as Table 1.
Note: * exclude South Africa 1995 import figure.
Hence, trends in intra-BRICS trade seem to have mirrored the trends in global
trade of the countries of the South.
10
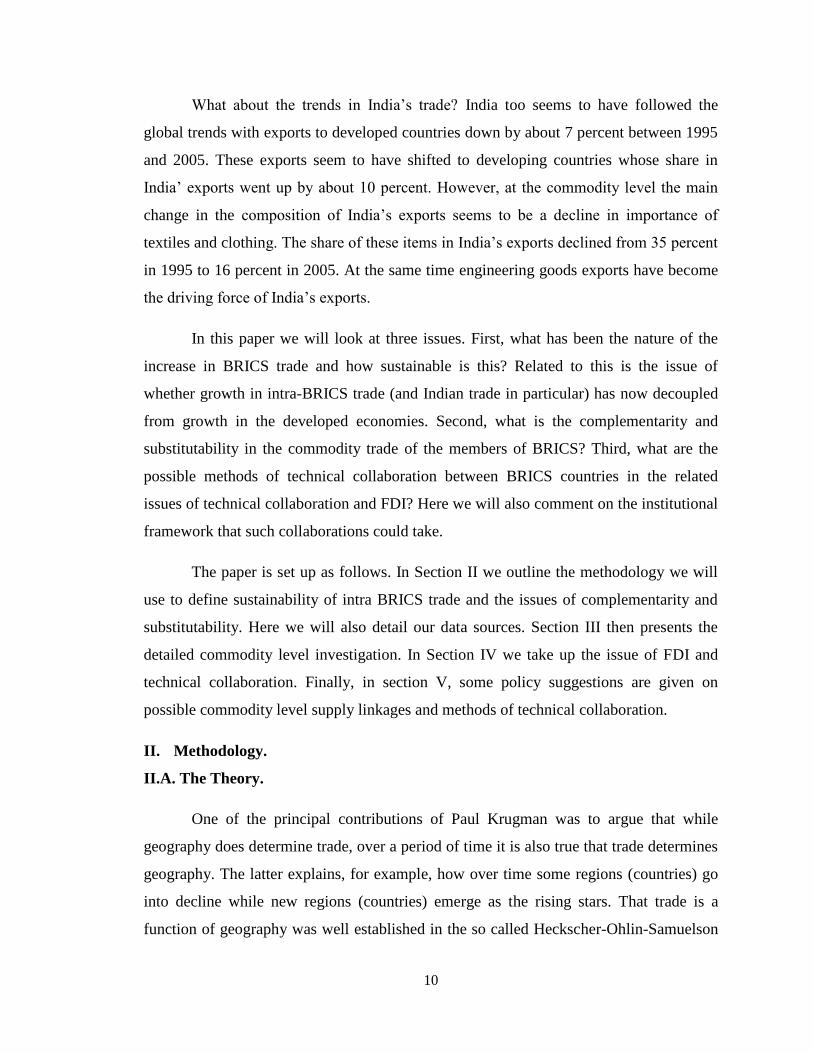
What about the trends in India‟s trade? India too seems to have followed the
global trends with exports to developed countries down by about 7 percent between 1995
and 2005. These exports seem to have shifted to developing countries whose share in
India‟ exports went up by about 10 percent. However, at the commodity level the main
change in the composition of India‟s exports seems to be a decline in importance of
textiles and clothing. The share of these items in India‟s exports declined from 35 percent
in 1995 to 16 percent in 2005. At the same time engineering goods exports have become
the driving force of India‟s exports.
In this paper we will look at three issues. First, what has been the nature of the
increase in BRICS trade and how sustainable is this? Related to this is the issue of
whether growth in intra-BRICS trade (and Indian trade in particular) has now decoupled
from growth in the developed economies. Second, what is the complementarity and
substitutability in the commodity trade of the members of BRICS? Third, what are the
possible methods of technical collaboration between BRICS countries in the related
issues of technical collaboration and FDI? Here we will also comment on the institutional
framework that such collaborations could take.
The paper is set up as follows. In Section II we outline the methodology we will
use to define sustainability of intra BRICS trade and the issues of complementarity and
substitutability. Here we will also detail our data sources. Section III then presents the
detailed commodity level investigation. In Section IV we take up the issue of FDI and
technical collaboration. Finally, in section V, some policy suggestions are given on
possible commodity level supply linkages and methods of technical collaboration.
II. Methodology.
II.A. The Theory.
One of the principal contributions of Paul Krugman was to argue that while
geography does determine trade, over a period of time it is also true that trade determines
geography. The latter explains, for example, how over time some regions (countries) go
into decline while new regions (countries) emerge as the rising stars. That trade is a
function of geography was well established in the so called Heckscher-Ohlin-Samuelson
11
(HOS) model of trade. What Krugman suggested is that, in a dynamic setting, it is also
possible that trade may determine geography (see, Krugman, 1991).
Currently we have three possible competing explanatory models of trade. The
HOS model indicates that trade is determined by a country‟s resources. So a country‟s
exports must use extensively its relatively abundant resources. Second, the Ricardian
model emphasizes the technology aspect: that what a country exports is a function of
what it can produce technologically at lowest cost compared to other countries. This was
also the implication of Vernon‟s product cycle hypothesis (Vernon, 1979). The similarity
of the HOS and Ricardian models lies in their focus on the dissimilarities between
countries as the factor propelling trade. This dissimilarity could be in resources,
technology, consumer tastes etc. Both models also imply that here trade is in dissimilar
goods and this is often labeled as inter-industry trade.
The third model of trade, however, focuses on the similarity of countries as being
the basis of trade. This was first stated by Linder (1961) when he argued that countries
which are similar in economic structure tend to trade precisely because they have similar
demand patterns. Hence, in this trade, exporters do not have to invest heavily in sale
promotion activities like R&D because consumers in these countries are already familiar
with these products. This was formalized by Krugman (1979) in a model of trade with
differentiated goods. The crucial difference from earlier models was that this trade
between similar countries was also in similar but differentiated goods and labeled intra-
industry trade as distinct from the trade in dissimilar homogenous goods which occurs in
the HOS and Ricardian worlds. In other words, trade between two countries exchanging
computers for food would be labelled inter industry trade, while trade in different types
of steel products would be categorised as intra-industry trade.
The type of trade taking place has enormous policy implications. Typically, when
trade expansion takes the HOS or Ricardian route, countries must undergo structural
change (because exporting sector expands and importing sector contracts) as trade
expands. Thus, for example, typically trade between developed countries (N) and
developing countries (S) is of the HOS or Ricardian type. Here, for example, as the S
expands its exports of labour or land intensive commodities, it simultaneously imports
12
commodities like computers, cars, other capital goods which use more of capital or high
technology. This leads to a disappearance of the import substituting sectors in both sets of
countries with consequent dislocation of labour employed in these sectors. Political
resistance to expansion of such trade follows and the structural adjustment needs a lot of
time till labour is relocated and/or re-skilled. This has happened in, for example, the
textiles sectors in N and some capital goods sectors in S. To put it another way, trade
expansion of the HOS or Ricardian variety typically involves labour displacement in all
countries.
On the other hand, trade of the Krugman variety (intra industry trade in similar
commodities) typically involves adjustment which only implies relocation of labour
within the same industry and not any major labour dislocation across unrelated industries.
Most N-N and S-S trade is usually of this type. Since no labour displacement takes place,
expansion of such trade faces less political resistance.
The theory outlined above will be used to look at the sustainability of intra-
BRICS trade. If intra-BRICS trade is mainly composed of labour intensive goods which
are typically exported to the N countries, it could be argued that this trade is not
sustainable but is driven by temporary demand problems in the N countries. On the other
hand, if this trade is in items where trade is typically of the intra industry variety it is
likely to be sustainable. The issue then here is of the proper supply linkages, FDI and
technology. Second, if trade is of the intra-industry variety it typically implies that trade
is symmetrical. Here some tests of this trade symmetry will be conducted.
On the issue of technology, it has been argued that the principal factor that drives
trade today is FDI which also implies technological interchange between countries. It is
in fact recognized that the existence of FDI determines technology and productivity to a
greater extent than patent and technology purchase agreements (see, Pant and Mondal,
2010; Kathuria, 2000) in our study, we will see what have been the trends in intra BRICS
flows of FDI and the sectoral composition of such flows. The issue is whether FDI trends
are establishing supply linkages which can make intra-BRICS trade sustainable.

13
II.B. The Data
Since this is a short term study we will concentrate on the implications of trade
patterns and not go into the detailed history of domestic supply and demand issues in
individual countries. The emergence of the BRICS trade bloc is a new feature of world
trade. Hence, the only possibility is to infer sustainability based on past performance. We
have chosen the period of study as 1995-2007 as this was a period of fairly calm growth
in world trade with no major exogenous changes. In particular, the period after 2007 was
marked by the impact of the global recession particularly in developed countries. Hence,
looking at trade in the post 2007 period would have biased our results in favour of intra
BRICS trade. Second, this was also the period, after the establishment of the WTO in
1995, which was characterized by a sharp decline in global tariffs and consequent trade
expansion. Post 2007, the impact of the recession was felt in the form of non-tariff
barriers particularly in developed countries. This would again bias our results. Hence, by
concentrating on the period upto 2007 we are eliminating any exogenous factors that may
bias our results in favour of intra BRICS trade.
Trade data is often unreliable mainly because of differing country definitions,
currency conversion and year of assessment. To eliminate these problems we have relied
entirely on the COMTRADE data base using the SITC, Rev. 3 definitions of
commodities. Data disaggregation is taken at the 5-digit level where necessary. Other
information used is based on secondary published sources.
II.C. Analytical Framework
The issues to be analysed are those relating to sustainability of intra BRICS trade,
complementarity and substitutability of exports of BRICS countries, nature of intra
BRICS trade (in high or low technology commodities) and, finally, identifying
commodities where the issues of technology transfer and collaboration are important.
The issue of sustainability is analysed in three ways. First, we look at each of the
member country‟s trade (at the 4-digit SITC classification) with other members and
with the rest of the world. We then look at whether a country is a net exporter to BRICS
and the rest of the world. For those items in which a country is a net exporter to both

14
BRICS and the rest of the world we argue that trade in these commodities is sustainable.
Second, it is presumed that sustainable trade between similar countries is generally of
the intra-industry variety. In the literature it has been argued that intra-industry trade
also implies trade symmetry (see, Theil, 1979). We will thus apply some measures of
symmetry to look at the trends in trade symmetry (in aggregate) in BRICS over our
reference period. Third, sustainability is also interpreted as implying that countries of
BRICS should have a comparative advantage in general in those commodities. In other
words, countries should not be exporting to other BRICS countries commodities in
which they do not have the comparative advantage to export to the rest of the world as in
that case the importing country is incurring a welfare loss in its imports. In this case in
the language of customs union theory, the BRICS bloc would lead to trade diversion
(see, Lipsey, 1957; Meade, 1955). We argue that this trade is not sustainable as the
importing country has an incentive to switch trade to countries outside the BRICS bloc.
To analyse this issue, we will use the measures of revealed comparative advantage
(RCA) commonly used in the literature (see, for example, Balassa, 1965).
Fourth, we will use the UNIDO (2009) definition to separate trade of BRICS
countries into natural resource based, low tech, medium tech and high technology trade.
We will then characterize intra-BRICS trade by this parameter.
Next the issue of substitutability and complementarity in the exports of the
BRICS countries is addressed. This will be in relation to exports to non-BRICS
countries of manufactured goods. Once again the measure of RCA will be used to
differentiate between commodities. It will be argued that where member countries have
an RCA greater than 1 in the same commodity then they are competitors in third
countries. The attempt will be to try to identify such commodities. Where, however,
countries are exporting outside the bloc in non-competing commodities, there is some
complementarity if the commodities belong to the same industry group.
Fifth, as we have already noted we will look at trends in FDI among BRICS
countries to identify in which areas technology transfer seems to be occurring and
possible supply side arrangements to facilitate this.

15
Finally, at the highest possible level of disaggregation we will try to identify
commodities where intra BRICS trade seems most promising and where concentrated
efforts of trade and technological cooperation might yield best results.
III. Empirical Analysis.
The issue of sustainability of SS trade can be addressed at the macro and micro
levels. In the next section we look at some macro issues.
III.A. Macro Issues in Sustainability
The issue of sustainability is crucial. We have noted in the introduction that a
similar jump in SS trade took place in the 1970s but that was not sustainable as it was
mainly due to temporary demand slump in the developed countries. How true is this here
in our reference period 1995-2007? Table 3 below gives some statistics on GDP growth
rates, per capita incomes and demography for the BRICS countries in the periods 1995-
2000 and 2000-2007.
Table 3: Economic and Demographic Characteristics of BRICS Countries
Indicators Year India Brazil China Russia SA
Compound Growth
Rate of GDP in Current
Prices (in %)
1995 -00 5.5 -3.5 10.5 -3.7 -2.5
2000-07 13.2 11.3 15.9 25.8 11.6
Per Capita in Current
Prices (in US $)
1995 371.0 4844.0 601.0 2116.0 3684.0
2007 945.0 7281.0 2559.0 9100.0 5975.0
Population (in Millions)
1995 953.2 161.7 1189.7 148.5 41.4
2000 1042.6 174.2 1244.8 146.7 44.9
2007 1164.7 190.1 1306.2 141.9 49.2
% of Population above
15 years 2001 62.5 69.1 N.A. 82.5* 63.9**
% share of 60+ pop to
total pop 2003 7.4*** 9.3 N.A. 17.8 2.9
Source: (1) International Monetary Fund, World Economic Outlook Database, April
2010; (2) Labour Statistics, ILO.
Note: * Russia 2002; ** South Africa 2003; *** India 2001.
Inspection of Table 3 clearly indicates that the second period (2000-2007) was
characterized by double –digit growth rates for all the countries along with a two to four
times increase in the per capita incomes. Clearly income growth in these countries
16
sustained growth in BRICS trade (relative to world trade) already shown in Table 1 and
2. This sustainability is also clear from the favourable demographics of these countries
in 2001. As shown in the last two rows of Table 3, these countries have a fairly young
population with only Russia having more than 10 percent of its population above the age
of 60.
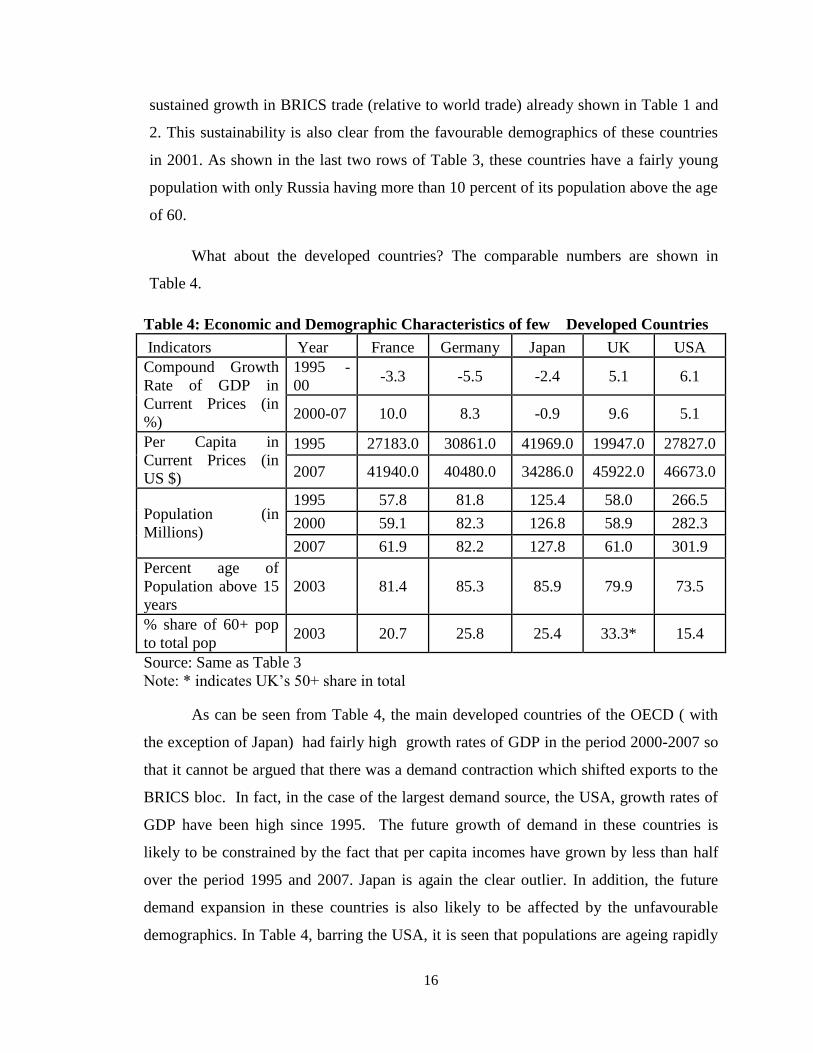
What about the developed countries? The comparable numbers are shown in
Table 4.
Table 4: Economic and Demographic Characteristics of few Developed Countries
Indicators Year France Germany Japan UK USA
Compound Growth
Rate of GDP in
Current Prices (in
%)
1995 -
00 -3.3 -5.5 -2.4 5.1 6.1
2000-07 10.0 8.3 -0.9 9.6 5.1
Per Capita in
Current Prices (in
US $)
1995 27183.0 30861.0 41969.0 19947.0 27827.0
2007 41940.0 40480.0 34286.0 45922.0 46673.0
Population (in
Millions)
1995 57.8 81.8 125.4 58.0 266.5
2000 59.1 82.3 126.8 58.9 282.3
2007 61.9 82.2 127.8 61.0 301.9
Percent age of
Population above 15
years
2003 81.4 85.3 85.9 79.9 73.5
% share of 60+ pop
to total pop 2003 20.7 25.8 25.4 33.3* 15.4
Source: Same as Table 3
Note: * indicates UK‟s 50+ share in total
As can be seen from Table 4, the main developed countries of the OECD ( with
the exception of Japan) had fairly high growth rates of GDP in the period 2000-2007 so
that it cannot be argued that there was a demand contraction which shifted exports to the
BRICS bloc. In fact, in the case of the largest demand source, the USA, growth rates of
GDP have been high since 1995. The future growth of demand in these countries is
likely to be constrained by the fact that per capita incomes have grown by less than half
over the period 1995 and 2007. Japan is again the clear outlier. In addition, the future
demand expansion in these countries is also likely to be affected by the unfavourable
demographics. In Table 4, barring the USA, it is seen that populations are ageing rapidly
17
with over 20 percent of population in the age group 60 and above.
It may thus be reasonable to conclude that the expansion of BRICS trade has not
been at the expense of decline in demand in the developed world. It is also clear, at the
macro level, that demographics do not favour future growth in these countries even after
recovery from the current recession.
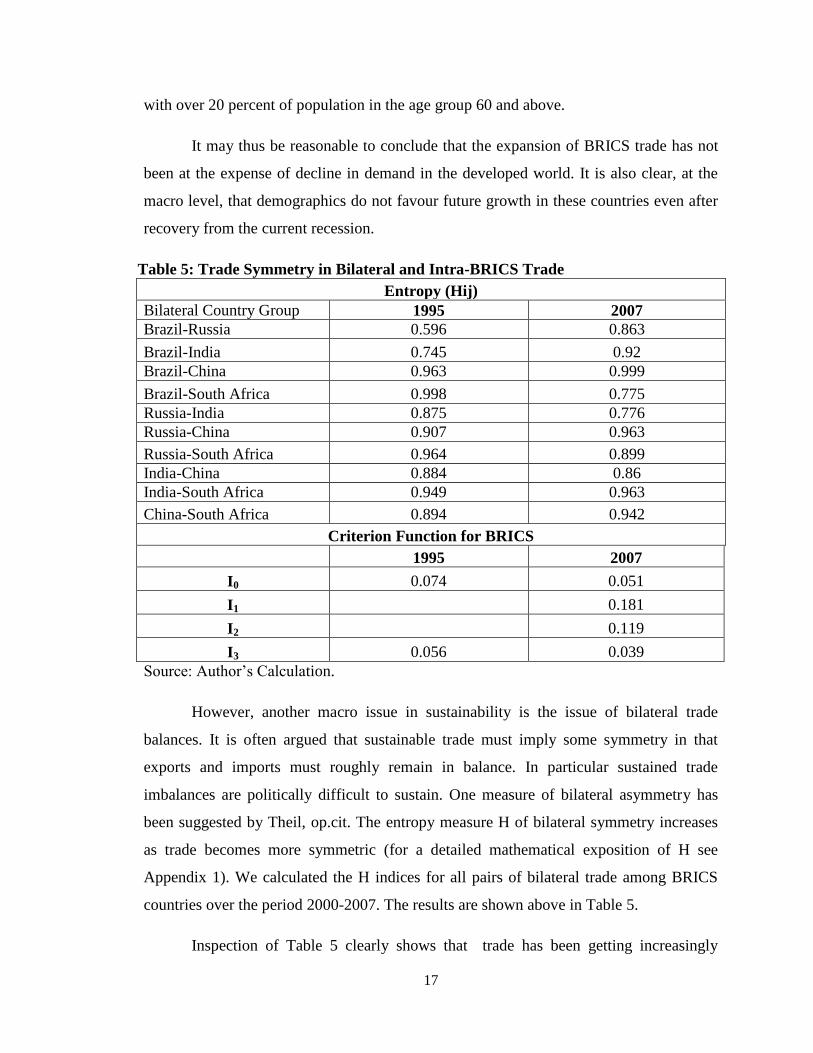
Table 5: Trade Symmetry in Bilateral and Intra-BRICS Trade
Entropy (Hij)
Bilateral Country Group 1995 2007
Brazil-Russia 0.596 0.863
Brazil-India 0.745 0.92
Brazil-China 0.963 0.999
Brazil-South Africa 0.998 0.775
Russia-India 0.875 0.776
Russia-China 0.907 0.963
Russia-South Africa 0.964 0.899
India-China 0.884 0.86
India-South Africa 0.949 0.963
China-South Africa 0.894 0.942
Criterion Function for BRICS
1995 2007
I0 0.074 0.051
I1 0.181
I2 0.119
I3 0.056 0.039
Source: Author‟s Calculation.
However, another macro issue in sustainability is the issue of bilateral trade
balances. It is often argued that sustainable trade must imply some symmetry in that
exports and imports must roughly remain in balance. In particular sustained trade
imbalances are politically difficult to sustain. One measure of bilateral asymmetry has
been suggested by Theil, op.cit. The entropy measure H of bilateral symmetry increases
as trade becomes more symmetric (for a detailed mathematical exposition of H see
Appendix 1). We calculated the H indices for all pairs of bilateral trade among BRICS
countries over the period 2000-2007. The results are shown above in Table 5.
Inspection of Table 5 clearly shows that trade has been getting increasingly

18
asymmetric for almost half of the set of bilateral pairs of countries, that is, Brazil-South
Africa, Russia-India, Russia-South Africa and India-China.
However it is possible that bilateral trade asymmetry does not imply asymmetry
for the BRICS bloc as a whole. To what extent has asymmetry increased or decreased for
the BRICS countries taken together?
To look at trade symmetry for the matrix of BRICS trade we have used Theil‟s
criterion function measure of asymmetry which is based on the principles of information
theory. The criterion function measure, I, is defined as
I , for i≠j
And Pij refers to the share of country i‟s exports to country j as a ratio of total
intra-BRICS exports. It is easy to see that if the trade of any two countries is symmetric
then Pij= Pji and I =0. It is clear, then, that an increase in the value of I implies increasing
asymmetry of trade. The values of I for 1995 and 2007 is given by I0 . What we want to
measure, however, is to what extent symmetry has changed between our reference years
1995 and 2007? We use three measures for trade symmetry for 2007 compared to our
reference period 1995. First, I1 is an application of I to the actual trade matrix for 2007
given the information from 1995 trade matrix. Second, assuming that the exports of
1995 are a true guess of the probability of exporting in 2007 we get the measure I2.
Finally, the trade matrix for 2007 is re-estimated so that I2 is calculated from a matrix
whose total exports and imports equal the actual exports-imports of each country in
2007 but where the probability of exporting is taken from the 1995 trade matrix. This
gives us I3 (for details see Appendix 1).
It is also obvious that I is necessarily positive if there is trade imbalance for any
country. However, it is possible to adjust the trade matrix for these trade imbalances (
see Appendix 1 for details). This allows us to define the functions I3. The values of I3 are
calculated for 2000 and 2007. The results are shown in the bottom half of Table 5.
From Table 5 it can be seen that asymmetry seems to have declined in 2007

19
relative to 1995 as I0 in 2007 (.051) is smaller than I0 in 1995 (.074). Comparing the
unadjusted measure of I (i.e. I1) with the adjusted I (i.e. I2), we see that the I2 is smaller
than the unadjusted measure of I i.e. I1.; this means that the 2007 intra-BRICS trade is
more symmetric with reference to 1995 intra-BRICS trade when we take adjusted I
rather unadjusted I.. However, if we took the 1995 trade pattern as one that would
prevail in 2007, we see that asymmetry has actually increased: I2 > I0. The same
asymmetry is implied in comparing I3 to I0 in 2007 and 1995. Last, if we impose trade
balance on the member countries, we see that asymmetry would have decreased
between 1995 and 2007: the value of I3 has fallen between 1995 and 2007. Hence, we
conclude that asymmetry in trade has been driven by trade imbalances and removal of
these imbalances is merited as this would make trade more symmetric. The issue of trade
imbalances does merit attention within the BRICS bloc.
III.B. Trade and Sustainability of BRICS trade
Before looking at disaggregated trade statistics, it is worthwhile to look at the
inter-country pattern of BRICS trade in the period of 1995 to 2007. Tables 6 and 7
below give the pattern of BRICS trade for each of the countries for both exports and
imports.
Table 6: Percentage Share of Intra-BRICS Exports to Total Country Exports, 1995-

20
2007
Partner Country
Exporting Country Year Brazil China India Russia SA
Brazil
1995 0 51.1 13.6 24.2 11.1
2000 0 53.5 10.7 20.9 14.9
2007 0 62.5 5.6 21.7 10.2
China
1995 20 0 20.1 43.8 16.1
2000 20.3 0 25.9 37 16.8
2007 16 0 33.7 39.9 10.4
India
1995 4.8 18.6 0 58.4 18.2
2000 9.2 35.2 0 40.9 14.7
2007 13.2 65.7 0 6.4 14.7
Russia
1995 2.4 86.8 10.8 0 NA
2000 6.3 80.9 11.9 0 0.9
2007 6.5 78.5 13.6 0 1.4
South Africa
1995 35.8 34.2 23.5 6.5 0
2000 21.5 35.7 39.6 3.2 0
2007 8.4 67.4 21.8 2.4 0
Source: UN-COMTRADE.
Inspection of Tables 6 and 7 reveal some interesting trends. For one, China‟s
dominance is clear. In Table 6, Brazil, India and South Africa have switched to China as
their main trade partner. For India and Brazil this has been at the expense of Russia and
for South Africa at the expense of Brazil. Only Russia has reduced the share of its
exports going to China in favour of India. Second, India has remained an important
market for Brazil and South Africa while becoming more important for Russia. Clearly,
then, while China has emerged as the main market for the other countries, India is the
second most important market in the trade matrix.
Second, a look at the pattern of imports in Table 7 indicates clearly that China has
become the main source of imports of all the countries at the expense of traditional
trading partners. It is worth noting that India and China account for 80 percent or more
of the imports from and exports to the all other BRICS countries.
21
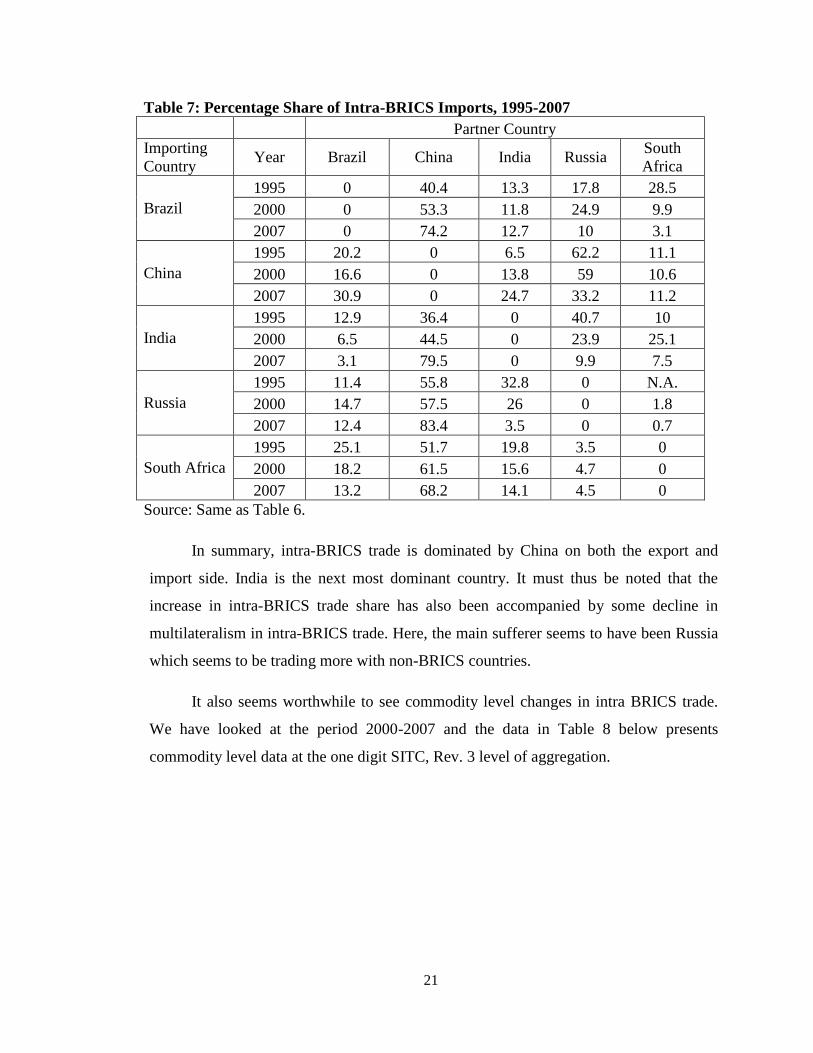
Table 7: Percentage Share of Intra-BRICS Imports, 1995-2007
Partner Country
Importing
Country Year Brazil China India Russia
South
Africa
Brazil
1995 0 40.4 13.3 17.8 28.5
2000 0 53.3 11.8 24.9 9.9
2007 0 74.2 12.7 10 3.1
China
1995 20.2 0 6.5 62.2 11.1
2000 16.6 0 13.8 59 10.6
2007 30.9 0 24.7 33.2 11.2
India
1995 12.9 36.4 0 40.7 10
2000 6.5 44.5 0 23.9 25.1
2007 3.1 79.5 0 9.9 7.5
Russia
1995 11.4 55.8 32.8 0 N.A.
2000 14.7 57.5 26 0 1.8
2007 12.4 83.4 3.5 0 0.7
South Africa
1995 25.1 51.7 19.8 3.5 0
2000 18.2 61.5 15.6 4.7 0
2007 13.2 68.2 14.1 4.5 0
Source: Same as Table 6.
In summary, intra-BRICS trade is dominated by China on both the export and
import side. India is the next most dominant country. It must thus be noted that the
increase in intra-BRICS trade share has also been accompanied by some decline in
multilateralism in intra-BRICS trade. Here, the main sufferer seems to have been Russia
which seems to be trading more with non-BRICS countries.
It also seems worthwhile to see commodity level changes in intra BRICS trade.
We have looked at the period 2000-2007 and the data in Table 8 below presents
commodity level data at the one digit SITC, Rev. 3 level of aggregation.
22
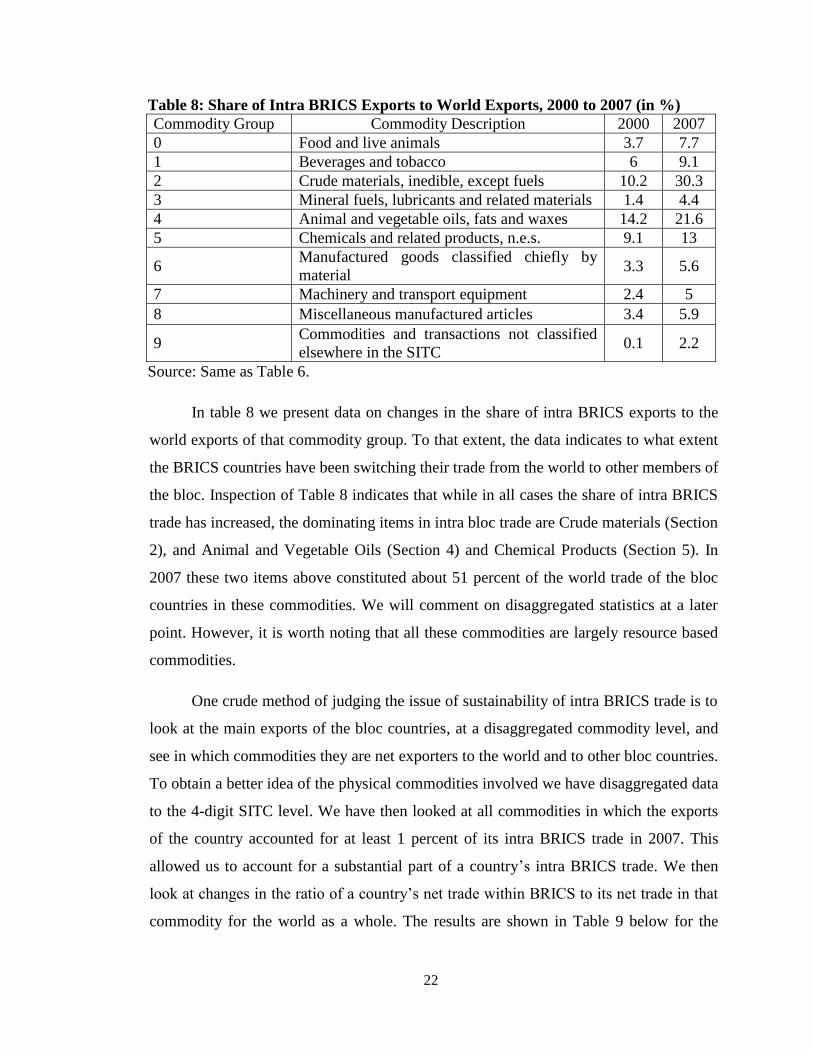
Table 8: Share of Intra BRICS Exports to World Exports, 2000 to 2007 (in %)
Commodity Group Commodity Description 2000 2007
0 Food and live animals 3.7 7.7
1 Beverages and tobacco 6 9.1
2 Crude materials, inedible, except fuels 10.2 30.3
3 Mineral fuels, lubricants and related materials 1.4 4.4
4 Animal and vegetable oils, fats and waxes 14.2 21.6
5 Chemicals and related products, n.e.s. 9.1 13
6 Manufactured goods classified chiefly by
material 3.3 5.6
7 Machinery and transport equipment 2.4 5
8 Miscellaneous manufactured articles 3.4 5.9
9 Commodities and transactions not classified
elsewhere in the SITC 0.1 2.2
Source: Same as Table 6.
In table 8 we present data on changes in the share of intra BRICS exports to the
world exports of that commodity group. To that extent, the data indicates to what extent
the BRICS countries have been switching their trade from the world to other members of
the bloc. Inspection of Table 8 indicates that while in all cases the share of intra BRICS
trade has increased, the dominating items in intra bloc trade are Crude materials (Section
2), and Animal and Vegetable Oils (Section 4) and Chemical Products (Section 5). In
2007 these two items above constituted about 51 percent of the world trade of the bloc
countries in these commodities. We will comment on disaggregated statistics at a later
point. However, it is worth noting that all these commodities are largely resource based
commodities.
One crude method of judging the issue of sustainability of intra BRICS trade is to
look at the main exports of the bloc countries, at a disaggregated commodity level, and
see in which commodities they are net exporters to the world and to other bloc countries.
To obtain a better idea of the physical commodities involved we have disaggregated data
to the 4-digit SITC level. We have then looked at all commodities in which the exports
of the country accounted for at least 1 percent of its intra BRICS trade in 2007. This
allowed us to account for a substantial part of a country‟s intra BRICS trade. We then
look at changes in the ratio of a country‟s net trade within BRICS to its net trade in that
commodity for the world as a whole. The results are shown in Table 9 below for the

23
years 2000 and 2007 (for detailed results see Appendix 2).
Table 9: Ratio of Net Intra BRICS Trade to Trade With Rest of the World, 2000
and 2007* (in %)
Product Code 2000 2007
Brazil
1212 9.1 19.7
2222 16.4 42.9
2515 4.2 14.1
2815 9.5 43.9
2816 10.2 18.6
4211 26.9 34.9
6114 6.1 25.8
6715 -1.1 13.4
7832 1.3 25.5
China
3250 24.4 24.3
5413 19.5 40.6
6732 0.0 12.4
7641 6.7 14.1
7821 -0.5 44.6
8432 3.8 18.1
8442 3.4 17.2
8453 1.7 12.2
8454 1.7 10.2
8514 6.1 18.0
India
2631 15.7 109.3
2731 21.6 48.8
2815 28.7 801.7
2816 124.6 5207.7
2852 48.5 176.7
2875 0.0 154.6
2879 63.8 548.6
5112 2.4 14.7
5429 17.3 15.1
5751 25.3 45.9
6821 35.2 30.8
Russia
2321 23.1 19.5
2474 26.6 62.9
2475 16.4 47.3
2515 44.1 60.5
5121 24.5 29.2
5156 62.6 49.9

24
5621 21.6 25.2
5623 71.1 69.6
5629 21.4 26.8
6751 36.0 37.1
7144 39.3 69.9
7648 67.2 110.0
South Africa
2513 12.7 20.7
2681 13.6 47.5
2816 32.4 34.2
2831 0.0 71.1
2877 1.2 52.7
2879 2.2 67.7
2882 15.2 23.9
3212 8.3 14.5
5223 89.9 84.7
6715 4.1 20.7
6753 2.7 20.9
6755 10.6 21.0
Source: WITS.
Note: * selection of commodities has been done on the basis of 1 percent or above share of
respective commodities in total intra BRICS trade of particular country.
Inspection of Table 9 tells us in which commodities a country‟s net trade to
BRICS has increased relative to its exports to the world. From the table it can be seen
that, in almost all cases, the ratios have increased substantially (for details of
commodities not included in Table 9, see Appendix 2). This seems to indicate that the
members of the BRICS bloc are redirecting more and more of their reasonably
competitive exports (still exporting to the world) towards the bloc. As Appendix 2 also
shows, there are some commodities where the ratio in 2007 was negative indicating that
for that commodity a country is a net exporter to the bloc but net importer from the rest
of the world. Hence the county may not have a competitive advantage in exports of these
commodities. However, there are very few commodities in this category and restricted to
Brazil (four commodity groups) and South Africa (one group). For Brazil these
commodities are Crude petroleum, Copper Ores and Concentrates, Other ferro
alloys (Silicon, Manganese, Chromium) and Motor Vehicle parts (other than chassis
and bodies). However, the net exports of these items are of marginal value.
25
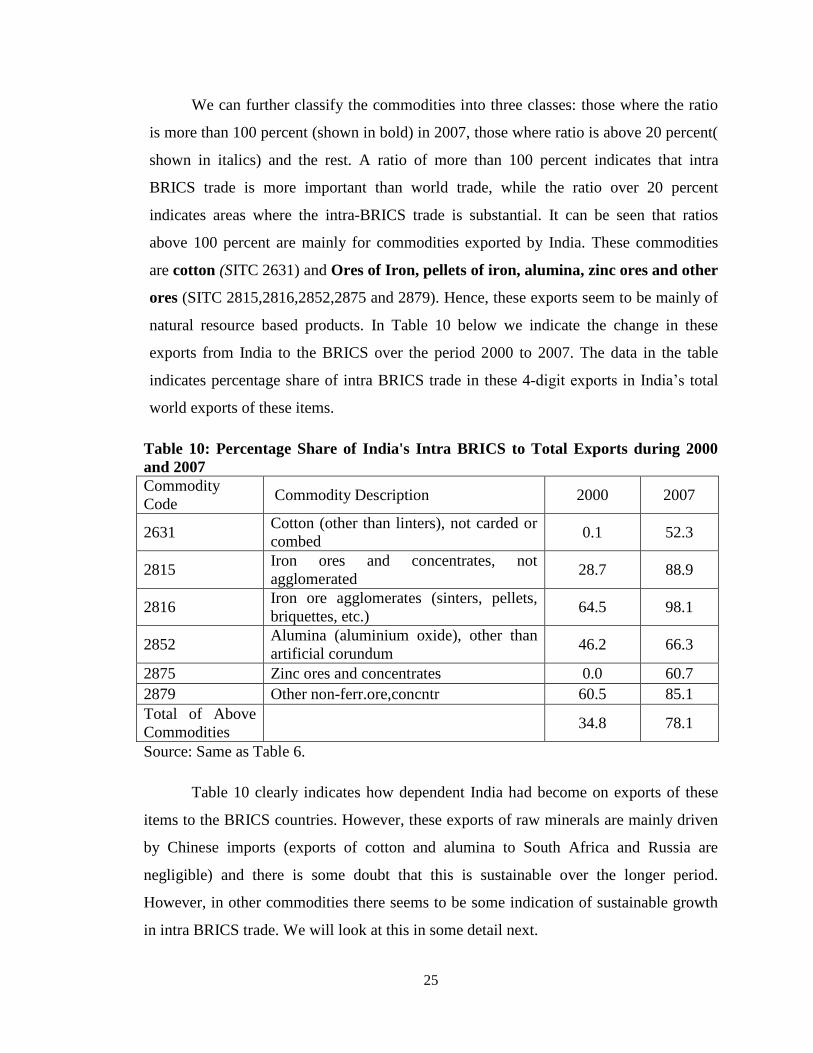
We can further classify the commodities into three classes: those where the ratio
is more than 100 percent (shown in bold) in 2007, those where ratio is above 20 percent(
shown in italics) and the rest. A ratio of more than 100 percent indicates that intra
BRICS trade is more important than world trade, while the ratio over 20 percent
indicates areas where the intra-BRICS trade is substantial. It can be seen that ratios
above 100 percent are mainly for commodities exported by India. These commodities
are cotton (SITC 2631) and Ores of Iron, pellets of iron, alumina, zinc ores and other
ores (SITC 2815,2816,2852,2875 and 2879). Hence, these exports seem to be mainly of
natural resource based products. In Table 10 below we indicate the change in these
exports from India to the BRICS over the period 2000 to 2007. The data in the table
indicates percentage share of intra BRICS trade in these 4-digit exports in India‟s total
world exports of these items.
Table 10: Percentage Share of India's Intra BRICS to Total Exports during 2000
and 2007
Commodity
Code Commodity Description 2000 2007
2631 Cotton (other than linters), not carded or
combed 0.1 52.3
2815 Iron ores and concentrates, not
agglomerated 28.7 88.9
2816 Iron ore agglomerates (sinters, pellets,
briquettes, etc.) 64.5 98.1
2852 Alumina (aluminium oxide), other than
artificial corundum 46.2 66.3
2875 Zinc ores and concentrates 0.0 60.7
2879 Other non-ferr.ore,concntr 60.5 85.1
Total of Above
Commodities 34.8 78.1
Source: Same as Table 6.
Table 10 clearly indicates how dependent India had become on exports of these
items to the BRICS countries. However, these exports of raw minerals are mainly driven
by Chinese imports (exports of cotton and alumina to South Africa and Russia are
negligible) and there is some doubt that this is sustainable over the longer period.
However, in other commodities there seems to be some indication of sustainable growth
in intra BRICS trade. We will look at this in some detail next.

26
The issue of sustainability involves some further consideration of the nature of
intra BRICS trade. This is also important in linking the issue of trade to considerations of
technology transfer which we take up at the end of this study. To look at this we break up
the trade pattern shown in Table 9 in terms of the technology content of exports. We use
the UNIDO definition (see, UNIDO, 2009 ) to classify exports into resource based, low
technology, medium technology and high technology items. For a description of the
UNIDO classification see Appendix 3). The changes, between 2000 and 2007, in the
composition of exports by this classification is given below in Table 11. (For the detailed
commodity data see Appendices 4 and 5).
Table 11: Share in Intra BRICS exports, 2000 to 2007: Technological Classification
Brazil China India Russia SA
Technology
Classification 2000 2007 2000 2007 2000 2007 2000 2007 2000 2007
Resource Based 64.8 72.7 4.0 - 29.5 42.7 21.0 48.9 44.8 58.8
Low Tech Exports 1.9 3.3 21.4 11.4 17.3 - - - 2.4 5.4
Medium Tech
Exports 5.4 5.2 5.0 5.6 - 5.2 26.6 19.5 13.7 10.4
High Tech Exports 1.8 - 5.4 10.5 5.5 2.2 6.8 1.1 - -
Source: Same as Table 9.
From table 11 it is clear that all the countries, barring China, have been
excessively dependent on exports of natural resources. Obviously, the main destination
is China. There seems to be some technological imbalance in the intra BRICS trade as
China clearly dominates in high technology (HT) items. Here, the share of HT items in
exports to BRICS countries has been in fact falling for India and Russia. Second, there
does seem to some comparable presence of each of the BRICS countries in medium
technology (MT) products. From the point of view of sustainability of intra BRICS
trade, it does seem necessary to look in details at the prospects of increasing exports of
technologically advanced products preferably in MT and HT. We will come back to this
theme in a later section.
It seems worthwhile to further identify the commodities listed in Appendix 5 by
their importance in trade. Our basic commodity definition in Appendices 4 and 5 is
taken at the 4-digit level of classification. We looked at two classes of commodities:

27
those where the share of the 4-digit commodity in the 2-digit commodity group has
increased between 2000 and 2007 (increasingly important commodities) and those
where this share has fallen over this period but which accounted for at least 10 percent
of 2-digit intra BRICS trade (for each country) in 2007 (important commodities). In
Table 12 below we list those 4-digit commodities which belong to the above two
commodity groups and which account for at least one percent of a country‟s intra
BRICS trade in 2007. The commodities are also classified by their technological
content.
Table 12: Important and Increasingly Important Commodities for BRICS, 2000 to 2007
Brazil
Technology
Classification Product
Code
4 digits Increasingly
Important
4 digits important
commodities
Resource Based Exports
2222 2222
2815 2815
2816 2816
4211 4211
India
Resource Based Exports 2631 2631
5112 5112
Medium Tech. Exports 5751 5751
High Tech Exports 5429
5429
Russia
Resource Based Exports
2474 2474
2475 2475
5121
5621 5621
5629 5629
South Africa
Resource Based Exports
2816 2816
2877 2877
2879 2879
5223
5223
Medium Tech. Export 5121 5121
Source: Same as Table 6.
Note: Division is based on UNIDO, 2009.
Inspection of Table 12 indicates that there are very few quantitatively important
commodities in intra BRICS exports. In fact, there are no such commodities for China‟s
intra BRICS trade while for the others the trade is dominated by resource based

28
commodities. To put it another way, of the commodities which comprise one percent or
more of a country‟s intra-BRICS trade in 2007, there are very few which belong to the
set of commodity groups where intra BRICS trade is important or has become
increasingly important between 2000 and 2007. In fact, these few commodities largely
belong to the set of resource based commodities like iron ores and pellets (Brazil,
India, and SA), manganese ores (SA), cotton (India), non-coniferous wood (Russia),
and soya and soya oil (Brazil).
In medium technology exports, the only quantitatively important products are
propylene polymers (India) and nitrogenous fertilizers (Russia). Even here, only for
India have the medium tech exports increased in importance after 2000.
Thus, on one can conclude that quantitatively the importance of growing intra
BRICS trade in LT, MT or HT products is insignificant. At present the dominance in
trade is of resource based products. This is unlikely to be sustainable both from the point
of view of demand from China and long-run supply constraints from other BRICS
members. Sustainability will lie in exports in other technology areas.
III.C. Complementarity and Substitutability
The issue of complimentarity and substitutability is important in that it is likely
that countries could have technical collaboration in areas where there is some
complimentarity in production. However, where products are close substitutes in
production ( or consumption) it is possible that such technical collaboration may not be
welcomed. While the issue of technology and cooperation will be dealt with in the next
section, here we will look at measures to identify this complimentarity/substitutability.
We have already noted that measures of Revealed Comparative Advantage (RCA)
will be used to address the issue of complementarity and substitutability among products
exported by the BRICS countries (for a definition of RCA see Balassa,op.cit.). The
essential principle is that if a product exported by two or more countries to third markets (
the rest of the world) have RCAs greater than 1 then these products are competing
29
(substitutes) in world markets (see, for example, Pant et.al., 2010)1. However, this is only
true for similar commodities. This is difficult to define empirically and would normally
require calculating cross price elasticities of substitution in consumption or production
among these products. This requires extensive data. We have used a simpler procedure.
Products of different countries are defined as similar if they fall in the same 5-digit level
of disaggregation which is the highest level of disaggregation available. These products
are substitutable in consumption but horizontally differentiated.
However, if products at the 5 digit level of disaggregation with RCA greater than
1 fall in the same commodity group at the 3-digit (or 2-digit) level but are different in
their 5-digit definition, we argue that these products belong to the same industry but
represent different levels of finish ( are vertically differentiated) and could be considered
as complimentary products: countries could coordinate production of these products for
the world market as they are not direct substitutes for each other.
We calculated these RCA for each country for the year 2007. However, since the
concept of product differentiation is usually applied only to products which are not
heavily resource dependent we did our calculation only for commodities falling in
Sections 4-8 of the SITC classification system. The detailed results are shown in
Appendix 7.
For ease of exposition we list commodities where countries face some
substitutability in third markets in Table 13.
Table 13: Product Substitutability among BRICS Countries, 2007
1 Due to the base affect Balassa‟s index is often an overstatement. To correct this we have
also used a related measure given in UNCTAD (2010). For definition see Appendix 6. It
may be noticed that this has no affect on our results which follow irrespective of which
index is used.

30
Product
Codes Product Name Countries Major Markets
Total sale in major
Markets (in %)
Resource Based Exports
51124 Xylenes, pure
Brazil Mexico; USA 89.0
India China; Indonesia;
Pakistan 83.2
Medium Tech Exports
51213 Butanols
Russia China 89.7
South
Africa
China; Netherlands;
United Arab Emirates 71.8
56216
Urea, whether or
not in aqueous
solution
China US Virgin Isds; India;
USA 59.4
Russia Brazil; Mexico; Peru 63.6
56293
Diammonium
hydrogenorthophos
phate
(diammonium
phosphate)
China India; Pakistan; Thiland;
Viet Nam 72.5
Russia Argentina; Iran; Pakistan 59.7
56294
Ammonium
dihydrogenorthoph
osphate
(monoammonium
phosphate) and
mixtures t
China Brazil; India 45.0
Russia Argentina; Brazil;
Estonia; Ukraine 62.9
57511 Polypropylene Brazil Argentina; Nigeria 35.4
India China; Pakistan; Turkey 50.5
67153 Ferrochromium
India China; Japan; Netherland 63.6
South
Africa
China; Germany; Japan;
Other Asia nes 60.1
68212 Refined copper
Brazil China; Netherland 84.3
India China; Malaysia; Other
Asia nes; Saudi Arabia 70.0
High Tech Exports
54131
Penicillins and their
derivatives with a
penicillanic acid
structure; sal
China India 55.6
India Egypt; Spain; Thailand;
UAE 26.9
54139 Other antibiotics
China Germany; India; Italy;
Rep. of Korea 41.8
India Brazil; China; Germany;
Iran; USA; Viet Nam 37.1
Source: Same as Table 6.

31
Inspection of Table 13 indicates that there are only 10 products at the 5-digit
classification where there is some possibility of substitutability (competition) in third
country markets. These are resource based product Xylenes (Brazil/India). In the MT
industries there are 5 products: Butanols in the chemicals industry ( Russia/SA),
Fertiliser products (China/Russia), one in plastics industry , Polypropyline
(China/India). There are also two products in the HT sectors both belonging to the
Pharmaceutical industries, Penicillins and other Antibiotics (China/India).
However, substitutability also implies competition in the same markets. Closer
inspection of Table 13 (see, column 4) shows that the BRICS countries are by and large
exporting to different markets. The only competition seems to be for Butanols (China)
where India and Brazil are competing, Ammonia products (Brazil) where China and
Russia compete, Ferrochromium (China, Japan) where India and SA compete and
Refined Copper (China) where India and Brazil compete and other antibiotics
(Germany) where India and China compete. It is interesting to note that the main
markets where these countries compete in these products lies within the BRICS group
itself with the exception of pharmaceutical exports. In general, the products where there
seems some substitutability belong to the Chemicals, Metals and Pharmaceutical
industries and the substitutability (competition) is quite limited. It should also be noted
that most of the products above fall in the MT or HT areas where technological
cooperation is usually useful and desirable.
A broad idea on areas where there is some complimentarity among the BRICS
countries is given in Table 14 below. Inspection of Table 14 indicates that there are a
large number of products belonging to various industries where there exists some degree
of product complimentarity between countries. While the details are available in
Appendix 7, we have summarized the main industry heads and countries in Table 14.
From Table 14 it can be seen that our data cover 30-50 percent of the BRICS countries
exports with the exception of iron and steel (I&S) products where our data covers about
20 percent of exports.

32
Table 14: Product Complementarity among BRICS Countries,2007
Industry
Code
Industry
Description
Product
Description Countries Major Markets
Total sale in
major Markets
(in %)
Resource Based
421
Fixed veg.
fat, oils, soft
(Edible Oil)
Soya bean oil;
Sesame;
Groundnut oil;
Sunflower seed
Brazil China; Iran;
Netherlands; India 57.3
China
China, HongKong
SAR; Dem.
People‟s Rep. of
Korea; Japan 52
Russia Egypt; Italy 28.3
51
Various
Chemical
Products
Acyclic
Hydrocarbons;
Benzene;
Amino-alcohol-
phenols;
Acrylonitrile
Brazil
USA;
Netherlands;
Argentina 47.9
India USA; China 21.8
Russia Finland; China 51.7
South
Africa
USA; Japan;
Netherlands 52.5
Low Tech Export
67 Iron and
steel
Iron and Steel;
Flat-rld
products; hotrld;
coldrld
China Rep. of Korea 16.3
South
Africa China; USA
21.6
Medium Tech Export
51
Various
Chemical
Products
Methanol; Fatty
alcohols;
Cyclanic;
Phenol
Brazil
USA;
Netherlands;
Argentina 47.9
India USA; China 21.8
Russia Finland; China 51.7
South
Africa
USA; Japan;
Netherlands 52.5
57
Plastics in
primary
form
Polyethylene;
Polyvinyl
chloride;
Polycarbonates;
Brazil Argentina 30.1
China China; Zambia;
Zimbabwe 33.9
67 Iron and
steel
Iron and Steel;
Ferro-alloys;
Ferrosilico-
manganese;
Flat-rld products
Brazil USA 26.9
India USA 14.7
Russia Iran; Italy;
Turkey 31.3
Source: Same as Table 6.
Inspection of Table 14 shows that the main industries where there exists some

33
complimentarity between the BRICS countries are Vegetable Oils (Brazil, China
Russia), Chemical Products ( Brazil, India, Russia and SA), Plastics ( Brazil, China)
and Iron and Steel (all BRICS countries). In addition, the complimentarity extends from
resource based to HT products.
Our notion of complimentarity (as already noted above) indicates each country
possibly specializing in some stage of production in any given industry. Some more
details can be obtained from Appendix 7. Hence, in vegetable oils there is a clear product
differentiation with Brazil specialising in Soya products, China in Groundnut and
Russia in Sunflower. Since these are resource based products they are obviously not
substitutable in production. However, as they all fall in the category of edible oils there is
some degree of substitutability in consumption. Hence, while there is some possibility
of technical collaboration in production there is the problem of substitutability in
consumption. To explore this further we need to look at another parameter of
substitutability, markets. However, from the second last column of Table 14, it can be
seen that there is very little conflict in markets with each country having a distinct
market segment.
The other area where complimentarity is indicated is the Chemicals industry.
Inspection of Appendix 7 indicates that this seems particularly obvious in the MT areas
where Brazil, India, Russia and SA seem to specialize in different types of Industrial
Alcohols. Technical collaboration in these areas is certainly feasible. Again, from Table
14 we can see that the four countries barring China share common markets of the USA,
China and Netherland both for basic and MT exports.
The third industry where complimentarity seems to exit is Iron and Steel (I&S).
From table 14, this complimentarity is indicated in both LT exports (Hot and Cold
Rolled Steel) and MT exports (Alloys). An inspection of Appendix 7 clearly indicates the
areas of specialization. In LT areas, China concentrates on Iron products, SA in
stainless steel products. In MT products, the specialization is clear: India specializes in
Manganese and Chromium alloys, Russia in semi finished I&S products including
electrical grade. We have already seen that India and SA compete in Chromium alloys
in the Chinese and Japanese markets. Yet in other products there is considerable

34
complimentarity in this industry. Technical collaborations seem indicated. It can also be
seen that Brazil, India and SA export to a common market, the USA.
The last industry where we see some possibilities of complimentarity is the
Plastics industry. Again, from Appendix 7 we see that China and Brazil specialize in
different varieties of Polyethylene products. We have already seen that in one product
(Polypropyline) China and India are direct competitors. However, there seems to be some
indication of a high degree of complimentarity between India, Brazil and China in the
Plastics industry. There does not seem any commonality of markets.
In general, the substitutability and complimentarity seems to exist in four areas:
edible oils, chemicals, metal products and plastics. While in a few products there may
be direct completion in third markets, in most cases the markets are different and there
may be no conflict of interest in collaborative arrangements. However, it is only in
pharmaceutical products where India and China seem to compete in a common third
market outside the BRICS bloc. However, in products in which production
complimentarity is indicated the only common common market outside the BRICS areas
seem to be Netherlands (Chemicals) and Iron and Steel (USA).
IV. Technology, FDI and Cooperation.
In the previous section we have already indicated some areas where some kind of
cooperation between the BRICS countries is feasible. The empirical literature shows that
it is technology which is the most important long term determinant of trade as compared
to resources whether natural or human (see, for example, Trefler, 1995). It is now
acknowledged that trade and technology are linked through Foreign Direct Investment
(FDI). Specifically, FDI could serve as a substitute or complement to trade. Thus if FDI
is linked to domestic market access it could reduce trade while if it is linked to exports it
could enhance trade. Typically, FDI and trade are substitutes when trade is in final goods
but compliments when trade is in intermediates. We also know that declining tariffs and
transport costs have led to the fragmentation of international production so that much of
the trade today is in intermediate inputs (see, for example, Krugman, 2008; UNCTD,
2009). Hence, we can expect that trade and FDI are complimentary. This also explains

35
the crucial role of technology in promoting trade.
Traditionally, developing countries have tried to obtain technology through
purchase of drawings and designs, patents etc. However, the empirical literature now
indicates that this method of obtaining technology is not very effective. In fact , recent
literature on FDI, technology and productivity has concluded that it is the presence of
foreign firms via FDI that has positive productivity impacts on domestic firms via
learning by doing, external economies etc. (see, Pant et.al., 2011, ). It has also been
argued that the impact of FDI on productivity of local firms is a function of the
technology gap between the donor country and host country firms. However, if this gap is
very high then absorption of technology by the host country firms becomes difficult. To
the extent that this gap is likely to be lower between firms in developing countries, it can
be argued that intra BRICS FDI will have greater impact on productivities than FDI from
developed countries (see, Gammeltoft, 2008). In other words, to see the possibility of
technological upgradation one needs to see the trends in FDI in the BRICS countries.
However, FDI needs an enabling environment. This can be created by host
countries via creating the institutional mechanism for cooperation between countries of
BRICS. This institutional mechanism has three components: Direct tax treaties (DTTs),
Bilateral Investment Treaties (BITs) and TRIMS under the WTO and government role in
policy towards FDI.
This section will look at the issues of technology and cooperation using the above
theoretical frame based on some data taken from the World Investment Reports of the
UNCTAD and other studies on these issues. We will also try to relate this to our
discussion in the previous sections on trade between BRICS countries.
IV.A. Intra BRICS Foreign Direct Investment
Today the BRICS emerging markets are a growing and substantial source of
world demand and are now, taken together, almost equal in size to the major developed
countries. In 2010, the BRICS bloc accounted for about 16.3 percent of world exports as
compared to 27.8 percent for the OECD top five countries (ET, Oct. 3, 2011). They also
constitute the home and host region for a significant proportion of world‟s FDI flows.

36
As can be seen from Table 15, in 2010 BRICS‟s FDI was around twenty percent of
world‟s inflows and ten percent of outflows. Net FDI inflow from the BRICS bloc
increased from $ 41 billion in 1995 to $ 108 billion in 2007 and $ 75 billion in 2010. In
addition, we see in Table 15 that Brazil, China, India, and SA were net importers of FDI
throughout the period of 1995-2010, whereas Russia was a net exporter of FDI in 2010
but a net importer in 1995 and 2007. In general, we can see that the BRICS economies
are important players as the host countries.
Table 15: BRICS FDI inflows, outflows (in % to world) and net to World (Billion
US$)
1995 2000 2007 2010
Eco
nom
y
Inw
ard
Outw
ard
Net F
DI
Inw
ard
Outw
ard
Net F
DI
Inw
ard
Outw
ard
Net F
DI
Inw
ard
Outw
ard
Net F
DI
Brazil 1.3 0.3 3.3 2.3 0.2 30.5 1.8 0.3 27.5 3.9 0.9 36.9
China 11 0.6 35.5 2.9 0.1 39.8 4.2 1.0 61.1 8.5 5.1 37.7
India 0.6 0.0 2.0 0.3 0.0 3.1 1.3 0.8 8.1 2.0 1.1 10.0
Russian 0.6 0.2 1.5 0.2 0.3 -0.5 2.8 2.1 9.2 3.3 3.9 -10.5
South
Africa 0.4 0.7 -1.3 0.1 0.0 0.6 0.3 0.1 2.7 0.1 0.0 1.1
BRICS
compar
ed to
World
13.8 1.7 41.1 5.8 0.6 73.5 10.4 4.4 108.6 17.8 11.1 75.3
Source: UNCTAD, 2010.
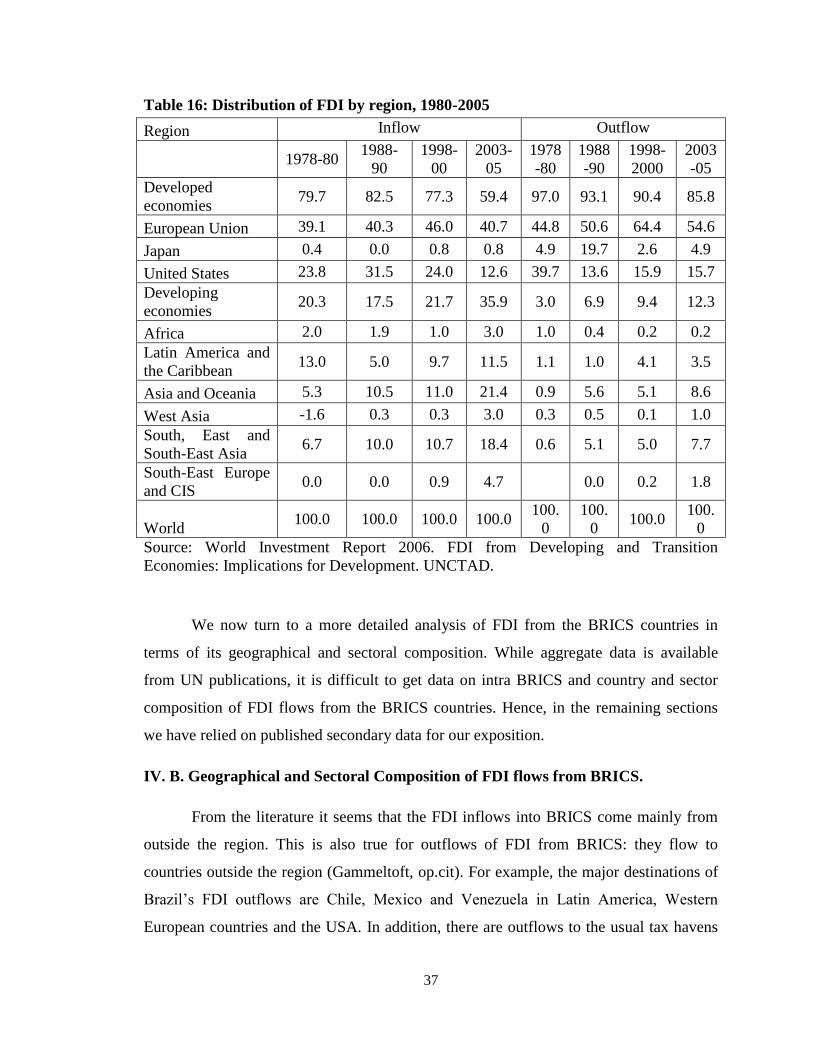
More importantly, BRICS have played a major role in FDI flows from developing
countries. From Table 16 we see that the share of developing countries in FDI outflows
has jumped dramatically between 1988-90 and 2003-05. A major part of this came from
the BRICS countries.
37
Table 16: Distribution of FDI by region, 1980-2005
Region Inflow Outflow
1978-80
1988-
90
1998-
00
2003-
05
1978
-80
1988
-90
1998-
2000
2003
-05
Developed
economies 79.7 82.5 77.3 59.4 97.0 93.1 90.4 85.8
European Union 39.1 40.3 46.0 40.7 44.8 50.6 64.4 54.6
Japan 0.4 0.0 0.8 0.8 4.9 19.7 2.6 4.9
United States 23.8 31.5 24.0 12.6 39.7 13.6 15.9 15.7
Developing
economies 20.3 17.5 21.7 35.9 3.0 6.9 9.4 12.3
Africa 2.0 1.9 1.0 3.0 1.0 0.4 0.2 0.2
Latin America and
the Caribbean 13.0 5.0 9.7 11.5 1.1 1.0 4.1 3.5
Asia and Oceania 5.3 10.5 11.0 21.4 0.9 5.6 5.1 8.6
West Asia -1.6 0.3 0.3 3.0 0.3 0.5 0.1 1.0
South, East and
South-East Asia 6.7 10.0 10.7 18.4 0.6 5.1 5.0 7.7
South-East Europe
and CIS 0.0 0.0 0.9 4.7
0.0 0.2 1.8
World 100.0 100.0 100.0 100.0
100.
0
100.
0 100.0
100.
0
Source: World Investment Report 2006. FDI from Developing and Transition
Economies: Implications for Development. UNCTAD.
We now turn to a more detailed analysis of FDI from the BRICS countries in
terms of its geographical and sectoral composition. While aggregate data is available
from UN publications, it is difficult to get data on intra BRICS and country and sector
composition of FDI flows from the BRICS countries. Hence, in the remaining sections
we have relied on published secondary data for our exposition.
IV. B. Geographical and Sectoral Composition of FDI flows from BRICS.
From the literature it seems that the FDI inflows into BRICS come mainly from
outside the region. This is also true for outflows of FDI from BRICS: they flow to
countries outside the region (Gammeltoft, op.cit). For example, the major destinations of
Brazil‟s FDI outflows are Chile, Mexico and Venezuela in Latin America, Western
European countries and the USA. In addition, there are outflows to the usual tax havens

38
of ; Bahamas, Bermuda, and British Virgin Islands. For Russia, the FDI outflows are to
the CIS countries, Western Europe and Central and Eastern Europe. The destination for
India‟s outward FDI has changed over time Thus, from 1975 to 1980s the outflow was
initially directed towards Singapore, Thailand, Sri Lanka, Malaysia etc. but in recent
years the major recipients are developed countries like the USA and UK mainly due to
outward FDI by India‟s software industry. Within BRICS, the Russian Federation was a
major recipient with 18 percent of cumulative FDI, 1996-2003 (see Gammeltoft, op.cit.).
In addition, FDI flows go to tax havens like Bermuda, British Virgin Islands and
Mauritius. In contrast, Chinese FDI has mainly flowed to developing countries of Asia,
Latin America and Africa for asset acquisition in areas like mining, oil and gas. Finally,
South-African outward FDI has concentrated in the African region. From the above it can
be seen that there is a sharp divergence in the destination of FDI from the BRICS
countries. Thus, while Brazil, SA and Russian FDI is concentrated in their traditional
regional neighbours, Indian FDI has been moving towards the developed countries while
Chinese FDI is globally diversified in the natural resource sectors in developing
countries.
In concluding, it may be noted that till 2004, the largest stock of FDI abroad was
owned by Russia and Brazil and invested largely in their neighbourhood. However, since
2003 Chinese FDI has grown nine times till 2009 and is essentially global in nature.
China now seems the dominant source of FDI with India coming a close second.
However, the destination of Chinese and Indian FDI is markedly different.
The detailed differences in the sectoral pattern of FDI from the BRICS is also
obtained by looking at the major outward investing companies in these countries. This is
shown below in Table 17. From table 17, we see different sectoral patterns of the FDI
outflow from the each of BRICS countries. Although at the aggregate levels the FDI
outflow from the developing countries is increasingly going towards the sectors like
infrastructure and resource based sectors, there exist some high tech and service sectors
which are attracting FDI flow from the developing countries in general and BRICS in
particular (Gammeltoft, 2008).
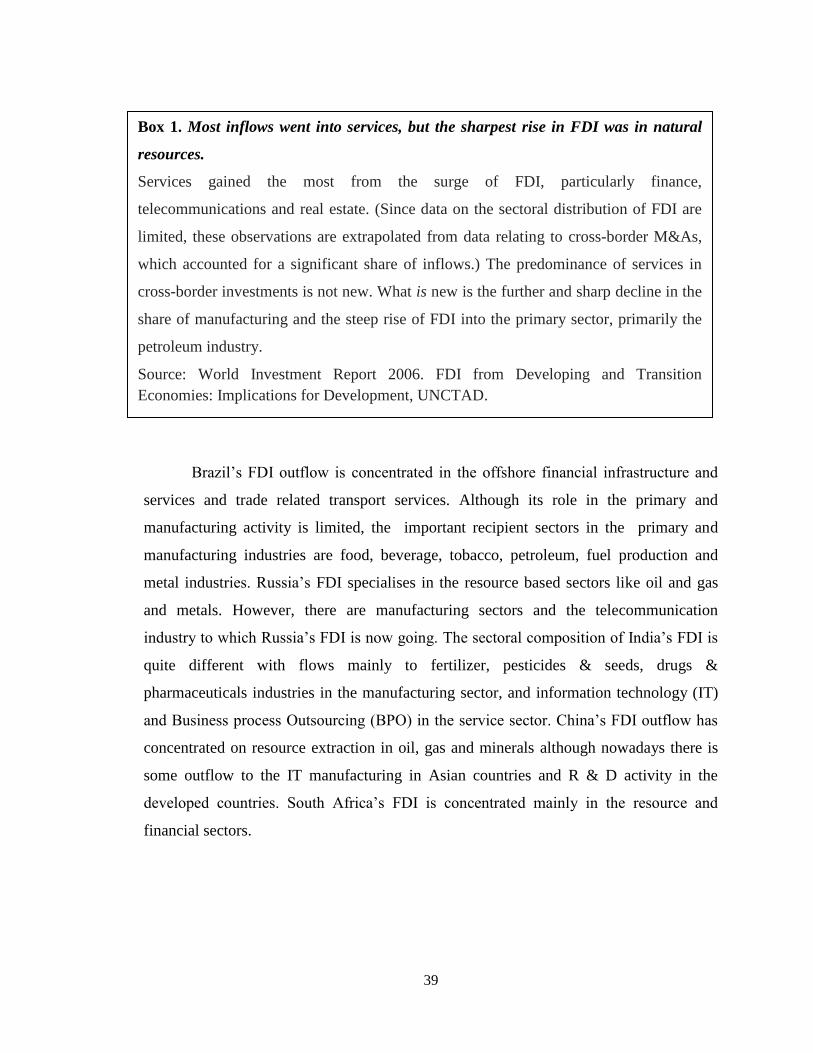
39
Brazil‟s FDI outflow is concentrated in the offshore financial infrastructure and
services and trade related transport services. Although its role in the primary and
manufacturing activity is limited, the important recipient sectors in the primary and
manufacturing industries are food, beverage, tobacco, petroleum, fuel production and
metal industries. Russia‟s FDI specialises in the resource based sectors like oil and gas
and metals. However, there are manufacturing sectors and the telecommunication
industry to which Russia‟s FDI is now going. The sectoral composition of India‟s FDI is
quite different with flows mainly to fertilizer, pesticides & seeds, drugs &
pharmaceuticals industries in the manufacturing sector, and information technology (IT)
and Business process Outsourcing (BPO) in the service sector. China‟s FDI outflow has
concentrated on resource extraction in oil, gas and minerals although nowadays there is
some outflow to the IT manufacturing in Asian countries and R & D activity in the
developed countries. South Africa‟s FDI is concentrated mainly in the resource and
financial sectors.
Box 1. Most inflows went into services, but the sharpest rise in FDI was in natural
resources.
Services gained the most from the surge of FDI, particularly finance,
telecommunications and real estate. (Since data on the sectoral distribution of FDI are
limited, these observations are extrapolated from data relating to cross-border M&As,
which accounted for a significant share of inflows.) The predominance of services in
cross-border investments is not new. What is new is the further and sharp decline in the
share of manufacturing and the steep rise of FDI into the primary sector, primarily the
petroleum industry.
Source: World Investment Report 2006. FDI from Developing and Transition
Economies: Implications for Development, UNCTAD.
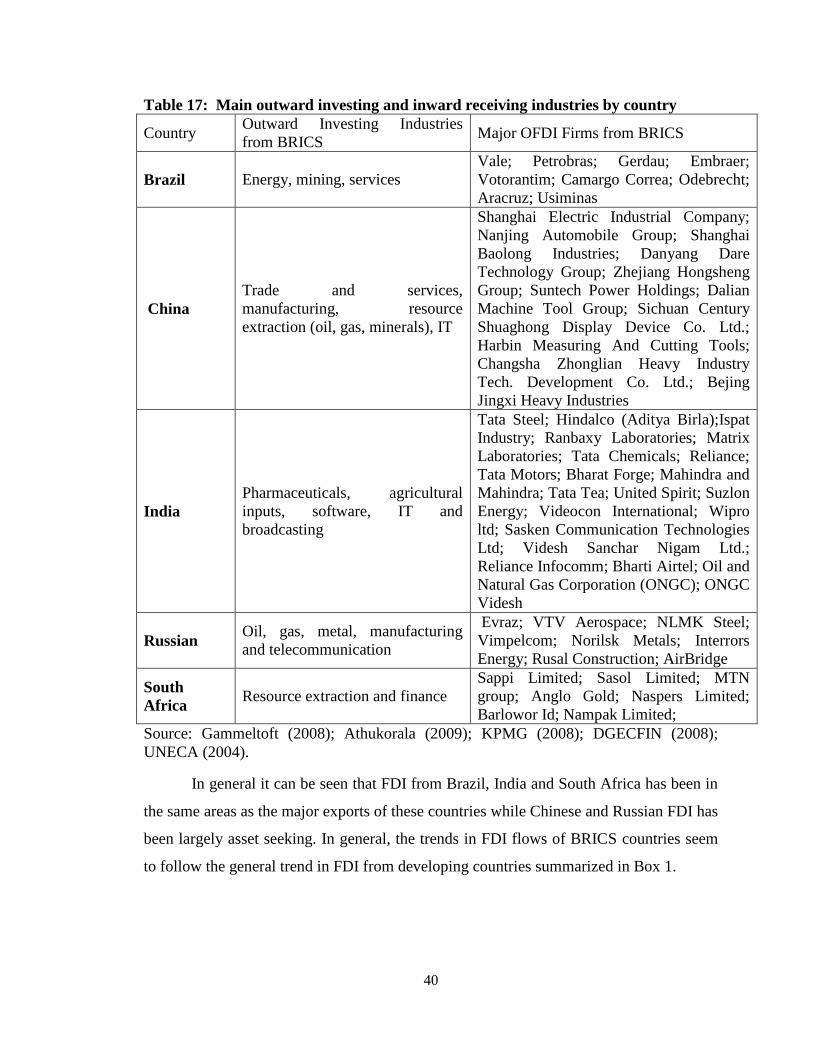
40
Table 17: Main outward investing and inward receiving industries by country
Country Outward Investing Industries
from BRICS Major OFDI Firms from BRICS
Brazil Energy, mining, services
Vale; Petrobras; Gerdau; Embraer;
Votorantim; Camargo Correa; Odebrecht;
Aracruz; Usiminas
China
Trade and services,
manufacturing, resource
extraction (oil, gas, minerals), IT
Shanghai Electric Industrial Company;
Nanjing Automobile Group; Shanghai
Baolong Industries; Danyang Dare
Technology Group; Zhejiang Hongsheng
Group; Suntech Power Holdings; Dalian
Machine Tool Group; Sichuan Century
Shuaghong Display Device Co. Ltd.;
Harbin Measuring And Cutting Tools;
Changsha Zhonglian Heavy Industry
Tech. Development Co. Ltd.; Bejing
Jingxi Heavy Industries
India
Pharmaceuticals, agricultural
inputs, software, IT and
broadcasting
Tata Steel; Hindalco (Aditya Birla);Ispat
Industry; Ranbaxy Laboratories; Matrix
Laboratories; Tata Chemicals; Reliance;
Tata Motors; Bharat Forge; Mahindra and
Mahindra; Tata Tea; United Spirit; Suzlon
Energy; Videocon International; Wipro
ltd; Sasken Communication Technologies
Ltd; Videsh Sanchar Nigam Ltd.;
Reliance Infocomm; Bharti Airtel; Oil and
Natural Gas Corporation (ONGC); ONGC
Videsh
Russian Oil, gas, metal, manufacturing
and telecommunication
Evraz; VTV Aerospace; NLMK Steel;
Vimpelcom; Norilsk Metals; Interrors
Energy; Rusal Construction; AirBridge
South
Africa Resource extraction and finance
Sappi Limited; Sasol Limited; MTN
group; Anglo Gold; Naspers Limited;
Barlowor Id; Nampak Limited;
Source: Gammeltoft (2008); Athukorala (2009); KPMG (2008); DGECFIN (2008);
UNECA (2004).
In general it can be seen that FDI from Brazil, India and South Africa has been in
the same areas as the major exports of these countries while Chinese and Russian FDI has
been largely asset seeking. In general, the trends in FDI flows of BRICS countries seem
to follow the general trend in FDI from developing countries summarized in Box 1.

41
IV.C. FDI Strategies
It is useful to see what strategies are followed by the BRICS countries in their
planning of FDI outflows. The essential issue is the role of the state in financing/aiding
outflows. There are three possible vehicles for undertaking FDI: public sector companies
(PSUs), the transnational companies (TNCs) and the small manufacturing enterprises
(SMEs). We see that for Brazil the foreign investors are the large TNCs and SMEs.
Russia‟s FDI outflow is going through PSUs and the TNCs. But the SMEs play an
important role in Russia‟s outward FDI in the CIS countries and the CEE countries.
India‟s FDI outflow is via TNCs in the information technology enabled services (ITES),
SMEs in pharmaceutical and entertainment industries and the PSUs in oil and natural gas
exploration. China‟s FDI investors comprise manly the PSUs in resource and minerals
explorations, TNCs in IT manufacturing and R& D and SMEs in the textile and small
scale IT manufacturing. In SA, the TNCs plays the dominant role in outward FDI. Here
the TNCs as well SMEs are concentrated in gold & precious metals, sugar, paper,
furniture, cellular phone services, and plastic industries (Gammeltoft, 2008).
The general picture seems to be a mix of strategies involving PSUs, TNCSs and
SMEs in outward FDI.
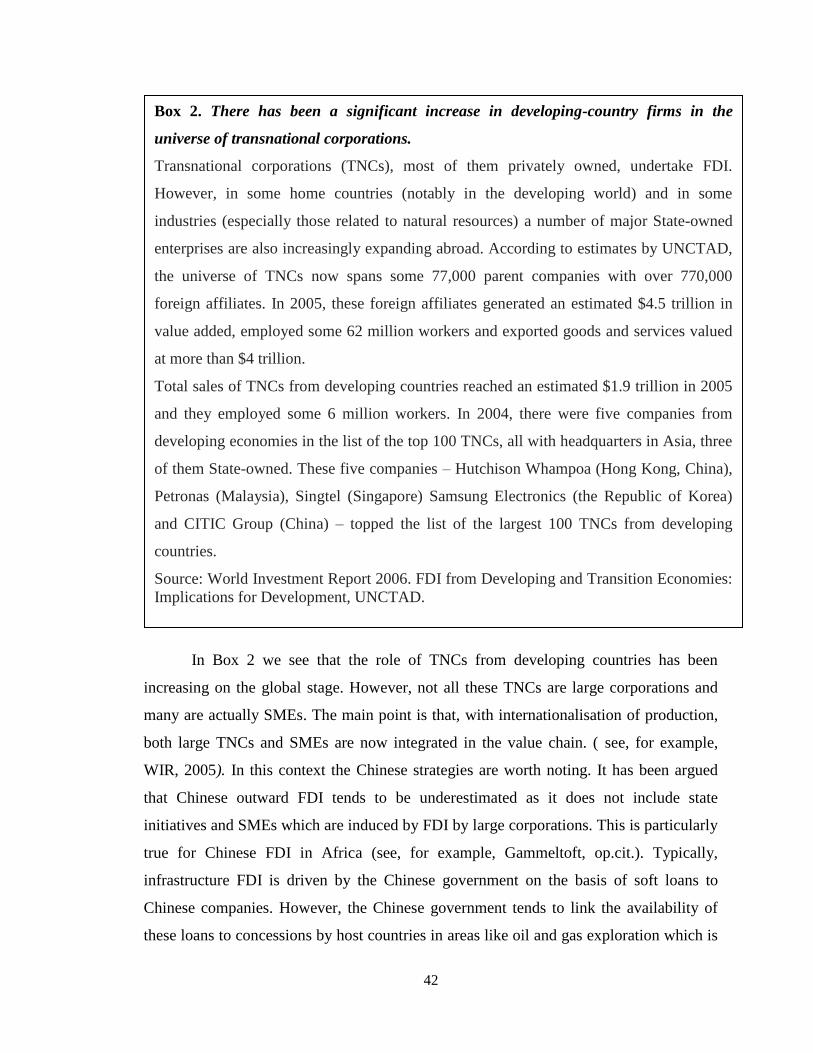
42
In Box 2 we see that the role of TNCs from developing countries has been
increasing on the global stage. However, not all these TNCs are large corporations and
many are actually SMEs. The main point is that, with internationalisation of production,
both large TNCs and SMEs are now integrated in the value chain. ( see, for example,
WIR, 2005). In this context the Chinese strategies are worth noting. It has been argued
that Chinese outward FDI tends to be underestimated as it does not include state
initiatives and SMEs which are induced by FDI by large corporations. This is particularly
true for Chinese FDI in Africa (see, for example, Gammeltoft, op.cit.). Typically,
infrastructure FDI is driven by the Chinese government on the basis of soft loans to
Chinese companies. However, the Chinese government tends to link the availability of
these loans to concessions by host countries in areas like oil and gas exploration which is
Box 2. There has been a significant increase in developing-country firms in the
universe of transnational corporations.
Transnational corporations (TNCs), most of them privately owned, undertake FDI.
However, in some home countries (notably in the developing world) and in some
industries (especially those related to natural resources) a number of major State-owned
enterprises are also increasingly expanding abroad. According to estimates by UNCTAD,
the universe of TNCs now spans some 77,000 parent companies with over 770,000
foreign affiliates. In 2005, these foreign affiliates generated an estimated $4.5 trillion in
value added, employed some 62 million workers and exported goods and services valued
at more than $4 trillion.
Total sales of TNCs from developing countries reached an estimated $1.9 trillion in 2005
and they employed some 6 million workers. In 2004, there were five companies from
developing economies in the list of the top 100 TNCs, all with headquarters in Asia, three
of them State-owned. These five companies – Hutchison Whampoa (Hong Kong, China),
Petronas (Malaysia), Singtel (Singapore) Samsung Electronics (the Republic of Korea)
and CITIC Group (China) – topped the list of the largest 100 TNCs from developing
countries.
Source: World Investment Report 2006. FDI from Developing and Transition Economies:
Implications for Development, UNCTAD.
43
done by other Chinese companies. The SMEs run by Chinese vendors tend to follow in
small manufacturing, retailing etc. The official figures on FDI do not capture the loan and
induced FDI components.
We have already noted that one of the principal methods of international
transmission of technology is FDI. From the above discussion it is clear that FDI
outflows from BRICS countries have been related more to domestic input requirements (
as in China) or export promotion ( as in all the other countries). In particular, to the extent
that trade and FDI are compliments, the broad trends in FDI outflows from the BRICS
bloc indicates that these flows have contributed little to trade within the bloc. In the
earlier section we have looked at the commodities where there exists some
complimentarity/substitutability between countries of the bloc. Very broadly, these
commodities belong to industries like vegetable oils, chemicals, metals, plastics and
pharmaceuticals. From our earlier discussion it is clear that these are not the areas where
FDI outflows from BRICS has concentrated. Yet, if technical collaboration is to promote
trade within BRICS or of the countries of the bloc with the outside world, these are the
areas where FDI should be clearly visible.
However, it may be noted that while the BRICS as a bloc is a recent phenomena,
FDI flows noted above are part of a long term pattern. Our conclusion is largely based on
observance of the historical pattern of FDI. It is possible that FDI flows may change in
response to current trade patterns. Yet, it may be noted that trade has followed FDI rather
than the other way around.
IV.D. Institutional Arrangements for Technology Collaboration
The data based analysis of FDI is largely concentrated on flows from large
state/private companies. Much of this flows naturally as a consequence of existing trade
flows. However, apart for technology arrangements that flow from intra firm transfers in
TNCs there is also the issue of the institutional mechanism which either aids FDI or is a
precondition of technology collaboration. Here, the state has an important role to play in
enabling technology collaboration particularly in the context of SMEs,. In this section we
will provide a brief overview of these arrangements within the BRICS bloc.

44
Typically, countries contract International Investment Agreements or Bilateral
Investment Treaties (BITs) and Direct Tax Treaties (DTTs) with investing partners. BITs
are largely concerned with creating the institutional arrangements governing FDI between
the contracting parties. In particular, they are concerned with creating a level playing
field for investors in partner countries, defining conditions for technology transfer and
creating a dispute settlement mechanism. On the other hand, DTTs by and large create a
preferential tax regime for FDI flows. The objective of both is to element any uncertainty
among investors. Here it may be noted that following the TRIMS agreement in the WTO,
BITS have become largely irrelevant and the treatment of foreign investment is largely
governed by the stipulations of TRIMS. By and large, TRIMS requires that foreign
investors get non-discriminatory treatment and this treatment should be no less
favourable than for domestic investors. More specifically, investment agreements cannot
be tied to trade promotion.
However, a look at the proliferation of BITs and DTTs indicates that developing
countries have been moving towards a more favourable treatment of foreign investment.
The WIR (2005) indicates that, at the end of 2004 the South-South BITs had a share of 25
percent of the total number of BITs signed in the world. It suggests that within the
developing economies and economies in transition the cooperation in the field of foreign
investment is gaining momentum. More recently many countries are building investment
agreements into their regional trading arrangements (RTAs) in what are now being called
WTO plus agreements.
In Table 18 below we list the DTT agreements in the BRICS bloc. As can be seen
from the table, most of the countries of the region have some kind of DTT with other bloc
countries but these agreements are not standardized nor are all countries included in the
set of DTT for any country. Thus, for example, China has an Income and capital
agreement with India and Brazil but only an Income agreement with Russia. Similarly,
South Africa has an agreement only with China. Thus, if there is to be no clash of
interests as between any bilateral group of countries in BRICS, it seems necessary to
develop some model DTT which could be applicable to all bloc members.
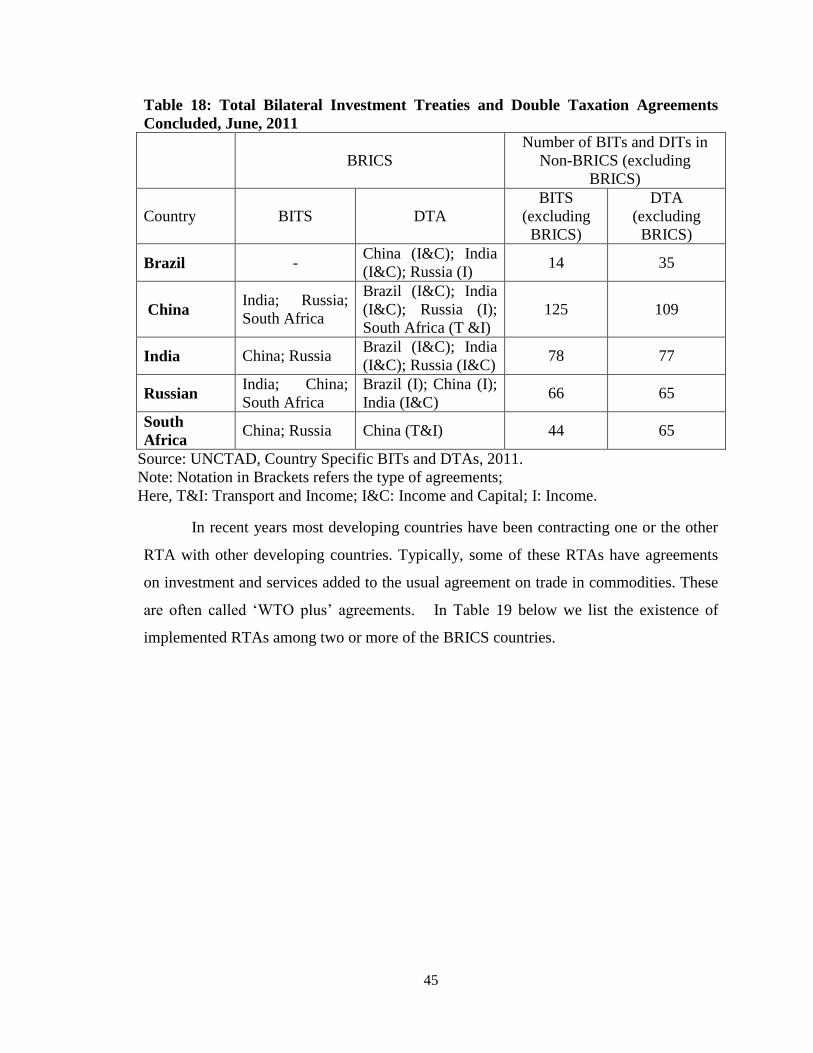
45
Table 18: Total Bilateral Investment Treaties and Double Taxation Agreements
Concluded, June, 2011
BRICS
Number of BITs and DITs in
Non-BRICS (excluding
BRICS)
Country BITS DTA
BITS
(excluding
BRICS)
DTA
(excluding
BRICS)
Brazil - China (I&C); India
(I&C); Russia (I) 14 35
China India; Russia;
South Africa
Brazil (I&C); India
(I&C); Russia (I);
South Africa (T &I)
125 109
India China; Russia Brazil (I&C); India
(I&C); Russia (I&C) 78 77
Russian India; China;
South Africa
Brazil (I); China (I);
India (I&C) 66 65
South
Africa China; Russia China (T&I) 44 65
Source: UNCTAD, Country Specific BITs and DTAs, 2011.
Note: Notation in Brackets refers the type of agreements;
Here, T&I: Transport and Income; I&C: Income and Capital; I: Income.
In recent years most developing countries have been contracting one or the other
RTA with other developing countries. Typically, some of these RTAs have agreements
on investment and services added to the usual agreement on trade in commodities. These
are often called „WTO plus‟ agreements. In Table 19 below we list the existence of
implemented RTAs among two or more of the BRICS countries.
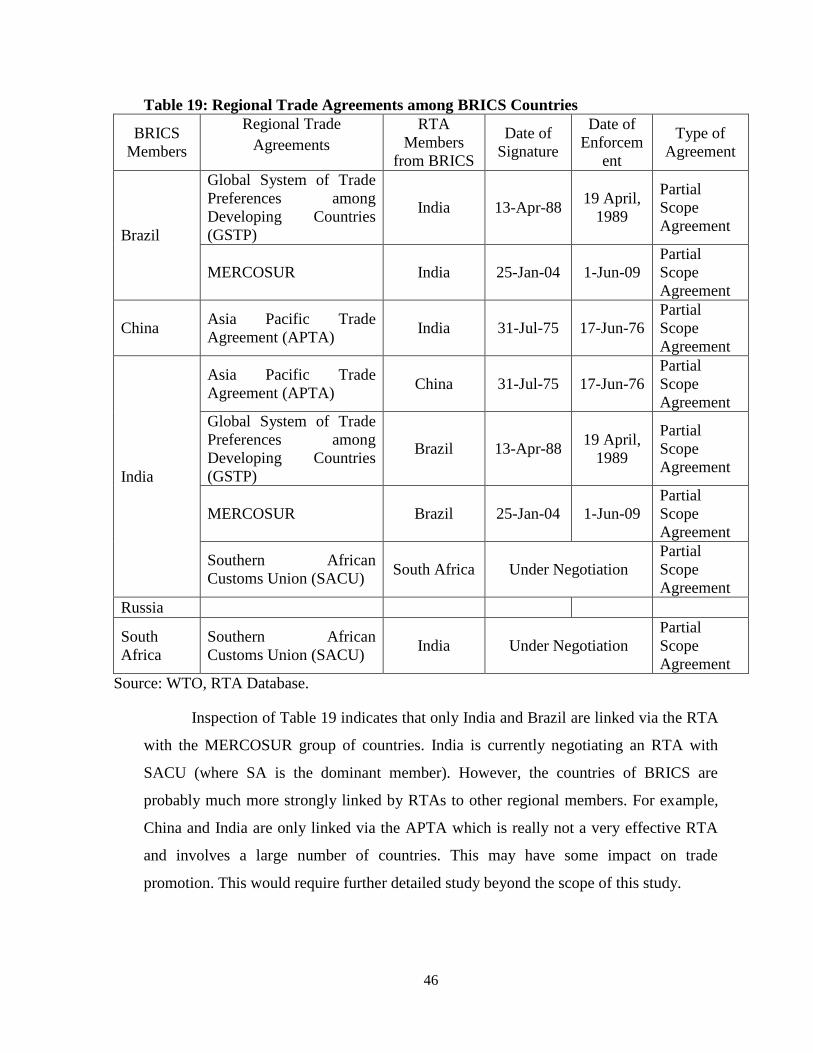
46
Table 19: Regional Trade Agreements among BRICS Countries
BRICS
Members
Regional Trade
Agreements
RTA
Members
from BRICS
Date of
Signature
Date of
Enforcem
ent
Type of
Agreement
Brazil
Global System of Trade
Preferences among
Developing Countries
(GSTP)
India 13-Apr-88 19 April,
1989
Partial
Scope
Agreement
MERCOSUR India 25-Jan-04 1-Jun-09
Partial
Scope
Agreement
China Asia Pacific Trade
Agreement (APTA) India 31-Jul-75 17-Jun-76
Partial
Scope
Agreement
India
Asia Pacific Trade
Agreement (APTA) China 31-Jul-75 17-Jun-76
Partial
Scope
Agreement
Global System of Trade
Preferences among
Developing Countries
(GSTP)
Brazil 13-Apr-88 19 April,
1989
Partial
Scope
Agreement
MERCOSUR Brazil 25-Jan-04 1-Jun-09
Partial
Scope
Agreement
Southern African
Customs Union (SACU) South Africa Under Negotiation
Partial
Scope
Agreement
Russia
South
Africa
Southern African
Customs Union (SACU) India Under Negotiation
Partial
Scope
Agreement
Source: WTO, RTA Database.
Inspection of Table 19 indicates that only India and Brazil are linked via the RTA
with the MERCOSUR group of countries. India is currently negotiating an RTA with
SACU (where SA is the dominant member). However, the countries of BRICS are
probably much more strongly linked by RTAs to other regional members. For example,
China and India are only linked via the APTA which is really not a very effective RTA
and involves a large number of countries. This may have some impact on trade
promotion. This would require further detailed study beyond the scope of this study.
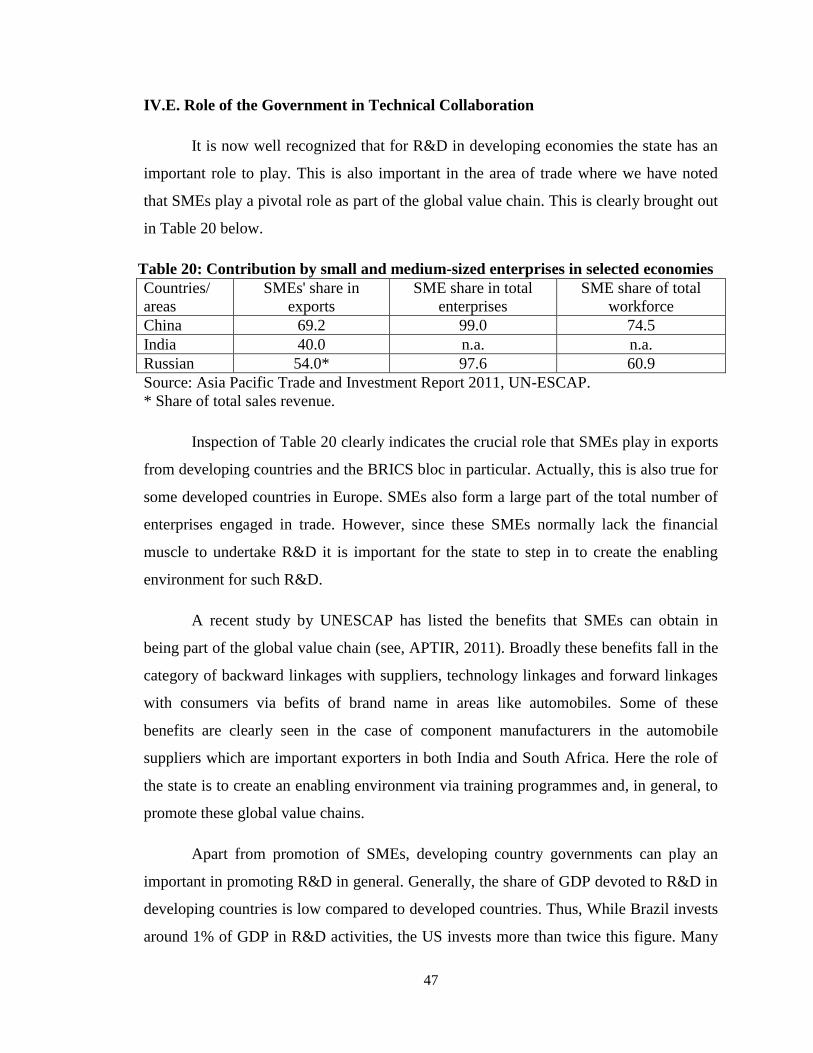
47
IV.E. Role of the Government in Technical Collaboration
It is now well recognized that for R&D in developing economies the state has an
important role to play. This is also important in the area of trade where we have noted
that SMEs play a pivotal role as part of the global value chain. This is clearly brought out
in Table 20 below.
Table 20: Contribution by small and medium-sized enterprises in selected economies
Countries/
areas
SMEs' share in
exports
SME share in total
enterprises
SME share of total
workforce
China 69.2 99.0 74.5
India 40.0 n.a. n.a.
Russian 54.0* 97.6 60.9
Source: Asia Pacific Trade and Investment Report 2011, UN-ESCAP.
* Share of total sales revenue.
Inspection of Table 20 clearly indicates the crucial role that SMEs play in exports
from developing countries and the BRICS bloc in particular. Actually, this is also true for
some developed countries in Europe. SMEs also form a large part of the total number of
enterprises engaged in trade. However, since these SMEs normally lack the financial
muscle to undertake R&D it is important for the state to step in to create the enabling
environment for such R&D.
A recent study by UNESCAP has listed the benefits that SMEs can obtain in
being part of the global value chain (see, APTIR, 2011). Broadly these benefits fall in the
category of backward linkages with suppliers, technology linkages and forward linkages
with consumers via befits of brand name in areas like automobiles. Some of these
benefits are clearly seen in the case of component manufacturers in the automobile
suppliers which are important exporters in both India and South Africa. Here the role of
the state is to create an enabling environment via training programmes and, in general, to
promote these global value chains.
Apart from promotion of SMEs, developing country governments can play an
important in promoting R&D in general. Generally, the share of GDP devoted to R&D in
developing countries is low compared to developed countries. Thus, While Brazil invests
around 1% of GDP in R&D activities, the US invests more than twice this figure. Many
48
analysts believe that this higher investment has significantly contributed to the current
position of the US as a leader in technology development. In the US, research universities
receive income from different sources, from funding and research grants to royalties and
donations. Europe on the other hand presents a greater degree of heterogeneity in R&D
expenditures. Although their average expenditure is close to 2% of the GDP, three
countries (Germany, France and UK) account for around three quarters of total R&D
investment. In India, the share of R&D in GDP is a little over one percent but almost all
this comes from R&D expenditure by the government. Barring the pharma sector, very
little R&D is currently being conducted in the private sector.
It is often not realized that 95 percent of inventions have developed out of
research in universities. It is then the private sector that converts these inventions to
innovations via market applications. In other words what is necessary is a National
Innovation System (NIS) where such partnerships can be internalized. The current
strengthening of university-industry partnerships are seen to be similar within BRIC
(Brazil, Russia, India, China) countries (Uriona-Maldonado et. al., 2010). However, as
the authors have argued, the Brazilian and Chinese governments are far ahead of the
other countries in developing this partnership. What is still missing is an intra-BRICS
institutional mechanism for promoting university-industry exchange between countries of
the bloc. Lack of this mechanism may be reason why the countries of BRICS have lagged
behind in technological innovation particularly in the context of their growing SME
sector.
V. Conclusion.
The defining feature of trade in the last two decades or so has been the growth of
south-south trade which has exceeded growth of world trade and trade between
developed and developing countries. Among other country groupings the emergence of
the BRICS bloc in recent years has certainly been a new development which merits some
study. What is clear is that in the one and half decades there has been a phenomenal
growth in intra BRICS trade. In a reflection of this growing importance of BRICS as a
trading bloc, the recent BRICS Summit in Sanya (China) on 14th April 2011 concluded
with the release of a joint document called the „Sanya Declaration‟. In one sense the
49
Sanya Declaration was an expression of intent for the formation of a new developing
country bloc. It was also a recognition of the growing trade ties between the countries of
the bloc. Second, the Declaration also notes the need for technological cooperation.
However, while BRICS may be an important political bloc in various fora of the
UN, it is not clear that it is a sustainable economic bloc. Similarly, it is not clear what
form technological cooperation must take. In this study we have looked at economic
aspects of the BRICS group on three issues. One, to what extent is growth of intra BRICS
trade sustainable? Second, what is the substitutability and complimentarity in product
trade and, third, what are the main issues in technological collaboration between BRICS
countries.
On the issue of sustainability we have looked at the growth of intra BRICS trade
in the period 1995-2007. The choice of this period was dictated by the fact that it was
also the decade or so after the formation of the WTO and there were no major exogenous
factors in world trade that could have biased our results in favour of intra BRICS trade.
Our study shows that the expanded intra BRICS trade took place even while demand
growth was still quite high in the developed world indicating that the trade was not driven
by adverse demand contraction in the developed world as in the 1970s. However, our
study also shows that this growing intra BRICS trade was accompanied by increasing
asymmetry of intra bloc trade due to the over powering presence of China. This is not
sustainable in the long run.
Another test of sustainability is done at the micro level. Here, at the 4-digit level
of disaggregation we calculated the ratio of net intra BRICS trade to net BRICS trade
with the rest of the world for each country of the bloc in those commodities which
accounted for at least one percent of a county‟s intra BRICS exports in 2007. We looked
at the changes over the period 2000-2007.We see that in almost all cases, the ratios have
increased substantially indicating that members of the BRICS bloc are redirecting more
and more of their reasonably competitive exports towards the bloc. For India some ratios
are over 100 per cent indicating the increasing importance of BRICS trade relative to
trade with the rest of the world. This is seen in commodities like cotton, Ores of Iron,
pellets of iron, alumina, zinc ores and other ores.
50
However, one question is whether the trade in these commodities has been
increasing over our reference period 2000-2007. We looked at those commodities where
the share of the 4-digit commodity in the 2-digit commodity group has increased between
2000 and 2007 (increasingly important commodities) and those where this share has
fallen over this period but where the commodity accounted for at least 10 percent of 2-
digit intra BRICS trade (for each country) in 2007(important commodities). We define
these as quantitatively important commodities. Here we see that there are very few
quantitatively important commodities in intra BRICS exports. Much of intra BRICS trade
seems to be in resource based commodities. However, as noted in the previous paragraph,
it is in non-resource based commodities that future growth is most promising. It thus
seems that the current structure of intra BRICS is likely to alter radically from the pattern
of resource based commodity exports which drove intra BRICS trade in the period 1995-
2007. In other words, it seems that intra BRICS trade is sustainable but not on the basis
of trade in only resource based commodities.
This issue of sustainability involves some further consideration of the nature of
intra BRICS trade particularly in terms of the technology content of the trade. To see this
we classified intra BRICS trade by its technology content using the UNIDO definition.
This gives further clarity to our previous conclusion. We see that in medium technology
exports, the only quantitatively important products are propylene polymers (India) and
nitrogenous fertilizers Quantitatively the importance of growing intra BRICS trade in
LT, MT or HT products is insignificant,
The second issue analysed is the degree of complimentarity and substitutability in
trade of the BRICS countries in third countries. This also allows us to comment on areas
where technological cooperation is feasible. The general argument is that where countries
compete is similar products in the same third country market technological cooperation
may be difficult. Here we have used revealed comparative advantage (RCA) as a measure
of complimentarity/substitutability. It turns out that there is little substitutability and
hence competition between these countries as they are by and large exporting to different
markets. The only competition seems to be for Butanols (Chinese market) where India
and Brazil are competing, Ammonia products ( in Brazil) where China and Russia

51
compete, Ferrochromium (in China, Japan) where India and SA compete and Refined
Copper (in China) where India and Brazil compete and other antibiotics (in Germany)
where India and China compete. Most of the above products fall in the MT or HT areas
where technological cooperation is usually useful and desirable but which may not
happen due to an element of competition in the same market. But apart from these, there
are a large number of products belonging to various industries where there exists product
complimentarity between countries. These are Vegetable Oils (for Brazil, China Russia),
Chemical Products (for Brazil, India, Russia and SA), Plastics ( for Brazil, China) and
Iron and Steel (for all BRICS countries). Our notion of complimentarity is of each
country possibly specializing in some stage of production in any given industry. There is
also very little conflict here in technological collaboration with each country having a
distinct market segment.
The third issue we have looked at relates to technological cooperation between the
BRICS countries. We have looked at this from two points of view. One, the major source
of technological transfer is foreign direct investment (FDI). In general, FDI by its very
presence tends to lead to technology transfer and collaboration between countries. In
addition, FDI is seen to promote trade given that much of trade today is in intermediate
goods. Second, particularly important for developing countries is the role of institutions,
particularly the government, in promoting FDI and technological transfer via the creation
of enabling institutions.
Our analysis indicates that, with the exception of China and Brazil, the pattern
of FDI from BRICS countries has not been conducive to promoting intra bloc trade.
Barring China and Brazil, FDI outflows have largely been promoting regional trade. For
India, in fact, FDI is still oriented towards the developed countries. Here the Chinese
strategy is worth noting. China tends to push infrastructure development in far off
countries via loans which are then linked to preferential treatment to Chinese companies
in specific sectors. Subsequently, small scale Chinese traders are encouraged to step in to
perform services like retail, small trade etc.
On the issue of institutional factors promoting FDI and trade we see that there has
been little progress in intra bloc level coordination in areas like double taxation
52
agreements. However, the issue of bilateral investment agreements is probably not so
relevant given the operation of the TRIMS agreement under the WTO. It is also seen that
there is very little cooperation among the BRICS countries via RTAs where „WTO
plus‟ agreements are increasingly used to establish investment agreements.
One of the factors often ignored in looking at BRICS trade is the dominance of
small scale establishments (SSIs) in exports of the bloc countries. Here, the role of the
government in promoting global value chains is crucial given the low resource base of
these firms. Finally, the role of the government in promoting technological development
via university-industry partnership is crucial particularly in making new technologies
available to the SSIs. Here, only Brazil and China have any developed systems. The
other countries need to develop such kind of interaction among different actors to
strengthen the National Innovation Systems. There is also no institutional
mechanism for intra BRCS coordination in technological partnerships. Some such
mechanism must be developed.
To conclude, the observed growth in intra BRICS trade seems to be largely
due to resource based trade which is not sustainable for all the countries. It is not
surprising that FDI flows from these countries have done little to promote intra bloc
trade. However, there seems to be growing trade in other areas where technological
cooperation is feasible. Here, the need is to establish institutional mechanisms like
National Innovation Systems to promote intra BRICS FDI in these areas.

53
References:
Asia Pacific Trade and Investment Report (2011). “Post-Crisis Trade and Investment
Opportunities”, New York: UN-ESCAP.
Athukirala, Prema-Chandra (2009). “Outward Foreign Direct Investment from India”,
Asian Development Review, 26(2): 125-153.
Balassa, B. (1965). “Trade Liberalization and „Revealed‟ Comparative Advantage”, The
Manchester School, 33: 99-123.
DGECFIN (Directorate General for Economic and Financial Affairs (2008). “Foreign
Direct Investment: Russia and the EU”, OECD-Russia Expert Meeting on Russ‟s
Investment Policy, 9th
April.
Economic Times (2011), “Emerging is on the verge of Converging”, 3rd
October.
Findlay, R. (1978). “Relative Backwardness, Direct Foreign Investment, and the Transfer
of Technology: A Simple Dynamic Model”, Quarterly Journal of Economics,
92(1): 1–16.
Gammeltoft, P. (2008). “Emerging Multinationals: Outward FDI from the BRICS
Countries”, Int. J. Technology and Globalisation, 4(1): 6-22.
Girma, S., David, Greenaway, and Katharine, Wakelin. (2001). “Who Benefits from
Foreign Direct Investment in the UK?‟, Scottish Journal of Political Economy,
48(2): 119–133.
Hausmann, R., J. Hwang and D. Rodrik (2007). “What you export matters”, Journal of
Economic Growth, 12(1):1-25.
Kathuria, Vinish (2000). “Productivity Spillover from Technology Transfer to Indian
Manufacturing Firms”, Journal of International Development, 12 (3): 343-369.
Krugman, Paul (1979). “Increasing Returns, Monopolistic Competition, and International
Trade”, Journal of International Economics, 9(4): 469-479.
Krugman, Paul (1980). “Scale Economies, Product Differentiation, and the Pattern of
Trade", American Economic Review, 70(5): 950-59.
Krugman, Paul (1983). “The New Theories of International Trade and the Multinational
Enterprise”, in C. P. Kindleberger and D. B. Audretsch (eds.) The Multinational
Corporation in the 1980s, London: The MIT Press Cambridge.
Krugman, Paul (1991). “Increasing Returns and Economic Geography”, Journal of
54
Political Economy, 99(3):483-99.
Krugman, Paul (2008). “Trade and Wages, Reconsidered” Brookings Papers on
Economic Activity, Spring: 103-137.
Linder, S. B. (1961). An Essay on Trade and transformation, New York: Wiley and Sons.
Lipsey, R. G. (1957). “The Theory of Customs Union: Trade Diversion and Welfare”,
Economica, 24(93): 40-46.
Meade, J.E. (1955). The Theory of Customs Unions, Amsterdam: North-Holland.
OECD Directorate for Science, Technology and Industry Economic Analysis and
Statistics Division (2011). “ISIC REV. 3 Technology Intensity Definition
Classification of manufacturing industries into categories based on R&D
intensities.”
Pant, Manoj and Sangeeta, Mondal (2010). “FDI, Technology Transfer and Spillover: A
Case Study of India”, Discussion Paper-10/04, Centre for International Trade and
Development, Jawaharlal Nehru University.
Taki, S. (2005). “Productivity Spillovers and Characteristics of Foreign Multinational
Plants in Indonesian Manufacturing 1990–1995”, Journal of Development
Economics, 76 (2): 521–542.
Theil, H. (1979). “How Symmetric Is International Trade?”, Empirical Economics, 4(1):
53-62.
Trefler, D. (1995). “The case of the missing and other HOV mysteries”, American
Economic Review, 85(5):1029-46.
UNECA (United Nations Economic Commission for Africa) (2004). “Foreign Direct
Investment by African Countries”, Papers prepared for UNCTAD meeting on FDI
in Africa, 22-24 November.
United Nations Conference on Trade and Development (2006): “FDI from
Developing and Transition Economies: Implications for Development”, World
Investment Report ,New York and Geneva: United Nations Publication.
United Nations Conference on Trade and Development (UNCTAD) (2005a).
“Transnational Corporations and the Internationalization of R & D”, World
Investment Report , New York and Geneva: United Nations Publication .
United Nations Conference on Trade and Development (UNCTAD) (2005b). “Improving

55
the Competitiveness of SMEs through Enhancing Productive Capacity”,
Proceeding of four Expert Meeting, New York and Geneva: United Nations
Publication .
United Nations Conference on Trade and Development (UNCTAD) (2010). “Revealed
Factor Intensity Indices at the Product Level”, Policy Issues in International Trade
and Commodities Study Series No. 44. .
United Nations Industrial Development Organization (UNIDO) (2009). “Breaking In and
Moving Up: New Industrial Challenges for the Bottom Billion and the Middle-
Income Countries”, Industrial Development Report, United Nations Publication.
Uriona Maldonado, Mauricio, Mauro Maldonato, Ricardo Chaim, Ricardo Pietrobon, and
Gregorio Varvakis. (2010). “University-Industry Partnerships with a focus on
BRIC Countries: A Systems Perspective on the Good, the Bad and the Ugly”, In
Proceedings of the 28th International Conference of the System Dynamics
Society. Seoul, Korea: System Dynamics Society. Available at:
http://www.systemdynamics.org/conferences/2010/proceed/papers/P1176.pdf
Vernon, Raymond (1979). “The Product Cycle Hypothesis in a New International
Environment”, Oxford Bulletin of Economics and Statistics, 41(4): 255-267.

56
Appendix 1
a) Entropy of Bilateral Trade Symmetry
The following entropy is a simple way of measuring trade symmetry of bilateral trade
flows between two countries:
Let the amount of exports from country i to country j, measured as fraction of the
total trade between the two countries, so that
takes a maximum of 1 when and a minimum of zero when
and or and
Bilateral entropies can be computed for each =10 pairs of countries in our study.
b) The Criterion of Symmetry in Intra-BRICS Trade
Let be the exports from country i to country j in 1995, measured as a fraction of intra-
BRICS trade in 1995; is the exports from country i to country j in 2007, measured as a
fraction of intra-BRICS trade in 2007.
We have measured four types of criterion functions in our study:
1)
Intra-BRICS trade becomes symmetry when takes value 0, i.e. for all i and j
and i not equal to j. As the value of increases then the intra-BRICS trade asymmetry
increases.
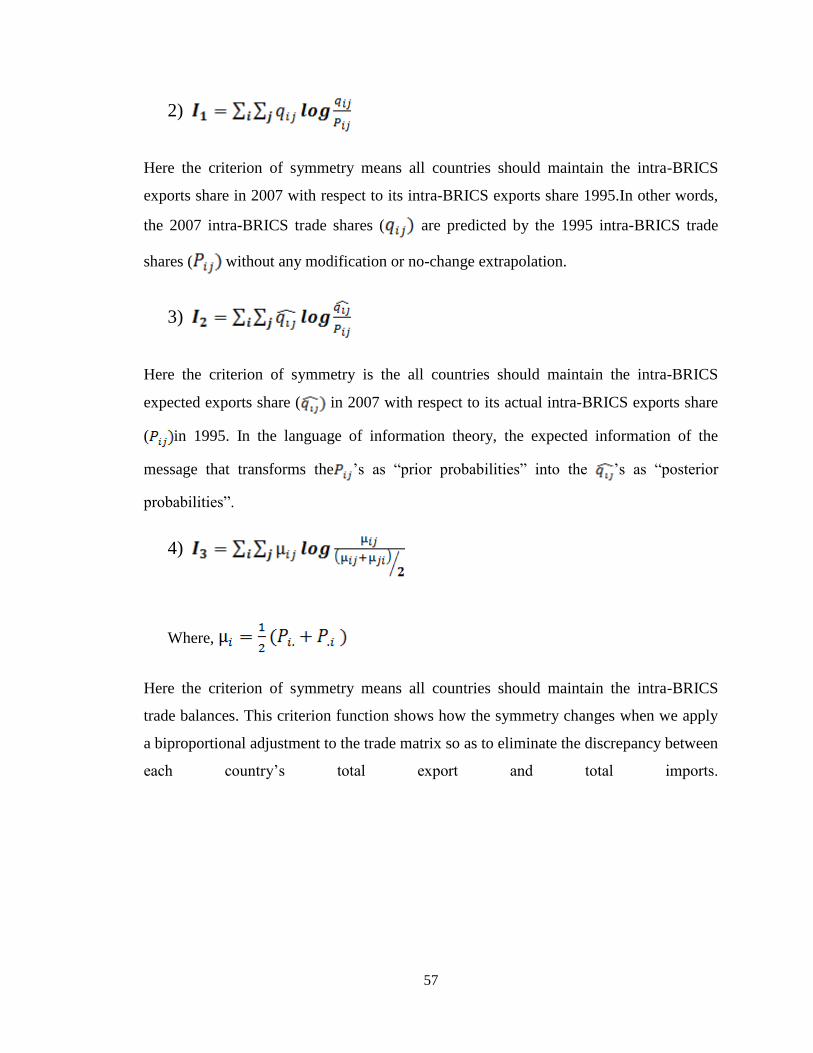
57
2)
Here the criterion of symmetry means all countries should maintain the intra-BRICS
exports share in 2007 with respect to its intra-BRICS exports share 1995.In other words,
the 2007 intra-BRICS trade shares ( are predicted by the 1995 intra-BRICS trade
shares ( without any modification or no-change extrapolation.
3)
Here the criterion of symmetry is the all countries should maintain the intra-BRICS
expected exports share ( in 2007 with respect to its actual intra-BRICS exports share
( in 1995. In the language of information theory, the expected information of the
message that transforms the ‟s as “prior probabilities” into the ‟s as “posterior
probabilities”.
4)
Where,
Here the criterion of symmetry means all countries should maintain the intra-BRICS
trade balances. This criterion function shows how the symmetry changes when we apply
a biproportional adjustment to the trade matrix so as to eliminate the discrepancy between
each country‟s total export and total imports.

58
Appendix 2
Trends in Intra BRICS and World Net Export between 2000 and 2007
2000 2007
Economy
Product
Code(1%
or
greater)
Net
Intra
BRICS
Export
(X-M)
Net
World
Export
(X-M)
Percentage
of Intra to
World Net
Export
Net
Intra
BRICS
Export
(X-M)
Net
World
Export
(X-M)
Percentage
of Intra to
World Net
Export
Net intra
BRICS
and
World
from
Brazil
1212 65.3 716.7 9.1 403.6 2047.5 19.7
2222 337.4 2055.2 16.4 2867.8 6679.8 42.9
2515 55.7 1334.9 4.2 386.9 2746.2 14.1
2815 176.0 1852.2 9.5 3124.1 7114.1 43.9
2816 121.7 1194.6 10.2 641.1 3443.8 18.6
2831 0.0 -257.7 0.0 311.4 -45.4 -685.9
3330 36.1 -3031.3 -1.2 839.9 -3070.7 -27.4
4211 87.3 324.3 26.9 585.6 1676.6 34.9
6114 35.8 588.5 6.1 530.3 2052.4 25.8
6715 -4.4 404.1 -1.1 161.3 1200.3 13.4
6821 -0.1 -287.8 0.0 199.4 -957.7 -20.8
7832 0.9 67.4 1.3 241.2 944.8 25.5
7843 30.3 -369.7 -8.2 133.7 -509.8 -26.2
Net intra
BRICS
and
World
from
China
3250 224.0 916.5 24.4 742.4 3057.4 24.3
5413 74.2 380.6 19.5 722.9 1780.5 40.6
6732 0.0 0.0 0.0 797.8 6436.9 12.4
7522 1.0 257.1 0.4 962.9 65915.6 1.5
7611 37.3 1059.1 3.5 866.3 17664.5 4.9
7638 24.6 2775.5 0.9 780.0 18325.4 4.3
7641 30.7 461.6 6.7 820.6 5808.2 14.1
7643 6.7 1137.7 0.6 3110.7 34349.2 9.1
7649 86.8 -1496.2 -5.8 1815.0 21879.1 8.3
7758 42.5 2283.6 1.9 726.4 9914.6 7.3
7821 0.2 -44.0 -0.5 856.1 1920.1 44.6
8432 43.7 1161.8 3.8 1379.5 7612.8 18.1
8442 58.0 1681.9 3.4 1906.2 11102.9 17.2
8453 74.5 4359.5 1.7 1912.4 15706.7 12.2
8454 38.5 2244.5 1.7 857.9 8389.6 10.2
8514 188.2 3065.1 6.1 1253.1 6944.7 18.0

59
Net intra
BRICS
and
World
from
India
2631 -50.0 -318.7 15.7 856.6 784.0 109.3
2731 46.8 216.5 21.6 235.3 481.7 48.8
2815 94.1 327.8 28.7 3912.1 488.0 801.7
2816 15.2 12.2 124.6 203.1 3.9 5207.7
2852 20.0 41.2 48.5 165.6 93.7 176.7
2875 0.0 -11.5 0.0 279.5 180.8 154.6
2879 22.7 35.6 63.8 240.3 43.8 548.6
5112 -5.2 -217.4 2.4 166.5 1132.9 14.7
5429 90.6 522.3 17.3 311.5 2062.1 15.1
5751 16.1 63.7 25.3 168.4 366.6 45.9
6715 -24.9 50.8 -49.0 16.6 554.8 3.0
6821 11.1 31.5 35.2 386.6 1253.9 30.8
Net intra
BRICS
and
World
from
Russia
2321 62.0 268.0 23.1 236.9 1215.1 19.5
2474 287.4 1082.2 26.6 1978.8 3144.5 62.9
2475 40.7 248.9 16.4 466.8 987.9 47.3
2482 11.0 704.6 1.6 210.1 3163.0 6.6
2515 160.6 363.9 44.1 362.7 599.2 60.5
3330 262.9 23031.0 1.1 5649.3 113614.0 5.0
5121 40.9 167.2 24.5 210.3 721.2 29.2
5156 117.6 187.8 62.6 215.7 432.2 49.9
5621 114.6 531.5 21.6 494.6 1965.8 25.2
5623 288.4 405.9 71.1 1168.7 1679.7 69.6
5629 137.0 639.0 21.4 544.1 2030.7 26.8
6726 255.0 1472.3 17.3 300.6 5011.3 6.0
6751 60.9 169.4 36.0 459.6 1237.8 37.1
7144 59.3 151.0 39.3 599.4 858.0 69.9
7648 20.9 31.1 67.2 199.4 181.3 110.0
Net intra
BRICS
and
World
from
South
Africa
2513 45.9 360.8 12.7 83.4 402.3 20.7
2681 4.4 32.3 13.6 69.2 145.6 47.5
2816 105.3 324.6 32.4 518.8 1515.6 34.2
2831 0.0 0.7 0.0 121.1 170.4 71.1
2877 1.7 144.4 1.2 215.8 409.5 52.7
2879 2.2 98.8 2.2 444.3 656.6 67.7
2882 10.5 69.3 15.2 120.7 504.9 23.9
3212 103.2 1247.2 8.3 452.4 3125.6 14.5
3330 0.0 -3453.7 0.0 786.1 -9077.8 -8.7
5223 106.5 118.4 89.9 192.2 226.9 84.7

60
6715 40.4 986.7 4.1 554.4 2684.4 20.7
6753 10.6 390.6 2.7 188.1 898.8 20.9
6755 2.3 21.8 10.6 124.2 592.3 21.0
6841 0.7 709.7 0.1 148.4 1588.9 9.3
6842 11.6 76.7 15.1 26.7 451.2 5.9
Source: WITS.

61
Appendix 3
Measuring product sophistication in industry
In the past, the OECD used to use technology classification based on ISIC Rev. 2
industry classifications. The methodology uses three indicators of technology intensity
reflecting, to different degrees, “technology-producer” and “technology-user” aspects: i)
R&D expenditures divided by value added; ii) R&D expenditures divided by production;
and iii) R&D expenditures plus technology embodied in intermediate and investment
goods divided by production. From 2003 onwards the OECD made the new technological
classification of manufacturing industries based on ISIC Rev. 3 into high-technology,
medium-high-technology, medium-low-technology and low-technology groups was made
after ranking the industries according to their average over 1991-99 against aggregate
OECD R&D intensities. Industries classified to higher categories have a higher average
intensity for both indicators than industries in lower categories.
As our analysis in this report is based on the industry classification based on the
SITC Rev 3 we have used the UNIDO definition of industries which is classified on the
basis of SITC Rev.3.
UNIDO (2009) introduced a new measure of the degree of sophistication of a
manufacturing activity or product, P-soph is as follows:
If a product‟s P-soph index is high, it indicates that it is produced primarily by
high-income countries. A lower value indicates that low-income countries are more
intensively engaged in production in the sector. More precisely, P-soph is the weighted
average of GDP per capita of all countries producing the good, where the weights are the
“production intensities” of the sector in each country (normalized to 1). Production
intensity is measured by the ratio of the value-added share of the sector in a country‟s
total manufacturing relative to the sector‟s value-added share in world manufacturing.
This approach is analogous to the use of revealed comparative advantage by Hausmann,
Hwang and Rodrik (2007).
Correspondingly, the final technological categorisation of industries on the basis
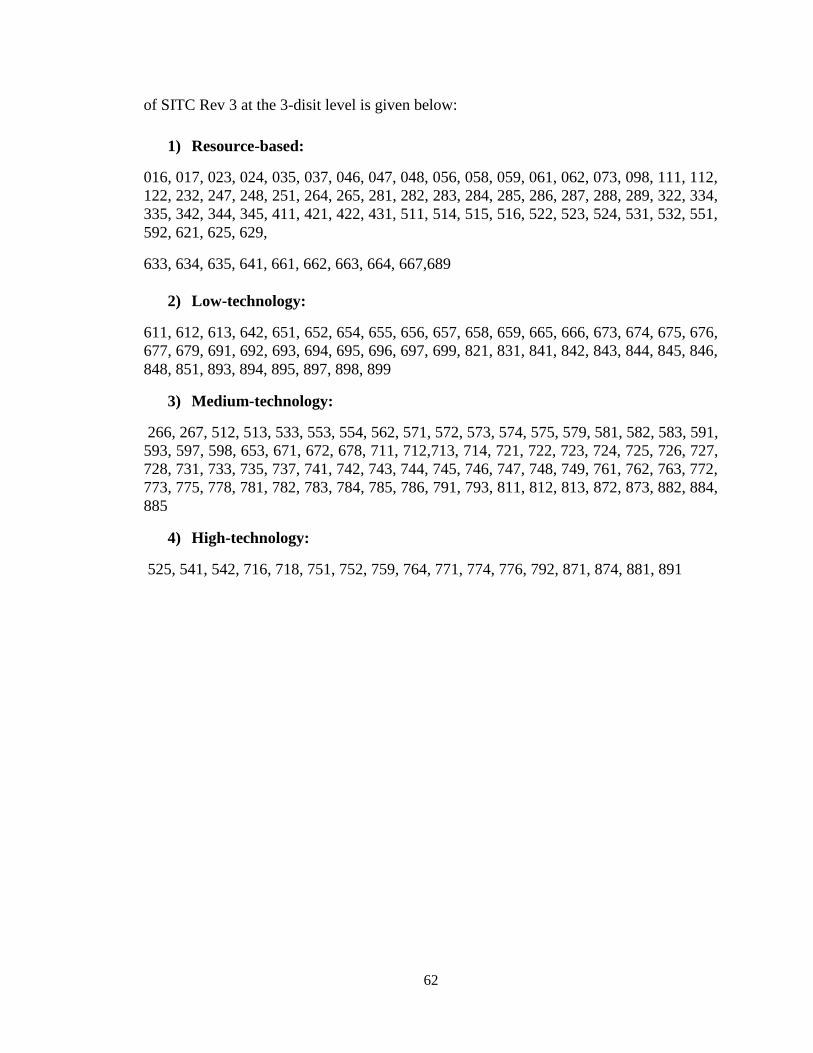
62
of SITC Rev 3 at the 3-disit level is given below:
1) Resource-based:
016, 017, 023, 024, 035, 037, 046, 047, 048, 056, 058, 059, 061, 062, 073, 098, 111, 112,
122, 232, 247, 248, 251, 264, 265, 281, 282, 283, 284, 285, 286, 287, 288, 289, 322, 334,
335, 342, 344, 345, 411, 421, 422, 431, 511, 514, 515, 516, 522, 523, 524, 531, 532, 551,
592, 621, 625, 629,
633, 634, 635, 641, 661, 662, 663, 664, 667,689
2) Low-technology:
611, 612, 613, 642, 651, 652, 654, 655, 656, 657, 658, 659, 665, 666, 673, 674, 675, 676,
677, 679, 691, 692, 693, 694, 695, 696, 697, 699, 821, 831, 841, 842, 843, 844, 845, 846,
848, 851, 893, 894, 895, 897, 898, 899
3) Medium-technology:
266, 267, 512, 513, 533, 553, 554, 562, 571, 572, 573, 574, 575, 579, 581, 582, 583, 591,
593, 597, 598, 653, 671, 672, 678, 711, 712,713, 714, 721, 722, 723, 724, 725, 726, 727,
728, 731, 733, 735, 737, 741, 742, 743, 744, 745, 746, 747, 748, 749, 761, 762, 763, 772,
773, 775, 778, 781, 782, 783, 784, 785, 786, 791, 793, 811, 812, 813, 872, 873, 882, 884,
885
4) High-technology:
525, 541, 542, 716, 718, 751, 752, 759, 764, 771, 774, 776, 792, 871, 874, 881, 891

63
Appendix 4
Exports Based on UNIDO Technology Definition of Commodities for 2000
Brazil 2000
Product Code % Share in Brazil's Total
Intra-BRICS Exports
Resource
Based Exports
0122 1.5
0123 1.6
0611 14.3
0612 1.2
0713 1.7
1212 3.2
2222 16.6
2484 1.2
2515 2.7
2815 8.7
2816 6
3330 1.8
4211 4.3
Share of Resource Based Exports 64.8
Low Tech
Exports 6114 1.9
Share of LT exports 1.9
Medium Tech
Exports
5711 1
7812 2.8
7843 1.6
Share of MT 5.4
High Tech
Exports 7923 1.8
Share of HT exports 1.8
China 2000
Product Code
% Share in China's Total
Intra-BRICS Exports
Resource
Based Exports
423 1.0
2613 2.0
5157 1.0
Share of Resource Based Exports 4.0
Low Tech
Exports
8411 1.3
8414 1.0

64
8415 1.0
8442 1.0
8453 1.3
8458 1.0
8481 7.2
8512 1.6
8513 2.0
8514 3.1
8942 1.0
Share of LT exports 21.4
Medium Tech
Exports
3250 3.7
7782 1.3
Share of MT 5.0
High Tech
Exports
5413 1.4
7526 2.5
7649 1.5
Share of HT exports 5.4
India 2000
Product Codes % Share in India's Total
Intra-BRICS Exports
Resource
Based Exports
0342 3.6
0361 1.4
0423 1.2
0713 2.6
0741 5.4
0813 1.1
1211 1.3
2731 2.3
2815 4.5
2852 1.1
2879 1.2
4225 1.6
5169 2.3
Share of Resource Based Exports 29.5
Low Tech
Exports
6513 5.6
6522 1.1
8415 1.8
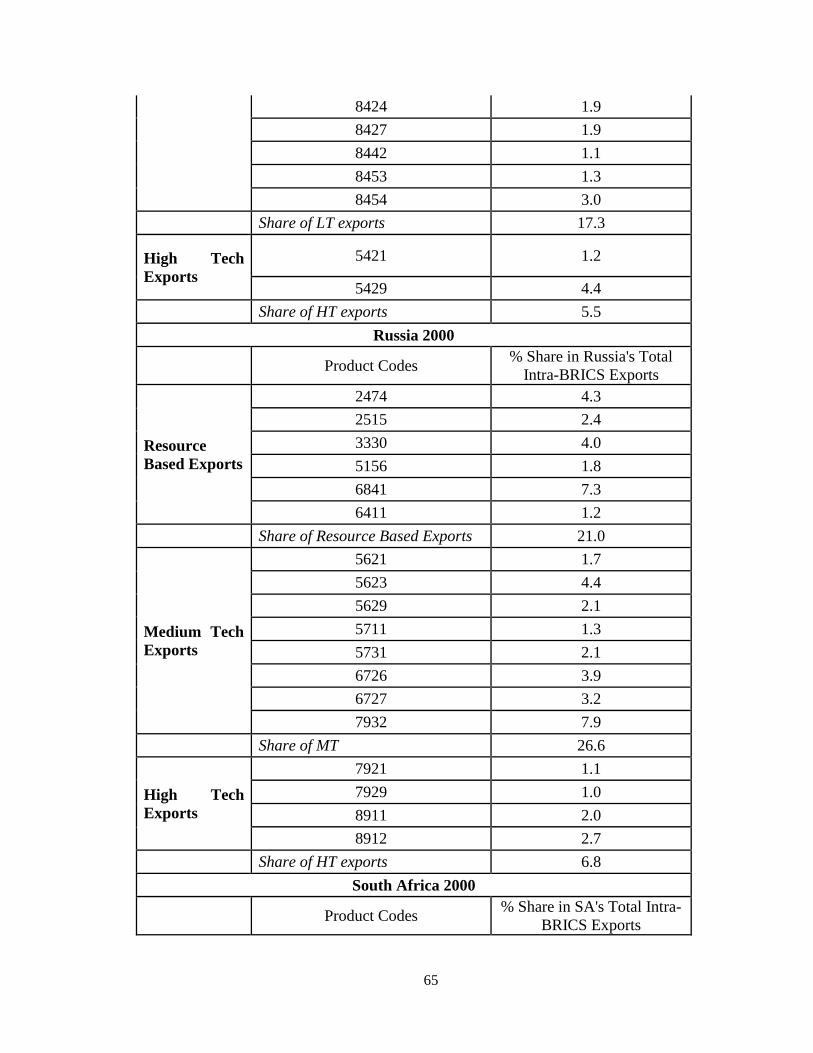
65
8424 1.9
8427 1.9
8442 1.1
8453 1.3
8454 3.0
Share of LT exports 17.3
High Tech
Exports
5421 1.2
5429 4.4
Share of HT exports 5.5
Russia 2000
Product Codes % Share in Russia's Total
Intra-BRICS Exports
Resource
Based Exports
2474 4.3
2515 2.4
3330 4.0
5156 1.8
6841 7.3
6411 1.2
Share of Resource Based Exports 21.0
Medium Tech
Exports
5621 1.7
5623 4.4
5629 2.1
5711 1.3
5731 2.1
6726 3.9
6727 3.2
7932 7.9
Share of MT 26.6
High Tech
Exports
7921 1.1
7929 1.0
8911 2.0
8912 2.7
Share of HT exports 6.8
South Africa 2000
Product Codes % Share in SA's Total Intra-
BRICS Exports
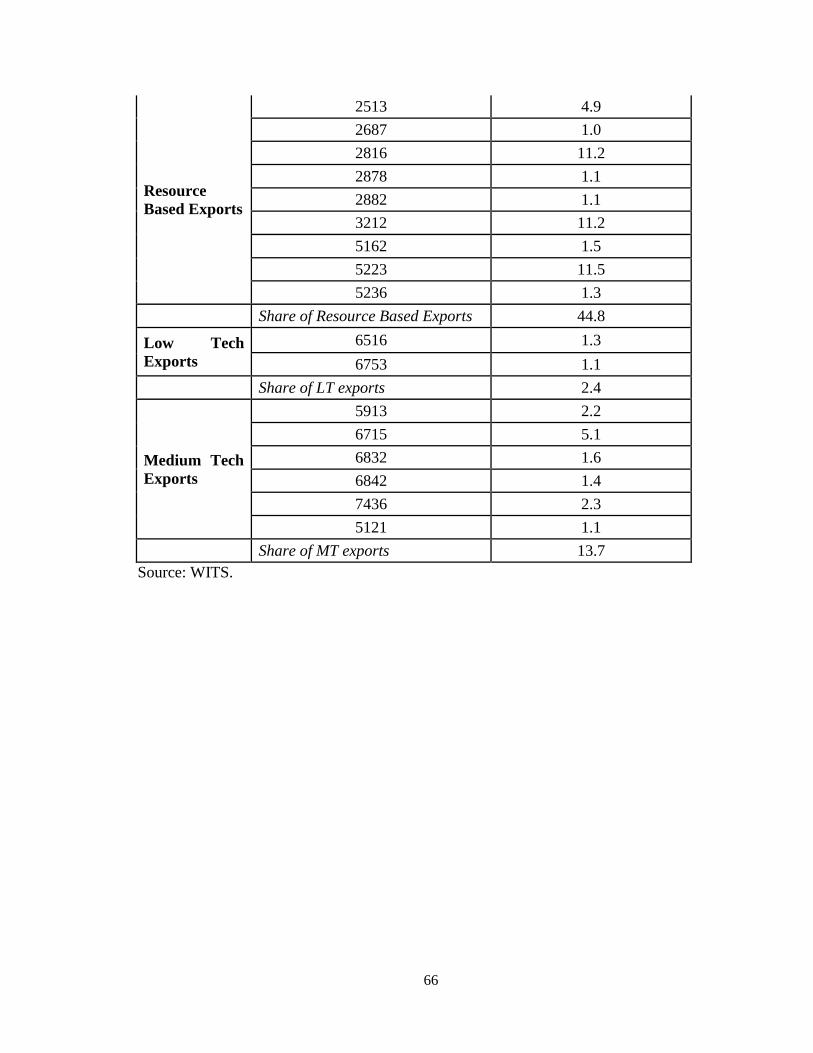
66
Resource
Based Exports
2513 4.9
2687 1.0
2816 11.2
2878 1.1
2882 1.1
3212 11.2
5162 1.5
5223 11.5
5236 1.3
Share of Resource Based Exports 44.8
Low Tech
Exports
6516 1.3
6753 1.1
Share of LT exports 2.4
Medium Tech
Exports
5913 2.2
6715 5.1
6832 1.6
6842 1.4
7436 2.3
5121 1.1
Share of MT exports 13.7
Source: WITS.

67
Appendix 5
Exports Based on UNIDO Technology Definition of Commodities for 2007
Brazil 2007
Product Code
% Share in Brazil's
Total Intra-BRICS
Exports
4 digits
Increasingly
Important
4 digits
important
commodities
Resource
Based
Exports
0112 5.6
0122 3.9
0123 2.8
0611 6.1
0612 1.1
1212 2.4
2222 16.7
2222
2515 2.3
2815 18.2 2815
2816 3.7
2816
2831 1.8
3332 4.9
4211 3.4 4211
5112
5112
5113
5113
5146
5146
5156
5156
Share of Resource
Based Exports 72.7
Low Tech
Exports 6114 3.1
Share of LT exports 3.1
Medium
Tech
Exports
5121
5121
5711
5711
5751
5751
6715 1.5
6821 1.2
7832 1.4
7843 1.2
Share of MT
exports 5.2
China 2007

68
Product Code
% Share in China's
Total Intra-BRICS
Exports
4 digits
Increasingly
Important
4 digits
important
commodities
Resource
Based
Exports
2772
2772
2782
2782
2929
2929
2613
2613
2723
2723
2919
2919
4113
4113
4213
4213
4218
4218
4229
4229
4311
4311
4313
4313
5157
5157
Share of Resource
Based Exports
6732 1.1
Low Tech
Based
Exports
8432 1.9
8442 2.7
8453 2.7
8454 1.2
8514 1.8
Share of Low Tech 11.4
3250 1.1
5621
5621
Medium
Based
Exports
5629
5629
5731
5731
5743
5743
7611 1.2
7638 1.1
7758 1.0
7821 1.2
Share of Medium
Based Exports 5.6
High Tech
5413 1.1
7522 1.4
7641 1.2

69
Exports 7643 4.4
7649 2.4
Share of High Tech
Exports 10.5
India 2007
Product Code
% Share in India's
Total Intra-BRICS
Exports
4 digits
Increasingly
Important
4 digits
important
commodities
Resource
Based
exports
2631 5.9 2631
2731 1.6
2814
2814
2815 27.1
2816 1.4
2852 1.3
2875 1.9
2879 1.7
4225
4225
5112 1.7 5112
5169
5169
Share of Resource
Based Exports 42.7
Medium
Tech
Exports
5123
5123
5711
5711
5751 1.2 5751
6715 1.2
6821 2.8
Share of Medium
Based Exports 5.2
High Tech
Exports
5413
5413
5421
5421
5429 2.2
5429
Share of High Tech
Exports 2.2
Russia 2007
Product Code
% Share in Russia's
Total Intra-BRICS
Exports
4 digits
Increasingly
Important
4 digits
important
commodities
Resource
Based
412 1.7
2321 1.3
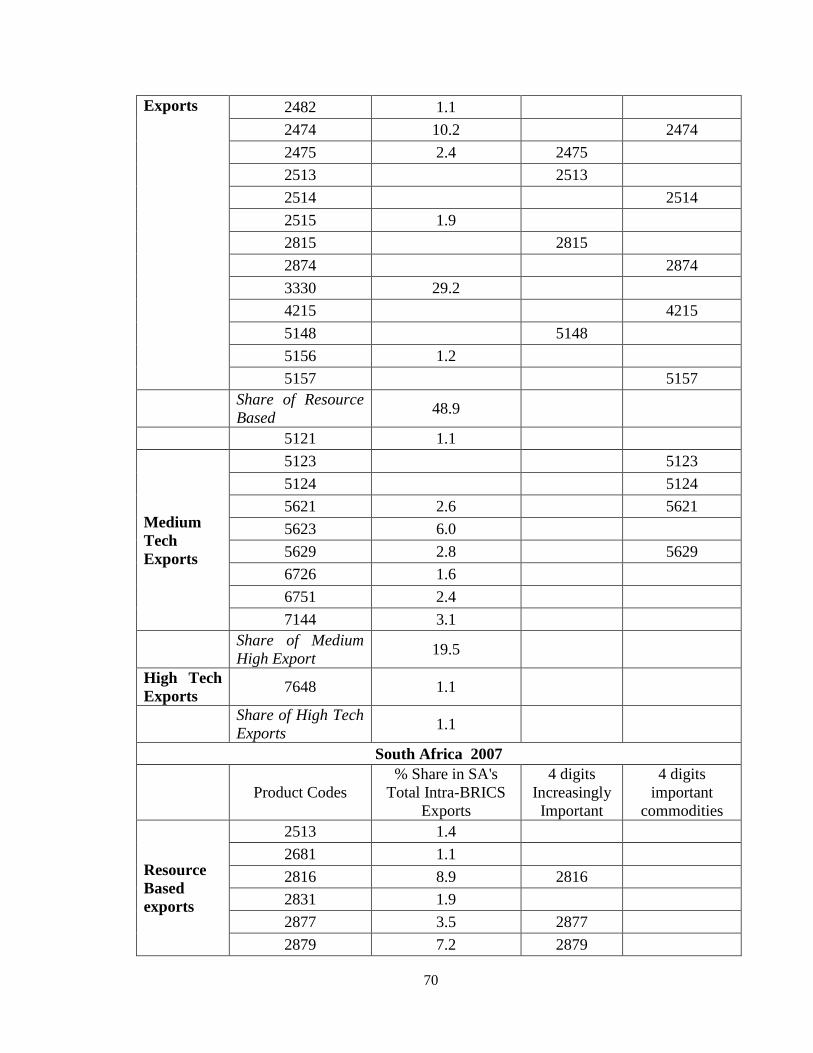
70
Exports 2482 1.1
2474 10.2
2474
2475 2.4 2475
2513
2513
2514
2514
2515 1.9
2815
2815
2874
2874
3330 29.2
4215
4215
5148
5148
5156 1.2
5157
5157
Share of Resource
Based 48.9
5121 1.1
Medium
Tech
Exports
5123
5123
5124
5124
5621 2.6
5621
5623 6.0
5629 2.8
5629
6726 1.6
6751 2.4
7144 3.1
Share of Medium
High Export 19.5
High Tech
Exports 7648 1.1
Share of High Tech
Exports 1.1
South Africa 2007
Product Codes
% Share in SA's
Total Intra-BRICS
Exports
4 digits
Increasingly
Important
4 digits
important
commodities
Resource
Based
exports
2513 1.4
2681 1.1
2816 8.9 2816
2831 1.9
2877 3.5 2877
2879 7.2 2879
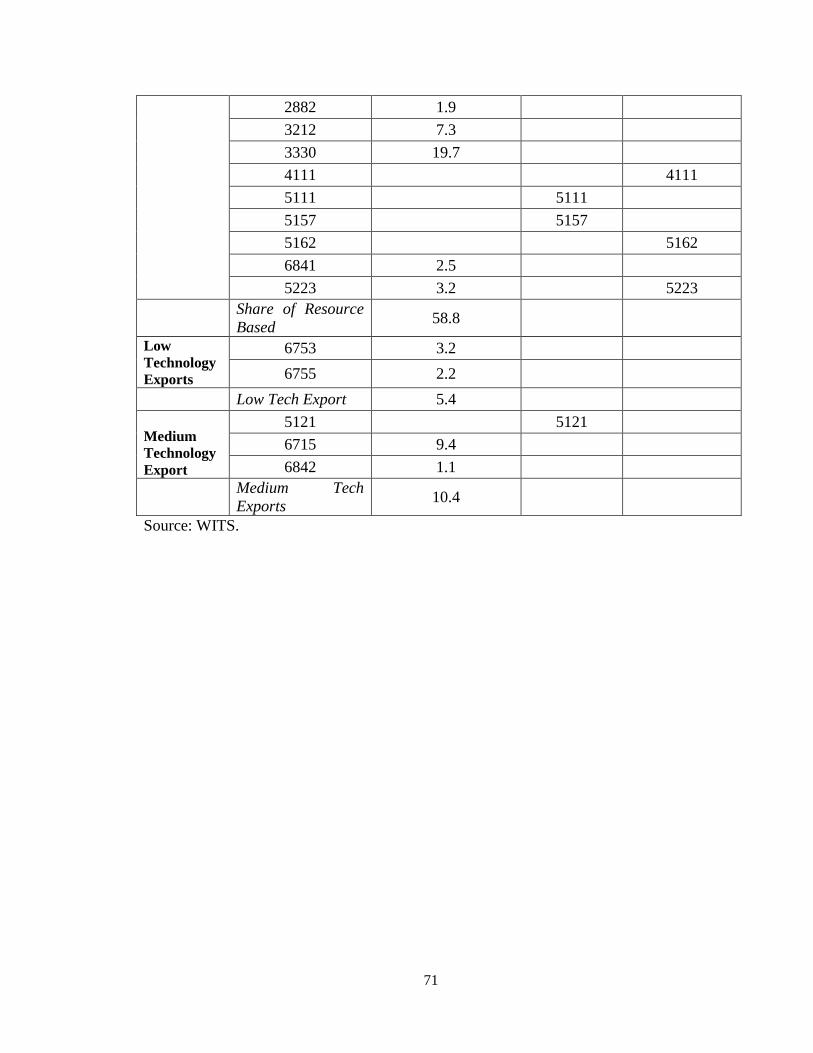
71
2882 1.9
3212 7.3
3330 19.7
4111
4111
5111
5111
5157
5157
5162
5162
6841 2.5
5223 3.2
5223
Share of Resource
Based 58.8
Low
Technology
Exports
6753 3.2
6755 2.2
Low Tech Export 5.4
Medium
Technology
Export
5121
5121
6715 9.4
6842 1.1
Medium Tech
Exports 10.4
Source: WITS.
72
Appendix 6
The rationale for using a variant of RCA index of Balassa (1965) is to eliminate the large
values of RCA appearing merely because of country size. Thus a large country‟s exports
of any commodity may be a small part of its own exports but may constitute a large part
of world exports of that commodity because that commodity is not important in world
trade. At an extreme a country „s RCA should show numbers infinitely high if that
country is the only exporter of that product. This is allowed for the variant of the Balassa
indes shown below. Since this country is the only exporter of that commodity the issue of
substitutability and competition in world markets is irrelevant. To identify this bias we
have also used a variant of Balassa‟s index given below.
Balassa‟s RCA Indices:
=
Variant of RCA index of Balassa can be defined as :
=
Where i is a country in BRICS, j is the commodity, X is exports, W and ROW stand for
world and the rest of world respectively. Here ROW implies the world excluding
BRICS. Hence, use of the second index ( as we have done) indicates that exceptionally
high RCAs may be due to the fact that the country is the only exporter of that commodity.
Essentially, we are simply eliminating double counting of a country in both the numerator
and the denominator of the index. We have calculated both variants of the RCA shown
above.

73
Appendix 7:
Product-Wise Revealed Comparative Advantage across BRICS, 2007
Product
Codes Product Name Brazil China India Russia SA
Resource Based
4218 Sesame (Sesamum) oil and its
fractions yes*
4225 Castor oil and its fractions Yes***
4311
Fats and oils and their fractions,
animal or vegetable, boiled,
oxidized,
41112 Fats and oils and their fractions, of
fish, other than liver oils
41135
Wool grease (other than crude) and
fatty substances derived from wool
gre
yes*
42111 Soya bean oil, crude, whether or not
degummed yes*
42119 Soya bean oil, refined, and its
fractions yes**
42139 Groundnut oil, refined, and its
fractions yes*
42151 Sunflower seed or safflower oil,
crude yes*
42159 Sunflower seed or safflower oil,
refined, and fractions thereof yes*
42299 Fixed vegetable fats and oils, crude,
refined or fractionated, n.e.s.
43131 Fatty acids; acid oils from refining
51119 Acyclic hydrocarbons, n.e.s. yes**
51122 Benzene, pure yes*
51124 Xylenes, pure yes* yes*
51133 Tetrachloroethylene
(perchloroethylene) yes*
51135 1,2-Dichloroethane (ethylene
dichloride) yes*
51464 Lysine and its esters; salts thereof;
glutamic acid and its salts yes*
51467
Amino-alcohol-phenols, amino-
acid-phenols and other amino-
compounds with
yes*
51483 Acrylonitrile yes*
51561 Lactams yes*
51576 Heterocyclic compounds containing

74
a pyrimidine ring
51577 Other heterocyclic compounds with
nitrogen hetero-atom(s) only
51579 Heterocyclic compounds, n.e.s.
51623 Acetone yes*
51624 Butanone (ethyl methyl ketone) yes**
51625 Other acyclic ketones without other
oxygen function yes*
51699 Other organic compounds Yes***
52234
Diphosphorus pentaoxide;
phosphoric acid and
polyphosphoric acids
yes*
68411 Aluminium, not alloyed yes*
Low Tech Exports
8453
Jerseys, pullovers, cardigans,
waistcoats and similar articles,
knitted o
yes*
8454 T-shirts, singlets and other vests,
knitted or crocheted yes*
61141 Other bovine and equine leather,
without hair on, tanned yes*
61142 Other bovine and equine leather,
without hair on, parchment-dressed yes*
67321 Flat-rld prod. of iron or n/a steel,
not 673.11, w>600mm,th>4.75mm yes*
67324
Flat-rld prod. of iron or n/a steel,
not coated,
hotrld,w>600mm,th>4.75mm
yes*
67531 Flat-rld prod. of stnls steel, hotrld,
of a width of 600 mm or more and yes*
67532 Flat-rld prod. of stnls steel, hotrld,
of a width of 600 mm or more and yes**
67534 Flat-rld prod. of stnls steel, hotrld,
of a width of 600 mm or more and yes*
67552 Flat-rld prod. of stnls steel,
coldrld,w>600mm,3<th<4.75mm yes*
67553 Flat-rld prod. of stnls steel,
coldrld,w>600mm,1<th<3mm yes*
67554 Flat-rld prod. of stnls steel,
coldrld,w>600mm,0.5<th<1mm yes*
84324
Trousers, bib and brace overalls,
breeches and shorts, men's or boys',
of
yes*
84426 Trousers, bib and brace overalls,
breeches and shorts, women's or yes*

75
girls',
85148
Footwear, n.e.s., with uppers of
leather or composition leather and
outer
yes*
Medium Tech Export
7611
Television receivers, colour
(including video monitors and
video projecto
yes*
7832 Road tractors for semi-trailers yes*
51211 Methanol (methyl alcohol) yes*
51213 Butanols yes* yes*
51215
Undenatured ethyl alcohol of an
alcoholic strength by volume of
80% or hi
yes**
51217 Fatty alcohols, industrial yes**
51231
Cyclanic, cyclenic or cycloterpenic
alcohols and their halogenated,
sulph
yes*
51235
Aromatic cyclic alcohols and their
halogenated, sulphonated, nitrated
or
51241 Phenol (hydroxybenzene), pure,
and its salts
51243 Other phenols and phenol-alcohols yes*
56211 Ammonium nitrate, whether or not
in aqueous solution yes*
56216 Urea, whether or not in aqueous
solution yes* yes*
56231 Potassium chloride yes*
56291 Fertilizers, n.e.s., containing the
three fertilizing elements nitrogen, yes*
56293
Diammonium
hydrogenorthophosphate
(diammonium phosphate)
yes* yes*
56294
Ammonium
dihydrogenorthophosphate
(monoammonium phosphate) and
mixtures t
yes* yes*
57111 Polyethylene having a specific
gravity of less than 0.94 yes*
57112 Polyethylene having a specific
gravity of 0.94 or more yes*
57311 Polyvinyl chloride, not mixed with
any other substances
57431 Polycarbonates yes*

76
57433 Polyethylene terephthalate yes*
57511 Polypropylene yes* yes*
57513 Propylene copolymers
67152 Ferrosilico-manganese yes*
67153 Ferrochromium yes* Yes***
67159 Ferro-alloys, n.e.s. yes*
67261 Semi-fin. prod. of iron or n/a steel<
0.25% of carbon, spec. rectangular yes*
67262 Semi-fin. prod. of iron or n/a steel<
0.25% of carbon, other rectangular yes*
67511 Flat-rld prod. of silicon-electrical
steel, width > 600 mm yes*
68212 Refined copper yes* yes*
68423 Aluminium plates, sheets and strip,
of a thickness exceeding 0.2 mm yes*
71441 Turbojets yes*
76381
Video-recording or reproducing
apparatus, whether or not
incorporating a
yes*
77586
Microwave ovens; other ovens;
cookers, cooking plates, boiling
rings, gri
yes*
77587 Electrothermic domestic
appliances, n.e.s. yes*
78219 Motor vehicles for the transport of
goods, n.e.s.
78439
Other parts and accessories of the
motor vehicles of groups 722, 781,
782
High Tech Export
7522
Digital automatic data processing
machines, containing in the same
housin
yes*
54131
Penicillins and their derivatives
with a penicillanic acid structure;
sal
yes* yes*
54139 Other antibiotics yes* yes*
54213 Medicaments containing penicillins
or derivatives thereof, with a penicil
54219
Medicaments containing other
antibiotics, put up in measured
doses or in
yes*
54293
Medicaments, n.e.s., put up in
measured doses or in forms or
packings for
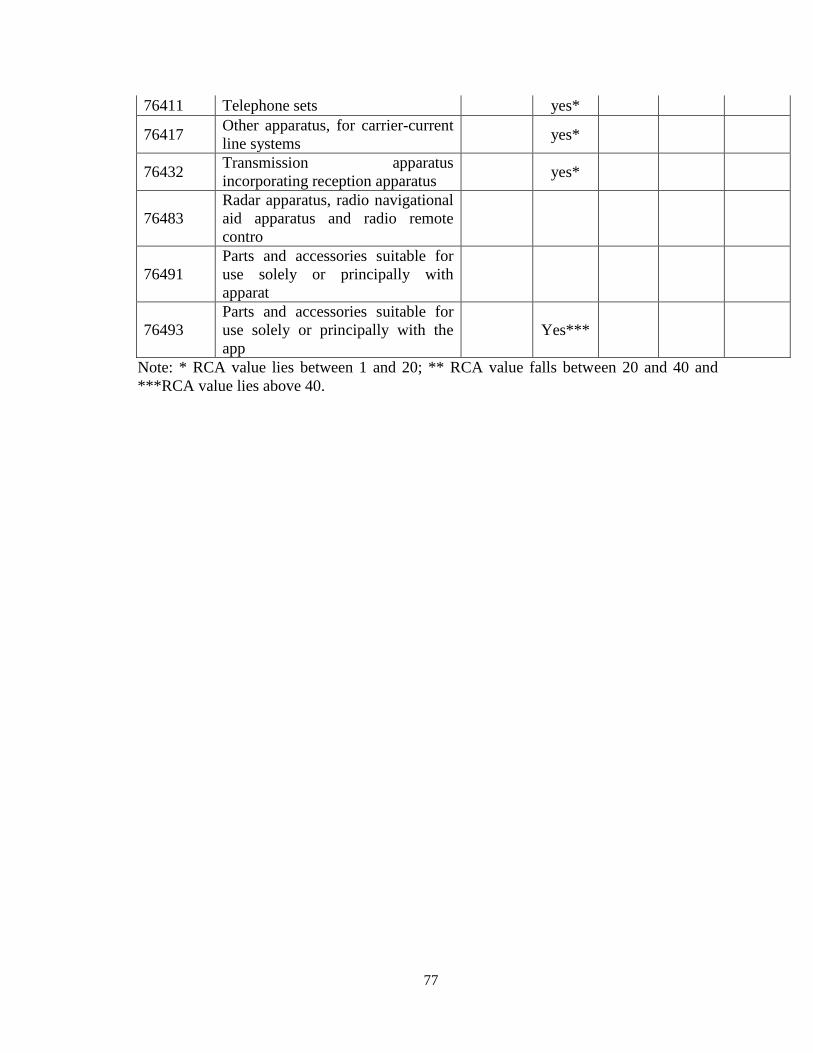
77
76411 Telephone sets yes*
76417 Other apparatus, for carrier-current
line systems yes*
76432 Transmission apparatus
incorporating reception apparatus yes*
76483
Radar apparatus, radio navigational
aid apparatus and radio remote
contro
76491
Parts and accessories suitable for
use solely or principally with
apparat
76493
Parts and accessories suitable for
use solely or principally with the
app
Yes***
Note: * RCA value lies between 1 and 20; ** RCA value falls between 20 and 40 and
***RCA value lies above 40.