determinants of fdi in brics countries: a panel · pdf fileint. journal of business science...
TRANSCRIPT
Int. Journal of Business Science and Applied Management, Volume 5, Issue 3, 2010
Determinants of FDI in BRICS Countries: A panel analysis
NarayanamurthyVijayakumar
Department of Banking Technology, School of Management, Pondicherry University,
Puducherry- 14., India
Tel: +91-94433-82134
Email: [email protected]
Perumal Sridharan
Department of International Business, School of Management, Pondicherry University
Puducherry- 14, India
Tel: + 91-98940-23571
Email: [email protected]
Kode Chandra Sekhara Rao
Department of Banking Technology, School of Management, Pondicherry University
Puducherry- 14, India
Tel: +91-98942-55526
Email: [email protected]
Abstract
This study examines the factors determining FDI inflows of BRICS countries using annual dataset from
the period 1975 to 2007 (for Russia required data set is available from 1990 onwards). The study
employs Panel data analysis and finds that the selected variables Market size, Labour cost,
Infrastructure, Currency value and Gross Capital formation as the potential determinants of FDI
inflows of BRICS countries. The Economic Stability and Growth prospects (measured by inflation rate
and Industrial production respectively), Trade openness (measured by the ratio of total trade to GDP)
are seems to be the insignificant determinant of FDI inflows of the BRICS countries. The empirical
results are robust in general for alternative variables determining FDI flows.
Keywords: foreign direct investment, panel data, economic stability

Int. Journal of Business Science and Applied Management / Business-and-Management.org
2
1 INTRODUCTION
The world has experienced a massive transformation in terms of geopolitics, economics and in
organisation and distribution of production. For several reasons, emerging economies of Brazil, Russia,
India and China (BRIC) have acquired important role in the world economy as producers of goods and
services. BRICS countries prominently attract larger capital because of their larger potential consumer
market having the common characteristic of large population. The BRIC countries are listed as
emerging economies but these countries as a whole do not have any trade or integrated economic
union. Brazil, Russia, India and China have emerged as major destination for Foreign Direct
Investment (FDI) inflows, resulting in BRIC - a strong constructive term which was prominently
coined by the ‘Goldman Sachs Investment Bank’ (Wilson and Purushothaman, 2003) to represent
Brazil, Russia, India, and China as an economic Block.
Global competition for FDI had given the bargaining power to Multi-National Corporations
(MNCs) and their allies (Boros Torstila, 1999). Competition forced the countries to lower their entry
regulations, taxes, environmental clearances, and stipulations on working conditions for attracting
FDIs. Goldman Sachs predicted that China and India are likely to emerge as dominant global suppliers
of manufactured goods and services while Brazil and Russia to dominate in supply of raw materials.
While Asian, European and Latin American continents are represented in the profile, absence of
Africa would undermine the importance of the ‘Developing World’ in the Global economy. Hence, it is
interesting and important to look beyond BRIC. The potential of Africa, and particularly South Africa,
the largest economy in the region, is also poised to play an important part in Global economic growth
and development, similar to BRIC. The study by Goldman Sachs showed that South Africa could
achieve five per cent growth over the next decade if the right policies were put in place. This projected
growth rate was based on the similar conditions set for the similar growth rate for the BRIC. Therefore,
this study includes South Africa and coins a new term BRICS (Brazil, Russia, India, China and South
Africa) to represent the four continents of the World, which are of economic significance, in the
process of Globalization.
The role played by FDI in Economic growth of an economy and living experience of BRIC
economies drew the attention of researchers and policy makers to explore the FDI led growth linkage
and identify the push and pull factors of FDI destinations.
The Goldman Sachs investment report (2003) pointed out not only the importance of South Africa
as the biggest economy in the African continent but also as an emerging economy in the World.
Although, South Africa- an emerging economy does not possess the characteristics of BRIC countries
in terms of territorial extension and the size of the population, yet it has certain desirable features like:
an enormous potential consumer market with larger middle-income group
abundant supply of natural resources
well developed financial parameters
good communication and network
effective energy and transport sectors and
sound legal system and modern infrastructure supporting an efficient distribution of
goods and services
Also, it plays an important economic and political role in the African continent.
In the recent days BRIC as emerging economies, exhibit economic strength in the face of the US
credit turmoil and growth slowdown. BRICS countries characterise a cyclical component of strong
domestic demand growth. There are also structural factors at work that bode well for the medium-term
growth prospects. Such factors can be captured in a simple growth accounting framework. Generally,
economic growth of an economy can be measured through several components, namely, changes in
labour and capital inputs, and total factor productivity. The total factor productivity captures
technological progress and/ or efficiency gains and residual remain unexplained due to changes in
labour and capital inputs. Growth accounting provides an analytical framework to assess medium-term
economic growth dynamics. However, the BRICS economies differ greatly in terms of their growth
prospects.
The demographic trends, labour supply dynamics and/or low urbanisation ratios seem to remain
favourable for Brazil, India and South Africa. In Brazil, India and South Africa the working age
population continues to expand until the middle of the current century, while in China it may decline
after 2015 and in Russia it is at the risk of collapsing (UN projects Russia’s working age population to
decline from 97 million in the year 2005 to 47 million by the year 2050). A low urbanisation ratio of 40
per cent in China may help to counteract the projected decline in the working age of the population by
Narayanamurthy Vijayakumar, Perumal Sridharan and Kode Chandra Sekhara Rao
3
allowing the transfer of labour from the countryside into the more productive urban economy. In
Brazil, not much should be expected from further urbanisation, as the country is already more highly
urbanised than many of the developed countries in the world. However, the demographic profile of
Brazil is relatively favourable and benefitable from a 20 per cent increase in the population of working
age between the year 2005 and 2025. The Russian population of working age is already in decline and
little help will come from ‘surplus rural labour’ due to a high urbanisation ratio. From a purely
demographic point of view, India and South Africa face the most promising prospects, combining solid
population growth and a lower degree of urbanisation. Though this situation may pose challenges of its
own (in terms of urban development and infrastructure), but definitely be supportive for growth
dynamics. The recent capital accumulation trends favour China and India. Assuming that investment
ratios do not change dramatically over the next few years, China and India face much brighter
prospects than Brazil, Russia and South Africa. Currently domestic investment ratios are around 40 per
cent and 30 per cent of GDP in China and India, respectively, where as an investment ratio of Brazil,
Russia and South Africa account to 20 per cent to 23 per cent of GDP. Russia and South Africa
probably increase its investment ratio because of large savings generated by the commodity boom.
Brazil, having a more modest increase their domestic savings may drive a moderate up-tick in
investment ratio. It seems that Chinese and Indian capital accumulation will proceed at a much faster
pace than Brazil and Russia.
The relative and absolute economic importance of BRICS is expected to continue to rise for the
foreseeable future. In terms of economic growth, China has been outperforming the other four countries
by a wide margin over the past thirty years. Over the past decade, real GDP growth averaged 10 per
cent in China, 7 per cent both in India and Russia, 4.6 per cent in South Africa and 3.3 per cent in
Brazil. In general, high savings rate, low level of urbanisation, low per capita income, higher export-
orientation, manufacturing-based development strategy underpinned by strong investment in
infrastructure and education will combine to sustain BRICS countries as superior economies of world.
Thus, BRICS may become the largest economies of the world in the upcoming decades.
The BRICS countries have been the predominant recepients of FDI during the last decades.
However, the evolution of FDI inflow shows very distinct trajectories for the five countries. Until 1984,
Brazil was the major FDI recipient country among the BRICSs, overtaken by China in 1985 and since
then China continues to be a major destiny of FDI, especially in the automotive and consumer durables
sectors. China became the world major recipient of FDI in the 1990s, matching with country’s efforts
to integrate with the world economy. Many Multinational Companies have moved their operations to
China to take advantage of its low labor costs and huge domestic market. South Africa and India
received an almost constant and small part of the world total FDI flows during last two decades. India
has many restrictions to FDI inflows, where, public enterprises dominate in many key sectors. Equally,
the low and constant inflow applies to the Russian Federation since 1990. It is also worth of pointing
out that the type of FDI received by each country has been significantly different and that the type
depends on policies of the recipient countries. For instance, some of BRICS countries like Brazil,
Russian Federation and South Africa liberalized their economies in more unconditional way and
received more portfolios of FDI. For these countries, FDI was directed to the productive sectors, mostly
by way of acquisitions of local firms. China and India have not liberalised the Capital account, where
the FDI flows seem to be concentrated on ‘Green Field Investments’ in new production capacity.
Thus, the BRICS countries appear to have prosperity of economic and social development in the
forth coming decades, if these countries form a formal union like European Union, ASEAN, G6 and
G8 etc, and pool their resources. The economic growth will be tremendous and can throw competition
and challenges towards the developed countries.
However, the current flow of FDI into BRICS is extremely complex and subject to various factors
related to the competitive environment in the home and host countries. In this context, this study
intends to examine the major determinants of FDI flows into BRICS countries. There are several
studies contributing to the economic literature on the determinants of FDI.
The existing literature includes a number of Surveys, Case studies (see: Lankes and Venables,
1996; Meyer, 1998; Boros-Torstila, 1999; Resmini, 2000) and econometric studies (see: Lansbury et
al., 1996; Wang and Swain, 1995; Hollond and Pain, 1998; Wood ward et al., 1997). There are some
empirical studies formulated cross sectional analysis and found a set of explanatory variables that
determine FDI flows (see: Agarwal, 1980; Gastanaga et al, 1998; Markusan and Maskus, 1999; Love
and Hidalgo, 2000; Lipsey, 2000; Chakraborti, 2001; Moosa, 2002; Beven and Estrin, 2000; Singh and
Jun, 1995; Sahoo, 2006; and Nunes et al., 2006 etc).
However, the above mentioned studies are investigated for the transition economies and
developing economies as well as for groups like ASEAN and European Union using short time series
of data. In all the above, presently available research literature pertaining to BRICS countries is still
Int. Journal of Business Science and Applied Management / Business-and-Management.org
4
limited. In this context, our study intends to examine the factors that determine the FDI flows to BRICS
countries by employing long recent data. This study is expected to contribute its empirical results for
BRICS countries along with existing economic literature.
The Panel data analysis is conducted to overcome the problems of endogeneity, heteroscedasticity
and non stationarity in the regression models. However, our analysis establishes empirical evidences
that the determinants of FDI inflows to BRICS countries are Market size, Labor cost, Currency value,
Infrastructure and Gross capital formation. The significant effect of Gross capital formation in relation
to FDI indicates that the privatization and ownership changes do not affect Capital formation of BRICS
countries.
This study is organised as follows: section 1 is the present one and section 2 provides the
theoretical literature relating to determinants of FDI. In section 3 we discuss the potential variables that
are expected to attract FDI flows. We provide data and model specification in Section 4. We discuss
empirical results in Section 5 and Summary and Conclusion in Section 6.
2 REVIEW OF LITERATURE
In this section, we provide brief literature reviews which investigate the determinants of FDI
inflows across various economies.
The classical model for determinants of FDI begins from the earlier research work of Dunning
(1973, 1981) which provide a comprehensive analysis based on ownership, location and the
internationalization (OLI) paradigm. The empirical studies based on aggregate econometric approach
are made by Agarwal (1980), Schneider et al (1985). Later on Lucas (1993) examines the determinants
of FDI inflows for select East and South Asian economies during 1960 to1987 by using a model based
on a traditional derived-factor of a multiple product monopolist. The study finds that FDI inflows are
more elastic with respect to cost of capital than wages and also more elastic with respect to aggregate
demand in exports than domestic demand.
Loree and Guisinger (1995) study the determinants of FDI by United States towards developed
nations from 1977 to 1982. The study concludes that the Host country policy related variables are
significant in developed countries and infrastructure seems to be an important determinant for all the
regions. Applying the qualitative economic variables Sing and Jun (1995) find a positive relationship
between taxes on international transactions and FDI inflows to developing countries, where the export
related variables strongly explain pulling of FDI to a country. Duran (1999) uses the Panel data and
time series techniques to find out the drivers of FDI for the period 1970-1995. The study indicates that
the size, growth, domestic savings, country’s solvency, trade openness and macroeconomic stability
variables are the catalysts of FDI. Beven and Estrin (2000) establish the determinants of FDI inflows to
transition economies (Central and Eastern Europe) by taking determinant factors as country risk, labour
cost, host market size and gravity factors from 1994 to1998. The study observes that country risks are
influenced by private sector development, Industrial development, the government balance, reserves
and corruption. A dummy variable employed for capturing the key announcements of progress in EU
accession seems to be directly influencing the FDI receipts. Lipsey (2000) captures a positive effect of
FDI on growth and has a strong interaction with the level of schooling in the host country.
Levy-yeyati et al (2002) examine the extent of business cycles and interest rate cycles of
developed countries impact on FDI flows to developing countries for the period 1980 to 1990. They
consider the determinants of bilateral FDI using a gravity model.They find that FDI flows from US and
Europe move counter cyclical to the business cycle in the source country, as well as, the interest rate
cycles are the important determinants of FDI inflows. Aguilar and Vallejo (2002) study the forces
behind the bilateral FDI due to the regional integration agreement for Latin America. They use gravity
model and find that the size and development of both the domestic and foreign economies, the distance
between them and the common language existence are the major determinants of bilateral FDI flows.
Garibaldi et al (2002) analyse the FDI and Portfolio investment flows to 26 transition economies
in Eastern Europe including the former Soviet Union from 1990 to 1999. The regression estimation
indicates that the FDI flows are well explained by standard economic fundamentals such as market
size, fiscal deficit, inflation and exchange rate regime, risk analysis, economic reforms, trade openness,
availability of natural resources, barriers to investments and bureaucracy. However, the portfolio flows
are poorly explained by the fundamentals. The study of Nonnenberg and Mendonca (2004) finds that
the factors such as the market size measured by GNP, growth rate of the product, the availability of
skilled labour, the receptivity of foreign capital, the country risk rating and stock market behaviour
seem to be the important determinants of FDI flows for developing countries comprising of 33
countries from 1975 through 2000. In the context of Latin American countries, Nunes et al (2006) find
the variables such as market size, openness of the economy, infrastructure, macroeconomic stability
Narayanamurthy Vijayakumar, Perumal Sridharan and Kode Chandra Sekhara Rao
5
(inflation), wages, human capital and natural resources as the determinants of FDI flows during the
period 1991 to 1998. The study observes that the market size, infrastructure and inflation are positively
influencing and wage rate is negatively influencing the FDI flows. Similarly, by estimating the panel
co-integration test, Sahoo (2006) finds that the market size, labour force growth, infrastructure index,
and trade openness are the important determinants of the FDI flows in South Asian countries.
Thus, the reviews help us in choosing the factors or alternatives that may gauge the FDI inflows of
BRICS countries.
3 POTENTIAL VARIABLES DETERMINING FDI INFLOWS
Based on the discussed literature review, our study gauges a set of potential determinant variables
that influence the FDI flows and we classify the variables into seven broad categories, viz., Market
size, Economic stability and Growth prospects, Trade openness, Currency value, Infrastructure
facilities, Labour cost and Gross capital formation.
Market size
Larger market size should receive more inflows than that of smaller countries having lesser market
size. Market size is generally measured by Gross Domestic Product (GDP), GDP per capita income and
size of the middle class population. It is expected to be a positive and significant determinant of FDI
flows (see: Lankes and Venables, 1996; Resmini, 2000; Duran, 1999; Garibaldi, 2002; Bevan and
Estrin, 2000; Nunes et al., 2006; Sahoo, 2006). In contrast, Holland and Pain (1998) and Asiedu (2002)
capture growth and market size as insignificant determinants of FDI flow.
Economic stability and growth prospects
A country which has a stable macroeconomic condition with high and sustained growth rates will
receive more FDI inflows than a more volatile economy. The proxies measuring growth rate are: GDP
growth rates, Industrial production index, Interest rates, Inflation rates (see: Duran, 1999; Dassgupta
and Ratha, 2000). Contradictingly, when inflation is taken as proxy for the level of economic stability,
then the classic symptoms of fiscal or monetary control will result in unbridled inflation. In connection
with this, investors prefer to invest in more stable economies that reflect a lesser degree of uncertainty
(see: Nonnenberg and Mendonca, 2004). Therefore, it is expected that GDP growth rate, Industrial
production index, Interest rates would influence FDI flows positively and the Inflation rate would
influence positively or negatively.
Labour cost
Higher labour cost would result in higher cost of production and is expected to limit the FDI
inflows; therefore, we expect the negative and significant relationship between labour cost and FDI.
Labour cost can be proxied by wage rate (see: Lankes and Venables, 1996; Nunes et al 2006). There
are few studies which find labour force determining FDI flows positively, (see: Wheeler and Mody,
1992; Kumar, 1994; Sahoo, 2006). However, Resmini (2000) did not confirm the significance of
wages, perhaps because of using wages that are uncontrolled for productivity and exchange rates
(Bevan and Estrin, 2004).
Infrastructure facilities
The well established and quality infrastructure is an important determinant of FDI flows. On the
other hand, a country which has opportunity to attract FDI flows will stimulate a country to equip with
good Infrastructure facilities. Therefore, we expect positively significant relationship between FDI and
Infrastructure. The previous studies of Wheeler and Mody (1992), Kumar (1994), Loree and Guisinger
(1995) and Asiedu (2002) also support our expected hypothesis. The availability of quality
Infrastructure can be constructed by considering Electricity, Water, Transportation and
Telecommunications (see: Sahoo, 2006). Whereas, Nunes et al. (2006) consider public expenditure on
capital to acquire fixed capital assets, land, intangible assets and non-financial and non- military assets
for Infrastructure.
Trade openness
Trade openness is considered to be a key determinant of FDI as represented in the previous
literature; much of FDI is export oriented and may also require the import of complementary,
intermediate and capital goods. In either case, volume of trade is enhanced and thus trade openness is
generally expected to be a positive and significant determinant of FDI (see: Lankes and Venables,
Int. Journal of Business Science and Applied Management / Business-and-Management.org
6
1996; Holland and Pain, 1998; Asiedu, 2002; Sahoo, 2006). Trade openness is proxied as the ratio of
the Export plus Import divided by GDP (Nunes et al. 2006; and Sahoo, 2006).
Currency valuation
The strength of a currency (Exchange rate) is used as proxy for level of inflation and the
purchasing power of the investing firm. Devaluation of a currency would result in reduced exchange
rate risk. As a currency depreciates, the purchasing power of the investors in foreign currency terms is
enhanced, thus we expect a positive and significant relationship between the currency value and FDI
inflows. The currency value can be proxied by the Real Exchange Rate, Real Effective Exchange Rate
(REER) and Nominal Effective Exchange Rate (NEER).
Gross Capital Formation
In a transition economy, improvements in the investment climate help to attract higher FDI
inflows. It translates into higher Gross capital formation which in turn leads to greater economic
growth. Libor Krkoska (2001) and Lipsey (2000) find little evidence of FDI having an impact on
capital formation in developed countries and observe that the most important aspect of FDI in the
selected sample of countries is related to ownership change. The relationship between FDI and Capital
Formation is not simple (Libor Krkoska, 2001). In the case of certain privatization, it may not lead to
increase at all or even result in reduction. Thus, the unclear relation between FDI and capital formation
may also hold in a transition economy. However, a positive or negative and significant relationship
between FDI and Capital Formation is expected.
4 DATA AND MODEL SPECIFICATION
The data set consists of yearly observations for the period 1975 - 2007 for the five fast developing
countries namely Brazil, Russia (the data set is available from 1990 onwards), India, China and South
Africa (BRICS countries). The required data set for the selected countries were obtained from ‘World
Development Indicators (WDI) CD-ROM- 2008’, except for Industrial Production index and Exchange
rate. The Industrial Production index is obtained from Center for Monitoring Indian Economy
(CMIE)’s ‘International Economic Indicators’ and Exchange rate is obtained from The Federal
Reserve Board Statistics (Releases and Historical data).
The dependent variables in our study is the Log of FDI inflow in current USD (LFDI) and the
independent variables that are expected to determine FDI flows are carefully chosen, based on previous
literature and availability of dataset for the selected period. The independent variables in our estimation
generally include Gross Domestic Product, Industrial production index, Inflation rate, Wage rate,
Infrastructure Index, Trade Openness, Exchange Rate and Gross capital formation. The Infrastructure
index (INFRAI) is constructed by indexing Electric Power Consumption (kwh per capita), Energy use
(kg of oil equivalent per capita) and Fixed line mobile phone subscribers (per 100 people). We ignore
Air freight transport variable due to non availability of data for selected countries for the study period.
The variable Currency value, Exchange Rate is substituted with Real Effective Exchange Rate Index
(REER) because latter variable seems to be robust in the estimation than the former variable.
In connection with discussions of the previous section, we propose an estimation model as
follows, where the selected variables are expected to determine the FDI inflows:
LFDIti = +β1 LGDPit + β2 IPIit + β3 IFLAit + β4 WAGti + β5 INFIit + β6 TRDOit + β7 REERit
+ β8 GCFNit + eit (1)
Where,
LFDIti is the log of Foreign Direct Investment in current US$ for country i at time t.
LGDPit is the log of Gross Domestic Product in current US$ for country i at time t and is the
measure of market size
IPIit is the Industrial Production Index and IFLAit is the Inflation Rate (Annual percent) for
country i at time t, which are the measures of Economic Stability and Growth prospectus of a country
WAGit is the log of workers remittances and compensation of employees received in US $ for
country i at time t and is the measure of Labour cost
Narayanamurthy Vijayakumar, Perumal Sridharan and Kode Chandra Sekhara Rao
7
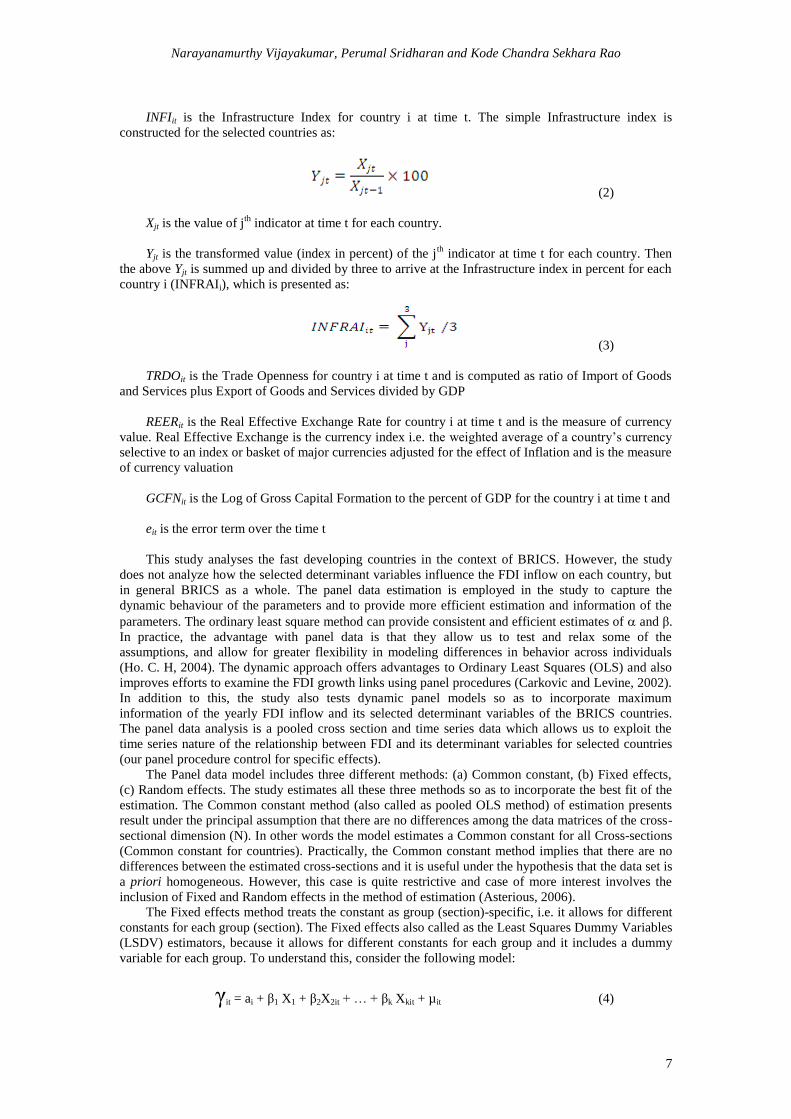
INFIit is the Infrastructure Index for country i at time t. The simple Infrastructure index is
constructed for the selected countries as:
(2)
Xjt is the value of jth
indicator at time t for each country.
Yjt is the transformed value (index in percent) of the jth
indicator at time t for each country. Then
the above Yjt is summed up and divided by three to arrive at the Infrastructure index in percent for each
country i (INFRAIi), which is presented as:
(3)
TRDOit is the Trade Openness for country i at time t and is computed as ratio of Import of Goods
and Services plus Export of Goods and Services divided by GDP
REERit is the Real Effective Exchange Rate for country i at time t and is the measure of currency
value. Real Effective Exchange is the currency index i.e. the weighted average of a country’s currency
selective to an index or basket of major currencies adjusted for the effect of Inflation and is the measure
of currency valuation
GCFNit is the Log of Gross Capital Formation to the percent of GDP for the country i at time t and
eit is the error term over the time t
This study analyses the fast developing countries in the context of BRICS. However, the study
does not analyze how the selected determinant variables influence the FDI inflow on each country, but
in general BRICS as a whole. The panel data estimation is employed in the study to capture the
dynamic behaviour of the parameters and to provide more efficient estimation and information of the
parameters. The ordinary least square method can provide consistent and efficient estimates of and β.
In practice, the advantage with panel data is that they allow us to test and relax some of the
assumptions, and allow for greater flexibility in modeling differences in behavior across individuals
(Ho. C. H, 2004). The dynamic approach offers advantages to Ordinary Least Squares (OLS) and also
improves efforts to examine the FDI growth links using panel procedures (Carkovic and Levine, 2002).
In addition to this, the study also tests dynamic panel models so as to incorporate maximum
information of the yearly FDI inflow and its selected determinant variables of the BRICS countries.
The panel data analysis is a pooled cross section and time series data which allows us to exploit the
time series nature of the relationship between FDI and its determinant variables for selected countries
(our panel procedure control for specific effects).
The Panel data model includes three different methods: (a) Common constant, (b) Fixed effects,
(c) Random effects. The study estimates all these three methods so as to incorporate the best fit of the
estimation. The Common constant method (also called as pooled OLS method) of estimation presents
result under the principal assumption that there are no differences among the data matrices of the cross-
sectional dimension (N). In other words the model estimates a Common constant for all Cross-sections
(Common constant for countries). Practically, the Common constant method implies that there are no
differences between the estimated cross-sections and it is useful under the hypothesis that the data set is
a priori homogeneous. However, this case is quite restrictive and case of more interest involves the
inclusion of Fixed and Random effects in the method of estimation (Asterious, 2006).
The Fixed effects method treats the constant as group (section)-specific, i.e. it allows for different
constants for each group (section). The Fixed effects also called as the Least Squares Dummy Variables
(LSDV) estimators, because it allows for different constants for each group and it includes a dummy
variable for each group. To understand this, consider the following model:
γit = ai + β1 X1 + β2X2it + … + βk Xkit + µit (4)

Int. Journal of Business Science and Applied Management / Business-and-Management.org
8
Where, the dummy variable is the one that allows us to take different group-specific estimates for
each of the constants for every different section.
However, while using Fixed effects method, we need to apply tests to check whether Fixed effects
(i.e., different constants for each group) should indeed be included in the model. To do this the standard
F-test can be used to check Fixed effects against the simple Common constant OLS method. The null
hypothesis is that all the constants are the same (homogeneous), and thus therefore the Common
constant method is applicable:
H0: α1 = α2 = … = αN (5)
The F statistics is:
(R2FE - R
2CC) / (N – 1)
F = ~ F (N-1, NT – N – k) (6)
(1 – R2 FE) / (NT – N – k)
Where R2
FE is the coefficient of determination of the Fixed effects model and R2
CC is the
coefficient of determination of the Common constant model, if F-statistical is bigger than the F-critical
then we reject the null hypothesis.
Therefore, while using Fixed effects one should care about the validity of estimation even the F-
test suggests to do so. The significant disadvantages of the Fixed effects method suggests for using the
Random effects method presented in the next section.
The Random effects method is an alternative method of estimation which handles the constants for
each section as random parameters rather than fixed. Hence the variability of the constant for each
section comes from the fact that:
ai = a + vi (7)
Where vi is a zero mean standard random variable.
The Random effects model therefore takes the following from:
γit = (α + νi) + β1 X1it + β2X2it + …
+ βk Xkit + uit (8)
γit = α + β1X1it + β2 X 2it + …
+ βk Xkit + (νi + uit) (9)
One obvious disadvantage of the Random effects approach is that one need to make specific
assumptions about the distribution of the random component. Also, if the unobserved group-specific
effects are correlated with the explanatory variable, then the estimates will be biased and inconsistent.
However, the Random effects model has the advantage:
that, there are fewer parameters to estimate compared to the Fixed effects method and
it allows for additional explanatory variable that have equal value for all observations
within a group (i.e., it allow us to use dummies).
Thus the use of Random effects method in the estimation requires lot of care and must be
employed only if it is necessary and meaningful in comparison to Fixed effect method. Generally in the
panel data analysis, the Fixed effects model assumes that each country differs in its intercept term,
whereas the Random effects model assumes that each country differs in its error term. When the Panel
is balanced (i.e., contains all existing cross sectional data), one might expect Fixed effects model to
work well. Otherwise, the Random effect method will be more appropriate when the sample contains
limited observations of the existing cross-sectional units. However, the Hausman specification test
(1978) guides us to choose the appropriate Panel data model either Fixed effects method or Random
effects model.
However, this study performs all the above three methods of panel data model to analyse the
robustness of parameter co-efficient in explaining the factors that determine the FDI inflows to the
BRICS countries. The Fixed effect method is rejected in the analysis based on the Hausman
specification test (1978), a test that assists in making choice between the Random effects. However, we
Narayanamurthy Vijayakumar, Perumal Sridharan and Kode Chandra Sekhara Rao
9
present both the results in Table-1, but will not consider for the interpretations. We show Random
effects instead of Common constant method because the results of latter observed to be similar with the
former. Moreover, the Random effects method has more estimation advantages than the Common
constant method, since the data classification seems to be a priori homogeneous. The estimation
ensures homogeneity by choosing the sample countries which are assumed to be the most emerging
economies of the world in terms of their growth and market potentials.
Hausman (1978) adopts this based on the idea that under the hypothesis of no correlation, both
Ordinary Least Square (OLS) and Generalised Least Square (GLS) are consistent but OLS is
inefficient, while under the alternative OLS is consistent but GLS is not. More specifically, Hausman
assumed that there are two estimators 0
and 1
of the parameter vector β and he added two
hypothesis-testing procedures. Under Ho, both estimators are consistent, but
0
is inefficient, and
under H1, 0
is consistent and efficient but β1 is inconsistent.
According to Ahn and Moon (2001), the Hausman statistic is viewed as a distance measure
between the Fixed effects and the Random effects estimators. Thus we actually test H0, that Random
effects are consistent and efficient, versus H1, that Random effects are inconsistent (as the Fixed effects
will be always consistent). The Hausman test uses the following test statistic:
H= ( FE – RE
) [Var( FE ) – Var ( RE
)]-1
( FE –
RE)
~ X
2(k) (10)
If the value of the statistic is large, then the difference between the estimates is significant, so we
reject the null hypothesis that the Random effects model is consistent and we use the Fixed effects
estimators. In contrast, a small value of the Hausman statistic implies that the Random effect is more
appropriate estimator.
5 EMPIRICAL RESULTS
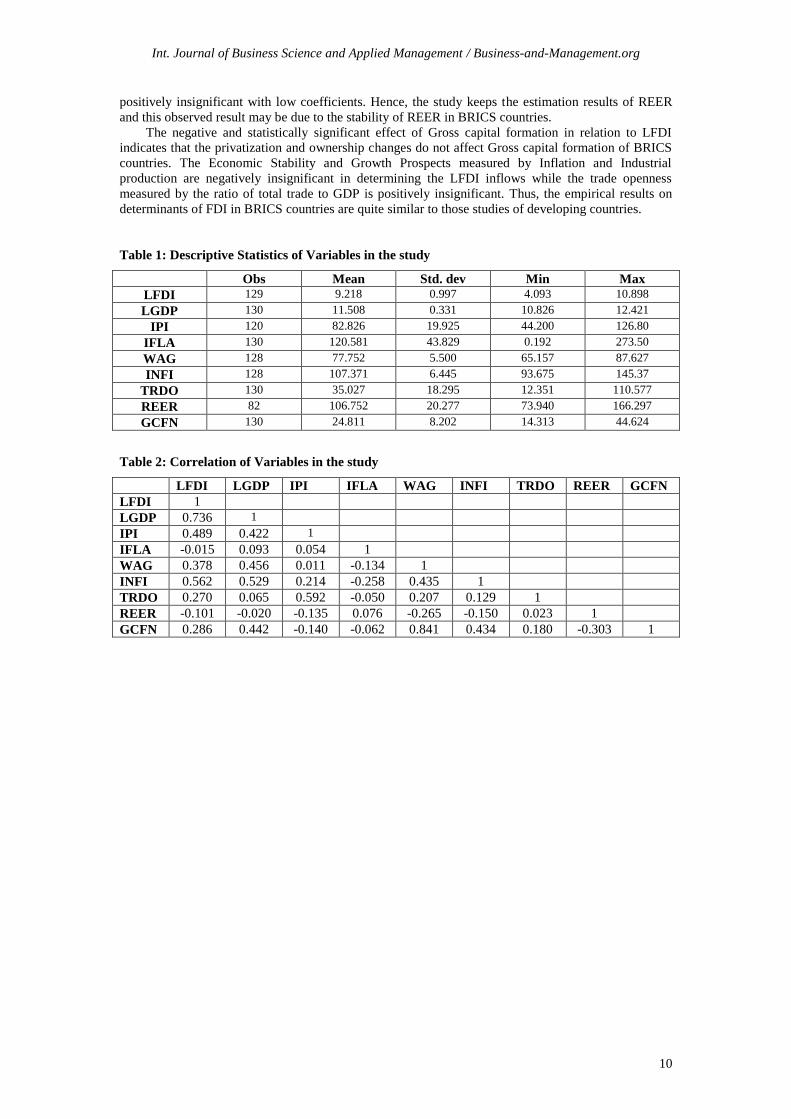
The descriptive statistics and correlation results for the selected variables for BRCIS countries are
given in Table-1 and 2 respectively. The REER value observation in the estimation is 82 and other
variables are having 120 to 130 observations. The IFLA has highest mean and standard deviation of
120.581 and 43.829 respectively in the data distribution. The independent variable LGDP is highly
correlated with IPI, WAG, INFI, and GCFN. The variable WAG is highly correlated with GCFN and
INFI and IPI highly correlated with TRDO. The existence of high correlation among the independent
variables will lead to the problem of multicollinearity in the estimation. Still we consider these
variables because of advantageousness of the panel data estimation which takes care of the collinearity
problems.
We estimate Panel data analysis including OLS pooled regression (Common constant method),
Fixed effects method and Random effects method for the selected study period. The robustness of
parameter coefficients are used to explain the relationship between LFDI inflows and the selected
independent variables. Since, the results of OLS pooled regression and Random effects parameter
coefficients sign and their significance levels are almost similar, we choose Random effects model to
check the robustness with Fixed effects model. The Fixed effects model is rejected in the analysis
based on Hausman specification test (1978). The estimation results of both Fixed effects and Random
effects model are given in Table- 3. However, we show both results but we discuss only the results of
Random effects model.
Our study also analyses an alternative econometric approach to the normal panel data so as to use
a dynamic Panel data framework of Arellano and Bond (1991) model including lags of dependent and
independent variables in the estimation. The result of Dynamic Panel data estimation observed to be
inconsistent and the Sargan test rejected the validity of the instrumental variables as well as auto
correlation problem deducted at first and second order. Therefore, it is not represented and discussed in
the present study.
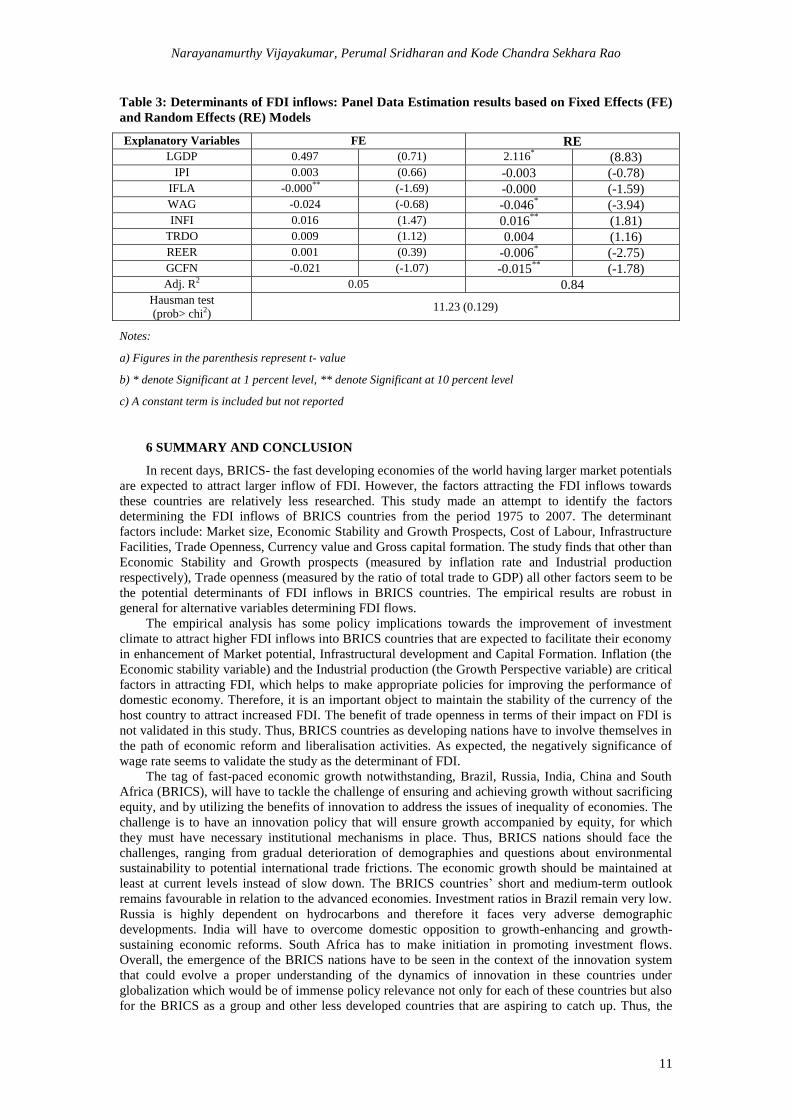
Table-3 showing the results of Random effects model confirms the significance of Market size
(LGDP), Labor Cost (WAG), Currency value (REER) at 1 percent level of significance. The
Infrastructure and Gross capital formation are significant at 10 percent level. The co-efficient signs for
each of these variables are as expected, positive for Market size and Infrastructure and negative for
labour cost. We find significantly negative relationship between LFDI and Currency value (REER),
which is a contradictory result as expected. Therefore, the study substitutes REER with Exchange rate
currency per US $ in the estimation to check the change in sign and significance. The result changed
Int. Journal of Business Science and Applied Management / Business-and-Management.org
10
positively insignificant with low coefficients. Hence, the study keeps the estimation results of REER
and this observed result may be due to the stability of REER in BRICS countries.
The negative and statistically significant effect of Gross capital formation in relation to LFDI
indicates that the privatization and ownership changes do not affect Gross capital formation of BRICS
countries. The Economic Stability and Growth Prospects measured by Inflation and Industrial
production are negatively insignificant in determining the LFDI inflows while the trade openness
measured by the ratio of total trade to GDP is positively insignificant. Thus, the empirical results on
determinants of FDI in BRICS countries are quite similar to those studies of developing countries.
Table 1: Descriptive Statistics of Variables in the study
Obs Mean Std. dev Min Max
LFDI 129 9.218 0.997 4.093 10.898
LGDP 130 11.508 0.331 10.826 12.421
IPI 120 82.826 19.925 44.200 126.80
IFLA 130 120.581 43.829 0.192 273.50
WAG 128 77.752 5.500 65.157 87.627
INFI 128 107.371 6.445 93.675 145.37
TRDO 130 35.027 18.295 12.351 110.577
REER 82 106.752 20.277 73.940 166.297
GCFN 130 24.811 8.202 14.313 44.624
Table 2: Correlation of Variables in the study
LFDI LGDP IPI IFLA WAG INFI TRDO REER GCFN
LFDI 1
LGDP 0.736 1
IPI 0.489 0.422 1
IFLA -0.015 0.093 0.054 1
WAG 0.378 0.456 0.011 -0.134 1
INFI 0.562 0.529 0.214 -0.258 0.435 1
TRDO 0.270 0.065 0.592 -0.050 0.207 0.129 1
REER -0.101 -0.020 -0.135 0.076 -0.265 -0.150 0.023 1
GCFN 0.286 0.442 -0.140 -0.062 0.841 0.434 0.180 -0.303 1
Narayanamurthy Vijayakumar, Perumal Sridharan and Kode Chandra Sekhara Rao
11
Table 3: Determinants of FDI inflows: Panel Data Estimation results based on Fixed Effects (FE)
and Random Effects (RE) Models
Explanatory Variables FE RE LGDP 0.497 (0.71) 2.116* (8.83)
IPI 0.003 (0.66) -0.003 (-0.78) IFLA -0.000** (-1.69) -0.000 (-1.59) WAG -0.024 (-0.68) -0.046
* (-3.94) INFI 0.016 (1.47) 0.016
** (1.81) TRDO 0.009 (1.12) 0.004 (1.16) REER 0.001 (0.39) -0.006
* (-2.75) GCFN -0.021 (-1.07) -0.015
** (-1.78) Adj. R2 0.05 0.84
Hausman test
(prob> chi2) 11.23 (0.129)
Notes:
a) Figures in the parenthesis represent t- value
b) * denote Significant at 1 percent level, ** denote Significant at 10 percent level
c) A constant term is included but not reported
6 SUMMARY AND CONCLUSION
In recent days, BRICS- the fast developing economies of the world having larger market potentials
are expected to attract larger inflow of FDI. However, the factors attracting the FDI inflows towards
these countries are relatively less researched. This study made an attempt to identify the factors
determining the FDI inflows of BRICS countries from the period 1975 to 2007. The determinant
factors include: Market size, Economic Stability and Growth Prospects, Cost of Labour, Infrastructure
Facilities, Trade Openness, Currency value and Gross capital formation. The study finds that other than
Economic Stability and Growth prospects (measured by inflation rate and Industrial production
respectively), Trade openness (measured by the ratio of total trade to GDP) all other factors seem to be
the potential determinants of FDI inflows in BRICS countries. The empirical results are robust in
general for alternative variables determining FDI flows.
The empirical analysis has some policy implications towards the improvement of investment
climate to attract higher FDI inflows into BRICS countries that are expected to facilitate their economy
in enhancement of Market potential, Infrastructural development and Capital Formation. Inflation (the
Economic stability variable) and the Industrial production (the Growth Perspective variable) are critical
factors in attracting FDI, which helps to make appropriate policies for improving the performance of
domestic economy. Therefore, it is an important object to maintain the stability of the currency of the
host country to attract increased FDI. The benefit of trade openness in terms of their impact on FDI is
not validated in this study. Thus, BRICS countries as developing nations have to involve themselves in
the path of economic reform and liberalisation activities. As expected, the negatively significance of
wage rate seems to validate the study as the determinant of FDI.
The tag of fast-paced economic growth notwithstanding, Brazil, Russia, India, China and South
Africa (BRICS), will have to tackle the challenge of ensuring and achieving growth without sacrificing
equity, and by utilizing the benefits of innovation to address the issues of inequality of economies. The
challenge is to have an innovation policy that will ensure growth accompanied by equity, for which
they must have necessary institutional mechanisms in place. Thus, BRICS nations should face the
challenges, ranging from gradual deterioration of demographies and questions about environmental
sustainability to potential international trade frictions. The economic growth should be maintained at
least at current levels instead of slow down. The BRICS countries’ short and medium-term outlook
remains favourable in relation to the advanced economies. Investment ratios in Brazil remain very low.
Russia is highly dependent on hydrocarbons and therefore it faces very adverse demographic
developments. India will have to overcome domestic opposition to growth-enhancing and growth-
sustaining economic reforms. South Africa has to make initiation in promoting investment flows.
Overall, the emergence of the BRICS nations have to be seen in the context of the innovation system
that could evolve a proper understanding of the dynamics of innovation in these countries under
globalization which would be of immense policy relevance not only for each of these countries but also
for the BRICS as a group and other less developed countries that are aspiring to catch up. Thus, the
Int. Journal of Business Science and Applied Management / Business-and-Management.org
12
BRICS nations have to figure out that the engine of growth and development including for heavily
indebted countries lies in the execution of major infrastructure projects, investment, and technological
innovations carried out in an environmentally conscious fashion.
The future studies can focus on the variables relating to the regional competency of the nations as
well as equivalent to home countries of the foreign investors. Such variables should include: Relative
Market Share and Relative Growth of the economy, Relative Corporate Rate, Risk Factors and
Corporate Governance. Sectoral analysis also expected to enhance the understanding of industry
specific FDI flows and its associated determinants. Thus, the overall significance of the model
specified in this study would contribute to a greater understanding of the FDI determinants in the
emerging markets, as well as, the findings of this study would also lay emphasis on the importance of
liberalisation and economic policy reforms.
REFERENCES
Agarwal, J.P. (1980) ‘Determinants of foreign direct investment: a survey’, Weltwirtschaftliches
Archiv, No.116, pp. 739-77.
Aguliar and Vallejo, H. (2002) ‘Integration economica y atraccion de inversion extranjera directa: el
caso de America Latina’, Universidad de los Andes – CEDE Working paper.
Arellano, M. and Bond, S. (1991) ‘Some tests of specification for panel data: monte carlo evidence and
an application to employment equations’, Review of Economic Studies, Vol. 58, pp. 277-297.
Asiedu, E. (2002) ‘On the determinants of foreign direct investment developing counties: is Africa
different?,’ World Development, Vol. 30 (1), pp.107-119.
Asterious, D. (2006) ‘Applied econometrics: a modern approach using Eviews and Microfit’, Palgrave
Macmillan, pp: 369- 378.
Baniak, A., Cukrowski, J. and Herczynski, J. (2002) ‘On determinants of foreign direct investment in
transition economies’, CERGE-EI Working paper Series.
Bevan, A.A. and Estrin, S. (2000) ‘Patterns of foreign direct investment and trade in central and eastern
europe’, mimeo.
Bevan, A.A. and Estrin, S. (2004) ‘The determinants of foreign direct investment into European
transition economies’, Journal of Comparative Economics, Vol.32, pp.775-787.
Boros-Torstila, J. (1999) ‘The determinants of foreign direct investment operations of finnish MNCs in
transition economies’, Helsinki: ETLA, The Research Institute of Finnish Economy, A 28 Series.
Carkovic, M.V., and Levine, R. (2002) ‘Does Foreign Direct Investment Accelerate Economic
Growth?’ , University of Minnesota Department of Finance Working Paper.
Chakrabarti, A. (2001) ‘The determinants of foreign direct investment: sensitivity analyses of cross-
country regressions’, KYKLOS, Vol.54 (1), pp. 89-114.
Dasgupta, D. and Ratha. D. (2000) ‘The role of short-term debt in recent crises’, Finance and
Development, Vol. 37, pp. 54-57.
Dunning, J.H. (1973) ‘The determinants of international production’, Oxford Economic Papers, Vol.
25.
Dunning, J.H. (1981) ‘International production and multinational enterprise’, Allen & Unwin,
London.
Dunning, J.H. (1993) ‘Multinational Enterprises and the Global Economy’, Wokingham, England:
Addison- Wesley.
Durán, J.E. (1999) ‘Los determinantes de la ied en los países de américa latina y el caribe: su impacto
sobre el comercio y la integración regional’, ECLAC, Mimeo.
Garibaldi, P., Mora. N., Sahay. R. and Zettelmeyer. J. (2002) ‘What moves capital to transition
economies?’, IMF working paper WP/02/64.
Gastanaga, V., Nugent, J. B. and Pashamova. B. (1998) ‘Host country reforms & FDI inflows: how
much difference do they make?’, Word Development, Vol. 26(7), pp.1299-1314.
Hausman, J. A. (1978) ‘Specification tests in econometrics’, Econometrica, Vol. 46, pp1251- 71.
Narayanamurthy Vijayakumar, Perumal Sridharan and Kode Chandra Sekhara Rao
13
Holland, D. and Pain, N. (1998) ‘The diffusion of innovations in central and eastern europe: a study of
the determinants and impact of foreign direct investment, NIESR Discussion Paper No.137,
National Institute of Social and Economic Research, London.
Ho, C. H. (2004) ‘Determinants of Foreign Direct Investment in China’, 16th
Annual Conference of the
Association for Chinese Economics Studies, Australia (ACESA), Brisbane, QLD, 19- 20 July
2004.
Kumar, N. (1994) ‘Multinational Enterprises and Industrial Organization’, Sage Publications, New
Delhi.
Lankes, H.P. and Venables, A.J. (1996) ‘Foreign Direct Investment in Economic Transition: The
Changing Pattern of Investments’, Economics of Transition, Vol.4, pp.331-347.
Lansbury, M., Pain, N. and Smidkova, K. (1996) ‘Foreign Direct Investment in Central Europe Since
1990: An Econometric Study’, National Institute Economic Review, No.156, pp.104-113.
Levy – Yeyati., UgoPanizza. E. and Stein. E. (2002) ‘The cyclical nature of north South FDI flows’,
IADB Working paper, Inter- American Development Bank.
Libor Krkoska (2001) ‘Foreign direct investment financing of capital formation in Central and Eastern
Europe’, European Bank for Reconstruction and Development Working paper No. 67.
Lipsey, R. E. (2000) ‘Interpreting developed countries' foreign direct investment’, NBER Working
paper No. 7810.
Loree, D.W. and Guisinger, S.E. (1995) ‘Policy and non policy determinants of U.S equity foreign
direct investment’, Journal of International Business Studies, Second Quarter, pp. 281- 299.
Love, J. H. and Lage-Hidalgo.F. (2000) ‘Analyzing the determinants of US direct investment in
Mexico’, Applied Economics, Vol.32, pp.1259-67.
Lucas, R.E. (1993) ‘On the determinants direct foreign investment: evidence from East and South East
Asia’, World Development, Vol. 21(3), pp 391- 406.
Markusen, J. and Maskus. K. (1999) Discriminating among alternative theories of the multinational
enterprises, NBER Working paper 7164.
Meyer, K. (1998) ‘Direct Investment in Economies in Transition’, Edward Elgar
Moosa, I.A. (2002) ‘Foreign Direct Investment: Theory, Evidence and Practice’, London: Palgrave.
Nonnenberg and Mendonça. (2004) ‘The determinants of direct foreign investment in developing
countries’, IPEA Working paper.
Nunes, C.L., Oscategui. J. and Peschiera. J. (2006) ‘Determinants of FDI in Latin America’,
Documento De Trabajo 252.
Resmini, L. (2000) ‘The determinants of foreign direct investment into the CEECs: new evidence from
sectoral patterns’, Economics of Transition, Vol. 8(3), pp. 665- 689.
Rugman, A. (1998) ‘Forty years of Dunning and the theory of multinational enterprise’, Paper
presented at the Academy of International Business Annual Meetings in Vienna, October 1988.
Sahoo, P. (2006) ‘Foreign Direct Investment in South Asia: Policy, Trends, Impact and Determinants’,
ADB Institute Discussion paper No. 56.
Schneider, Friedrich and Frey, B.S. (1985) ‘Economic and Political Determinants of Foreign Direct
Investment’, World Development, Vol 13(2), 161-175.
Singh, H. and Jun, K.W. (1995) ‘Some new evidence on determinants of foreign direct investment in
developing countries’, Policy Research Working paper No.1531, The World Bank.
Wang, Z.Q. and Swain, N.J. (1995) ‘The determinants of foreign direct investment in transforming
economies: evidence from Hungary and China’, Weltwirtschaftsliches Archiv, Vol. 131, pp. 359-
382.
Wheeler, D. and Mody, A. (1992) ‘International investment location decisions: the case of US firms’,
Journal of International Economics, Vol.33, pp.57-76.
Wilson, D. and Purushothaman, R. (2003) ‘DreamingWith BRICs: The Path to 2050’, Global
Economics Paper No: 99, http://www2.goldmansachs.com/ideas/brics/book/99-dreaming.pdf
Woodward, D., Rolfe, R.J., Guimarães, P. and Doupnik, T. (1997) ‘Taxation and the location of
foreign direct investment in central Europe’, University of Southern Carolina Working paper.