sticky cost behavior: evidence from brics+t countries
TRANSCRIPT

EGE AKADEMİK BAKIŞ / EGE ACADEMIC REVIEW
Cilt 21 • Sayı 2 • Nisan 2021 SS. 125/137
Doi:10.21121/eab.907413Başvuru Tarihi: 12.08.2020 • Kabul Tarihi: 09.03.2021
125
Sticky Cost Behavior: Evidence from BRICS+T Countries
1 Res. Assist., Karadeniz Technical University, Faculty of Economics and Administration Sciences, Department of Business Administration, [email protected]
2 Dr., Corresponding Author, Hitit University, Faculty of Economics and Administration Sciences, Department of Business Administration, [email protected]
3 Res. Assist., Karadeniz Technical University, Faculty of Economics and Administration Sciences, Department of Business Administration, [email protected]
Oğuz Yusuf ATASEL1 İD , Yasin ŞEKER2 İD , Fatih YILDIRIM3 İD
ABSTRACTThe aim of this study is to determine the sticky cost behavior of publicly-traded companies in Brazil, Russia, India, China, South Africa and Turkey (BRICS+T) that are classified as developing economies during the period 2010-2019. In addition to the purpose, the firm characteristics that play a role in the sticky cost behavior of firms and the effect of the Gross Domestic Product (GDP), which is a macroeconomic indicator, has been investigated. The study revealed that the firms in BRICS+T exhibit a sticky cost behavior. Furthermore, it also suggested that inventory intensity, which is one of the firm characteristics, does not affect cost stickiness and that asset, employee and property, plant and equipment intensity raise the level of cost stickiness while debt intensity declines the level of cost stickiness. Last but not least, it was found out that GDP, which is a macroeconomic indicator, raises the sticky cost level when it tends to rise.
Keywords: Cost stickiness, Asymmetric cost behavior, Sticky cost behavior, Firm characteristics, BRICS+T firms
JEL classification: M41
1. IntroductionCost, which is crucial for firms, is the monetary
sum of sacrifices made for goods or services required to run operations. An accurate cost estimation and analysis is of importance for firms as it sheds light on managerial actions. Understanding cost behaviors is a significant factor for cost management. Costs are considered to be either fixed or variable according to the traditional cost behavior. In addition, variable costs in any traditional cost model are managed by the volume of activity. However, some costs rise as a result of increasing volume of activity while they decrease less in line with equal declines in volume of activity (Anderson et al. 2003: 47-48; Bugeja et al. 2015: 248). In other words, the reaction of costs to the ever-changing volume of activity may vary by times when the activity volume increases and decreases (Cooper and Kaplan, 1998a: 147). In this case, an increase in cost stands for a function of the volume of activity while a decrease in cost stands for a function of managerial actions. In
this sense, cost behaviors at times of decreased volume of activity can display a “sticky” correlation with past volume of activity depending on managerial actions (Öztürk and Zeren, 2016: 32). In literature, this is known as cost stickiness, and it was put forward by Anderson et al. (2003).
If the size of an increase in costs associated with an increase in volume of activity is larger than the size of an equivalent decrease, this leads to cost stickiness namely asymmetric cost behavior (Anderson et al. 2003: 47-48; Bugeja et al. 2015: 248). The cost estimation methods based on linear cost hypothesis could not be adopted for cost analysis, planning, control and pricing while they do not yield accurate results from many traditional techniques such as cost volume profit analysis, moving budget and cost-plus pricing. Therefore, managers have to take sticky (asymmetrical) behavior into account when they classify costs to make the right decisions and maintain their firm’s competitive edge in the market (Ibrahim and Ezat, 2017: 17).

Oğuz Yusuf ATASEL, Yasin ŞEKER, Fatih YILDIRIM
126
The purpose of this study is to determine the cost stickiness (asymmetric cost behavior) in publicly-traded companies in BRICS+T that are classified as developing economies. In line with this purposes, the presence of cost stickiness was tested in various aspects based on various models on reaction to firm characteristics and the aspect of time and a macroeconomic indicator that all play a role in cost stickiness. The study is expected to offer a multilateral input to the literature about cost stickiness in the aforementioned aspects.
2. Literature Review and Hypotheses DevelopmentUnderstanding the correlation between sales
and costs is of capital importance for firms, and it is, therefore, imperative to ascertain the cost behavior in essence. Cost behavior is one of the main themes of cost and management accounting. Dividing costs into fixed and variable ones based on sales volume, the traditional view of cost behavior presumes that variable costs are consistent with changes in volume of activity (Noreen, 1991: 163). Variable costs can also have to do with the trend of changes in costs as well as the size of a change in activity (Anderson et al., 2003: 48). However, it is argued that some costs tend to increase much more when the activity volume increases compared to a decrease in them (Cooper and Kaplan, 1998a: 247; Anderson et al., 2003: 48). Cost behavior signifies the relationship between costs and activities. Cost sticki-ness is the asymmetrical relationship between sales and costs borne by businesses (Balakrishnan et al., 2004: 283). As noted before, the concept of cost stickiness was put forward by Anderson et al. (2003). The related concept is based on the assumption that costs are not symmetrically correlated with sales volume (Anderson et al., 2003: 47). Therefore, Anderson et al. (2003) descri-bes the asymmetric cost behavior as “sticky” (Karadeniz et al., 2019: 172).
In literature, studies over cost stickiness are divided into three main groups. The first group covers studies (Anderson et al., 2003; Subramaniam and Weidenmier, 2003; Porporato and Werbin; 2012; Abu-Serdaneh, 2014; Banker and Byzalov, 2014; Dalla Via and Perego, 2014; Ibrahim, 2015) over evidence of asymmetric cost behavior, determination of the time dimension and analysis of firm characteristics that affect cost stickiness with the second group covering studies (Dierynck et al., 2012; Kama and Weiss, 2013; Koo et al., 2015) over correlations among managerial incentives, earnings management and asymmetrical costs and the third
group covering studies (Calleja et al., 2006; Chen et al. 2012; Pichetkun, 2012; Banker et al., 2013; Xue and Hong, 2016) over correlations between corporate governance and asymmetrical cost behavior (Ibrahim, 2018: 304-306). Apart from the three aforementio-ned groups, the literature review offers studies that investigate the correlation with the performance of mergers and acquisitions while testing cost stickiness (Alexandridis et al. 2012; Betzer et al., 2015; Jang et al., 2017; Uğurlu et al., 2019). Gathered under three main groups by themes, the literature on cost stickiness is briefly presented as follows:
The first study out of the first group was conducted by Anderson et al. (2003) (henceforth, ABJ) to provide an evidence for asymmetric cost behavior. The study investigated the cost stickiness for the US firms based on Selling, General, and Administrative (SG&A). The analytical results revealed that 1% increase in sales ra-ises SG&A by 0.55% while 1% decrease in sales reduces SG&A by 0.35%. Based on the results, the cost tends to be sticky when an increase coupled with an increase in volume is larger than a decrease in costs coupled with a decrease in volume. This behavior is called cost stickiness.
Calleja et al. (2006) tried to identify cost stickiness based on the operating cost in firms based in US, UK, Germany and France. It was reported that 1% increase in sales raises the operating cost by 0.97% while 1% decrease in sales reduces the operating cost by 0.91%. Therefore, the firms analyzed exhibited a sticky cost behavior. The study also reported that the level of cost stickiness in French and German firms is higher than the level of cost stickiness in UK and US firms, and that this is likely to stem from corporate governance systems and managerial mentality.
Cook et al. (2019) noted their study on the study of Anderson et al. (2003) and used current operating lease expenses to measure the cost stickiness, and of Novy-Marx’s (2011) study for fixedness (operating leverage measure), and of Gu et al.’s (2017) study for inflexibility and investigated its correlation with stock return. In addition, this study directly addressed cost stickiness in the context of operating lease to determi-ne the correlation with stock return. They took the asset volatility into account as a determinant of operating lease expenses. As a result, they reported that R&D, staff, and advertising expenses are not sticky as they are flexible expenses whereas pension and rental expenses are highly similar to SG&A costs, and they are sticky costs or non-flexible expenses.

Sticky Cost Behavior: Evidence from BRICS+T Countries
127
While there is no consensus in literature over the classification of costs as a part of cost stickiness, and empirical tests performed, the main study over cost stickiness is the one by Anderson, Banker and Janakiraman (2003), and it is known as ABJ method as noted earlier (Dalla Via and Perego, 2014; 758). To exp-lain cost behavior, Cooper and Kaplan (1998a,b) made estimations based on many managerial perspectives and focused on a variety of costs from a managerial standpoint. Anderson et al. (2003) focused on agency cost in consideration of SG&A cost (Cook et al., 2019: 3). The sticky cost behavior tested for H1 hypothesis was also based on ABJ method, and many studies in literature adopt the method (Banker and Chen, 2006; Calleja et al., 2006; Anderson and Lanen, 2009; Banker et al., 2011). The following hypotheses are proposed to determine the sticky behavior of costs within the scope of the studies in the literature:
H1: Cost is sticky for BRICS+T.
This hypothesis is divided into four sub-hypotheses:
H1a: SG&A costs are sticky for BRICS+T.
H1b: COGS is sticky for BRICS+T.
H1c: OC is sticky for BRICS+T.
H1d: LC is sticky for BRICS+T.
As H1 hypothesis developed to identify cost sticki-ness is tested, the aspect of “time” is taken into account in literature. Therefore, H2-1 and H2-2 hypotheses were developed to test the cost stickiness’s aspect of time. The hypotheses are as follows:
H2-1: Cost stickiness reverses in subsequent periods.
This hypothesis is divided into four sub-hypotheses:
H2-1a: SG&A stickiness reverses in subsequent periods.
H2-1b: COGS stickiness reverses in subsequent periods.
H2-1c: OC stickiness reverses in subsequent periods.
H2-1d: LC stickiness reverses in subsequent periods.
H2-2: Cost stickiness declines with the aggregation of periods.
This hypothesis is divided into four sub-hypotheses:
H2-2a: Cost stickiness of SG&A declines with the agg-regation of periods.
H2-2b: Stickiness of COGS costs declines with the aggregation of periods.
H2-2c: OC stickiness declines with the aggregation of periods.
H2-2d: LC stickiness declines with the aggregation of periods.
It is of importance to identify firm characteristics that affect the level of cost stickiness, which is the final part of the first-group studies. These factors are Asset Intensity (Anderson et al., 2003; Calleja et al., 2006; Chen et al., 2012; Abu- Serdaneh, 2014; Banker and Byzalov, 2014; Bradbury and Scott, 2014), Property, Plant and Equipment Intensity (Bugeja et al., 2015; Magheed, 2016; Subramaniam and Watson, 2016), Debt Intensity (Calleja et al., 2006; Abu-Serdaneh, 2014; Banker and Byzalov, 2014; Bradbury and Scott, 2014; Magheed, 2016; Subramaniam and Watson, 2016), Employee Intensity / Labor Wage Intensity (Anderson et al. 2003; Dalla Via and Perego, 2014; Submariniam and Weiden-mier, 2003) and Inventory Intensity (Submariniam and Weidenmier, 2003). The aforementioned factors except for debt intensity are expected to raise the level of cost stickiness. The hypotheses on cost stickiness and firm characteristics are as follows:
H3: The more asset intensity is, the higher the level of cost stickiness is.
H4: The more property, plant and equipment intensity is, the higher the level of cost stickiness is.
H5: The more inventory intensity is, the higher the level of cost stickiness is.
H6: The more employee intensity is, the higher the level of cost stickiness is.
H7: The more debt intensity is, the lower the level of cost stickiness is.
In addition to the correlation between firm chara-cteristics and sticky cost behavior, there are studies in literature conducted to test the relationship between economic growth, which is one of the macroeconomic indicators, and sticky cost behavior (Anderson et al., 2003; Abu-Serdaneh, 2014; Banker and Byzalov, 2014; Kim and Wang, 2014; Bu et al., 2015; Lee and Chiang, 2018; Yang, 2019). Cost stickiness is expected to rise at times of economic growth (Anderson et al., 2003; Banker and Byzalov, 2014; Kim and Wang, 2014; Bu et al., 2015: 10). The aforementioned studies took GDP into account as an indicator of economic growth, and H8 hypothesis are proposed to test the relationship between economic growth and cost stickiness as it is expected to rise at times of GDP growth.
H8: The more the GDP is, the higher the level of cost stickiness is.
The second group of studies focused on the cau-ses of asymmetric cost behavior. As for the causes of asymmetric cost behavior, managers make a choice between two behaviors as a measure against uncer-

Oğuz Yusuf ATASEL, Yasin ŞEKER, Fatih YILDIRIM
128
tainty in sales. Stickiness of costs occurs if managers decide to retain unutilized resources rather than incur adjustment costs when volume of activity declines. In addition, the fact that managers think the decline in sales is temporary leads to an asymmetric cost behavior (Anderson et al., 2003). Chen et al. (2012) associate the cause of asymmetric cost behavior with the response of managers. They argue that incentives push managers go for growth beyond optimal levels. As sales increase, managers rapidly increase SG&A cost, and decrease it extremely slowly when sales are in decline. This leads to an asymmetric cost behavior. The managerial incentives of asymmetric cost behavior could not be investigated as a part of this study as there was no access to sufficient amount of data about firms in BRICS+T.
The third group covers studies over the relationship between corporate governance and asymmetric cost behavior (Calleja et al., 2006; Chen et al. 2012; Pichet-kun, 2012; Banker et al., 2013; Xue and Hong, 2016). An effective corporate governance system would make a positive impact on managerial decisions and a robust corporate governance system would approximate the levels of cost stickiness to the optimum level of cost (Chen et. al., 2012). Ibrahim (2018) investigated the potential effect of corporate governance actions on asymmetric cost behavior (cost stickiness) in 80 Egyptian firms from 2008 to 2013. Their study reported that the cost of sales exhibits an asymmetrical behavior and that 1% increase in sales raises the cost of sales by 1.05% while 1% decrease in sales reduces the cost of sales by 0.87%. In the context of corporate governance, larger boards, role duality and more independent board members raise the level of sticky cost behavior while higher corporate ownership and economic growth reduce the level of sticky cost behavior. Cost stickiness could not be analyzed in this study, as there was no access to sufficient amount of data about corporate governance of firms in BRICS + T.
This study took into account not only the change of SG&A Cost but also the Cost of Goods Sales (COGS), Total Operating Cost (TOC) and Labor Cost (LC) to test cost stickiness as a part of the analyses. As a part of the study, developing economies (BRICS+T) were selected as a sample based on the aforementioned arguments. In addition to the studies carried out with focus on the subject of this study such as studies by Erdoğan et al. (2019) on the case of Turkey, Hacıhasanoğlu and Dalkılıç (2018) the case of Turkey, Ibrahim (2018) the case of Egypt, Zonatto et al. (2018) the case of India and a limited number of samples with 260 firms
based in BRICS, Öztürk and Zeren (2016) on the case of Turkey, Çelik and Kök (2013) on the case of Turkey, Yükçü and Özkaya (2011) on the case of Turkey, the sticky cost behavior was tested by a large number of observations for multiple countries. In addition, the study addressed cost stickiness as a whole unlike the literature, and investigated whether multiple costs exhibit an asymmetrical behavior or not, and what firm characteristics affect cost stickiness. The study is expected to offer an input for the literature from the aforementioned perspectives.
3. Methodology, Sample and DataThis study investigated the sticky cost behavior of
firms in BRICS+T from 2010 to 2019 based on various models. All the data obtained from Refinitiv’s Thomson Reuters Datastream (in May 2020). The reason why the panel data set starts from 2010 is the intention to select a period of time following the global financial crisis that lasted from 2007 to 2009 and eliminate the potential effects of the financial crisis for analytical purposes. In addition, the financial data of all countries were based on dollar, the currency of the United States of America. Table 1 shows the number of total observations by countries. However, the observations with missing data and observations that failed to meet the requirements of the relevant model excluded from the analysis. The-refore, the number of observations varies by analysis, and thus it is presented for each model under the regression tables to have a better idea about the case.
Table 1: Countries and Total Number of Observations
Country Freq. Percent
Brazil 2,610 3.59
China 29,170 40.17
India 32,810 45.19
Russia 3,880 5.34
South Africa 1,680 2.31
Turkey 2,460 3.39
Total 72,610 100.00
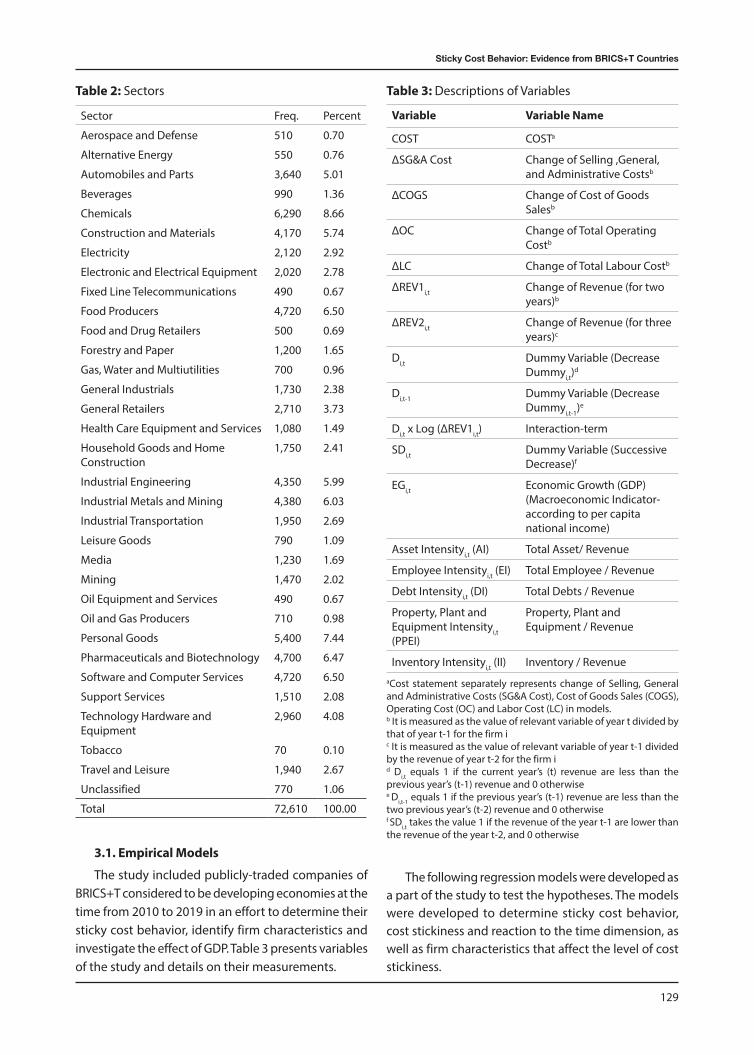
Table 2 reports the industries of firms included in the study and total number of observations in industries. The study includes thirty-three industries. The industrial classification was made based on the first two digits of the four-digit industrial code that represent the main industry for each firm.
Sticky Cost Behavior: Evidence from BRICS+T Countries
129
Table 2: Sectors
Sector Freq. Percent
Aerospace and Defense 510 0.70
Alternative Energy 550 0.76
Automobiles and Parts 3,640 5.01
Beverages 990 1.36
Chemicals 6,290 8.66
Construction and Materials 4,170 5.74
Electricity 2,120 2.92
Electronic and Electrical Equipment 2,020 2.78
Fixed Line Telecommunications 490 0.67
Food Producers 4,720 6.50
Food and Drug Retailers 500 0.69
Forestry and Paper 1,200 1.65
Gas, Water and Multiutilities 700 0.96
General Industrials 1,730 2.38
General Retailers 2,710 3.73
Health Care Equipment and Services 1,080 1.49
Household Goods and Home Construction
1,750 2.41
Industrial Engineering 4,350 5.99
Industrial Metals and Mining 4,380 6.03
Industrial Transportation 1,950 2.69
Leisure Goods 790 1.09
Media 1,230 1.69
Mining 1,470 2.02
Oil Equipment and Services 490 0.67
Oil and Gas Producers 710 0.98
Personal Goods 5,400 7.44
Pharmaceuticals and Biotechnology 4,700 6.47
Software and Computer Services 4,720 6.50
Support Services 1,510 2.08
Technology Hardware and Equipment
2,960 4.08
Tobacco 70 0.10
Travel and Leisure 1,940 2.67
Unclassified 770 1.06
Total 72,610 100.00
3.1. Empirical Models
The study included publicly-traded companies of BRICS+T considered to be developing economies at the time from 2010 to 2019 in an effort to determine their sticky cost behavior, identify firm characteristics and investigate the effect of GDP. Table 3 presents variables of the study and details on their measurements.
Table 3: Descriptions of Variables
Variable Variable Name
COST COSTa
ΔSG&A Cost Change of Selling ,General, and Administrative Costsb
ΔCOGS Change of Cost of Goods Salesb
ΔOC Change of Total Operating Costb
ΔLC Change of Total Labour Costb
ΔREV1i,t Change of Revenue (for two years)b
ΔREV2i,t Change of Revenue (for three years)c
Di,t Dummy Variable (Decrease Dummyi,t)
d
Di,t-1 Dummy Variable (Decrease Dummyi,t-1)e
Di,t x Log (ΔREV1i,t) Interaction-term
SDi,t Dummy Variable (Successive Decrease)f
EGi,t Economic Growth (GDP) (Macroeconomic Indicator- according to per capita national income)
Asset Intensityi,t (AI) Total Asset/ Revenue
Employee Intensityi,t (EI) Total Employee / Revenue
Debt Intensityi,t (DI) Total Debts / Revenue
Property, Plant and Equipment Intensityi,t (PPEI)
Property, Plant and Equipment / Revenue
Inventory Intensityi,t (II) Inventory / RevenueaCost statement separately represents change of Selling, General and Administrative Costs (SG&A Cost), Cost of Goods Sales (COGS), Operating Cost (OC) and Labor Cost (LC) in models.b It is measured as the value of relevant variable of year t divided by that of year t-1 for the firm ic It is measured as the value of relevant variable of year t-1 divided by the revenue of year t-2 for the firm id Di,t equals 1 if the current year’s (t) revenue are less than the previous year’s (t-1) revenue and 0 otherwisee Di,t-1 equals 1 if the previous year’s (t-1) revenue are less than the two previous year’s (t-2) revenue and 0 otherwisef SDi,t takes the value 1 if the revenue of the year t-1 are lower than the revenue of the year t-2, and 0 otherwise
The following regression models were developed as a part of the study to test the hypotheses. The models were developed to determine sticky cost behavior, cost stickiness and reaction to the time dimension, as well as firm characteristics that affect the level of cost stickiness.
Oğuz Yusuf ATASEL, Yasin ŞEKER, Fatih YILDIRIM
130
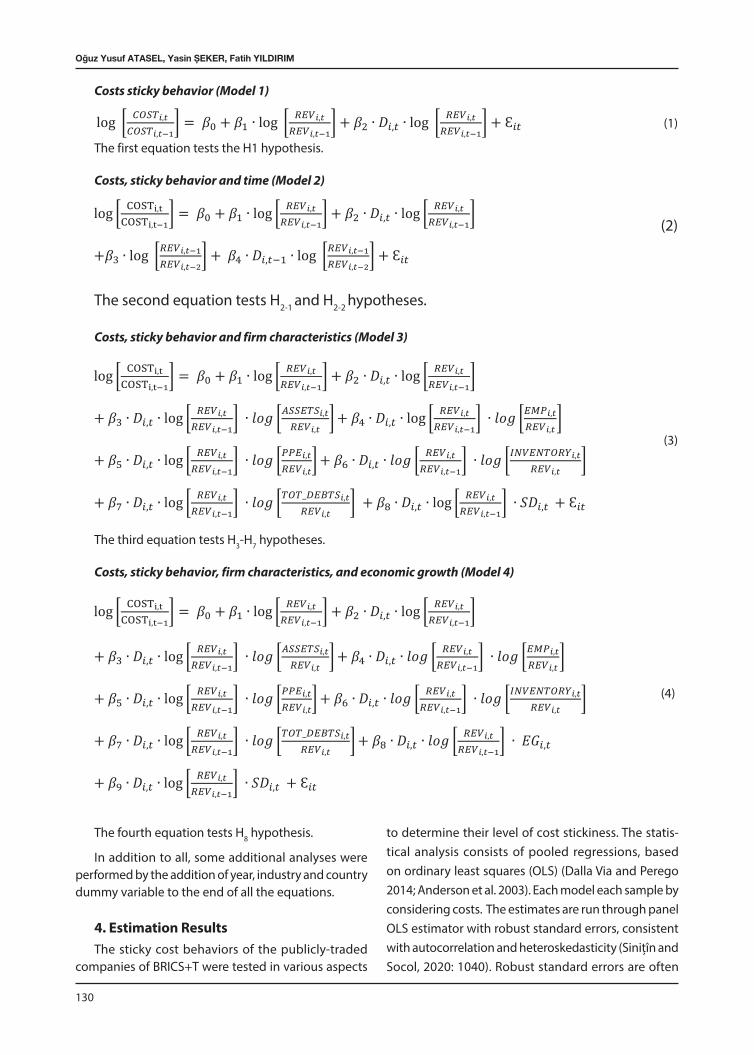
Costs sticky behavior (Model 1)
(1)
The first equation tests the H1 hypothesis.
Costs, sticky behavior and time (Model 2)
(2)
The second equation tests H2-1 and H2-2 hypotheses.
Costs, sticky behavior and firm characteristics (Model 3)
(3)
The third equation tests H3-H7 hypotheses.
Costs, sticky behavior, firm characteristics, and economic growth (Model 4)
(4)
The fourth equation tests H8 hypothesis.
In addition to all, some additional analyses were performed by the addition of year, industry and country dummy variable to the end of all the equations.
4. Estimation ResultsThe sticky cost behaviors of the publicly-traded
companies of BRICS+T were tested in various aspects
to determine their level of cost stickiness. The statis-tical analysis consists of pooled regressions, based on ordinary least squares (OLS) (Dalla Via and Perego 2014; Anderson et al. 2003). Each model each sample by considering costs. The estimates are run through panel OLS estimator with robust standard errors, consistent with autocorrelation and heteroskedasticity (Sinițîn and Socol, 2020: 1040). Robust standard errors are often

Sticky Cost Behavior: Evidence from BRICS+T Countries
131
reported when the sample size is large. These standard errors are asymptotically valid in the presence of any kind of heteroskedasticity, including homoscedasti-city (Wooldridge, 2002:57). When there is correlation between the independent variables, the results may be deviated. This problem, which is described as multicol-linearity, can be measured with the variance inflation factors (VIF). When the VIF criteria is below 10, there seems to be no problem of multicollinearity among the variables (Orhunbilge, 2002: 242). It is checked the presence of multicollinearity and found that VIF criteria was below 10 for all models. This indicates that there is no collinearity problem between the independent variables.
Table 4 reveals no difference between taking the variables of year, industry and country dummy variables into account and not considering them in general. In consideration of the dummy variables, it was initially estimated the Model (1) with changes in SG&A costs, Cost of Goods Sales, Total Operating Cost, Labor Cost and Revenue defined for one-year periods. The estimated value of β1 reveals that SG&A costs increase, on average, by 0.485 per cent for 1 per cent increase in sales revenue, the cost of goods sold increases by 1.023 per cent, which is more than the increase in revenues, the operating costs by 0.673 per cent and the labor cost by 0.479 per cent. The estimated value of β2 is all negative. The combined value of β1 +
β2 =0.3135 indicates that SG&A costs decreased only 0.31% per 1% decrease in revenue. On the other hand, the combined value of β1 + β2 revels that the cost of goods sales decrease, on average, by 0.952 per cent for 1 per cent decrease in revenue, the operating costs by 0.544 per cent and the labor cost by 0.3027 per cent. This results provides strong support for the sticky costs hypothesis. This result reveals that H1 hypothesis is accepted in accordance with the literature. Whether the dummy variable is taken into account or not, it would be pertinent to argue that sticky cost behavior is exhibited for all types of cost.
The aforementioned results of SG&A Cost are con-sistent with the results of the study, one of the leading ones over cost stickiness in literature, by Anderson et al. (2003) known as ABJ method. 1% increase in sales corresponded to 1.02% increase in cost of goods sales. This is consistent with the results of the studies in literature (Subramaniam and Weidenmier, 2003; Dalla Via and Perego, 2014). On the other hand, 1% decrease in sales resulted in 0.95% decline in COGS, and this is consistent with the results of the studies in literature (Subramaniam and Weidenmier, 2003). The results of operating cost show consistency with the results of the studies in literature (Calleja et al., 2006; Bugeja et al., 2015; Hartlieb and Loy, 2017; Bradbury and Scott, 2018). Finally, the same applies to labor cost, too (Dalla Via and Perego, 2014).
Table 4: Estimated Results of Regression Model on the Determination of Costs Sticky Behavior
(1) (2) (3) (4) (5) (6) (7) (8)
SG&A_Cost COGS OC LC SG&A_Cost COGS OC LC
0.5074*** 1.02601*** 0.68259*** 0.50552*** 0.48525*** 1.02261*** 0.67264*** 0.47934***
(0.00753) (0.00429) (0.00355) (0.00654) (0.00757) (0.00434) (0.00355) (0.0065)
-0.1645*** -0.07155*** -0.12524*** -0.17959*** -0.17174*** -0.07057*** -0.12827*** -0.17665***
(0.01314) (0.0067) (0.00547) (0.01024) (0.01317) (0.00674) (0.00547) (0.01014)
cons 0.05511*** -0.01014*** 0.01112*** 0.06613*** 0.04483 0.01257 0.03007** 0.08935***
(0.00292) (0.00155) (0.00128) (0.00237) (0.0283) (0.01682) (0.01457) (0.03033)
Observations 32835 45178 40757 38799 32835 45178 40757 38799
R-squared 0.17014 0.72932 0.63701 0.1982 0.18571 0.73046 0.64376 0.22788
Year Dummy NO NO NO NO YES YES YES YES
Industry Dummy
NO NO NO NO YES YES YES YES
Country Dummy
NO NO NO NO YES YES YES YES
Notes:Standard errors are in parentheses*** p<0.01, ** p<0.05, * p<0.1

Oğuz Yusuf ATASEL, Yasin ŞEKER, Fatih YILDIRIM
132
The results of the regression models developed to test H2-1 and H2-2 hypotheses on cost stickiness and time are presented in Table 5.
In Table 5, to test the hypotheses that stickiness re-versed in subsequent periods, we expanded the Model 1by including the terms of one-period lag changes in sales revenue. As can be seen from Table 5 there is not any difference between taking the variables of year, industry and country dummy variables into account and not taking them into account in general. SG&A Cost reveals that the significant and positive coefficient β1 of 0.4939 is similar to its counterpart in the Model (1) estimation (Table 4), as is the significant and negative coefficient β2 of −0.1920, supporting the sticky costs hypothesis. The significant and positive coefficient β3 of 0.0745 indicates a lagged adjustment to SG&A for changes in revenue. Lastly, the estimated coefficient β4 of 0.0455 is also significant and positive, indicating a partial reversal of stickiness in the period after a revenue decline (β4 <|β2|). When the coefficients for LC
are checked in table 5, it is seen that similar results are obtained with SG&A cost. In this case, the comments for SG&A cost are the same for LC in all situation and for OC only without dummy variables. However, it is not possible to comment on the results obtained for COGS in all situation and OC with dummy variables. Since the general rule (as β1 is >0 as a rule of thumb and β2 is <0 and β4 is <|β2|) is not verified, the H2-1 and H2-2
hypotheses are not supported for COGS in all situation and OC with dummy variables. As late as these results support the hypothesis (H2-1) that managers delay decisions to make reductions to committed resources. H2-1 and H2-2 hypotheses are confirmed by the empirical findings for SG&A Cost and LC. It would be pertinent to note that the results are consistent with the results of the studies by Anderson et al. (2003).
The results of the regression models built to test H3-H7 hypotheses developed to identify the relationship between cost stickiness and firm characteristics are presented in Table 6.
Table 5: Estimated Results of Regression Model on the Costs, Sticky Behavior and Time
(1) (2) (3) (4) (5) (6) (7) (8)
SG&A_Cost COGS OC LC SG&A_Cost COGS OC LC
0.51436*** 1.03565*** 0.7176*** 0.51213*** 0.49387*** 1.03176*** 0.70653*** 0.48078***
(0.00863) (0.00491) (0.00393) (0.00736) (0.00867) (0.00496) (0.00395) (0.0073)
-0.18881*** -0.08293*** -0.1732*** -0.20174*** -0.19197*** -0.08028*** -0.17246*** -0.18949***
(0.01438) (0.00732) (0.00584) (0.01105) (0.01441) (0.00736) (0.00584) (0.01091)
0.08573*** 0.00601 0.04817*** 0.07662*** 0.0745*** 0.00222 0.04429*** 0.06836***
(0.0077) (0.00422) (0.00337) (0.00625) (0.00774) (0.00426) (0.00338) (0.00619)
0.04887*** 0.04606*** 0.01023* 0.05974*** 0.04551*** 0.04701*** 0.00695 0.05509***
(0.01387) (0.00702) (0.00541) (0.01033) (0.01386) (0.00703) (0.00539) (0.01017)
cons 0.03886*** -0.01057*** 0.00107 0.05512*** -0.05981* 0.02073 -0.03687** -0.08172**
(0.00341) (0.00178) (0.00141) (0.00265) (0.03068) (0.01804) (0.01491) (0.03176)
Observations 28296 39064 36546 34461 28296 39064 36546 34461
R-squared 0.16899 0.72515 0.64487 0.20065 0.18242 0.72637 0.65061 0.23237
Year Dummy NO NO NO NO YES YES YES YES
Industry Dummy NO NO NO NO YES YES YES YES
Country Dummy NO NO NO NO YES YES YES YES
Notes: Standard errors are in parentheses*** p<0.01, ** p<0.05, * p<0.1

Sticky Cost Behavior: Evidence from BRICS+T Countries
133
Table 6: Estimated Results of Regression Model on Correlation Between Costs, Sticky Behavior and Firm Characteristics
(1) (2) (3) (4) (5) (6) (7) (8)
SG&A_Cost COGS OC LC SG&A_Cost COGS OC LC
0.56278*** 1.0109*** 0.84549*** 0.60238*** 0.54405*** 1.00954*** 0.83655*** 0.55659***
(0.0113) (0.00497) (0.00435) (0.0101) (0.01131) (0.00503) (0.0044) (0.00988)
-0.4764*** -0.09251*** -0.08246*** -0.2444*** -0.52556*** -0.09516*** -0.09144*** -0.26703***
(0.03804) (0.01622) (0.0135) (0.03219) (0.03812) (0.01635) (0.01355) (0.03129)
0.05278*** 0.00086 -0.01707*** 0.016*** 0.05243*** 0.00071 -0.01677*** 0.01619***
(0.00387) (0.00168) (0.00137) (0.00365) (0.00384) (0.00168) (0.00137) (0.00352)
0.00735 0.02215*** 0.0083*** -0.02345*** 0.01172** 0.02286*** 0.00918*** -0.01879***
(0.00546) (0.00265) (0.00196) (0.00463) (0.00543) (0.00265) (0.00195) (0.00447)
-0.01103*** 0.00104 0.03043*** 0.00488 -0.01174*** 0.00093 0.03024*** 0.00365
(0.00391) (0.00175) (0.00142) (0.00341) (0.00387) (0.00175) (0.00141) (0.00329)
0.02133*** 0.00625*** 0.02179*** 0.01403*** 0.02134*** 0.0063*** 0.02181*** 0.01388***
(0.00391) (0.00179) (0.00142) (0.00339) (0.00388) (0.00179) (0.00141) (0.00326)
0.01135*** -0.00023 0.00493*** 0.0093*** 0.01141*** -0.00032 0.00494*** 0.00939***
(0.00345) (0.00153) (0.00124) (0.0029) (0.00342) (0.00153) (0.00123) (0.0028)
-0.27946*** -0.00117 0.12075*** -0.09402*** -0.28801*** -0.00003 0.11552*** -0.10688***
(0.02807) (0.01244) (0.01006) (0.02499) (0.02792) (0.01247) (0.01004) (0.02415)
cons 0.05236*** 0.00014 0.01249*** 0.07751*** -0.10749*** 0.02129 -0.00702 -0.06794*
(0.00408) (0.0017) (0.00144) (0.00339) (0.04165) (0.01816) (0.01561) (0.03665)
Observations 15032 17885 16475 16399 15032 17885 16475 16399
R-squared 0.18769 0.8068 0.7904 0.22759 0.20704 0.80826 0.794 0.28747
Year Dummy NO NO NO NO YES YES YES YES
Industry Dummy NO NO NO NO YES YES YES YES
Country Dummy NO NO NO NO YES YES YES YES
Notes: Standard errors are in parentheses*** p<0.01, ** p<0.05, * p<0.1
Table 6 indicates that there is not any difference between taking the variables of year, industry and country dummy variables into account and not taking them into account in general. In consideration of the dummy variables, when there is cost stickiness for SG&A cost, the firm characteristics raise the level of PPEI (β5) cost stickiness and reduces the level of cost stickiness of AI (β3), EI (β4), and, II (β6) on the contrary. DI (β7) decline the level of cost stickiness for SG&A cost. The results on COGS suggest that only EI (β4) and II (β6) variables raise the level of cost stickiness while other variables of firm characteristics cannot be commented as their coefficient are insignificant. From the perspective of OC, it can argue that AI (β3) variable raises the level of cost stickiness on its own while other firm characteris-
tics reduce the level of cost stickiness. While PPEI (β5) variable’s coefficient is insignificant and thus cannot commented from the perspective of LC variable, it can argue that EI (β4) variable raises the level of sticky cost behavior, and other firm characteristics reduce the level of sticky cost behavior. When the results that exclude the dummy variables are compared to the results that include the dummy variables, only EI (β4) variable’s coefficient turned out to be insignificant from the perspective of SG&A Cost while comments about other factors were similar. From the perspective of COGS, OC and LC, the results and interpretations are consistent with the results that include the dummy variables. Based on the results that include the dummy variables for the four dependent variables of H3-7 hypotheses,

Oğuz Yusuf ATASEL, Yasin ŞEKER, Fatih YILDIRIM
134
• SG&A Cost in support of hypotheses H4 and H7,
• No hypothesis supported for COGS,
• OC in support of hypotheses H4 and H7,
• LC in support of hypotheses H6 and H7.
The results of the regression models built to test H8 hypothesis developed upon the addition of the econo-mic growth factor to variables of sticky cost behavior and firm characteristics are presented in Table 7.
Table 7 shows that the results of Model 4. Model 4 is created by adding the economic growth factor as a macroeconomic indicator to Model 3. Therefore, it would be pertinent to test H3-7 hypotheses again while testing H8 hypothesis. Based on the inclusion of year, industry and country dummy variables, there is a sticky cost behavior for SG&A Cost. PPEI (β5) variable’s coefficient is insignificant as it was minus whereas other firm characteristics (AI [β3], EI [β4], II [β6], DI [β7]) reduced the level of cost stickiness, and the economic growth
Table 7: Estimated Results of Regression on Economic Growth in Addition to Sticky Cost Behavior and Firm Characteristics
(1) (2) (3) (4) (5) (6) (7) (8)
SG&A_Cost COGS OC LC SG&A_Cost COGS OC LC
0.56019*** 1.01356*** 0.84477*** 0.59497*** 0.5438*** 1.01007*** 0.8364*** 0.55221***
(0.01152) (0.00496) (0.00446) (0.01041) (0.01153) (0.00502) (0.00451) (0.01018)
-0.54949*** -0.11217*** -0.07138*** -0.25909*** -0.59842*** -0.11336*** -0.08253*** -0.29609***
(0.0404) (0.01709) (0.0144) (0.03461) (0.04053) (0.01723) (0.01446) (0.03364)
0.05036*** -0.00333** -0.0176*** 0.01699*** 0.04964*** -0.00345** -0.0174*** 0.01681***
(0.00395) (0.0017) (0.00141) (0.00376) (0.00392) (0.0017) (0.00141) (0.00363)
0.01864*** 0.03327*** 0.00751*** -0.02054*** 0.02437*** 0.03393*** 0.00892*** -0.01227**
(0.00605) (0.00301) (0.00217) (0.00517) (0.00603) (0.00302) (0.00216) (0.005)
-0.00344 -0.00923*** 0.0364*** 0.00936** -0.00429 -0.00946*** 0.03638*** 0.00865**
(0.00531) (0.00225) (0.00188) (0.00451) (0.00527) (0.00226) (0.00187) (0.00435)
0.02462*** 0.01191*** 0.02118*** 0.01462*** 0.02502*** 0.0119*** 0.02139*** 0.01534***
(0.00404) (0.00186) (0.00147) (0.00353) (0.00401) (0.00186) (0.00146) (0.0034)
0.01484*** -0.00497*** 0.00685*** 0.01049*** 0.01467*** -0.00504*** 0.00685*** 0.01065***
(0.0036) (0.00157) (0.00129) (0.00306) (0.00357) (0.00157) (0.00129) (0.00295)
-0.08141*** -0.06727*** -0.00029 -0.00802 -0.09475*** -0.06572*** -0.00482 -0.0397**
(0.02441) (0.00989) (0.00813) (0.01922) (0.02429) (0.00991) (0.0081) (0.01856)
-0.2107*** 0.08847*** 0.12456*** -0.09711*** -0.2038*** 0.08795*** 0.12375*** -0.08064***
(0.03613) (0.01591) (0.01289) (0.03099) (0.03598) (0.01594) (0.01286) (0.02993)
cons 0.05466*** -0.00149 0.01487*** 0.08718*** -0.09956** 0.02813 -0.00561 -0.05096
(0.00427) (0.00175) (0.00153) (0.00361) (0.04462) (0.01897) (0.01673) (0.03951)
Observations 13761 16184 14768 14728 13761 16184 14768 14728
R-squared 0.19014 0.81986 0.79576 0.22924 0.20785 0.82119 0.79929 0.28979
Year Dummy NO NO NO NO YES YES YES YES
Industry Dummy
NO NO NO NO YES YES YES YES
Country Dummy
NO NO NO NO YES YES YES YES
Notes: Standard errors are in parentheses*** p<0.01, ** p<0.05, * p<0.1

Sticky Cost Behavior: Evidence from BRICS+T Countries
135
(β8) raised its level. Based on the results from the perspective of COGS, the economic growth (β8) and AI (β3), PPEI (β5), and, DI (β7), which are firm characteristics, raised the level of cost stickiness while EI (β4) reduced its level. From the perspective of OC, the economic growth’s (β8) coefficient could not be interpreted as it was insignificant while being a minus, and the AI (β3) variable, one of the firm characteristics, was the only factor to raise the level of sticky cost behavior while other firm characteristics reduced the level of sticky cost behavior. This result on OC is also consistent with the results in Table 6. As for LC variable, the economic growth (β4) and EI (β4) variable raised the level of sticky cost behavior while other firm characteristics (AI [β3], PPEI [β5], II [β6], and DI [β7]) reduced it. When the results that exclude the dummy variables are compared to the results that include the dummy variables, the PPEI variable’s coefficient turned out to be insignificant from the perspective of SG&A Cost while comments about other variables and economic growth (β8) were similar. From the perspective of COGS, OC and LC, the results and comments are consistent with the results that include the dummy variables. The economic growth’s (β8) coefficient was insignificant and could not be interpreted for OC variable while comments on firm characteristics were similar. The economic growth’s (β8) coefficient was insignificant and could not be commented for LC variable while comments on firm characteristics were similar. Based on the results that include the dummy variables for the four dependent variables of H3-8 hypotheses,
• SG&A Cost in support of hypotheses H7 and H8, • COGS in support of hypotheses H3, H4 and H8,
• OC in support of hypotheses H3 and H7,
• LC in support of hypotheses H6, H7 and H8.
With the addition of the economic growth variable, there is some change in the results of the H3-H7 hypo-theses according to Table 6. As a result, it can argue that the addition of the economic growth variable to the regression model raises the possibility to test and interpret the firm characteristics.
5. ConclusionThis study aims to determine the sticky cost be-
havior of firms based in BRICS+T. In accordance with this purpose, investigated the reaction of sticky cost behavior to time, determined the firm characteristics that affect the level of cost stickiness, and analyzed the
effect of economic growth on the level of sticky cost behavior in many aspects.
The results of the study suggest that the publicly-tra-ded companies in BRICS+T exhibit a sticky cost behavior from the perspective of SG&A Cost, COGS, OC and LC. The results are consistent with Anderson et al. (2003), Subramaniam and Weidenmier (2003), Calleja et al. (2006), Dalla Via and Perego (2014), Bugeja et al. (2015), Hartlieb and Loy (2017), Bradbury and Scott (2018). Considering the time dimension after determining the existence of cost stickiness behavior, it is determined that the level of cost stickiness decline in the following periods. The firm characteristics that raised the level of cost stickiness were asset, property, plant and equ-ipment, and employee intensity while debt intensity declined its level. This is consistent with the results of the studies over the determination of cost stickiness as well as studies by Abu-Serdaneh (2014) and Bradbury and Scott (2014). Last but not least, in this study, which examines the economic growth of countries, that is, the effect of GDP on cost stickiness, it has been determined that the level of cost stickiness also raised as expected in the periods when GDP raised. The results are consistent with Anderson et al. (2003), Banker and Byzalov (2014), Kim and Wang (2014), Bu et al., (2015).
Briefly, unlike the few other studies in the literature, the sticky cost behavior of the firms based in BRICS+T considered to be developing economies was tested by a large number of observations, and it was concluded that they exhibit a sticky cost behavior. Moreover, this study addressed the sticky cost behavior as a whole in a broader perspective. It study also adds to market forecasts by providing evidence that it is necessary to look at measurable macroeconomic factors such as GDP regarding cost behavior. When viewed from a macroe-conomic perspective, the findings have important imp-lications for the inflation dynamics. Accordingly, in case of aggregate demand expansion caused by a monetary shock, price increases may be faster than expected due to cost stickiness. On the other hand, as the aggregate demand returns to its normal level, asymmetric cost behavior indicates that the disinflation process will be slower. Together with these situations, some guiding results are offered for firms of developing economies, too. Finally, further studies can be conducted to com-pare sticky cost behaviors of firms in developing and developed economies, and determine the level of cost stickiness of firms in the aforementioned economies based on certain firm characteristics.

Oğuz Yusuf ATASEL, Yasin ŞEKER, Fatih YILDIRIM
136
References
Abu-Serdaneh, J. (2014). The asymmetrical behavior of cost: evidence from Jordan. International Business Research, 7(8),113-122. http://dx.doi.org/10.5539/ibr.v7n8p113.
Alexandridis, G., Mavrovitis, C.F., & Travlos, N.G. (2012). How have M&As changed? Evidence from the sixth merger wave. The European Journal of Finance, 18, 663–688. https://doi.org/10.1080/1351847X.2011.628401.
Anderson, M. C., Banker, R. D. & Janakiraman, S. N. (2003). Are selling, general, and administrative costs “sticky”?. Journal of Accounting Research, 41(1), 47-63. https://doi.org/10.1111/1475-679X.00095.
Anderson, S.W. & Lanen, W.N. (2009). Understanding cost man-agement: what can we learn from the empirical evidence on “sticky costs”?. SSRN Electronic Journal. 1-42. http://dx.doi.org/10.2139/ssrn.975135.
Balakrishnan, R., Peterson, M. J. & Soderstrom, N. S. (2004). Does capacity utilization affect the “stickiness” of cost?. Journal of Accounting, Auditing & Finance, 19(3), 283-299. https://doi.org/10.1177/0148558X0401900303.
Banker, R. D. & Byzalov, D. (2014). Asymmetric cost behavior. Journal of Management Accounting Research, 26(2), 43-79.
Banker, R. D. & Chen, L. (2006). Predicting earnings using a model based on cost variability and cost stickiness. The Accounting Review, 81(2), 285-307. https://www.jstor.org/stable/4093140.
Banker, R. D., Byzalov, D., & Plehn-Dujowich, J. M. (2011). Sticky cost behavior: theory and evidence. SSRN Electronic Jour-nal, http://dx.doi.org/10.2139/ssrn.1659493.
Banker, R.D., Byzalov, D. & Chen, L.T. (2013). Employment pro-tection legislation, adjustment costs and cross-country differences in cost behavior. Journal of Accounting and Economics, 55(1), 111-127. https://doi.org/10.1016/j.jacceco.2012.08.003.
Betzer, A., Doumet, M., & Goergen, M. (2015). Disentangling the link between stock and accounting performance in ac-quisitions. The European Journal of Finance, 21(9), 755–771. https://doi.org/10.1080/1351847X.2014.890633.
Bradbury, M. E. & Scott, T. (2014). Do Managers understand asymmetric cost behavior?. Working Paper, Social Science Research Network.
Bradbury, M. E. & Scott, T. (2018). Do managers forecast asymmetric cost behaviour?. Australian Journal o f M a n a g e m e n t , 4 3 ( 4 ) , 5 3 8 - 5 5 4 . h t t p s : / / d o i .org/10.1177/0312896218773136.
Bu, D., Wen, C. & Banker, R. D. (2015). Implications of asym-metric cost behaviour for analysing financial reports of companies in China. China Journal of Accounting Studies, 3(3), 1-28. https://doi.org/10.1080/21697213.2015.1062343.
Bugeja, M., Lu, M. & Shan, Y. (2015). Cost stickiness in australia: characteristics and determinants. Australian Account-ing Review, 25(3), 248-261. https://doi.org/10.1111/auar.12066.
Calleja, K., Steliaros, M. & Thomas, D. C. (2006). A Note on cost stickiness: some international comparisons. Man-agement Accounting Research, 17, 127-140. https://doi.org/10.1016/j.mar.2006.02.001.
Chen, C. X., Lu, H. & Sougiannis, T. (2012). The agency problem, corporate governance, and the asymmetrical behavior of selling, general, and administrative costs. Contem-porary Accounting Research, 29(1), 252-282. https://doi.org/10.1111/j.1911-3846.2011.01094.x.
Cook, D. O., Kieschnick, R. & Moussawi, R. (2019). Operating leases, operating leverage, operational inflexibility and sticky costs. Finance Research Letters, 31, 369-373. https://doi.org/10.1016/j.frl.2018.12.012.
Cooper, R., & Kaplan, R. (1998a). The design of cost management systems: text, cases, and readings. Upper Saddle River, NJ: Prentice Hall.
Cooper, R., & Kaplan, R. (1998b). Cost and effect-using integrated cost systems to drive profitability and performance. Boston: Harvard Business School Press.
Çelik, M. & Kök, D. (2013). Türkiye’de Maliyet Yapışkanlığının Geçerliliği: İstanbul Menkul Kıymetler Borsası (IMKB) Örneğinde Panel Veri Analizi. Business and Economics Research Journal, 4(4), 37-48.
Dalla Via, N. & Perego, P. (2014). Sticky cost behavior: evidence from small and medium-sized companies. Accounting& Fi-nance, 54(3), 753-778. https://doi.org/10.1111/acfi.12020.
Dierynck, B., Landsman, W.R. & Renders, A. (2012). Do Man-agerial incentives drive cost behavior? evidence about the role of the zero earnings benchmark for labor cost behavior in private belgian firms. The Accounting Review, 87(4), 1219-1246. https://doi.org/10.2308/accr-50153.
Erdoğan, M., Öksüz D. M., Erdoğan, E. O. & Ömürbek, V. (2019). BİST’de Sektörler İtibariyle Maliyet Yapışkanlığının Panel Veri Analizi ile İncelenmesi, Süleyman Demirel Üniversitesi Vizyoner Dergisi, 10(24), 264-274. https://doi.org/10.21076/vizyoner.529402.
Gu, L., Hackbarth. & D., Johnson, T. (2017). Inflexibility and stock returns. SSRN Electronical Journal. 1-61. http://dx.doi.org/10.2139/ssrn.3032838.
Hacıhasanoğlu, T. & Dalkılıç, E. (2018). Maliyet Yapışkanlığı Hipotezinin BİST İmalat Sektörü Kapsamında Test Edilm-esi. Hitit Üniversitesi Sosyal Bilimler Enstitüsü Dergisi, 11(3), 1802-1808. https://doi.org/10.17218/hititsosbil.479221.
Hartlieb, S. & Loy, T. R. (2017). Evidence on the trade-off be-tween cost stickiness and income smoothing. SSRN Elec-tronical Journal. http://dx.doi.org/10.2139/ssrn.2814309.

Sticky Cost Behavior: Evidence from BRICS+T Countries
137
Ibrahim, A. E. A. & Ezat, A. N. (2017). Sticky cost behavior: evidence from Egypt. Journal of Accounting in Emerging Economies, 7(1), 16-34. https://doi.org/10.1108/JAEE-06-2014-0027.
Ibrahim, A. E. A. (2018). Board characteristics and asymmetric cost behavior: evidence from Egypt. Accounting Research Journal, 31(2), 301-322. https://doi.org/10.1108/ARJ-11-2015-0148.
Ibrahim, A.E.A. (2015). The economic growth and cost sticki-ness: evidence from Egypt. Journal of Financial Reporting and Accounting, 13(1), 119-140. https://doi.org/10.1108/JFRA-06-2014-0052.
Jang, Y., Yehuda, N., & Radhakrishnan, S. (2017). Asymmetric cost behavior and value creation in M&A deals. SSRN Electronic Journal, 1-56. http://dx.doi.org/10.2139/ssrn.2824132.
Kama, I. & Weiss, D. (2013). Do earnings targets and manage-rial ıncentives affect sticky costs?. Journal of Accounting Research,51(1), 201-224. https://doi.org/10.1111/j.1475-679X.2012.00471.x.
Karadeniz, E., Günay, F. & Koşan, L. (2019). Halka açık konakla-ma işletmelerinde maliyet yapışkanlığının analizi. Journal of Tourism Theory and Research, 5(2), 171-181.
Kim, J. B., & Wang, K. (2014). Labor unemployment risk and sticky cost behavior. SSRN Electronic Journal. 1-46. Working Paper, University of Waterloo.
Koo, J. H., Song, S. & Paik, T.Y. (2015). Earnings management and cost stickiness. Advanced Science and Technology Let-ter, 84, 40-44. http://dx.doi.org/10.14257/astl.2015.84.09.
Lee, J. Z. & Chiang, C. H. (2018). D&O Insurance and SG&A cost stickiness. SSRN Electronical Journal, http://dx.doi.org/10.2139/ssrn.3234103.
Magheed, B. A. (2016). The determinants of the sticky cost behavior in the Jordanian industrial companies listed in Amman Stock Market. Journal of Accounting-Business and Management, 23(1), 64-81. http://journal.stie-mce.ac.id/index.php/jabminternational/article/view/100>.
Noreen, E. (1991). Conditions under which activity-based cost systems provide relevant costs. Journal of Management Accounting Research, 3, 159–168.
Novy-Marx, R. (2011). Operating leverage. Review of Finance, 15(1), 103-134. https://doi.org/10.1093/rof/rfq019.
Orhunbilge, A. N. (2002). Uygulamalı regresyon ve korelasyon analizi. İstanbul: İstanbul Üniversitesi Basım ve Yayınevi Müdürlüğü.
Öztürk, E. & Zeren, F. (2016). Maliyet Yapışkanlığının Geçerliliğinin Test Edilmesi: Borsa İstanbul Örneği. Mehmet Akif Ersoy Üniversitesi Sosyal Bilimler Enstitüsü Dergisi, 8(15), 31-42. https://doi.org/10.20875/sb.05076.
Pichetkun, N. (2012). The determinants of sticky cost behavior on political costs, agency costs, and corporate governance perspectives. Ph.D. Thesis, Faculty of Business Administra-tion, Rajamangala University of Technology Thanyaburi, Thanyaburi.
Porporato, M. & Werbin, E. (2012). Evidence of sticky costs in banks of Argentina, Brazil and Canada. International Journal of Financial Services Management, 5(4), 303-320. https://doi.org/10.1504/IJFSM.2012.048834.
Sinițîn, N. & Socol, A. (2020). Determinants of Banking Prof-itability through ROA and ROE: A Panel Data Approach. Ovidius University Annals, Economic Sciences Series, Ovidius University of Constantza, Faculty of Economic Sciences, 20(1), 1037-1043.
Subramaniam, C. & Watson, M. (2016). Additional evidence on the sticky behavior of costs. Advances in Management Accounting, 26, 275-305. https://doi.org/10.1108/S1474-787120150000026006.
Subramaniam, C. & Weidenmier, M. (2003). Additional evi-dence on the sticky behavior of costs. Working Paper, Texas Christian University.
Uğurlu, M., Danışman, G. Ö., Bilyay-Erdoğan, S. & Vural-Yavaş, Ç. (2019). Asymmetric cost behavior and acquirer returns: evidence from U.S. Mergers. Ege Academic Rewiew, 19(3), 323-339. https://doi.org/10.21121/eab.536640.
Xue, S. & Hong, Y. (2016). Earnings management, corporate governance and expense stickiness. China Journal of Accounting Research, 9(1), 41-58. https://doi.org/10.1016/j.cjar.2015.02.001.
Wooldridge, J. M. (2002). Econometric analysis of cross section and panel data. The MIT Press Cambridge, Massachusetts, London, England.
Yang, Y. (2019). Do Accruals earnings management constraints and intellectual capital efficiency trigger asymmetriccost behavior? Evidence from Australia. Australian Accounting Review, 29(1), 1-16. https://doi.org/10.1111/auar.12250.
Yükçü, S. & Özkaya, H. (2011). Cost behavior in Turkish firms: are selling, general and administrative costs and total operating costs “sticky”?. Muhasebe Bilim Dünyası Dergisi, 13(3), 1-27.
Zonatto, V. C. D. S., Magro, C. B. D., Sant’ana, C. F. & Padilha, D. F. (2018). Effects of economic growth in the behavior of sticky costs of companies belonging to BRICS Countries. Contaduría y Administración, 63(4),1-25.