in vivo response to antioxidant nanomedicines using a
TRANSCRIPT

[1]
Diploma Thesis
For obtaining the academic degree of Master of Pharmacy at the Faculty of Science, Karl-
Franzens-Universität Graz
In vivo response to antioxidant nanomedicines using a zebrafish
model
Subject of Diploma Thesis
Pharmaceutical Technology
by
Isabella Hold
0911529
submitted to
Univ.-Prof. Dr. phil. nat. Andreas Zimmer
Graz, February 2016 .....................................................
Signature

[2]
STATUTORY DECLARATION
I hereby declare that I have written this thesis independently and without assistance, I did not use
other than the specified sources and are quoted accordingly.
The work has not been submitted in the same or similar form at any other university or institute of
tertiary education.
.......................................... ................................................
Place, Date Signature

ACKNOWLEDGMENTS
ACKNOWLEDGMENTS
First I would like to thank my thesis supervisor Univ.-Prof. Dr. phil. nat. Andreas Zimmer, of the Institute
Pharmaceutical Technology at the Karl-Franzens-University of Graz for giving me the opportunity to
research in New Zealand at the School of Pharmacy at the University of Otago. I would further like to
express my deepest appreciation to Dr Arlene McDowell at the School of Pharmacy, University of Otago
for welcoming me in her research team, continuous support during my research and opening up new
opportunities for me. Many thanks goes to my research colleague and Postdoctoral fellow Dr Jasper
Chui, for giving advice where needed and bouncing ideas back and forth. I also want to thank my fellow
colleagues at the School of Pharmacy, for making work fun and relaxing when too stressful, and always
making lunch break so much more entertaining.
In addition, a thank you to Dr Julia Horsfield, Dr Trent Newman and Noel Jhinku of the Otago Zebrafish
Facility, Department of Physiology, who welcomed me in their team as well and taught me a great deal
about zebrafish.
I also would like to acknowledge the funding by the KuWi Institute of the Karl-Franzens University that
helped in making my research possible.
A special thanks to my friends, in Austria and Dunedin, for letting me vent, keeping me sane, and always
entertained during my study and research. A big thank you to my flatties in Dunedin for the new
experiences, breakfast talks, fort nights, dance parties, movie nights and so much more memories I will
never forget, so thank you Nikky, Shannara, Amy, Ryan and Sean. Thanks to Anja and Barbara that
made me realise that I shouldn’t go into business and instead choose pharmacy, I would not be here
writing this without you.
A big thank you to my proof readers Sean Mackay and Bug Obermayr, I really hope you didn’t have to
many moments of complete and utter confusion.
Last but not least the biggest thank you to my parents Grete and Franz, who have always supported
me in the pursue of my dreams, even if it was hard on them to let me spend 6 months on the other side
of the world and for always believing in me even if I didn’t believe in myself. Also a thank you to my
sister Anneliese for her support and managing to get my parents and herself on a plane to New Zealand
to pick me up and to Stephan for his continuous support and believe in me over eight wonderful years,
I will always be grateful.
And a big thank you to all the people I probably forgot but didn’t mean to.
“We are the sum of all people we have ever met; you change the tribe and the tribe changes you”
-Dirk Wittenborn
Isabella Hold

ABBREVATIONS
[4]
ABBREVIATIONS
ACN Acetonitrile
AFN Auranofin
AhpC Alkyl hydroperoxide reductase subunit C
CAA Cellular activity assay
CAT Catalase
CCA Chicoric acid
CGA Chlorogenic acid
CPP Cell penetrating peptide
CV Coefficient of variation
DCFH-DA 2’,7’-Dichlorofluorescin diacetate
DCM Dichloromethane
DDS Drug delivery system
DL Drug loading efficiency
DMSO Dimethyl sulfoxide
dpf Days past fertilisation
DPPH 2,2-Diphenylpicrylhydrazyl assay
EE Entrapment efficiency
EMA European Medicine Agency
eNOS Endothelial nitric oxide synthases
EPR Enhanced vascular permeability and retention
ETC Electron transfer chain
FA Formic acid
FDA Food and Drug Administration
GFP Green fluorescence protein
GSH Glutathione
GSH-Px Glutathione peroxidase
HepG2 Human hepatocellular carcinoma cell line
Hmox Heme oxygenase

ABBREVATIONS
hpf Hours past fertilisation
ICH International Conference of Harmonisation
iNOS Induced nitrogen oxide synthases
LDC Lipid drug conjugates
LLOD Lower limit of Detection
LLOQ Lower limit of Quantification
LMWA Low molecular weight antioxidant
LOOH Free fatty acids
MAF Musculoaponeurotic Fibrosarcom protein
MeOH Methanol
MPS Mononuclear phagocytic system
NCL Nanostructured lipid carriers
nNOS Neuronal nitric oxide synthases
NO Nitric oxide
NOS Nitric oxide synthases
NP Nanoparticle
NRF2 Nuclear factor E2-related Factor 2
ORAC Oxygen radical absorbance capacity assay
PECA Poly-ethyl-cyano-acrylate
PEG Polyethylene glycol
PLGA Poly-lactic-co- glycolic acid
Prdx Peroxiredoxin
PVA Polyvinyl alcohol
PVA Polyvinyl alcohol
RES Reticuloendothelial system
RNS Reactive nitrogen species
ROS Reactive oxygen species
RP-HPLC Reverse phase high pressure liquid chromatography
rpm Rounds per minute
SLN Solid lipid nanoparticles

ABBREVATIONS
SOD Superoxide dismutase
SOP standard operating procedure
spm Shakes per minute
TEAC Trolox equivalent antioxidant assay
XOR Xanthine-oxidoreductase
ZFO Zebrafish Facility Otago

FIGURES
[7]
FIGURES
Figure 1 Metabolism pathways of secondary plant compounds with antioxidant activity by Azmir et al. (2013) .............................................................................................................................. 21
Figure 2 caftaric acid ............................................................................................................................. 23
Figure 3 chicoric acid ............................................................................................................................. 23
Figure 4 chlorogenic acid ...................................................................................................................... 23
Figure 5 DPPH with antioxidant hydrogen donor ................................................................................. 25
Figure 6 Zebrafish stages from the eggs to the larvae, showing the chorion in embryonal stage (Rizzo
et al., 2013) ........................................................................................................................................... 27
Figure 7 adult zebrafish in a typical breeding tank set up, male (m) and female (f) ............................ 28
Figure 8 Embryogenesis of zebrafish in hours past fertilisation (hpf), with the cranial neural crest
visible from around 10 to16 hpf, as highlighted Carney et al. (2006). ................................................. 29
Figure 9 Embryos between 10-13 hpf, with the notochord marked by the arrow in picture C. Picture E
focuses on the notochord in between 2-4 somite stages, and G shows an embryo at 8-somite stage
aged 13 hpf with parts of the spinal cord (sc) and optic primordium (op) visible (Westerfield, 2000).
.............................................................................................................................................................. 29
Figure 10 graphic of a blood vessel showing the location of the Endothelium, tunica media and
adventitia by stemcellsfreaks.com ....................................................................................................... 34
Figure 11 Transportation of particles through the plasma membrane, uptake of larger particles via
phagocytosis, specific particles via receptor mediated endocytosis, often clathrin mediated, and
small particles via pinocytosis ............................................................................................................... 35
Figure 12 Distribution of electrical potential in disperse systems, when particle interact with other
particles as well as outer phase ............................................................................................................ 43
Figure 13 Evaluation chart for oxidative stress induced malformations, in 5-day old zebrafish larvae
.............................................................................................................................................................. 50
Figure 14 Calibration curve of chlorogenic using mean values, number of repetition (n) = 3 (for each
day over a 3-day period). ...................................................................................................................... 55
Figure 15 Calibration curve of chicoric acid using mean values, number of repetitions (n) = 3 (for each
day over a 3-day period). ...................................................................................................................... 56
Figure 16 Evaluation of toxicity of chlorogenic acid in the concentration of 50, 100, 250, 500 and 700
µM in zebrafish embryos over a 5-day period, each concentration was done in replicate, (n) = 4. .... 58
Figure 17 The survival of zebrafish embryos in % after 24 hr auranofin exposure and subsequent
treatment with CGA or E3 media, as well as a control group and a continuous auranofin exposure on
day 5 past fertilisation, all groups were done in triplicates (n) = 50 – 90. ............................................ 60
Figure 18 Scoring from 0 to 3 of the visual evaluation regarding phenotypes in each group, expressed
as the average of the experiment groups done in triplicates with ± SEM, number of larvae (n) = 150.
.............................................................................................................................................................. 60
Figure 19 Total score of phenotype evaluation at 5 dpf, with a range from 0 to 15 (healthy to severe
damage), the average ± SEM of each experiment group done in triplicate, number of larvae (n) = 150.
.............................................................................................................................................................. 61
Figure 20 Calibration curve of chlorogenic acid in PBS, number of replicates (n) = 2 .......................... 64
Figure 21 Release profile of chlorogenic acid in Group A (+CaCl2) and Group B (-CaCl2), expressed as
average concentration at each time point in PBS, number of replicates (n) = 2. ................................. 64

TABLES
[8]
TABLES
Table 1 ................................................................................................................................................... 17
Table 2 ................................................................................................................................................... 19
Table 3 ................................................................................................................................................... 22
Table 4 ................................................................................................................................................... 41
Table 5 ................................................................................................................................................... 49
Table 6 ................................................................................................................................................... 54
Table 7 ................................................................................................................................................... 55
Table 8 ................................................................................................................................................... 56
Table 9 ................................................................................................................................................... 57
Table 10 ................................................................................................................................................. 62
Table 11 ................................................................................................................................................. 63
Table 12 ................................................................................................................................................. 51

ABSTRACT
[9]
ABSTRACT
In the presented study the main interest was to investigate the antioxidant activity of Sonchus oleraceus
L. in an in vivo model. In New Zealand the plant is commonly known by its Maōri name pūhā and is
traditionally used in medicine and diet. Previous studies on Sonchus in vitro have shown that the main
antioxidant activity is related to the low molecular weight antioxidants, three phenolic acids (chlorogenic
acid, caftaric acid and chicoric acid) have been isolated. In this project, the aim was to verify the
antioxidant potential of these phenolic acids in an in vivo zebrafish model. To further investigate which
phenolic acid has the highest antioxidant potential, the single compounds were used and as extension
to prior studies, chlorogenic acid was initially applied to zebrafish embryos, as it was stated to express
the highest antioxidant activity in in vitro studies.
Zebrafish are believed to be an ideal model for the purpose of investigating the oxidative stress
response elicited by a toxin and the antioxidant activity of chlorogenic acid. In the zebrafish embryos
an increase in free radicals was induced by the xenobiotic drug auranofin. It was hypothesised that the
exposure of zebrafish embryos to auranofin over a short period of time in low concentrations elicit high
concentrations of free radicals that damage cells, especially neural crest cell progenitors, and that a
follow-up treatment with chlorogenic acid can arrest the damage induced or potentially reverse it to
some degree. As the literature offers a vast range of assays to determine the concentration of free
radicals in cells and living organism, it was decided that the fluorescent dye DCFH-DA would be used
for quantification of free radical as an extension of the research by McDowell, Thompson, Stark, Ou
and Gould (2011). In addition, a visual scoring system for phenotype deformations in young zebrafish
was developed. The phenotypes evaluated in the scoring system were pigmentation, oedema,
haemorrhaging, and tail and jaw deformities. To follow the process of cellular damage the transgenic
zebrafish line Tg(SOX10: GFP) was mainly used next to the wildtype line ABz. The transgenic zebrafish
was used preferably because the development of neural crest cells can be followed by fluorescence
microscopy using the fluorescent protein GFP. A further hypothesis of the presented study was that the
application of isolated antioxidants via nanomedicines could enhance the uptake efficiency and
bioavailability of phenolic acids in the zebrafish. As a suitable drug delivery vehicle the nanoformulation
PLGA was chosen to entrap single compounds of pūhā, as this formulation was previously reported to
have good entrapment efficiency, biodegradability and most of all does not induce oxidative stress upon
cellular uptake and accumulation (McCall & Sirianni, 2013).
We conducted laboratory experiments to test our hypotheses that chlorogenic acid can rescue zebrafish
after oxidative stress induction. Zebrafish embryos were analysed over a 5- day period, after a 24 hour
exposure to auranofin (5 µM), with a consecutive treatment of 250 µM chlorogenic acid. Quantification
of oxidative stress in the zebrafish embryos over the 5 days with the fluorescent probe was inconclusive,
whereas the visual evaluation showed that chlorogenic acid express significant (p< 0.005) antioxidant
activity to reverse or arrest malformation in the phenotypes pigmentation, haemorrhaging and jaw
deformities compared to the non-rescue zebrafish group, therefore reducing cellular damage elicited by
auranofin exposure.

ABBREVATIONS
This leads to the conclusion that chlorogenic acid is absorbed by the zebrafish embryos in the early
development stages and expresses sufficient antioxidant activity to arrest or reverse damage in
zebrafish caused by oxidative stress.
Furthermore, to increase the uptake efficiency, chlorogenic acid was encapsulated in PLGA
nanoparticles, prepared by the double emulsion technique. The nanoparticles express a good
entrapment efficiency of 58.16% at a size of 237.7 ± 26.29 nm and possess a surface charge of -7.97
± 4.9 mV. The release profile of the PLGA nanoparticles displayed inconsistency between sample,
contrary to our expectations. A burst release of small concentrations of chlorogenic acid could be
observed in some samples within the first three hours, with no subsequent release over the following
60 hours.
Nevertheless, the results of this study give deeper insight into the antioxidant activity of chlorogenic
acid in a living organism. Furthermore, the newly developed scoring system makes it possible to
evaluate zebrafish embryos sufficiently on a visual level regarding their response to oxidative stress. It
can therefore be concluded that the LMWAs of pūhā maintain their antioxidant potential in vivo.
Administration of chlorogenic acid post-oxidative stress induction can also help to prevent
haemorrhaging, supporting the traditional use of pūhā for reducing haemorrhage during child birth, and
widespread use as a form of dietary gum (Bell, 1890; Elsdon, 1942).

ZUSAMMENFASSUNG
[11]
ZUSAMMENFASSUNG
In dieser Diplomarbeit wird die antioxidative Wirkung von Sonchus Oleraceus L. mittels eines In Vivo
Model untersucht. Die in Neuseeland heimische Pflanze Sonchus Oleraceus ist dort auch unter ihrem
Māori Namen pūhā, weitläufig bekannt und wurde von den Māori in der traditionellen Medizin und
normalen Ernährung angewandt. In Vitro Studien zeigten, dass die antioxidative Wirkung von Sonchus
hauptsachlich von den nieder molekulargewichtigen Antioxidantien ausgeht, und diese Wirkung wurde
den folgenden Phenolsäuren, Chlorogensäure, Cichoriensäure und Caftarsäure zugeschrieben. Mit
dieser Studie sollte nachgewiesen werden ob das In Vitro Verhalten der drei Säuren in einem Zebrafisch
Model aufrechterhalten bleibt. Um festzustellen welche der drei Säuren die höchste antioxidative
Aktivität In Vivo aufweist, wurde als eine Weiterführung einer zuvor durchgeführten Studie
Chlorogensäure zuerst den Zebrafischembryos zugeführt, da dieser bereits in In Vitro Studien die
höchste antioxidative Wirkung zugesprochen wurde.
Der Zebrafisch wurde schon des Öfteren verwendet um die Auswirkungen von oxidativen Stress zu
untersuchen. Hier wurde oxidativer Stress in Zebrafischembryos mittels dem xenobiotischen
Arzneistoffes Auranofin ausgelöst. Es wurde die Hypothese aufgestellt, dass mit dem Arzneistoff
Auranofin über einen kurzen Zeitabschnitt genug freie Radikale erzeugt werden um Schäden in
Neuralzellabkömmlingen zu erzeugen und dass mit einer anschließenden Behandlung diese Schäden
mit Chlorogensäure gehemmt, beziehungsweise reversiert werden können. Die Literatur bietet eine
große Vielzahl von Assays an um freie Radikale nachweisen zu können. Für diese Studie wurde für die
Quantifizierung von freien Radikalen eine Fluoreszenz Methode mit dem Fluorenzenzfarbstoff DCFH-
DA ausgewählt, als eine Erweiterung zu einer zuvor durchgeführten Studie bei McDowell, Thompson,
Stark, Ou and Gould (2011), zusätzlich zu diesem Assay wurde eine visuelle Evaluierungsmethode
entwickelt die die Bewertung von fünf Phänotypen und deren Veränderungen der Zebrafischembryos
untersucht. Diese Evaluierung erfolgte für die Phänotypen, Verlust von Pigmentation, Bildung von
Ödemen, Blutungen, Verformungen der Flossen und des Fischschwanzes sowie Verformungen des
Kiefers. Um diesen Entwicklungsstörungen zu folgen, wurde hauptsächlich der transgene Zebrafischtyp
Tg(SOX10: GFP) und der Wildtyp ABz‘ verwendet. Die transgene Fischart wurde vermehrt verwendet
da es möglich war, durch die Expression von grün fluoreszierendem Protein (GFP), die Migration von
Neuralzellen und deren Abkömmlingen, mittels eines Fluoreszenz Mikroskop zu verfolgen. Eine weitere
Hypothese dieser Arbeit war, ob die bereits erwähnten Antioxidantien mittels Nanomedizin zu einer
erhöhten Aufnahme in Zellen führen und ob die Bioverfügbarkeit der Phenolsäuren ebenfalls erhöht
werden kann. Die Nanopartikelformulierung PLGA wurde als geeignetes Applikationsvehikel
ausgewählt um die einzelnen Komponenten von Pūhā einzuschließen, da in Studien für diese
Formulierung bereits, auf eine gute Einschlusskapazität, sowie biologische Abbaubarkeit hingewiesen
wurde und am Wichtigsten, dass die Formulierung selbst keinen oxidativen Stress auslöst.
Experimente um die aufgestellten Hypothesen zu testen wurden im Labor durchgeführt. Hierfür wurden
Zebrafischembryos über einen Zeitraum von 5 Tagen analysiert, nachdem sie für 24 Stunden dem
Toxin Auranofin (5 µM) ausgesetzt waren und dann im Anschluss mit Chlorogensäure (250 µM)
behandelt wurden. Die Quantifizierung mit dem Fluoreszenzfarbstoff DCFH-DA wurde am fünften Tag

ZUSAMMENFASSUNG
durchgeführt, lieferte jedoch keine vollständigen und unzureichenden Ergebnisse, wobei die Analyse
mit der visuellen Evaluierunsmethode zeigte, dass Chlorogensäure signifkant (p< 0.005, ANOVA) die
durch oxidativen Stress hervorgerufenen Schäden, reduziert oder stoppt. Im Besonderen in den
Bereichen des Pigmentverlustes, der Häufigkeit von Blutungen, und der Kieferverformungen im
Vergleich mit der Zebrafisch Gruppe die nicht mit Chlorogensäure behandelt wurde, somit wurden die
Zellschäden, an jenen die am stärksten von Auranofin geschädigt werden, mit der Gabe von
Chlorogensäure reduziert.
Dies führt zu der Annahme das Chlorogensäure von den Zebrafischembryos absorbiert und in den
frühen Entwicklungsstadien ausreichend antioxidative Wirkung exprimierte, um Schäden die auf
oxidativen Stress zurückzuführen sind vermindert oder verbessert.
Um eine Verbesserung der Aufnahme von Chlorogensäure zu gewährleisten wurde diese in PLGA
Nanopartikel eingeschlossen, welche mit der Doppel-Emulsions-Technik erzeugt wurden. Diese
Nanopartikel zeigen eine gute Einschlusskapazität von 58.16% mit einer Durchschnittsgröße von 237.7
± 26.29 nm und einer Oberflächenspannung von -7.97 ± 4.9 mV. Die Freisetzungsgeschwindigkeit von
Chlorogensäure aus PLGA Nanopartikeln war gegensätzlich zu den Erwartungen instabil, wobei
manche Proben eine Freisetzung in den ersten 3 Stunden zeigten, jedoch mit keiner weiteren
Freisetzung über den nächsten 60 Stunden.
Nichtsdestotrotz, gibt diese Arbeit neue Einsichten in die antioxidative Aktivität von Chlorogensäure in
einem lebenden Organismus. Des Weiteren, kann mithilfe des neuen Evaluierungsschemas
Zebrafischembryos bezüglich ihrer optischen Erscheinung in dem Ausmaß von oxidativen Stress
klassifiziert werden. Zusammenfassend kann gesagt werden, dass die LMWAs von Pūhā ihre
antioxidative Wirkung In Vivo beibehalten und dass die präventive Wirkung von Chlorogensäure, die
traditionellen Anwendungen der Maori von Pūhā unterstützt, nämlich der Anwendung bei Blutungen
während der Geburt und als Zahnpflege in Form einer Art von Kaugummi.

CONTENTS
STATUTORY DECLARATION ................................................................................................................ 2
ACKNOWLEDGMENTS .......................................................................................................................... 3
ABBREVIATIONS .................................................................................................................................... 4
FIGURES ................................................................................................................................................. 7
TABLES ................................................................................................................................................... 8
ABSTRACT.............................................................................................................................................. 9
ZUSAMMENFASSUNG ......................................................................................................................... 11
1. ANTIOXIDANTS ............................................................................................................................ 15
1.1. Free radicals .............................................................................................................................. 15
1.2. The endogenous and exogenous preventive role of antioxidants ............................................. 17
1.3. Plant based exogenous antioxidants ......................................................................................... 19
1.3.1. Isolation of Antioxidants ......................................................................................................... 20
1.4. Sonchus oleraceus L. ................................................................................................................ 22
1.4.1. Activity and Bioavailability of phenolic acids ......................................................................... 24
1.5. Auranofin ................................................................................................................................... 25
2. IN-VIVO MODEL............................................................................................................................ 26
2.1. The Zebrafish - Danio rerio ........................................................................................................ 26
2.1.1. Breeding ................................................................................................................................ 27
2.1.2. Development stages of zebrafish .......................................................................................... 28
3. NANOPARTICLES ........................................................................................................................ 31
3.1. Nanomedicine as a Drug Delivery System ................................................................................ 31
3.1.1. Passive Targeting .................................................................................................................. 32
3.1.2. Active targeting ...................................................................................................................... 33
3.2. Pharmacokinetics and pharmacodynamics ............................................................................... 33
3.3. Types of Nanoparticles .............................................................................................................. 36
3.3.1. Liposomes ............................................................................................................................. 37
3.3.2. Lipid nanoparticles ................................................................................................................. 37
3.3.3. Polymeric Nanoparticles ........................................................................................................ 38
3.3.4. Dendrimers ............................................................................................................................ 38
3.3.5. Carbon Nanomaterials, Ceramic Materials, Metal-based Materials, Magnetic Materials ..... 39
3.4. Nanotoxicity ............................................................................................................................... 41
3.4.1. Characterisation..................................................................................................................... 42

CONTENTS
3.5. Choosing the right nanoparticle formulation .............................................................................. 44
3.5.1. The preparation of PLGA Nanoparticles ............................................................................... 45
4. METHODS AND MATERIALS ....................................................................................................... 47
4.1. HPLC ......................................................................................................................................... 47
4.1.1. Gradient RP-HPLC Assay Validation .................................................................................... 47
4.2. Zebrafish .................................................................................................................................... 48
4.3. PLGA nanoparticles ................................................................................................................... 52
5. RESULTS AND DISCUSSION ...................................................................................................... 54
5.1. Gradient RP-HPLC validation of chlorogenic acid and chicoric acid ......................................... 54
5.2. Dose evaluation of chlorogenic acid in TG(SOX10: GFP) ........................................................ 57
5.3. Rescue of zebrafish embryos with chlorogenic acid ................................................................. 59
5.4. PLGA Nanoparticles .................................................................................................................. 62
5.4.1. Release profile of PGLA nanoparticles ................................................................................. 62
6. CONCLUSION ............................................................................................................................... 66
7. REFERENCES .............................................................................................................................. 67
8. APPENDIX ................................................................................ Fehler! Textmarke nicht definiert.

ANTIOXIDANTS
[15]
1. ANTIOXIDANTS
Antioxidants are commonly known for their ability to eliminate oxidative stress and therefore reduce cell
aging, cell proliferation, apoptosis and DNA fragmentation (Valko, Leibfritz, Moncol, Cronin, Mazur &
Telser, 2007). These effects caused by oxidative stress are often related to the pathogenesis of
diseases such as hypertension, atherosclerosis, hypercholesterolemia, heart failure, diabetes mellitus,
neurodegenerative disorders, rapid aging and inflammatory diseases (Fukai & Ushio-Fukai, 2011;
Valko, Leibfritz, Moncol, Cronin, Mazur & Telser, 2007). Previous studies have shown that antioxidants
can reduce cell damage when exposed to reactive oxygen species (ROS) or reactive nitrogen species
(RNS). (Ratnam, Ankola, Bhardwaj, Sahana & Kumar, 2006; Valko, Rhodes, Moncol, Izakovic & Mazur,
2006).
1.1. Free radicals
Reactive oxygen and reactive nitrogen species (ROS and RNS) are formed during normal cell
metabolism. Most of the ROS are generated by the mitochondrial electron transport chain, the main
source of energy in mammalian cells (Valko, Leibfritz, Moncol, Cronin, Mazur & Telser, 2007). During
the mitochondrial electron transport chain, some electrons come in contact with oxygen and form the
free radical superoxide in Complexes I and III. Superoxide anions produced by Complex I cannot
escape the physiological intact mitochondrial membrane. Whereas 50% of the superoxide anions
produced by Complex III pass through the membrane and are released into the matrix (Valko, Leibfritz,
Moncol, Cronin, Mazur & Telser, 2007). A moderate level of ROS and RNS is needed for various
physiological reactions, including cellular response to anoxia and cellular signalling systems, like the
formation of the second messenger cyclic guanosine monophosphate (cGMP) (Valko, Leibfritz, Moncol,
Cronin, Mazur & Telser, 2007). Due to the reactive properties of free radicals they produce more free
radicals in a chain reaction with molecular oxygen during reduction of O2 and H2O and therefore lead
to an accumulation of free radicals, as shown in the equations [1] and [2] (Gutteridge, 1994; Shahidi,
1997).
𝑂2 + 1𝑒− → 𝑂2
−• [1]
𝐻2𝑂 + 1𝑒− → 𝐻+ + 𝑂2
−• [2]
As a precursor to the •OH radical, the O2-• can only extract hydrogen atoms from strong donors like
ascorbic acid. However, the •OH has the ability to extract other electrons from neighbouring molecules.
Dismutation of the superoxide radical anion happens through catalysis via antioxidant enzymes, such
as superoxide-dismutase (SOD), or spontaneously, resulting in hydrogen peroxide as shown by
equations [3] and [4] (Shahidi, 1997).
𝐻𝑂2• → 𝐻+ + 𝑂2
− [3]
2𝑂2−• + 2𝐻+
𝑆𝑂𝐷→ 𝐻2𝑂2 + 𝑂2 [4]
𝐹𝑒2+ + 𝐻2𝑂2 → 𝑂𝐻• + 𝑂𝐻− + 𝐹𝑒3+ [5]

ANTIOXIDANTS
[16]
The •OH radical is the neutral form of the hydroxide ion and is a highly reactive radical species, with an
in vivo half-life, of approximately 10-9 s. The cell maintains a strict redox state linked to an iron- and
copper- sulphur cluster (Fe-S and Cu-S) and under physiological conditions, cellular iron is bound to a
complex in the mitochondrial electron transfer chain. An unbalanced redox state of a cell can be caused
by an increase of radicals under stress conditions, leading to an excess of superoxide that can trigger
free iron. The free iron then reacts with superoxide and forms •OH radicals via Fenton reaction, see
equation [5] (Valko, Leibfritz, Moncol, Cronin, Mazur & Telser, 2007). The free iron originates from [4Fe-
4S]-cluster containing enzymes, most common in the mitochondrial membrane. Other radicals
originating from oxygen are the peroxyl radicals (ROO•), which have been associated with the
peroxidation of fatty acids (LOOH) by two pathways, either initiated by HO2• or (LOOH)-independent
pathway (Valko, Leibfritz, Moncol, Cronin, Mazur & Telser, 2007). The resulting products of both
pathways are metabolised by Xanthine-oxidoreductase (XOR) with uric acid as the end substrate, an
endogenous free radical scavenger. Therefore, the cellular redox potential is regulated by XOR, as it
produces several RNS and ROS as well as uric acid in equal measures (Valko, Leibfritz, Moncol,
Cronin, Mazur & Telser, 2007).
The reactive nitrogen species (RNS) are also produced during normal cell metabolism. Nitric oxide NO•
radicals are generated in biological tissues by specific nitric oxide synthases (NOS), when metabolizing
L-arginine to L-citrulline by losing NO (nitric oxide) (Equation [6]) (Valko, Leibfritz, Moncol, Cronin,
Mazur & Telser, 2007).
𝐿 − 𝑎𝑟𝑔𝑖𝑛𝑖𝑛𝑒 𝑁𝑂𝑆→ 𝐿 − 𝑐𝑖𝑡𝑟𝑢𝑙𝑙𝑖𝑛 + 𝑁𝑂 [6]
The NOS produces NO radicals via a five electron oxidative reaction and is mostly located in endothelial
and neuronal cells. Therefore, NOS can be distinguished based on its location in an endothelial NOS
(eNOS) and neuronal NOS (nNOS), and also as induced NOS (iNOS), which is an important cellular
defence mechanism (E. Mutschler, 2013). The main function of the eNOS is the preservation of the
vascular muscle tonus, as it is one of the mediators initiating the vasodilatation/ relaxation of the smooth
vascular muscles. The nNOS is located in the dendrites and is important for signal
transduction/neurotransmission (Gutteridge, 1994; Valko, Leibfritz, Moncol, Cronin, Mazur & Telser,
2007). They also play an important role in immune regulation and blood pressure regulation. These NO
radicals are generally unstable in oxygen rich aqueous environment and therefore have a short half-life
(< 15 s). However, as the NO radicals are small in size and have a good solubility in both aqueous and
lipid mediums and as a result, they readily diffuse through various biological membranes and cytoplasm.
An abundance of NO• radicals can lead to loss in neurotransmission and synaptic plasticity in central
nervous system as well as to serious damage to the integrity of the endothelial barrier, which may lead
to cardiovascular diseases, and also have the ability to alter the structure of proteins inhibiting their
normal function. The overproduction of free NO radicals is called nitrosative stress as opposed to
oxidative stress caused by an overflow of free oxygen radicals and is kept in equilibrium with
endogenous radical scavengers like catalase, peroxiredoxin and AhpC (alkyl hydroperoxide reductase
subunit C) (Flohé & Harris, 2007; Valko, Leibfritz, Moncol, Cronin, Mazur & Telser, 2007).

ANTIOXIDANTS
[17]
1.2. The endogenous and exogenous preventive role of
antioxidants
To prevent a pathological accumulation of free radicals the body is equipped with an endogenous
antioxidant system, including various enzymes, and a non-enzymatic antioxidants some of which are
listed in Table 1 (Shahidi, 1997).
Biological antioxidants are molecules that delay or inhibit the oxidation of oxidisable substrates by
oxidising instead of the substrate via different reactions dependent on location in the body, or by
eliminating radicals by metabolising them in intermediates. These reactions are due to the electron
transfer chain breaking, removing and quenching, or scavenging properties of those exogenous and
endogenous antioxidants like vitamin E, vitamin C and enzymatic, such as SOD or uric acid (Gutteridge,
1994; Shahidi, 1997).
Table 1
List of endogenous antioxidants describing their location and function in organism by (Shahidi, 1997) Antioxidant Location Function
Non-enzymatic
Ascorbic acid plasma electron donor, O2 quencher
Β-Carotene plasma, cell membranes electron donor, O2 quencher
Glutathione (GSH) plasma, intracellular
cytosol, mitochondria
thiol group maintains redox potential,
α-Tocopherol plasma, cell membranes electron donor, O2-quencher, free radical
scavenger, H+ donor
Uric acid plasma binds free Fe ions
Enzymatic
Catalase (CAT) intracellular (peroxisomes) metabolises H2O2 into H2O and O2
Peroxiredoxin
(Prdxs)
cytosol metabolises H2O2 and ONO2-
Superoxide
dismutase (SOD)
plasma, milk, intracellular
(cytosol, mitochondria)
dismutates O2-• into H2O2
Glutathione
peroxidase (GSH-
Px)
plasma, intracellular inactivates hydroperoxides using GSH
reducing equivalents regenerates GSH
from GSSG
Endogenous radical scavengers have a specific binding target that can be exclusively presented from
a specific site in the radical producing cascades. Closer examination of the hydroperoxide radical

ANTIOXIDANTS
[18]
generated by the electron transfer chain (ETC), radicals originating from complex III diffuse through the
mitochondrial membrane in the cytosol. Scavengers located within the cell, such as the catalase
enzyme or peroxiredoxin system, metabolise those radicals. Catalase is the most efficient pathway for
radical metabolism, although it is dependent on high concentrations of radicals and the availability of
AhpC. In comparison, Peroxiredoxin a member of the AhpC family is activated by low peroxide radical
concentrations in the cytosol (Flohé & Harris, 2007). The Prdxs scavenging system reacts with the
targets peroxide (-O-O-) bond through its catalytic cysteine centre. The cysteine residue splits the
peroxide bond assisted by nucleophilic attachment of the thiol residue, resulting in the formation of an
alcohol (R-OH) and water in a completely conserved reaction (Flohé & Harris, 2007).
The endogenous antioxidant system works in synergy with the exogenous antioxidant system, resulting
in an enhanced efficiency of the endogenous system under physiological conditions (Bouayed & Bohn,
2010). Exogenous antioxidants are those absorbed through nutrients, with vitamin C and E, carotenoids
and polyphenols being the main antioxidants obtained by dietary intake (Bouayed & Bohn, 2010). As
the human body lacks the ability to synthesise exogenous antioxidants de novo, the intake of these
antioxidants via food, nutrients and phytochemicals is widely endorsed by many health organizations
(Bouayed & Bohn, 2010). Nevertheless, the beneficial effects of those nutrients and phytochemicals
have been questioned, as high doses could interact with the activators of detrimental cell-signalling
cascades, that are reactive oxygen/nitrogen species. As mentioned previously, low doses of RNS and
ROS are important to cell signalling, including controlling cell numbers by apoptosis and mitogenesis
(Martin & Barrett, 2002).
Understanding the pathways generating free radicals and the related endogenous scavenging
cascades makes it possible to alter the equilibrium in cells and living organism. Using this knowledge,
it is possible to use agents which interact with this cascades to reduce or induce oxidative stress.

ANTIOXIDANTS
[19]
1.3. Plant based exogenous antioxidants
More than 3,000 foods, including beverages, herbs and spices, chocolate, soups, etc. in various states
of processing including frozen, dried, fresh, and commercially prepared, have been sampled and tested
for their antioxidant activity by the team of Carlson et al. using different radical scavenging assays.
These include, the 2, 2-diphenylpicrylhydrazyl (DPPH) radical scavenging assay, the trolox equivalent
antioxidant activity assay (TEAC) and the oxygen radical absorbance capacity (ORAC) assay can be
utilised to compare antioxidant activity between different foods (Ou, Schmierer, Rades, Larsen &
McDowell, 2013).
Table 2
Examples of food with antioxidant activity based on the list by Carlsen et al. (2010), showing their radical scavenging activity using the EC50 values of DPPH assay
Food Antioxidant content
mmol/100g or value 11 Main antioxidant
Antioxidant activity
EC50 of DPPH in
mg/ml
Walnuts with pellicle1 21.91 polyphenols2 0.222
Sunflower seeds3 6.41 5-o-caffeoyl-quinic
acid4
0.0254
Dark chocolate 80%5 10.901 flavonoids5 0.36 ± 0.025
Blueberry fruits6 14.986 rutin6 0.426
Strawberry fruits6 4.446 rutin6 0.816
Sow thistle7 35.008 phenolic acids8 0.012 ± 0.0038
Green tea1 1.51 polyphenols9s 0.2978
1 Carlsen MH, Halvorsen BL, Holte K, Bøhn SK, Dragland S, Sampson L, et al. (2010). The total antioxidant content of more than 3100 foods, beverages, spices, herbs and supplements used worldwide. Nutrition Journal 9: 3-3. 2Pereira JA, Oliveira I, Sousa A, Ferreira ICFR, Bento A, & Estevinho L (2008). Bioactive properties and chemical composition of six walnut (Juglans regia L.) cultivars. Food and Chemical Toxicology 46: 2103-2111. 3 Carlsen MH, Halvorsen BL, Holte K, Bøhn SK, Dragland S, Sampson L, et al. (2010). The total antioxidant content of more than 3100 foods, beverages, spices, herbs and supplements used worldwide. Nutrition Journal 9: 3-3. 4 Karamać M, Kosińska A, Estrella I, Hernández T, & Dueñas M (2012). Antioxidant activity of phenolic compounds identified in sunflower seeds. Eur Food Res Technol 235: 221-230. 5 Vertuani S, Scalambra E, Vittorio T, Bino A, Malisardi G, Baldisserotto A, et al. (2014). Evaluation of Antiradical Activity of Different Cocoa and Chocolate Products: Relation with Lipid and Protein Composition. Journal of medicinal food 17: 512-516. 6 Huang W-y, Zhang H-c, Liu W-x, & Li C-y (2012). Survey of antioxidant capacity and phenolic composition of blueberry, blackberry, and strawberry in Nanjing. Journal of Zhejiang University Science B 13: 94-102. 7 McDowell A, Thompson S, Stark M, Ou ZQ, & Gould KS (2011). Antioxidant activity of puha (Sonchus oleraceus L.) as assessed by the cellular antioxidant activity (CAA) assay. Phytotherapy research : PTR 25: 1876-1882. 8 Yen G-C, & Chen H-Y (1995). Antioxidant Activity of Various Tea Extracts in Relation to Their Antimutagenicity. Journal of Agricultural and Food Chemistry 43: 27-32.
ANTIOXIDANTS
[20]
The most common antioxidants are polyphenols, secondary metabolites of plants, and their derivates
including phenolic acid, flavonoids, lignans and stilbenes. The protective effects of these antioxidants
against various diseases caused by oxidative stress have been proven in many epidemiological studies
(Pandey & Rizvi, 2009). The protective properties include protection against diabetes, cancer,
hypertension, asthma, infections, cardio vascular diseases, aging and damage caused by ultraviolet
radiation or aggression by pathogens or toxins (Pandey & Rizvi, 2009). There have been more than
8,000 different polyphenolic compounds detected, which primarily occur in conjugated forms, the most
common intermediates being phenylalanine (an amino acid) and shikimic acid. These are either linked
with a hydroxyl group of a sugar-molecule or directly bound, or they can also be linked with carboxylic
and organic acids, amines, lipids and other phenols (Pandey & Rizvi, 2009).
1.3.1. Isolation of Antioxidants
Before a quantification of antioxidants can take place, isolation from their biological matrix must occur.
In what manner this isolation process takes place depends on the properties of the desired antioxidant.
As a general method has not yet been defined, various methods can be used in order to isolate a
bioactive compound from a plant. The efficiency of the extraction yield is determined by the properties
of the compound, and also by plant tissue and isolation parameters (Azmir et al., 2013). The first step
for isolation is the characterisation of the bioactive agent, differencing between three main families, the
terpenes and terpenoids (approximately 25,000 types), the alkaloids (approximately 12,000 types) and
the phenolic compounds (approximately 8,000 types) as well as the pathways metabolising them.
Secondary metabolites are built in the plant by either the shikimic acid pathway, the malonic acid
pathway, the mevalonic acid pathway or the non-mevalonate pathway. Phenolic agents are synthesised
through shikimic acid pathway or malonic acid pathway, whereas terpenes are built via mevalonic acid
pathway or non-mevalonate pathway as described in Figure 1 (Azmir et al., 2013). These pathways and
properties of the secondary metabolites determine what solvent, extraction method, extraction time,
and temperature should be used. The extraction of the active compound of plant material can be done
by a soxhlet extraction, maceration or hydrodistillation as part of the conventional isolation methods.
Non- conventional methods generally modifications of the conventional methods to reduce extraction
time, evaporation time and solvent. These non-conventional methods include the ultrasound-assisted
extraction, the pulsed-electrical field extraction, the enzyme-assisted extraction, the microwave-
assisted extraction, the pressurised-liquid extraction and the supercritical-fluid extraction (Azmir et al.,
2013).

ANTIOXIDANTS
[21]
Figure 1 Metabolism pathways of secondary plant compounds with antioxidant activity by Azmir et al. (2013)

ANTIOXIDANTS
[22]
1.4. Sonchus oleraceus L.
In New Zealand native plants are commonly used as food and medicine by the native Māori. Gould,
Thodey, Philpott and Ferguson (2006) tested 17 local and familiarised plants for their antioxidant
potential and quantified the low molecular weight antioxidant (LMWA) content. They then compared
them to the scavenging efficiency of blueberry fruits, which have been acknowledged as the fruit with
the highest antioxidant content and is the so called antioxidant super food. 8 out of the 17 tested plants
showed a higher level of LMWAs than blueberries including Sonchus oleraceus also known as sow
thistle or pūhā in the Māori culture (Wolfe & Liu, 2007). The LMWAs in Sonchus oleraceus include
flavones, flavonols, flavonoid glucosides, and phenolic acids as shown in Table 3 (Ou, Schmierer,
Rades, Larsen & McDowell, 2013; Yin, Si & Wang, 2008).
Table 3
Antioxidants found in the whole herb of Sonchus oleraceus Substance group Antioxidant compound
Flavones Luteolin
Apigenin
Flavonols Kaempferol
Quercetin
Flavonoid glucosides Luteolin-7-O-β-D-glucoside
Apigetrin
Astragalin
Isoquercetin
Phenolic acids Caftaric acid
Chlorogenic acid
Chicoric acid
Various studies have publicised that sow thistles have protective effects against depression in male
mice (Vilela, Padilha Mde, Alves-da-Silva, Soncini & Giusti-Paiva, 2010), prompt anti-inflammatory
response in rats (Vilela, Bitencourt, Cabral, Franqui, Soncini & Giusti-Paiva, 2010), and express
protective effects against premature cell senescence and ageing (Ou, Rades & McDowell, 2015). The
traditional use of pūhā by the Māori include an extract to reduce haemorrhaging during childbirth, for
stomach complaints, and sores. The milk of the stem was used as a sort of chewing gum. However,
medical efficacy of these traditional uses has not yet been scientifically established (Bell, 1890; Elsdon,
1942).
Research conducted by Yin, Si and Wang (2008) tested the antioxidant activity of pūhā with the DPPH
scavenging assay and concluded that constituents with more hydroxyl groups exhibit a higher

ANTIOXIDANTS
[23]
antioxidant activity, therefore supporting the superior antioxidant activity of the flavonols and phenolic
acids over their flavone counterparts. These results have been confirmed by Ou, Schmierer, Strachan,
Rades and McDowell (2014). Ou, Schmierer, Strachan, Rades and McDowell (2014) further showed
that the antioxidant yield extracted from pūhā is dependent on the post-harvest processing, age, and
parts of the plant used. These studies concluded, that the leaves express the highest antioxidant
concentration, while the yield of antioxidants depends on the age of the plant. They found that the main
compounds in pūhā are caftaric acid (Figure 2), chicoric acid (Figure 3) and chlorogenic acid (Figure
4), and that these exhibit the highest antioxidant activity, respectively compared to other polyphenols in
the plant. To test the scavenging efficiency of antioxidants in pūhā, McDowell, Thompson, Stark, Ou
and Gould (2011) used the DPPH radical scavenging assay. As the usefulness of the DPPH assay to
predict an in vivo response has been questioned, a cellular antioxidant activity (CAA) assay with HepG2
cells was also conducted (McDowell, Thompson, Stark, Ou & Gould, 2011). This study demonstrated
that the LMWAs were absorbed by human cells and continued to express their antioxidant activity
(McDowell, Thompson, Stark, Ou & Gould, 2011; Wolfe & Liu, 2007). Further experiments by Ou,
Schmierer, Strachan, Rades and McDowell (2014) conclude that the extraction process, drying process
and storage of pūhā leaves play an important role in obtaining the highest yield of antioxidants and to
maintain antioxidant activity. Therefore, an extraction with 70% Methanol, followed by freeze- or air-
drying process, and then to store the dry powder in a light protected container at a relative humidity of
40 to 60%, is advisable. (Ou, Schmierer, Strachan, Rades & McDowell)
However, the yield of the phenolic acids is not only dependant on the post-harvest process, it also varies
with the leaf position and therefore the age of the leaf, where the top leaves are generally defined as
the youngest and the bottom leaves as the oldest (Ou, Schmierer, Rades, Larsen & McDowell, 2013).
Leading to the suggestion that the leaves express a decrease in phenolic acid with age but also an
increase in the early stages of leaf development.
Figure 2 caftaric acid
Figure 3 chicoric acid
Figure 4 chlorogenic acid

ANTIOXIDANTS
[24]
1.4.1. Activity and Bioavailability of phenolic acids
The antioxidant activity can be determined with a DPPH (2, 2-diphenylpicrylhydrazyl) radical
scavenging assay or a CAA (cellular antioxidant activity) assay as previously mentioned (McDowell,
Thompson, Stark, Ou & Gould, 2011; Yin, Si & Wang, 2008). The fluorescence of the DPPH assay is
measured at 518 nm after incubation in micro-well plates or after a HPLC, as a post-column process
and is later compared to a standard reference such as gallic acid or ascorbic acid (Ou, Schmierer,
Rades, Larsen & McDowell, 2013; Yin, Kwon & Wang, 2007). The in vitro CAA assay gives a more
accurate prediction of the antioxidant activity in vivo compared to the DPPH method regarding the
uptake of exogenously applied antioxidants and the exposure of antioxidants to a biological matrix under
physiological conditions. As opposed to DPPH-assays, which are mainly performed in non-physiological
conditions regarding pH and temperature, and further forgo bioavailability and metabolism of
antioxidants (Wolfe & Liu, 2007). Nonetheless, a DPPH-assay is an easy and fast way to predict
antioxidant activity without the time requirement of cell culture. The CAA assay can be applied in HepG2
cells (human hepatocellular carcinoma cells) and the fluorescence caused by the oxidation of DCFH-
DA (2’,7’-dichlorofluorescin diacetate) to fluorophore DCF by generated oxygen radicals, which has a
fluorescence maxima at 538 nm upon extinction at 485 nm over a suitable time period (Wolfe & Liu,
2007). A higher antioxidant activity is expressed as a decrease in fluorescence, as the generation of
DCF is prevented, compared to untreated cells and the antioxidant activity is expressed as the EC50
values (effective concentration), calculated from the integrated area under the fluorescence and time
curve, shown in equation [7] (McDowell, Thompson, Stark, Ou & Gould, 2011).
𝐶𝐴𝐴 𝑢𝑛𝑖𝑡 = 100 − (∫𝑆𝐴 ÷ ∫𝐶𝐴 ) 𝑥 100 [7]
The DPPH is calculated as an IC50 (Inhibitory concentration where half the absorbance was
extinguished) (Ou, Schmierer, Rades, Larsen & McDowell, 2013). The 2, 2-diphenylpicrylhydrazyl
(DPPH) molecule is a stable free radical with a spare electron f or delocalization. This delocalization
gives the compound solution a deep violet colour. The antioxidant activity can therefore be measured
as the decrease of the intensity of the violet colour, when the antioxidant donates a hydrogen atom
(Alam, Bristi & Rafiquzzaman, 2013). The decrease in colour intensity is then monitored incubation at
517 nm.
% 𝐼𝑛ℎ𝑖𝑏𝑖𝑡𝑖𝑜𝑛 𝑜𝑓 𝐷𝑃𝑃𝐻 𝑟𝑎𝑑𝑖𝑐𝑎𝑙 = ([ 𝐴𝑏𝑟 − 𝐴𝑎𝑟] 𝐴𝑏𝑟⁄ )𝑥 100 [8]
Abr is the absorbance before reaction and Aar is the absorbance after the reaction, detecting the
decrease of violet colour (Alam, Bristi & Rafiquzzaman, 2013).

ANTIOXIDANTS
[25]
Figure 5 DPPH with antioxidant hydrogen donor
In pūhā, the DPPH value of the whole plant has a IC50 of 0.012 ± 0.003 mg/ml and 0.010 ± 0.005 mg/ml
and the CAA values are expressed as an EC50 of 3.21 mg/ml and is comparable to the EC50 values of
the “antioxidant superfood”, namely the blueberry fruit at 3.44 mg/ml (McDowell, Thompson, Stark, Ou
& Gould, 2011).
1.5. Auranofin
The xenobiotic agent auranofin (AFN) is an organic gold structure that is used to treat chronic
rheumatoid arthritis (Kean, Hart & Buchanan, 1997). Furthermore, AFN disrupts the cellular
transcription of Piroxiredoxin (Prdx) and the signalling cascade that follows (Angelucci et al., 2009). It
inhibits the removal of hydrogen peroxide, generated by respiratory chain, in submicromolar levels as
well as stimulating the production of hydrogen peroxide as it is a specific inhibitor of thioredoxin
reductase (Rigobello, Folda, Baldoin, Scutari & Bindoli, 2005). The reductase activates the
peroxiredoxin by splitting the disulphide bond of the peroxidatic cysteine and the resolving cysteine and
ending the catalytic cycle by reforming the disulphide bond with its counterpart thioredoxin (Flohé &
Harris, 2007). Inhibiting the activation of the catalytic cycle leads to an 80% decrease of H2O2 removal
(Angelucci et al., 2009). Furthermore, AFN affects the cellular stress response on a transcriptional level.
This mostly occurs through activating the Nuclear factor E2-Related Factor 2 (NRF2) via small
Musculoaponeurotic Fibrosarcoma proteins (MAF) heterodimers, an essential transcription factor for
regulating detoxifying enzymes, and resulting in the induction of Heme oxygenase (Hmox), a catalyst
for the production of ROS and also inhibitor of Prx I in micromolar levels (Flohé & Harris, 2007). The
disruption of the peroxiredoxin system by AFN leads to believe that it can be used to elicit stress
response in vitro as well as in vivo.

IN VIVO- DANIO RERIO
[26]
2. IN-VIVO MODEL
Sonchus oleraceus was proven to have sufficient radical scavenging abilities in HepG2 cells. The three
main antioxidants, for example chlorogenic acid, chicoric acid and caftaric acid express an EC50 of 3.21
mg/ml as a dried extract, determined with a CAA assay. This experiment conducted by McDowell,
Thompson, Stark, Ou and Gould (2011) proved that the LMWAs are absorbed by human cell and
express their antioxidant activity after cellular uptake. To determine if the antioxidant activity can uphold
not only in isolated cells but in a living organism, an in vivo model was established. A variety of in vivo
models have previously been established, such as the classic model with small mammalians e.g. mice
and rats (Alam, Bristi & Rafiquzzaman, 2013). Working with animals in research always have to be
approved by an ethics committee and have to follow specific guidelines, such as the ARRIVE guidelines
of the National Centre for Replacement, Refinement and Reduction of animals in research (NC3Rs)
(Kilkenny, Browne, Cuthill, Emerson & Altman, 2010). There are several animal models to assess
antioxidant activity and a variety of possible quantification methods. The most popular quantification
methods used in animal models are the lipid peroxidation assay (LOD) followed by measuring
superoxide dismutase (SOD) and catalase (CAT) activity (Alam, Bristi & Rafiquzzaman, 2013). The
anti-inflammatory properties of Sonchus oleraceus have already been proven by Vilela, Bitencourt,
Cabral, Franqui, Soncini and Giusti-Paiva (2010) using Sonchus extracts to treat inflammatory response
of rats with paw oedema.
In the present study AFN was chosen to induce oxidative stress for reasons previously discussed. The
zebrafish were selected asthe in vivo model of choice as zebrafish are equipped with a peroxiredoxin
system as well as the transcription factors NRF2, small MAF and the counterpart KEAP1. Furthermore,
Nakajima et al. (2011) reported the tissue specific target genes of NRF2 in zebrafish larvae and
concluded that stress responsive gene expression occurs in the gills and olfactory system. Another
study by Newman, Carleton, Leeke, Hampton and Horsfield (2015) explored the dose and time
dependency of AFN in zebrafish embryos, larvae, and adult regarding oxidative stress.
In the present study zebrafish embryos have been chosen to analyse the scavenging effeciency of
LMWAs of pūhā after oxidative stress induction with AFN.
2.1. The Zebrafish - Danio rerio
The zebrafish (Danio rerio) as an in vivo model has a number of advantages due to its similarities to
mammalian developmental phenotypes, its ability to conserve cell signalling, as well as offering various
genotypes with transparency, transgenic or morphing capabilities (Sipes et al., 2011). The similarities
to the human blood brain barrier, the endothelial cells and immunogenic responses make the zebrafish
an easily accessible, cost and time efficient animal model to process physiological responses and
furthermore allows for real time processing of pathological pathways especially during the embryonal
development stages (Fako & Furgeson, 2009). The transparency of the zebrafish embryos until early
larvae stage enables single cell imaging and transgenic fluorescence embryos, such as the SOX10:
GFPx cell line, allows cell pathways to be followed in the whole organism (McGraw, Nechiporuk &
Raible, 2008). In addition, zebrafish mutants with human based pathological conditions open up vast

IN VIVO- DANIO RERIO
[27]
possibilities for genetic and biological manipulations (Mugoni, Camporeale & Santoro, 2014; Rizzo et
al., 2013). Another advantage of this model is the high fertility of zebrafish, as they are able to produce
200-300 eggs a day every 5-7 days, and the embryos rapid ex utero development reduce time and cost
and are superior compared to commonly used rats and dogs for testing toxicity, efficacy and bio-
distribution of nanomedicines (Fako et al., 2009).
Zebrafish hatch in general after 48 hours post-fertilisation (hpf), meaning that the embryos break
through the chorion (embryonal sack). The chorion is a selective layered mantel with that has pores
from 0.5 µm to 0.7 µm in diameter, which allow interaction between the embryo and nutritious media,
as well as allow the embryo to breath (Fako & Furgeson, 2009). From the 5th to 6th day post-fertilisation
(dpf) additional larvae food can be administered dependent on the size of the fry. The fry reach their
fertile age at 3 months and live for 2 years in culture. Adult zebrafish are 30-40 mm long and weigh 300-
500 mg (Fang et al., 2012). The zebrafish is a tropical fish and can be mostly found in slow moving
fresh water streams in northeast India at several elevations as its natural habitat (Engeszer, Patterson,
Rao & Parichy, 2007).
Figure 6 Zebrafish stages from the eggs to the larvae, showing the chorion in embryonal stage (Rizzo et al., 2013)
The differentiation between female and male zebrafish is quite difficult in young fish but in adult fish
there are two major differences that are reliable. The female fish appears plumper around the stomach
region and is a silvery to pale pink colour, whereas the male fish are slimmer and more yellow in colour
than the female.
2.1.1. Breeding
Zebrafish, as mentioned previously, reach their fertile age at three months and can live under laboratory
condition up to two years. The female zebrafish is capable of laying 200 eggs and the male fertilise the
eggs ex vivo with his sperm. As the zebrafish fertility depends on a photoperiodic cycle, a small number
of embryos are produced every day during light exposure (simulating day/ night cycle). Grouping them
in an equal number of male and female fish ensure a mostly steady number of fertilised eggs
(Westerfield, 2000). The Embryo hatches 48 hpf after developing in a chorion. The zebrafish larvae
have consumed all nutrients of the yolk by the 5th to 6th day post fertilization and free feeding begins
at that point (Fang & Miller, 2012). The fry are kept in tanks and fed a rich diet, consisting of liver paste
and live pine shrimps. The photoperiodic circle should be timed in 14 hours of light and 10 hours of
darkness (Westerfield, 2000). The water temperature of the tank should be kept at a steady 28.5°C with
a continuous fresh water circulation (Fang & Miller, 2012). The outdated version of egg collection uses
sterile marbles at the bottom of the tank, to prevent the adult zebrafish eating the eggs, which can be
collected by siphoning them into a different container or a sieve after removing the adult fish. This
version of egg collection was replaced with a two compartment tank, where a smaller tank with wells

IN VIVO- DANIO RERIO
[28]
on the bottom, to allow the eggs to fall through, is inserted into an outer tank filled with lukewarm water
(Figure 7). The embryos can spawn by natural cross or individual pair-wise breeding, whereas the
natural cross breeding is less stressful for the fish as an in vitro fertilization. The individual pair-wise
breeding is preferred when individual fish are screened for gene and mutation sequences (Westerfield,
2000) and to ensure that the fish are not overbred (OZF, 2014).
Figure 7 adult zebrafish in a typical breeding tank set up, male (m) and female (f)
2.1.2. Development stages of zebrafish
The zebrafish embryo undergoes 8 stages of development from fertilization to larvae, the zygote (0-
0.75 hr), the cleavage (0.75-2.25 hr), the blastula (2.25-5.25 hr), the gastrula (5.25-10.33 hr), the
segmentation (10.33-24 hr), the pharyngula (24-48 hr), and the hatching phase (48-72 hr) as described
in detail in Figure 8 (Carney et al., 2006; Westerfield, 2000). In the transgenic type SOX10: eGFP, which
express green fluorescent protein (GFP), the development of the neural crest cells and their subsequent
migration can be followed with live imaging fluorescent microscopy from 10 hpf onwards as the neural
crest is clearly visible and the zebrafish start to take shape around the yolk sac. The neural crest cells
can differentiate in neurons, glia, cartilage, bone and melanocytes (Kwak, Park, Jung, Hwang, Kwon &
Kee, 2013).
m f

IN VIVO- DANIO RERIO
[29]
Figure 8 Embryogenesis of zebrafish in hours past fertilisation (hpf), with the cranial neural crest visible from around 10 to16 hpf, as highlighted Carney et al. (2006).
Upon analysing the migration habits of neural crest cells a decrease from the anterior level (head) to
the most posterior sections (tail) of the embryos can be observed (Kwak, Park, Jung, Hwang, Kwon &
Kee, 2013). The neural crest, i.e. notochord is first clearly visible at 10 hpf when the embryo is in the
segmentation phase of development (Figure 9 C). With time the notochord gets more pronounced and
neural crest cells start to differentiate into olfactory epithelial cells, melanocytes and glial cells, as well
as spinal cord and oligodendrocytes in the brain (Kwak, Park, Jung, Hwang, Kwon & Kee, 2013;
Westerfield, 2000).
Figure 9 Embryos between 10-13 hpf, with the notochord marked by the arrow in picture C. Picture E focuses on the notochord in between 2-4 somite stages, and G shows an embryo at 8-somite stage aged 13 hpf with parts of the spinal cord (sc) and optic primordium (op) visible (Westerfield, 2000).
During embryogenesis of the zebrafish naturally or environmentally evoked damages can occur. The
embryos are very sensitive in the first 24 hours after fertilisation, so alteration in the embryonal
development can be readily evoked in this time frame.
Environmental damage to the embryos can be caused with radiation, toxins, malnourishment, or by
gene knockout in zebrafish. A good approach to induce oxidative stress in zebrafish is the exposure to
UV-B radiation or toxins. In this research the cytotoxic drug AFN was used to cause oxidative stress in
nc op
sc

IN VIVO- DANIO RERIO
[30]
the zebrafish and damage progenies of neural crest cells, like cartilage and melanocytes (Newman,
2015; Rigobello, Folda, Baldoin, Scutari & Bindoli, 2005).

NANOPARTICLES
[31]
3. NANOPARTICLES
Nanoscience, defined as the study of phenomena and manipulation of materials on atomic, molecular
and macromolecular scales is a rapidly expanding field of research which has led to extraordinary
developments in the design, production, characterisation and application of structures, devices and
systems on a nanometre scale (Onoue, Yamada & Chan, 2014). For the last 35 years nanotechnology
has been explicitly targeted towards developing new drug delivery systems (DDS). The principal goals
in the development of nanomedicines using nanoparticles and their variations (i.e. nanofibers,
nanosheets) are as followed (De Jong & Borm, 2008; Parveen, Misra & Sahoo, 2012):
specific drug targeting and delivery
greater safety and biocompatibility
faster development of new medicines with higher safety margin
improved pharmacokinetic behaviour.
The general problem with the application of antioxidants as oral nutritional supplements is their low
solubility, instability and poor permeability, amounting to poor oral bioavailability (McDowell, Thompson,
Stark, Ou & Gould, 2011). The use of nanoparticles (NPs) could be an effective way of delivering
antioxidants, as they could increase their cellular uptake, permeability, and stability (De Jong & Borm,
2008; Pool et al., 2012). Nanoscale particles can be designed to cross various biological barriers such
as the blood brain barrier and can therefore increase the solubility and bioavailability of poorly soluble
agents (De Jong & Borm, 2008). The downside of the vast distribution and increased cellular uptake of
NPs is a higher chance of toxicity through accumulation of the NPs themselves, even if they are able
to reduce the toxicity of the enclosed compounds. A wide range of nanocarriers have been developed
to date, including polymeric NPs, ceramic NPs, magnetic NPs, polymeric micelles and dendrimers,
liposomes, silicon or carbon materials, and solid lipid nanoparticles (Parveen, Misra & Sahoo, 2012;
Wilczewska, Niemirowicz, Markiewicz & Car, 2012). Further modifications on the surface of NPs can
help with selectivity, solubility, permeability, as well as toxicity and can be designed to include, for
example, cell penetrating-peptides (CPP), poly ethylene glycol (PEG), antibodies and other ligands.
Furthermore, nanoparticles generally display a solid and spherical morphology, exist in a size range
from 10 to 1,000 nm, and are made from natural or synthetic polymers (Danhier, Ansorena, Silva, Coco,
Le Breton & Préat).
3.1. Nanomedicine as a Drug Delivery System
The vast possibilities for manufacturing nanomedicines make it mandatory to ensure that the system is
fit for purpose regarding the chosen drug and desired biological target or location, in order to minimalise
any side effects associated with the delivery system or the delivered agent. Most rug side effects occur
due to high dosage, unspecific targeting, low therapeutic window and limited effectiveness on a target
(Wilczewska, Niemirowicz, Markiewicz & Car, 2012). Developing the most effective delivery system/
drug combination requires careful consideration of the physical properties of the compounds to be
delivered, as well as the characteristics of the drug target and its surroundings. Targeting specific

NANOPARTICLES
[32]
locations in a living organism are influenced by its pathological state, as a pathological system differs
from its physiological counterpart, not only on a cellular level but also at the whole organism.
Considering the pathology of the target site, as well as the interactions between the chosen delivery
system and the desired biological agent when designing drug delivery systems can lead to drug
therapies, which have greatly increased efficacy and selectivity compared with their free drug
counterparts.
The method of incorporating the desired drug with nanocarriers must also be considered. This can
either be achieved by absorption, covalent binding or encapsulation of the drug. Covalent binding of the
drug to the delivery system has been demonstrated to create significant advantages, it enables control
over the amount of drug molecules binding to the nanocarrier and therefore the amount of
therapeutically relevant compound delivered to target cell (Parveen, Misra & Sahoo, 2012; Wilczewska,
Niemirowicz, Markiewicz & Car, 2012). As a covalent bond is very stable, a prodrug for example can
be used to deliver a drug safely to the target side. Specific enzymes, pH levels or temperature uniquely
created by the target cell can be used release active drug upon contact (Popat, Ross, Liu, Jambhrunkar,
Kleitz & Qiao, 2012). On a cellular level, nanocarrier uptake in cells can vary, for example nanoparticle
accumulation is generally higher in inflamed tissue or cancerous tissue as opposed to healthy tissue,
and drug targeting to these location can either be achieved by using passive or active targeting as a
way of locally accumulating the drug (Parveen, Misra & Sahoo, 2012).
3.1.1. Passive Targeting
Passive targeting, commonly associated with tumour tissue, occurs when preferential accumulation of
nanoparticle arise in tissues with a disrupted endothelial barrier, due to a phenomenon known as the
enhanced vascular permeability and retention (EPR) (Torchilin, 2010). The release of the compounds
enclosed in nanocarriers bigger than 500 nm can be triggered by a change in the physiological
environment of the diseased tissue using mechanism such as pH, temperature, osmolality or enzymatic
activity (Wilczewska, Niemirowicz, Markiewicz & Car, 2012). A similar phenomenon can be observed
in inflammatory or infected tissues and may be related to elevated levels of bradykinin in the affected
area (Parveen, Misra & Sahoo, 2012). The EPR effect in cancer tissue differs from that observed in
inflammatory or infected tissue in the duration of the retention period of the nanocarrier. In the former
condition, the EPR effect is longer lasting due to the impaired lymphatic drainage, whereas in
inflammatory tissue, the lymphatic drainage system remains functional resulting in less accumulation of
nanoparticles. Furthermore, swelling induced by. bradykinin and other inflammatory mediators
generally within days (Parveen, Misra & Sahoo, 2012; Wilczewska, Niemirowicz, Markiewicz & Car,
2012). Prolonging circulation of systemically administered nanocarriers can be achieved for example
via PEGylation of the nanoparticle surface, which masks the nanoparticle and therefore hinder its
opsonisation and clearance by the reticuloendothelial system (RES), leading to enhanced accumulation
in the target tissue such as a tumour microenvironment (Torchilin, 2010). Several nanocarriers have
previously been developed, to exploit the passive targeting due to the EPR effect, including Doxil®, a
PEGylated liposome encapsulating doxorubicin, a chemotherapeutic agent. This modified formulation
is approved for treating advanced ovarian cancer, metastatic breast cancer and AIDS induced Kaposi’s

NANOPARTICLES
[33]
sarcoma (Parveen, Misra & Sahoo, 2012). Over the years Doxil® has shown superior effects in
treatment of these diseases compared to freely administered doxorubicin (Barenholz, 2012). Using the
EPR effect through prolonging circulation of encapsulated drug, surface modified nanocarriers could
lead to an enhanced accumulation in target tissue and therefore is a useful method for delivering agents
with small therapeutic windows and high cellular toxicity (Akao et al., 2010; Parveen, Misra & Sahoo,
2012).
The main premise of using the EPR effect depends on the compromised integrity of the endothelium,
but in some pathological cases the integrity of the vascular endothelium remains and therefore the
extent of nanoparticle accumulation can vary between disorders (Torchilin, 2010).
3.1.2. Active targeting
An alternative way for drug targeting is an active approach by conjugating the nanoparticles with
receptor-specific ligands. The targeting moiety on the nanoparticle couples with specific receptors
expressed on the cell of interest, which acts to target the nanocarrier specifically to the diseased tissue
(Sykes, Chen, Zheng & Chan, 2014; Torchilin, 2010). Release of the encapsulated content such as
antigens and toxins can be subsequently achieved within the targeted diseased cells upon contact. This
selectivity prevents the nanocarriers from releasing the therapeutic drug in healthy tissue (Sykes, Chen,
Zheng & Chan, 2014; Torchilin, 2010). A study by Kocbek, Obermajer, Cegnar, Kos and Kristl
(2007)shows that the active targeting of epithelial breast tumour cells with poly-lactic-co-glycolic acid
(PLGA) nanoparticles conjugated to monoclonal antibody results in a better cellular uptake and
selectivity compared to non-antibody conjugated particles (Kocbek, Obermajer, Cegnar, Kos & Kristl,
2007). The same conclusion was drawn by Schleich et al. (2014) using PLGA nanoparticles loaded with
paclitaxel and superparamagnetic iron oxide for tumour targeting, showing an 8-fold increase of
magnetic particles in targeted cells compared to non-conjugated particles. The half-life of the coated
particles was also increased by nine days, when applied in combination (Schleich et al., 2014). Using
DNA or RNA oligonucleotide sequences, called aptamers, for high specificity and affinity is a third
possibility to active target pathological impaired environment with polylactic- nanoconjugates (Parveen,
Misra & Sahoo, 2012). Once the right drug delivery system is chosen for the specific application and
target site, the distribution and half-life are essential for the system to reach the target, therefore the
pharmacokinetics and pharmacodynamics of the applied system have to be analysed.
3.2. Pharmacokinetics and pharmacodynamics
An efficient drug delivery system has the ability to move freely and cross various barriers throughout
the distribution system (blood, tissues and cells). The smaller the blood vessels the more restricted
movement becomes, making it increasingly difficult to cross the numerous physical barriers. The small
size of nanoparticles, varying from 10 to 1,000 nm, opens the possibility of delivering drugs to areas of
the body with limited access (Gupta & Kompella, 2006). The size of the nanoparticle should ideally be
smaller than the narrowest cross sectional diameter of the thinnest capillaries, which is under 2,000 nm.
To achieve efficient transport, the nanoparticles administered should be smaller than 300 nm (Gupta &
Kompella, 2006). From the blood, nanoparticles then have to cross cell layers to reach their target. The

NANOPARTICLES
[34]
blood vessel is composed of three layers, the endothelium, the tunica media composed of smooth
muscle cells enclosed within an internal and external elastic membrane, and the adventitia (Figure 10).
Figure 10 graphic of a blood vessel showing the location of the Endothelium, tunica media and adventitia by stemcellsfreaks.com
There are two possible ways to cross the blood barrier, either transcellular or paracellular. Taking the
transcellular route, the particle has to enter the cell on the luminal side and exit through the basolateral
side to reach the tissue. To utilise the paracellular route the particle is not required to enter the cell, but
it has to pass through junctions between adjacent cells (Gupta & Kompella, 2006). Under normal
physiological circumstances the cell barrier remains intact and ions, larger molecules and leukocytes
can cross blood vessel layers via tight or adherence junctions, also known as the apical junction
complex (Gupta & Kompella, 2006). The endothelium barrier varies in its permeability depending on the
location, for example the blood brain endothelium expresses a high barrier function whereas the
vascular endothelium expresses a higher permeability (Gupta & Kompella, 2006). The main way for
nanoparticles to pass through the lipid bilayer of cells is via transcellular uptake via different forms of
endocytosis, such as pinocytosis and phagocytosis, as described in Figure 11 (Treuel, Jiang &
Nienhaus, 2013). The lipid bilayer membrane regulates the sorting and transport of materials in and out
of cells via the major pathways of cellular uptake. However, only specialised cells such as macrophages
are capable of phagocytosis to internalise larger particles, whereas four basic types of pinocytosis,
currently known, are common in almost all cells. Those cells are capable of internalizing particles via
micropinocytosis, clathrin- mediated endocytosis, caveolae- mediated endocytosis and clathrin and
caveolin independent mechanism (using other mediators), also known as lipid rafts. Mediators like
clathrin, caveolin, actin, opsonin, and dynamin initiate internalization upon surface binding of
nanoparticles (Gupta & Kompella, 2006). The properties of nanoparticles such as shape, surface
charge, size and surface chemistry modulate the uptake efficiency and the uptake location (Treuel,
Jiang & Nienhaus, 2013). Depending on the exposure time to bloodstream, nanoparticles can conjugate
to the surface with opsonin proteins, further attracting macrophages of the mononuclear phagocytic
system (MPS) and resulting in accumulation in MPS organs such as the liver and spleen and eliminated
either via renal or hepatic clearance (Conner & Schmid, 2003).

NANOPARTICLES
[35]
Figure 11 Transportation of particles through the plasma membrane, uptake of larger particles via phagocytosis, specific particles via receptor mediated endocytosis, often clathrin mediated, and small particles via pinocytosis
Pharmacokinetic parameters such as bioavailability, distribution, uptake efficiency and pharmacological
half-life can depend on the surface of the nanoparticles (Treuel, Jiang & Nienhaus, 2013). Various
studies have shown that the association of proteins, such as TF (transferrin) or HSA (human serum
albumin) to NPs supresses the cellular uptake compared with bare NPs or conjugation NPs with PEG
further leading to an increase in opsonisation and a fast elimination (Treuel, Jiang & Nienhaus, 2013).
Nanoparticles with a PEG surface lead to a decreased uptake by macrophages, thus concluding that
surface modifications lead to an increase in bioavailability (Treuel, Jiang & Nienhaus, 2013). Some
surface modification can decrease cellular uptake, increase in half-life and still can protect healthy tissue
from unnecessary drug exposure (Onoue, Yamada & Chan, 2014).
A further point to consider is the influence of the cell cycle on nanoparticle uptake. In tumour cells with
enhanced cell growth, it is believed that a peak concentration of drug-containing NPs can lead to a
better therapeutic effect (Abouzeid & Torchilin, 2013). Research has shown that the cellular peak
concentration of NPs should be reached in cell phase G2/M before cell division, even if the nanoparticle
concentration will decrease with cell division both, the mother and daughter cells, will carry active agent
(Kim, Aberg, Salvati & Dawson, 2012).
Once the NPs cross the lipid bilayer and are distributed in the cell, the intracellular fate of the internalised
NPs begins. The nanoparticles are either directly transported into the cytosol when internalised through
direct entry by membrane fusion, or in membrane-confined vesicles by endocytosis (Oh & Park, 2014).
Membrane-confined NPs can be sorted through recycling pathways or towards multivesicular bodies
(MVBs) and lysosomes, the most common destinations for nanoparticles. Nanoparticles transported
with motor molecules (ATP- dependent) can find their way to the perinuclear region of cells (Oh & Park).

NANOPARTICLES
[36]
Specific surface properties enable NPs to escape the confines of the maturing endolysosomes and
enter cytosol, leading to intracellular localization with or without further distribution to other subcellular
compartments. Therefore, the intracellular fate of a nanoparticle depends on the internalization
pathway, which depends on the surface properties of the particles (Yeo, 2013).
After cellular uptake, the elimination process of nanoparticles plays an essential role regarding
retention, drug release profile and toxicity. Next to the dismantling and degradation of NPs in lysosomes,
exocytosis is required to remove the nanoparticles in membrane-insulated recycle vesicles (Oh & Park,
2014). The duration of exocytosis is dependent on the size, surface modification, and charge of the
nanoparticle. The elimination process can last from one hour to several days depending on size as well
as cell type (Oh & Park, 2014). Nanoparticles then have to be cleared in a similar manner to other
drugs, they are either eliminated by the liver, spleen or the kidney. As mentioned previously,
nanoparticles demonstrate different behaviour according to their size and surface charge, hence
depending on these characteristics, can either accumulate in the liver, spleen or other organs (kidney),
some can even express a long blood circulation life (Hirn et al., 2011). An accumulation rate of 91% to
96% in the liver of a rat has been observed for nanoparticles ranging from 5 to 100 nm (Hirn et al.,
2011). Whereas particles below 5 nm express a higher dependency to surface charge regarding
elimination than larger particles, for example 2.8 nm gold-nanoparticles with a positive surface charge
accumulate significantly lower in a rat liver as negatively charged ones, preferring to accumulate in
other organs instead (Hirn et al., 2011). For renal elimination, nanoparticles are not just filtered by size
and surface charge but also by the capability of binding to proteins (Longmire, Choyke & Kobayashi,
2008). The kidney is designed as a size excluding filter to keep proteins in the system and let small
molecules, with a molecular weight < 50 kDa or equal to 5.5 nm of particle diameter, pass through for
excretion (Longmire, Choyke & Kobayashi, 2008). Small negatively charged nanoparticles which
accumulate in the kidney, are prone to bind albumin (the smallest protein) resulting in surface coverage
which, increases particle diameter to > 5.5 nm, therefore becoming too big for excretion (Longmire,
Choyke & Kobayashi, 2008).
3.3. Types of Nanoparticles
Several variations of nanocarriers are extensively studied, for drug administration and diagnostic
evaluation. These nanocarriers include liposomes, polymer nanoparticles, carbon nanoparticles, gold
particles, solid lipid nanoparticles, dendrimers, magnetic and metal based nanoparticles and ceramic
particles. When choosing the nanocarrier that is best suited for the desired model, the advantages and
disadvantages of each carrier needed to be taken under consideration. Therefore, when working with
nanocarrier formulation the properties of the drug and target tissue as well as the administration route
define which nanocarrier should be most effective.
In the presented study the most important premises of the nanocarrier was that it was biodegradable
and able to load the hydrophilic phenolic acids of pūhā, as well as not eliciting oxidative stress upon
administration. As part of the selection process some of the most commonly used nancarriers were
considered.

NANOPARTICLES
[37]
3.3.1. Liposomes
Liposomes are artificial, single or multilaminar vesicles with a lipid bilayer membrane enclosing aqueous
compartments, with a size range of 80-300 nm (Onoue, Yamada & Chan, 2014). The spherical vesicles
are composed of phospholipids or steroids (e.g. cholesterol) and are prepared by either the dehydration-
rehydration method, reverse-phase evaporation vesicle method or by the proliposome method
(Wilczewska, Niemirowicz, Markiewicz & Car, 2012). In general, liposomes have a tendency for non-
specific uptake, fast clearance and opsonisation, and additional unwanted side effects, inducing
macrophage death via altering their gene expression, a prolonged exposure and accumulation can also
be harmful to the kidney and spleen (Wilczewska, Niemirowicz, Markiewicz & Car, 2012). To overcome
these limitations and side effects, studies have demonstrated that liposomes can be coated with
hydrophilic polymers such as PEG to evade opsonisation and accumulation to some degree, as well as
enhance selectivity and decrease immune response (Onoue, Yamada & Chan, 2014; Yeo, 2013). The
drug release from liposomes depends on their membrane composition, and can be influenced by the
pH and osmotic gradient of the surrounding environment (Wilczewska, Niemirowicz, Markiewicz & Car,
2012). The uptake efficiency of liposomes can be increased by surface modification by enabling the
use of active or passive targeting as well as endocytosis, absorption, fusion and lipid transfer (Onoue,
Yamada & Chan, 2014). Nevertheless, liposomes have been demonstrated to enhance
pharmacokinetic properties of agents with a small therapeutic index, rapid metabolism, as well as
decreasing their side effects and increasing overall anticancer activity in vitro and in vivo (Wilczewska,
Niemirowicz, Markiewicz & Car, 2012). Moreover, liposomes improve circulation time and systemic half-
life. Therefore, liposomes are a popular vehicle for drug delivery and several liposome-based
formulation have already been approved by the Food and Drug Administration (FDA) for clinical use
and trail (Wilczewska, Niemirowicz, Markiewicz & Car, 2012).
3.3.2. Lipid nanoparticles
This type of nanoparticle is based on lipids, such as purified triglycerides, complex glyceride mixtures,
monoglycerides, hard fat or waxes that remain in a solid state at body temperature. The main drug
delivery vehicles are solid lipid nanoparticles (SLN), nanostructured lipid carriers (NCL) and lipid drug
conjugates (LDC) and are mostly used for dermal, oral, or parenteral application. They can be fabricated
either by high-pressure homogenization or nano-emulsion technique and increase physical stability of
the active agents and further allow a modulation of drug release (Onoue, Yamada & Chan, 2014).
However, some disadvantages have occurred using first generation of SLN system including low
loading, drug expulsion after recrystallization and a requirement for high water content in dispersion
(Wilczewska, Niemirowicz, Markiewicz & Car, 2012). Therefore, the NLCs and LDCs have been
invented to minimise these disadvantages. The entrapment efficiency and drug expulsion have been
improved by developing NLCs and its three subtypes e.g. imperfect NLC, multiple NLC and amorphous
NLC, by mixing solid lipids with liquid lipids (Wilczewska, Niemirowicz, Markiewicz & Car, 2012). All
three models are mostly used for dermal application, but SLN have shown promising results in oral
administration of insulin, protecting the drug in gastrointestinal tract and improve gastrointestinal uptake
(Wilczewska, Niemirowicz, Markiewicz & Car, 2012). An in venous administration of SLN leads to a

NANOPARTICLES
[38]
longer systemic circulation due to decreased clearance and a higher absorption in tissues compared to
the drug itself (Onoue, Yamada & Chan, 2014).
3.3.3. Polymeric Nanoparticles
Polymeric nanoparticles are made from synthetic polymers, including poly-ε-caprolactone,
polyacrylamide, poly-acrylate, polyethylene glycol (PEG), as well as pseudo-synthetic polymers like
poly- (amino acids), or natural polymers such as dextrin, hyaluronic acid, chitosan or gelatine (Onoue,
Yamada & Chan, 2014; Wilczewska, Niemirowicz, Markiewicz & Car, 2012). The particle size ranges
from 10 to 1,000 nm and have shown good encapsulation of poorly soluble drugs and protect against
enzymatic and hydrolytic degradation (Onoue, Yamada & Chan, 2014). Polymeric nanoparticles can be
further classified into biodegradable, including poly-L-lactide (PLA) and poly- glycolide (PGA) and non-
biodegradable, like polyurethane (Wilczewska, Niemirowicz, Markiewicz & Car, 2012). Polymeric
nanoparticles can exist as spheres or capsules, depending on the process of preparation used.
Preparation techniques include nanoprecipitation, emulsion-diffusion, double emulsification, emulsion-
co-acervation and polymer- coating (Onoue, Yamada & Chan, 2014; Parveen, Misra & Sahoo, 2012).
Nanospheres adsorb active compounds in a matrix-like surface and they are either entrapped or
dissolved within the structure. Polymeric nanoparticles offer several advantages compared to other drug
delivering systems such as high stability during storage, controlled release, multiple administration
routes, and prolonged activity (Parveen, Misra & Sahoo, 2012). Biodegradable polymers are generally
preferred, as they have already been widely used and have FDA approval (Onoue, Yamada & Chan,
2014). Such drugs approved by the FDA are, for example Abraxane and Genexol-PM, with the
therapeutic agent Paclitaxel, a chemotherapeutic drug mostly used to treat prostate, breast and lung
cancer (Kim et al., 2007; Zhao et al., 2015). Whereas, Abraxane is a Cremophor based nanoparticle
albumin- bound Paclitaxel formulation and Genexol-PM is a Cremophor free micelle structure diblock
copolymer of polyethylenglycol and polylactide, both drug formulations show an increase in
bioavailability as well as reduced toxicity of paclitaxel at higher doses (Desai et al., 2006; Kim et al.,
2007; Werner et al., 2013). The main advantage of using biodegradable polymers is that they undergo
hydrolysis when exposed to the body and degrade into their biodegradable metabolite monomers like
lactic acid and glycolic acid, which are non-toxic with cells and tissue. Furthermore the polymeric
conjugates are stable in blood, non-toxic, non-thrombogenic, non-immunogenic and non-inflammatory
as well as non-activating to neutrophils and the reticuloendothelial system (Wilczewska, Niemirowicz,
Markiewicz & Car, 2012).
3.3.4. Dendrimers
Dendrimers are well defined synthetic macromolecule structures with three distinguished areas, the
core, the dendrons and the surface active groups . The core of a dendrimers defines the type of
dendrons binding and subsequently the surface coating. It is a single atom or molecule with at least two
identical functional groups to which the dendrons are attached. Typical dendrons include polymers such
as polyamidoamines (PAMAMs), polyesters, polyamines, polyamides, carbohydrates and DNA
(Wilczewska, Niemirowicz, Markiewicz & Car, 2012). The dendrons are identified as generation
numbers (G1, G2, G3, etc.). Varying the generation numbers is a way to enhance drug loading capacity

NANOPARTICLES
[39]
(Parveen, Misra & Sahoo, 2012). The surface active functional groups can be altered to increase the
solubility of dendrimers (Parveen, Misra & Sahoo, 2012; Wilczewska, Niemirowicz, Markiewicz & Car,
2012).
3.3.5. Carbon Nanomaterials, Ceramic Materials, Metal-
based Materials, Magnetic Materials
Carbon based nanomaterials are known for their unique geometrical structures of hollow spheres and
ellipsoids, also called fullerenes, cylinders, and nanotubes forming either multilayers or single layers
(Parveen, Misra & Sahoo, 2012; Wilczewska, Niemirowicz, Markiewicz & Car, 2012). The active drugs
can be encapsulated or adsorbed at the surface or in open spaces, where encapsulation protects the
compound from degradation. Modulation of the drug release can subsequently be achieved by sealing
the nanotubes to various degrees with surface modification using, for example, polypyrrole films.
Furthermore, target selectivity and biocompatibility can be achieved through surface derivation with
agents such as folic acid or epidermal growth factors, or amphiphilic copolymers and PEG layers
respectively (Wilczewska, Niemirowicz, Markiewicz & Car, 2012). Nonetheless, despite the well-defined
stable structure of the nanotubes and fullerenes, cellular toxicity is still a major issue with these systems
(Wilczewska, Niemirowicz, Markiewicz & Car, 2012).
Ceramic nanomaterials are used for biomacromolecular therapeutic drug delivery, such as enzymes
and proteins. Silica, alumina and titanium and other materials such as yttrium oxide and cerium oxide
form ultra-small sized (less than 50 nm) and porous particles (Parveen, Misra & Sahoo, 2012;
Wilczewska, Niemirowicz, Markiewicz & Car, 2012). Due to their size and porous characteristics, they
have a high loading capacity and are able to evade the uptake by the RES (reticuloendothelial system).
Furthermore, they are effective in protecting enzymes and proteins from denaturation induced by
changing pH and temperature (Parveen, Misra & Sahoo, 2012). Surface modifications to enhance
target-specific ligand conjugation can be made with for example monoclonal antibodies. To prevent
toxicity the particles should be small in size (< 50 nm), as large particles are prone to induce oxidative
stress, lipid peroxidation, membrane damage and induce pro-inflammatory responses, apoptosis and
in severe cases haemolysis (Wilczewska, Niemirowicz, Markiewicz & Car, 2012).
The most commonly used metallic nanoparticles are gold particles, which have found widespread uses
in anticancer applications, especially for drug resistant tumour cells and cancer biomarkers (Parveen,
Misra & Sahoo, 2012). The advantage of the Au (gold) NPs is their nontoxic and biocompatible
behaviour. Their physicochemical characteristics, like ultra-small size (< 50 nm), large surface area to
mass ratio, high surface reactivity and surface plasmon resonance bands (SPR) make them desirable
as a drug delivery system (Parveen, Misra & Sahoo, 2012). Silver nanoparticles are also widely used
for topical application, due to their antimicrobial and wound- healing properties, as well as reducing
inflammation and modulation of fibrogenic cytokines. Other metallic nanomaterials include aluminium,
iron, zinc and titanium but these demonstrate a tendency to cause unpredictable toxicity in cells and
tissues (Parveen, Misra & Sahoo, 2012). A study by Vicario-Parés et al. (2014)has shown a toxic effect
of ZnO2, TiO2, and CuO2 NPs on zebrafish embryos regarding their hatching habits and increase in
malformations. Iron nanoparticles, developed for magnetic resonance imaging, photo-thermal therapy,
NANOPARTICLES
[40]
tissue repair and drug delivery have been associated with oxidative stress and cardiovascular diseases
(Wilczewska, Niemirowicz, Markiewicz & Car, 2012). Nevertheless, iron oxide particles are approved
by the FDA for diagnostic purposes as a magnetic resonance imaging contrast agent for lung cancer
metastasis (Riegler et al., 2013). However, surface modifications with natural polymers such as dextran,
PEG and PVP can reduce toxicity and help bypass uptake by macrophages (Wilczewska, Niemirowicz,
Markiewicz & Car, 2012).

NANOPARTICLES
[41]
3.4. Nanotoxicity
To understand the possible toxicity of nanoparticles we have to look at the various possibilities of cellular
uptake and characteristics such as size, shape, charge, surface modification etc. Various methods for
predicting the toxicity of nanoparticles have been established to examine these physicochemical
properties, see Table 4 below, based on work conducted by Love, Maurer-Jones, Thompson, Lin and
Haynes (2012).
Table 4
Characterizing nanoparticle properties with most common characterisation methods, methods used in present study are presented in bold
Physicochemical
characteristics Common characterisation methods
Size (distribution) TEM, AFM, DLS, NTA
Shape TEM, AFM, UV-Vis
Agglomeration or
aggregation state DLS, UV-vis
Crystal structure XRD, ED
Surface chemistry/
charge/ area
AES, EELS, XPS, solid-state NMR, Zeta-potential, BET,
MALDI-TOF MS
Stability over time/
dissolution DLS, UV-vis, ICP-MS, colorimetric assays
Dosing metric HPLC, UV-vis
Uptake ICP-AES, ICP-MS, TEM, fluorescence, flow cytometry, NAA
Abbreviations: TEM-transmission electron microscopy; AFM-atomic force microscopy; DLS-dynamic light scattering; NTA-
nanoparticle-tracking analysis; UV-vis-spectroscopy; XRD-X-ray diffraction; ED-electron diffraction; AES-Auger electron
spectroscopy; EELS-electron energy loss spectroscopy; NMR-nuclear magnetic resonance; BET- nitrogen adsorption/desorption
isotherm; MALDI-TOF MS-Matrix assisted layer desorption ionization time of flight mass spectroscopy; ICP-AES- inductively
coupled plasma atomic emission spectroscopy; ICP-MS-inductively coupled plasma mass spectrometry; NAA-neutron activation
analysis; HPLC-high pressure liquid chromatography.
The vast variety of nanocarriers help to diminish the cytotoxic effects of chemotherapeutics or other
drugs with a narrow therapeutic index, however in vitro and in vivo testing has shown that some
nanocarrier express cytotoxicity, trigger allergic response, inflammation or oxidative stress themselves.
These toxic reactions result in an increase of ROS and RNS, inflammatory events, DNA damage, multi-
nucleus formations and fibrosis. Further the accumulation in cells by continuous exposure or long-term

NANOPARTICLES
[42]
use has to be considered when applying nanoparticles with a negative charged surface (Onoue,
Yamada & Chan, 2014). When formulating positively charged nanoparticles similar effects to the
negatively charged particles, like cell proliferation, differentiation and pro-apoptotic genes in human
epithelial cells are observed in in vitro viability and functionality assays (Elsaesser & Howard, 2012;
Love, Maurer-Jones, Thompson, Lin & Haynes, 2012). The described viability assays and functionality
assays which have been developed to estimate in vivo response to nanoparticle exposure. In functional
assays, cell proliferation and general health of dividing cells can be measured by analysing newly
transcribed DNA (Love, Maurer-Jones, Thompson, Lin & Haynes, 2012). Furthermore the influence on
gene expression, immunogenicity and oxidative stress, can be analysed with functional assays using
different cell lines and marker either associated with the particles or added to cell line (Love, Maurer-
Jones, Thompson, Lin & Haynes, 2012). Viability assays are used to assess cell viability upon
nanoparticle exposure. These assays analyse the metabolic activity of cells, often using fluorescence
changes to detect if nanoparticles interfere in protein synthesis, or if haemolysis occurs and further
measure apoptosis or necrosis, by measuring apoptotic protein levels (Love, Maurer-Jones, Thompson,
Lin & Haynes, 2012). As described previously each type of nanoparticle has its own advantages and
disadvantages that have to be considered prior to formulating a drug delivery system.
3.4.1. Characterisation
The most important physical characterisations of nanoparticles are the size, size distribution, surface
charge and entrapment efficiency. There are multiple methods to determine nanoparticle properties
including dynamic light scattering (DLS), static light scattering/ Fraunhofer diffraction, nuclear magnetic
resonance (NMR), scanning electron microscopy (SEM) and transmission electron microscopy (TEM)
(Anand et al., 2010; Gupta & Kompella, 2006; McCall & Sirianni, 2013)
Dynamic light scattering (DLS) is a photo correlation spectroscopy, which records the variation in the
intensity of scattered light on a time- dependent scale. The individual size of the particles experience
Brownian motion (the random motion of molecules in a disperse system), that influences the intensity
of light scattering. The fluctuation in intensity is directly correlated with the rate of diffusion of the
molecule in the solvent and the homogeneity of the molecules. The sample is quantified and fit to an
autocorrelation function that corresponds with the constant diffusion coefficient. The standard
assumption of spherical size, low concentration and known viscosity of the suspending medium, is
correlated with the sample and therefore the particle size can be calculated (Gupta & Kompella, 2006;
Pecora, 2013). The homogeneity of the particle size is expressed by the polydispersity-index (PDI or
PI), the smaller the index the more homogeneity is expressed by nanoparticles.
To determine the surface charge of nanoparticles the Zeta (ζ) - potential is measured. Between the
outer phase (phase I or aqueous phase) and the inner phase (phase II, dispersed nanoparticles) a
potential difference is developed. Molecules in the polar phase point their excess electrons to the
opposite charge around phase II (mostly lipophilic) (Hunter, Ottewill & Rowell, 2013). Therefore, more
positively charged ions are drawn to the surface. A border of the inner and outer phase is formed, called
the electrical double layer, which has on the particle surface positively charged ions and in the
surrounding layer negatively charged ions (Lyklema, 1995). This basic potential is not measureable, as

NANOPARTICLES
[43]
it is the non-electric response to the outer phase of the emulsion and leads to the development of an
electric surface charge. Following this charge an electric field is created and several layers are built,
between the bulk liquid and the particle, as a consequence of the counter charge created by thermal
motion that mirrors the electric surface charge (Lyklema, 1995). To measure the potential, the outer ion
layers are sheared by mechanic or electrical forces. These electrical double layers are, from the surface
of particle inwards: the stern layer/plane and the shear plane/negatively charged diffuse layer. At the
later the zeta potential is measured, shown in Figure 12. Once the applied forces reach the layer, a
jump in potential is measureable, and therefore the zeta-potential can be determined (Hunter, Ottewill
& Rowell, 2013).
Figure 12 Distribution of electrical potential in disperse systems, when particle interact with other particles as well as outer phase
The drug loading efficiency (DL) and the entrapment efficiency (EE) are also crucial parameters which
need to be established in addition to the size and surface charge of the nanoparticle. The DL and EE
express the amount of drug entrapped in particles in ratio with the total amount of used drug (EE) or in
ratio with the amount of total polymer used for encapsulation (DL) as described in the equations below
(Srivastava et al., 2013).
𝐸𝐸 % = 𝑎𝑚𝑜𝑢𝑛𝑡 𝑜𝑓 𝑑𝑟𝑢𝑔 𝑖𝑛 𝑝𝑜𝑙𝑦𝑚𝑒𝑟𝑖𝑐 𝑁𝑃
𝑎𝑚𝑜𝑢𝑛𝑡 𝑜𝑓 𝑡𝑜𝑡𝑎𝑙 𝑑𝑟𝑢𝑔 𝑢𝑠𝑒𝑑 𝑥 100 [9]
𝐷𝐿 % = 𝑚𝑎𝑠𝑠 𝑜𝑓 𝑑𝑟𝑢𝑔 𝑖𝑛 𝑁𝑃
𝑡𝑜𝑡𝑎𝑙 𝑚𝑎𝑠𝑠 𝑜𝑓 𝑁𝑃 𝑢𝑠𝑒𝑑 𝑥 100 = 𝑚𝑔 𝑑𝑟𝑢𝑔 𝑚𝑔 𝑝𝑜𝑙𝑦𝑚𝑒𝑟⁄ [10]
For the measurement of the DL and EE a defined amount of nanoparticles have to be digested in e.g.
acetonitrile or other degrading solvent, which is subsequently measured by HPLC (Bilati, Allémann &
Doelker, 2005).

NANOPARTICLES
[44]
3.5. Choosing the right nanoparticle formulation
It would be counterproductive, for example to choose in the present study a formulation that could
induce oxidative stress and therefore nullify the desired effect of applying antioxidants. Knowing this,
certain formulation such as carbon-, ceramic-, metal- and magnetic nanoparticles have been excluded,
leaving solid lipid nanoparticles, liposomes and polymer nanoparticles to choose from. As a starting
point to see which nanocarrier out of the three is most suitable to deliver the desired LMWAs, the
advantages and disadvantages have been evaluated. Starting with the solid lipid nanoparticles one of
the main disadvantages is the time intense production of particles as well as low drug loading and the
possibility of drug expulsion upon recrystallization. Liposomes, although often used to enclose drugs
with a narrow therapeutic window, have been demonstrated to have a fast clearance and rapid drug
release, furthermore they tend to accumulate in the liver and spleen, causing toxic side effects when
exposure time increases. Therefore, polymer nanoparticle, were chosen as the initial platform for
development, however it was noted that not all polymeric nanoparticle formulations are suitable to
deliver antioxidants. For example, PECA (Poly-ethyl-cyano-acrylate) nanoparticles have been shown
to cause an increase in respiratory burst and induce the release of soluble toxic factors in and from
macrophages (Cruz, Gaspar, Donato & Lopes, 1997). Furthermore, they can induce a higher production
of NO (nitric oxide), which in combination with the increase of peroxide from oxidative burst could be
cytotoxic to peritoneal macrophages, as they accumulate PECA particles (Cruz, Gaspar, Donato &
Lopes, 1997).
In contrast, PLGA nanoparticles are formulated with biocompatible compounds poly- lactide and poly-
glycolide, which are degraded into biodegradable metabolites lactic acid and glycolic acid upon cellular
elimination (Danhier, Ansorena, Silva, Coco, Le Breton & Préat). Furthermore, PLGA nanoparticles
have been widely used as drug delivery systems and are approved by the FDA and European Medicine
Agency (EMA) for use in humans as parenteral administrations (Danhier, Ansorena, Silva, Coco, Le
Breton & Préat; McCall & Sirianni, 2013). Well described formulations and production methods
amended to various types of drugs have been established, which can hinder drug degradation, allow
sustained release, as well as enable surface modifications for better interaction with biological materials
and specific cell and organ targeting (Danhier, Ansorena, Silva, Coco, Le Breton & Préat). Various
studies have shown that the entrapment of antioxidants in polymer nanoparticles have a better activity
and efficiency than delivered with other systems like emulsions or solutions (Astete, Dolliver, Whaley,
Khachatryan & Sabliov, 2011). The team of McCall and Sirianni (2013)used PLGA nanoparticles to
entrap α-tocopherol (Vitamin E) and ascorbic acid (Vitamin C). They showed that even if vitamin E is
hydrophobic and vitamin C is hydrophilic, their use in combination with PLGA particles can improve
solubility, morphology, stability and antioxidant activity. The size of the particles varied from 155-216
nm of PLGA-EC with a polydispersity index of 0.12-0.17 and the DPPH assay determined an IC50 of
37.4 µM, 30.6 µM, 31.6 µM and 33.4 µM better than the non-assembled EC-surfactant and EC-Span80
surfactant they used as a comparison (Astete, Dolliver, Whaley, Khachatryan & Sabliov, 2011). Pool et
al. (2012)obtained similar results when they produced PLGA NPs with encapsulated quercetin and
catechin to investigate the encapsulation efficiency and release profile and subsequently demonstrated
that the use of PLGA nanoparticles was suitable for antioxidant flavonoids. They demonstrated an

NANOPARTICLES
[45]
encapsulation efficiency of 79% and the release profile in vitro demonstrated a pH dependency with a
higher release in a more acidic environment and the antioxidant activity increased by creating chelate
complexes compared to the single administration (Pool et al., 2012).
Flow cytometry or spectrophotometry based systems that are used to detect the activity of reactive
oxygen species by monitoring fluorescence of 2’7’-dihydrochlorofluorescein diacetate (H2DCFDA) can
still be used in the presence of antioxidants in a PLGA formulation (Love, Maurer-Jones, Thompson,
Lin & Haynes, 2012).
However, the major problem could be the drug encapsulation efficiency as it can range from 6% to 90%,
and is the main hurdle to overcome to get consistency in the experiment (Danhier, Ansorena, Silva,
Coco, Le Breton & Préat).
3.5.1. The preparation of PLGA Nanoparticles
Poly (lactic-co-glycolic acid) nanoparticles are one of the most successfully used polymeric drug
delivery systems. Upon hydrolysis of PLGA the metabolites lactic acid and glycolic acid are produced,
both of which are endogenous molecules that are both easily metabolised in the Krebs cycle and show
therefore minimal systemic toxicity (Danhier, Ansorena, Silva, Coco, Le Breton & Préat). As PLGA is
composed of two compounds, multiple ratios are available, which influence the degradation process of
the particle, where a 50:50 ratio of lactic/glycolic acid expresses the shortest half-life in vivo (50 to 60
days) which can be increased with an increasing ratio of lactic acid (Cohen-Sela et al., 2009). PLGA
ratios are available in 65:35, 75:25 or 85:15 lactic:glycolic acid (Pathak & Thassu, 2009). Furthermore,
a faster degradation leads to a faster drug release rates, accordingly (Pathak & Thassu, 2009).
There are well established methods to produce PLGA nanoparticles, either with a single (oil-water) or
a double (water-oil-water) emulsion, also known as the emulsification-solvent evaporation method
(Cohen-Sela et al., 2009). A different technique is the interfacial deposition method, where
nanoparticles are formed by nanoprecipitation, where the polymer and drug are dissolved in an organic
phase (e.g. acetone) and water is added dropwise, forming pellets which are collected by centrifugation
(Cohen-Sela et al., 2009). A third method of preparing PLGA NPs is via spray-drying (Danhier,
Ansorena, Silva, Coco, Le Breton & Préat). The incorporation of the drug can be achieved by either by
adding the drug during production or by adsorption of the drug on nanoparticle surface after their
production (Danhier, Ansorena, Silva, Coco, Le Breton & Préat; McCall & Sirianni, 2013). The
preparation technique depends on the characteristics of the drug, circulation time and target properties.
As PLGA nanoparticles themselves are negatively charged and have a tendency to get opsonised by
phagocytes, surface modification can be utilised to produce particles with a neutral or positive charged
surface (Danhier, Ansorena, Silva, Coco, Le Breton & Préat). A positively charged surface seems to
allow nanoparticles to be internalised via pinocytosis to a higher extent. They can escape the lysosomes
and are presented perinuclear, whereas neutral and negatively charged NPs prefer to localise with the
lysosomes (Danhier, Ansorena, Silva, Coco, Le Breton & Préat). The shift from the negatively charged
PLGA surface can be made by conjugating PEG (poly-ethylene-glycol) or applying a chitosan coating
(Danhier, Ansorena, Silva, Coco, Le Breton & Préat).

NANOPARTICLES
[46]
Firstly, the previously mentioned single emulsion method is water and oil based (w/o), where the
hydrophobic drug and the polymer are dissolved in water-immiscible solvent (such as dichloromethane,
methylene chloride, chloroform or ethyl acetate) and is then added dropwise to the aqueous phase
containing a surface stabiliser like polyvinyl alcohol (PVA), methyl cellulose, albumin or polysorbate. To
induce nanosize droplets, homogenization or sonication can be applied. Homogenization is achieved
with a rotor-stator type mixer, where liquid is forced into microchannels under high pressure, this
process expresses excellent emulsification efficiency and is preferably used with viscous solutions and
heat sensitive materials. Sonication uses ultrasound-driven vibrations to generate emulsions, which
cause cavitation and heat as opposed to shear forces. During the sonication process vapour bubbles
are created and once they reach a critical size they collapse releasing energy, this leads to large point-
source temperature fluctuations and hydroxyl free radicals production. The high speed causes the oil
phase to finely disperse into the water phase. Varying the duration and the intensity of the sonication
will lead to the formation of emulsion droplets in various sizes (Danhier, Ansorena, Silva, Coco, Le
Breton & Préat; Gupta & Kompella, 2006). Macroemulsions use an abundance of surface stabiliser to
create a stable system as larger particles readily express sedimentation, whereas microemulsions use
low concentrations of an emulsifier to avoid toxicity of nanoparticles (Gupta & Kompella, 2006; Pathak
& Thassu, 2009). Once the emulsion has been created the next step is the evaporation of the solvent
which leads to the hardening of the nanoparticles.
Secondly, the double emulsion method, is a water-in-oil-in-water (w/o/w) emulsion, and was created to
enhance the incorporation of hydrophilic drugs. The aqueous drug solution is added to an organic
solvent containing the polymer with vigorous stirring, creating the first o/w emulsion. This first emulsion
is then added dropwise to a large quantity of water containing an emulsifier, preferable PVA, leading to
a w/o/w double emulsion. The double emulsion is then constantly but gentle stirred. To optimise the
droplet size the slow addition of the first o/w emulsion is mandatory but the sonication intensity and time
can also alter particle size (Pathak & Thassu, 2009).
Nanoparticles, prepared in both ways, eventually form and harden when the organic solvents evaporate.
The polymerisation completes and individual particles are formed in general after three hours (Gupta &
Kompella, 2006). To obtain a small particle size a fast evaporation can be useful, and this can be
achieved using supercritical carbon dioxide instead of the normal evaporation via a rotary evaporator
(Gupta & Kompella, 2006). During the evaporation process the immiscible solvents of the o/w emulsion
diffuse from the inner phase into the outer phase and the correlating turbulences result in the formation
of particles. If the particles are not completely polymerised during evaporation residual solvent and
emulsifier can be removed via lyophilisation (Pathak & Thassu, 2009). This is achieved by washing the
nanoparticles with water before and after centrifugation, and in the following step the nanoparticles
sediment is freeze- dried at -70°C. This process is also used for nanoparticle storage (Srivastava et al.,
2013).

METHODS AND MATERIALS
[47]
4. METHODS AND MATERIALS
In this thesis, a gradient reverse phase (RP)-HPLC method was modified from a previously described
the protocol (Ou, Schmierer, Rades, Larsen & McDowell, 2013) to detect and analyse the phenolic
acids, such as chlorogenic acid, chicoric acid and caftaric acid. Furthermore, a scoring system was
developed to evaluate the in vivo toxicity and rescue effects of the chosen phenolic acids in zebrafish
embryos. For application purposes PLGA nanoparticles were created to entrap those hydrophilic
compounds of pūhā.
4.1. HPLC
To separate the antioxidative compounds of pūhā from outer matrix a HPLC method described by Ou,
Schmierer, Rades, Larsen and McDowell (2013) was modified. A gradient RP-HPLC method was
developed accordingly. The HPLC was equipped with a HPLC Luna® column (CC column, 3 µm, C18
(2), 100 Å, 150 x 2 mm), the flowrate was set to 0.2 l/min and the autosampler was cooled at 4 °C, the
samples were detected at a wavelength of 328 nm, with an injection volume of 5 µL. The mobile phase
A was Millipore water with 0.2% (v/v) formic acid, and phase B was acetonitrile (ACN) with 0.2% (v/v)
formic acid. The gradient B was increased from 20% (v/v) to 60% (v/v) in 11 min, and reduced to 20%
(v/v) in 6 min, with a 4 min post run. In addition to the mobile phases A and B, 100% (v/v) Methanol
(mobile phase C) and 65% (v/v) ACN (mobile phase D) were used for cleaning and purging purposes.
Before using the mobile phases in the HPLC a degassing process was conducted with a filter membrane
under vacuum, to reduce contamination and air bubbles. The starting pressure was between 153 to 155
bar and never exceeded 159 bar.
4.1.1. Gradient RP-HPLC Assay Validation
Validation of the RP-HPLC method has been performed according to the US Food and Drug
Administration (FDA) and International Conference on Harmonisation (ICH) guidelines for analytical
method validation (FDA, 1994; ICH, 1994) with respect to sensitivity, linearity, precision, and accuracy.
The validation was conducted on three consecutive days, where the samples were freshly prepared
each day for intra- and inter-day accuracy.
For the calibration curve three stock solutions of chlorogenic acid (M = 354.31 g/mol) and chicoric acid
(M = 474.37 g/mol) have been prepared, whereas stock solution I was 1 mg/mL for both phenolic acids.
For chlorogenic acid stock solution II (100 µg/mL) and III (20 µg/mL) were diluted from the previous
stock solutions. Chicoric acid stock solution II (200 µg/mL) and III (100 µg/mL) were diluted from stock
solution I. All dilutions were done in triplicate with concentrations for chlorogenic acid as followed, 100,
60, 40, 20, 15, 10 and 5 µg/mL and for chicoric acid 200, 150, 100, 80, 40, 20 and 10 µg/mL,
respectively. As part of the validation process the quantitation limit was determined as well, with 3
concentrations - low, medium and high performed with six replicates, with the following concentrations
for CGA 10, 30 and 90 µg/mL and for CCA 15, 60 and 180 µg/mL. All samples had an end volume of
100 µL.

METHODS AND MATERIALS
[48]
4.2. Zebrafish
The zebrafish were obtained from and held at the Zebrafish Facility Otago (ZFO), Department of
Pathology, School of Medicine, University of Otago. Two adult zebrafish genotypes have been used in
these experiments. The ABz Wildtype and transgenic SOX10: GFP type. The adult fish were held
separately by type and gender. They were fed thrice daily with two dry feeds and one live feed,
according to the standard operating procedure (SOP) of the ZFO (OZF, 2014). For the live feed of the
adult fish Artemia (brine shrimp), an aquatic crustacean, was prepared according to the protocol once
a day and for the dry feed the ZM400 (500-800 µm) fish food was used.
The adult zebrafish were setup for breeding once a week to ensure a continuous breeding habit and a
nearly continuous number of eggs. For the breeding one male and one female fish were transferred in
a breeding tank the previous afternoon. The breeding was intraracial, so only either wildtype fish or
transgenic fish were setup. As zebrafish breed at sunrise, the facility is provided a light timer and the
eggs were fertilised around 8 a.m. Egg collection occurred routinely at midday, so that the treatment
could start at 6 hpf (hours past fertilisation). The collected eggs were kept in E3 x 1 media, diluted from
a composition of 16.5mM CaCl2 16.5mM MgSO4 8.5mM KCl 250mM NaCl in a 50x stock solution. This
composition ensures optimal nutrition of the embryos.
After breeding all fish were transferred back to the specific tanks and the eggs were collected through
a small plastic sieve. The collected eggs were rinsed with E3 x 1 solution and washed into a petri dish,
with a diameter of 8 cm. Not all eggs get fertilised and to separate the unfertilised eggs from the fertilised
methylene blue staining is commonly used, as non-fertilised eggs have a chorion that is permeable for
the dye and the eggs appear blue in colour whereas methylene blue is not able to permeate the chorion
of fertilised eggs (Westerfield, 2000). This selection process usually takes place within the first 6 hpf,
and then the fertilised eggs get further treatment. All media contacting the embryos are dissolved in egg
water (E3 solution) prior to application, to reduce contamination as well as to ensure that embryos are
well nourished during growth. In the present study methylene blue was not used as the eggs were
selected and separated under a microscope for treatment.
All treatment groups received the same washing process and were then divided at 6 hpf for the
individual experiments.
The first step was to determine the highest, least toxic concentration of chlorogenic acid when exposed
to zebrafish embryos. For this experiment the embryos were divided in 6 groups of 20 eggs each and
in duplicate (12 groups in total) and incubated at + 28°C with CGA concentrations of 50 µM, 100 µM,
250 µM, 500 µM and 700 µM in E3 media with 10 µL DMSO and 10 µL DMSO in E3 as control at 6 hpf
(hours past fertilisation). The incubation period was 5 days and each day the number of hatched
embryos, pigmentation abnormalities, fin malformations and dead were documented. The influence of
the chlorogenic acid concentration with respect to death incidences and hatching behaviour was then
analysed for each treatment group with the statistical software Minitab®, Version 17, using Pearson
correlation, ANOVA and Tukey comparison as the main response parameters.

METHODS AND MATERIALS
[49]
After determining the highest and non-toxic concentration of CGA, the rescue effectivity of the CGA
concentration was assessed. The first treatment groups were divided into control and stress induced
groups. The stress induced population was larger than the control as those eggs were required for
further treatments. The stressed eggs were separated at 30 hpf in rescue treatment, self-rescue and
continuous stress exposure. In between switching treatments, the eggs were washed with E3 solution
and then new medium was added. For an easier understanding of the experiment setup see Table 5.
Table 5
Experiment setup to determine rescue properties of chlorogenic acid in SOX10: GFP zebrafish
Group Treatment in 20 mL E3 Treatment start/duration
Control 10 µM DMSO 6 hpf to 5 dpf
Stress induced 5 µM AFN 6 hpf to 5 dpf
Non-rescue 5 µM AFN
E3
6 hpf to 30 hpf
30 hpf to 5 dpf
Rescue treatment (CGA) 5 µM AFN
250 µM CGA
6 hpf to 30 hpf
30 hpf to 5 dpf
After a 5-day period, the larvae were evaluated, and differentiated in healthy, unhealthy, and fatalities.
For imaging the zebrafish embryos and larvae a fluorescence microscope (Fluorescence Stereo
Microscope Leica M 205 FA, DFC 490 camera) was used. As healthy, unhealthy, and deceased are
very superficial parameters the larvae were further evaluated with a scoring system, allowing for
differentiation of unhealthy embryos, regarding the change in the phenotypes pigmentation, oedema,
haemorrhaging, tail and jaw. Each fish was scored individually from (0) healthy, (1) mild, (2) moderate
and (3) severe malformations in every phenotype see Figure 13 and Table 7, deceased larvae were not
evaluated and disregarded in the scoring system, but presented separately.

METHODS AND MATERIALS
[50]
Figure 13 Evaluation chart for oxidative stress induced malformations, in 5-day old zebrafish larvae

METHODS AND MATERIALS
[51]
Table 6
Score sheet for evaluation of the zebrafish embryos, scoring each larvae from (0) = healthy, (1) = mild, (2) = moderate, and (3) = severe in every phenotype.
Tx fish pigment oedema haemorrhaging tail jaw
total number
dead 0 1 2 3 0 1 2 3 0 1 2 3 0 1 2 3 0 1 2 3

METHODS AND MATERIALS
[52]
4.3. PLGA nanoparticles
Poly-(lactic-co-glycolic)-acid 50:50 was obtained from Lactel®, Durect corp (Birmingham, Alabama),
Dichloromethane was purchased from Merck® (Darmstadt, Germany), polyvinyl alcohol was supplied
by Polyscience Inc. ® (Taipei, Taiwan), calcium chloride obtained from Sigma Aldrich® (Steinheim,
Germany) and chlorogenic acid obtained from Acros Organics (Geel, Belgium).
The PLGA nanoparticles were formulated with the double emulsion technique based on McCall and
Sirianni (2013), as a starting point. This paper was chosen because they encapsulated Vitamin E,
another commonly used antioxidant, aalthough they did not specify the entrapment efficiency, they did
however present a good size distribution. Slight modifications have been made, regarding the PVA
concentration and PLGA/DCM (dichloromethane) ratio in the aqueous phase. To ensure an even size
distribution, e.g. a low PDI, and a small size (100-250 nm), the ratios of inner w1/o phase to the other
w2 phase have been changed, concluding to a ratio of 1:25 of PLGA in 4% (w/v) PVA. As PLGA
nanoparticles express vast differences in the entrapment efficiency and over all a low EE%, CaCl2 was
added to the inner first w1/o phase and compered to PLGA particles without CaCl2. The preparation
was amended to include this modifications as calcium ions express a high affinity to hydrophilic
molecules and should therefore help entrapping the hydrophilic antioxidant within the lipophilic core of
the PLGA nanoparticles (Dordelmann, Kozlova, Karczewski, Lizio, Knauer & Epple, 2014). Therefore,
nanoparticles were prepared with additional CaCl2 and without. The two types of particles have been
characterised and compared, regarding size, charge, PDI, entrapment efficiency and release profile.
The nanoparticles were prepared based on the double emulsion technique as follows. For the o/w1
phase 100 mg PLGA was dissolved in 1 mL DCM and vortex until the polymer was dissolved. A 4%
(w/v) PVA solution with Mili-Q® water and a 70% (v/v) Methanol was prepared. As for the antioxidants
250 mM chlorogenic acid was weighted and dissolved in 1 mL 70% (v/v) Methanol. For the
nanoparticles with CaCl2 15 mg were dissolved in 1 mL 70% Methanol. A sonication probe with a time
cycle of 60% and an amplitude 700 milli Watt and a vortex was used to prepare the emulsion. First, 50
µL CGA and 50 µL CaCl2 was added to 400 µL PLGA under vortex and then sonicated on ice for 2 min
to create the first milky o/w1. In a separate tube 1 mL 4% PVA was presented and the o/w1 emulsion
was added dropwise under slow vortex and then vortexed on high, before transferring the tube to the
ice bath for sonicating for 2 min again. After that the white milky emulsion was transferred to 8.5 mL 4%
PVA in small glass beakers and stirred on a magnetic bench overnight for drying. After the drying, 500
µL equals were transferred into eppindorf tubes, diluted with 500 µL Mili-Q® water and then transferred
into a centrifuge (Eppendorf centrifuge 5417C) at 14,000 rpm for 30 min, the supernatant was removed
(the first supernatant was sampled into separate tubes) and the residue was re-dispersed in 1mL Mili-
Q® water using a sonication bath at room temperature. This washing process was repeated 3 times.
The same process was replicated for the nanoparticles without CaCl2, and to avert volume loss 50 µL
of 70% Methanol was added accordingly to the first o/w1. The re-dispersed nanoemulsion was then
used for size and charge measurement; the sampled supernatant was used to measure EE% with a
UV spectrophotometer.

METHODS AND MATERIALS
[53]
A Malvern® Zetasizer was used to determine size and surface charge of the PLGA nanoparticles. For
the size measurements disposable cuvettes were used with a sample volume of 1 mL (ratio 1:1 of
nanoparticle dispersion to Mili-Q® water). Surface charge measurements were performed in zeta cells.
The mean size, PDI and zeta potential were then calculated and errors calculated as standard deviation
of the mean from all samples. The supernatant was used for indirect measurements of the entrapment
efficiency with an UV spectrophotometer at a wavelength of 328 nm in disposable cuvettes. The
supernatant was diluted 1:1 with PVA 4%, as it was also used for the blind sample and the standard
curve of chlorogenic acid.
To predict the release profile of chlorogenic acid in PLGA nanoparticles, the dried and washed samples
were dispersed in PBS puffer (pH 7.8) and the 1.7 mL eppindorf tubes were placed in a water bath at
28.0 °C and a shake frequency of 40 shakes per minute over a 65 hours period. Samples were drawn
at 1, 3, 15, 24, 41, 48 and 65 hr. As the samples were in single tubes, no PBS volume needed to be
replaced. All samples war centrifuged at 14 000 rpm for 30 min the supernatant was collected and then
used to measure indirect EE% with RP-HPLC.

RESULTS AND DISCUSSION
[54]
5. RESULTS AND DISCUSSION
In the following section of this thesis I will present the results regarding the validation of the gradient
RP-HPLC method with the antioxidants chlorogenic acid and chicoric acid. The third phenolic acid
isolated from pūhā with antioxidant activity caftaric acid was excluded as it was not available at the time
the validation took place. The phenolic acid with the highest antioxidant activity, i.e. chlorogenic acid,
was then applied in the zebrafish model. Dose evaluation experiment were initially conducted, followed
by an analysis of the rescue properties when the zebrafish is exposed to the toxin auranofin.
Subsequently, the phenolic compound was then entrapped in PLGA nanoparticles, and optimised for
maximal encapsulation.
5.1. Gradient RP-HPLC validation of chlorogenic acid and
chicoric acid
As chlorogenic acid and chicoric acid were purchased in their pure form no isolation process of the sow
thistle leaves was necessary.
Validating the gradient RP-HPLC assay for chlorogenic acid and chicoric acid, the linearity was
determined using a concentration series of chlorogenic acid and chicoric acid and plotting the peak
areas against the concentrations to obtain a standard curve. The linear function of the standard curve
of chlorogenic acid and chicoric acid was in the concentration range from 5 µg/mL to 100 µg/mL and
10µg/mL to 200 µg/mL (n = 3, where n is the number of repetitions per day). The accuracy of the
regression was expressed as a percentage of spiked (theoretical) concentration and measured
concentration for both compounds, with a regression coefficient (r2) = 0.9972 for chlorogenic acid and
0.9995 for chicoric acid.
Table 7
Accuracy of the linear regression applied to the calibrations standard of chlorogenic acid, range 5 – 100 µg/mL, n = 3.
Concentration of
CGA (µg/mL)
Calculated concentration
of CGA (µg/mL)
y = 84681x + 105455
Accuracy (%)
5 3.75 75.09
10 8.75 87.54
15 13.75 91.69
20 18.75 93.77
40 38.75 96.88
60 58.75 97.92
100 98.75 98.75

RESULTS AND DISCUSSION
[55]
Figure 14 Calibration curve of chlorogenic using mean values, number of repetition (n) = 3 (for each day over a 3-day period).
For the calibration standards a calculated concentration at the lower limit of quantitation is allowed to
differ by 20% for its nominal values at the back calculations. The lowest concentration of chlorogenic
acid with 5 µg/mL is therefore not acceptable and would have to be rejected in the calibration curve
(Table 7). Nonetheless, it was concluded that the calibration curve as the linearity of the calibration
curve in Figure 14 is unaffected. The ICH guidelines also disregards and rejects values that differ more
than 15% in other levels, however this was unnecessary in the calibration curve of chlorogenic acid and
chicoric acid, as the linear regression and accuracy was determined for both, see Table 7, Table 8, and
Figure 15.
Table 8
Accuracy of the linear regression applied to the calibration standard of chicoric acid, range 10 – 200 µg/mL, n = 3.
Concentration of
CCA (µg/mL)
Calculated concentration
of CCA (µg/mL)
y = 116037x - 118565
Accuracy (%)
10 11.02 110.21
20 21.02 105.11
40 41.02 102.55
80 81.02 101.27
100 101.02 101.02
150 151.02 100.68
200 201.02 100.51
y = 84681x + 105455R² = 0.9972
0
1000000
2000000
3000000
4000000
5000000
6000000
7000000
8000000
9000000
10000000
0 20 40 60 80 100 120
Pea
k ar
ea
Concentration (µg/ml)

RESULTS AND DISCUSSION
[56]
The calibration curve for chicoric acid and the back calculated values are within the limits of ≤ 15% in
both accuracy and precision at the lowest concentration.
Figure 15 Calibration curve of chicoric acid using mean values, number of repetitions (n) = 3 (for each day over a 3-day period).
For the validation according to ICH guidelines the precision (% RSD/CV) and accuracy (%) over a three-
day period were determined, especially regarding the intra-day (within-day) and inter-day (in between
days) variability expressed as coefficient of variation (CV) in percent for repeatability (intra-day) and
precision (inter-day). Those parameters are calculated from the quality control samples with low,
medium and high concentrations of chlorogenic acid and chicoric acid, respectively.
Table 9
Intra- and inter-day accuracy and variation of gradient RP-HPLC assay for Chlorogenic acid using low medium and high sample concentrations within the calibration range, values represent means ± SD, numbers of repetition (n) = 6.
Concentration of
CGA (µg/mL)
Calculated
concentration of
CGA (µg/mL)
Variability (CV)
(%)
Accuracy (%)
Intra-day 10 11.20 ± 0.23 2.05 112.02
30 30.03 ± 0.20 0.66 100.08
90 90.27 ± 0.84 0.93 100.29
Inter-day 10 9.73 ± 1.20 2.68 97.31
30 31.20 ± 0.89 -4.03 104.03
90 94.60 ± 3.29 -5.11 105.11
y = 116037x - 118565R² = 0.9995
0
5000000
10000000
15000000
20000000
25000000
0 50 100 150 200 250
Pea
k ar
ea
Concentration (µg/ml)

RESULTS AND DISCUSSION
[57]
Table 10
Intra- and inter-day accuracy and variation of gradient RP-HPLC assay for Chicoric acid using low medium and high sample concentrations within the calibration range, values represent means ± SD, numbers of repetition (n) = 6.
Concentration
of CCA
(µg/mL)
Calculated
concentration of
CCA (µg/mL)
Variability (CV)
(%)
Accuracy (%)
Intra-day 15 15.26 ± 0.42 2.78 101.74
60 61.62 ± 1.06 1.73 102.70
180 186.45 ± 4.35 2.33 103.58
Inter-day 15 4.90 ± 0.55 0.66 97.63
60 59.10 ± 1.66 1.50 95.90
180 181.69 ± 2.95 -0.94 97.44
According to the ICH and FDA guidelines the accuracy (%) and precision (% CV) of quality control
samples have to be ≤ 15% within-run and between-run with a minimum repetition for 3 consecutive
days or 5 days. For this validation a 3-day period was chosen and within each run, 6 samples were
used at each concentration. All data points for chlorogenic acid and chicoric acid are within the 15%
deviation limit regarding precision and accuracy.
Sensitivity is defined as a methods ability to detect small changes in an analyte concentration correctly
(FDA, 1994). Parameters of sensitivity are the lower limit of quantification (LLOQ), and lower limit of
detection (LLOD), which refer to the lowest concentration of chlorogenic acid and chicoric acid as part
of a calibration curve with acceptable accuracy and precision. Therefore, the LLOQ (10 times the
standard deviation) and the LLOD (3 times the standard deviation) were calculated using the standard
deviation of lowest concentration divided by the slope of the calibration curve. The LLOQ and LLOD of
chlorogenic acid is 3.73 µg/mL and 1.12 µg/mL, and the LLOQ and LLOD of chicoric acid is 5.94 µg/mL
and 1.78 µg/mL, respectively.
5.2. Dose evaluation of chlorogenic acid in TG(SOX10: GFP)
To the best of our knowledge neither chlorogenic acid nor chicoric acid have previously been applied
to a zebrafish model, thus a dose finding study was performed to determine the highest, least toxic
concentration of CGA. The experiment set-up was as previously described in the method section 4.2.
The zebrafish larvae were observed regarding hatching behaviour and increased embryonal death over
a 5-day period in different concentration of chlorogenic acid.
The data is presented as means of 4 treatment groups to each 10 embryos for each concentration with
standard deviation and confidence interval determined by the statistic software program Minitab® 17
using Pearson correlation, ANOVA, and Tukey comparison.

RESULTS AND DISCUSSION
[58]
Figure 16 Evaluation of toxicity of chlorogenic acid in the concentration of 50, 100, 250, 500 and 700 µM in zebrafish embryos over a 5-day period, each concentration was done in replicate, (n) = 4.
The Pearson correlation was used to show a dependency between the concentration of treatment and
a higher death incidence. It was hypothesised that a higher concentration of chlorogenic acid could lead
to an increase in embryonal death incidences as low concentration, agreeing to the evaluation shown
in Figure 16. This observation was supported statistically with the Pearson correlation and an unpaired
t-test, indicating that a higher concentration of chlorogenic acid can increase death incidences by 25%
(r = 0.250, Person correlation) significantly (p = 0.003, Pearson correlation). The preliminary of the dose
evaluation was to find the highest possible dose with no toxic effect, therefore an ANOVA with Tukey
comparison was conducted to determine the difference between the concentrations. This comparison
conducts a grouping of parameters and separate those which are significantly different, excluding the
highest and lowest concentration of CGA, as the highest shows the most death incidences and the
lowest may not be effective regarding oxidative stress, leaving the middle concentrations to evaluate
which would be most suitable. Those three concentration do not show a significant difference in the
Tukey comparison as they share one of two groups, but as the Pearson comparison shows a significant
increase in death with an increase in concentration of chlorogenic acid a concentration of 250 µM was
chosen for further treatment of oxidative stress in zebrafish embryos. There was no difference between
the two zebrafish genotypes, Abz and SOX10: GFP, regarding the toxicity of chlorogenic acid.
0
5
10
15
20
25
30
35
40
0 dpf 1 dpf 2 dpf 3 dpf 4 dpf 5 dpf
% D
eath
time (days past fertilisation)
DMSO 50 100 250 500 700

RESULTS AND DISCUSSION
[59]
5.3. Rescue of zebrafish embryos with chlorogenic acid
The application of 250 µM chlorogenic acid to zebrafish embryos after stress exposure, was
subsequently determined using a DCFH-DA fluorescence probe and quantified by a fluorescence
spectroscopy at an excitation and emission wavelength of 485 nm and 538 nm, respectively. An
insignificant change in fluorescence was observed, which may suggest that does not induce sufficient
H2O2 radical production to be detected with the DCFH-DA fluorescence probe without sacrificing the
embryos. Therefore, this method was disregarded as a quantification method to measure oxidative
stress in zebrafish embryos.
Auranofin (AFN) was used to induce oxidative stress in the zebrafish by altering the cellular removal of
hydroperoxide radicals. A 5 µM concentration of AFN was thought adequate to induce sufficient stress
in the fish based on the study of Newman, Carleton, Leeke, Hampton and Horsfield (2015). This study
demonstrates that 5 µM is sufficient to elicit enough free radicals to alter neural crest cells at a 24 hr
exposure time, while not sacrificing the zebrafish embryos.
As the quantification with a DCFH-DA assay was not sufficient a visual evaluation scheme was created.
Following the experiment set up as described in the method section 4.2, each zebrafish larvae was
scored individually in each treatment group. The statistical analysis was performed by ANOVA and
Tukey comparison to show the difference between the individual treatments after a 24 hours AFN
exposure. The embryos were all exposed for a 24 hr period with 5 µM AFN, except the control group
and after the exposure either received treatment with 250 µM CGA (rescue) or no treatment (non-
rescue). At day three all embryos who have not hatched were dechorinated with forceps, though
causalities of this process were excluded in the survival survey. The final evaluation of the embryos
was performed on day five of the experiment, where each fish was scored from 0 to 3, individually in
the phenotypes pigmentation, oedema, haemorrhaging, tail malformation, and jaw deformation, see
Appendix Table 6 for the scoring template.
It was observed that an exposure to AFN over 3 days or longer lead to an increase in fatalities by 100%.
Whereas a 24 hr exposure to the toxin does not entirely lead to an increase in death, but still cause
proficient abnormalities regarding the phenotypes. Those evoked malformations are likely to be
reversible to a certain degree even without an antioxidant treatment. It appears that the endogenous
radical scavenging system of the zebrafish larvae works proficient enough to prevent long lasting and
terminal damage.

RESULTS AND DISCUSSION
[60]
Figure 17 The survival of zebrafish embryos in % after 24 hr auranofin exposure and subsequent treatment with CGA or E3 media, as well as a control group and a continuous auranofin exposure on day 5 past fertilisation, all groups were done in triplicates (n) = 50 – 90.
The characterisation of the larvae in phenotypes was conducted individually for each group and then
statistically evaluated using a one-way ANOVA, to show correlations between phenotypes and
treatment. The most significant effect of the rescue treatment was observed in the pigmentation and
jaw phenotypes. Those two phenotypes in particular are contributed solely to the effect of AFN, whereas
tail malformations, haemorrhaging and oedemas have a tendency to occur independently to treatment,
as those are also mildly expressed in the control group. Focusing on the jaw deformations and
pigmentation of the zebrafish larvae, it was perceived that chlorogenic acid expresses significant rescue
capability (p = 0.000, one-way ANOVA) compared to the self-rescue abilities of the fish on radical
induced damage, it expresses such good rescue effects that the damage is almost completely reversed.
Figure 18 Scoring from 0 to 3 of the visual evaluation regarding phenotypes in each group, expressed as the average of the experiment groups done in triplicates with ± SEM, number of larvae (n) = 150.
0
10
20
30
40
50
60
70
5 dpf
Mo
rtal
ity
in %
control non rescue CGA AFN cont
-0.2
0
0.2
0.4
0.6
0.8
1
1.2
pigment oedema haem tail jaw
sco
re
phenotype
control
non rescue
CGA treated

RESULTS AND DISCUSSION
[61]
As displayed in Figure 18, all experiment groups received a low individual score in the phenotypes,
therefore the individual scores of the experiment groups were added to give a possible total score of
15. The total scores demonstrate a greater difference in the overall picture of radical damage and
rescue effect. Comparing the individual score in phenotypes and the total score, it is visible that a certain
degree of damage occurs independently on treatment, especially the appearance of oedema and
haemorrhaging as well as tail bending are observed in the control group, leading to a higher score.
Nevertheless, treatment with chlorogenic acid appears to have preventive effect on haemorrhaging in
the larvae, as well as on the strength of the tail.
Figure 19 Total score of phenotype evaluation at 5 dpf, with a range from 0 to 15 (healthy to severe damage), the average ± SEM of each experiment group done in triplicate, number of larvae (n) = 150.
The overall statistical evaluation show a significant reduction of damage caused by oxidative stress in
zebrafish larvae when treated with chlorogenic acid (p= 0.000, one-way ANOVA) compared to non-
rescue and also preventive effect compared to the control group.
Additional quantitative methods to determine the radical scavenging ability of chlorogenic acid in
zebrafish have not been conducted, and were outside the scope of this investigation. Alternative
methods such as fluorescence-activated cell sorting (FACS) after toxin exposure or a different oxidative
stress inductor, like UV-B radiation could have been used to analyse antioxidant activity of chlorogenic
acid and further chicoric acid and caftaric acid.
0
0.5
1
1.5
2
2.5
tota
l sco
re
groups
control
non rescue
CGA treated

Results and Discussion
[62]
5.4. PLGA Nanoparticles
The PLGA nanoparticles were prepared as described in the Method section 4.3. The size and surface
charge was measured with a Malvern® Zetasizer and the entrapment efficiency was measured with an
UV-Spectrophotometer at a wavelength of 328 nm. The two types of PLGA particles for example with
and without CaCl2 were evaluated regarding size, surface charge, and entrapment efficiency. The size
and charge of control PLGA nanoparticles was also determined.
Table 11
Size, Charge and EE (%) of CGA-PLGA nanoparticles, Group A with CaCl2 and Group B without CaCl2, as well as non-loaded PLGA particles (control). Measurements are expressed as average ± SD, number of samples per group (n) = 3
Group Size (nm) PDI Zeta-potential
(mV)
EE (%)
A 315.73 ± 45.88 0.2 -12.6 ± 1.75 54.48
B 237.7 ± 26.29 0.259 -7.97 ±4.9 58.16
Control 199.26 ± 20.18 0.149 -36.23 ± 2.94 none
Comparing the size and EE (%) for each group an increase in EE (%) dependent on the size of the
particles could not be observed, nor could a dependence of entrapment efficiency of calcium chloride,
as Group B expresses a higher EE (%) of 58.16% at a smaller size of 237.7 nm than Group A with
54.48% and 315.73 nm. The increase in size and lower EE (%) plus the high PDI of Group A may be
an accumulation of CaCl2 with PLGA, or caused by a competition of chlorogenic acid and CaCl2,
however further investigations are required to establish this effect and are outside the scope of this
investigation. Therefore, this anomaly was disregarded in this research. However, it is evident that the
addition of calcium chloride to the PLGA nanoparticles was not effective at increasing the entrapment
efficiency of chlorogenic acid. The non-loaded, control PLGA nanoparticles displayed good stability,
with an overall a smaller and more even size distribution of approximately 199 nm with a PDI of 0.149,
as well as the negative zeta potential of -36.23 mV.
5.4.1. Release profile of PGLA nanoparticles
The release profile of the PLGA nanoparticle was determined using the same stock solution that was
used for size, surface charge, and entrapment efficiency investigation. The release study was
conducted as described in the Method section 4.3. At each time point of 1 hr, 3 hr, 15 hr, 24 hr, 41 hr,
48 hr and 65 hr the samples were centrifuged at 14,000 rpm (30 min) and the supernatant was collected
for individual time points, and then collectively analysed with a gradient RP-HPLC, (see Methods 4.1.1).
A new calibration curve was established at the beginning of the run, followed by the samples from
Group A and B, as well as blanks (PBS) in between the runs. The HPLC parameter were as followed:
injection volume of 5 µL at a flow rate of 0.25 mL/min, wavelength at 328 nm, column pressure of 139
bar. The collected supernatant was not further diluted, and the calibration samples were prepared with
the same PBS Puffer (pH 7.8) at the same concentration as previously validated.
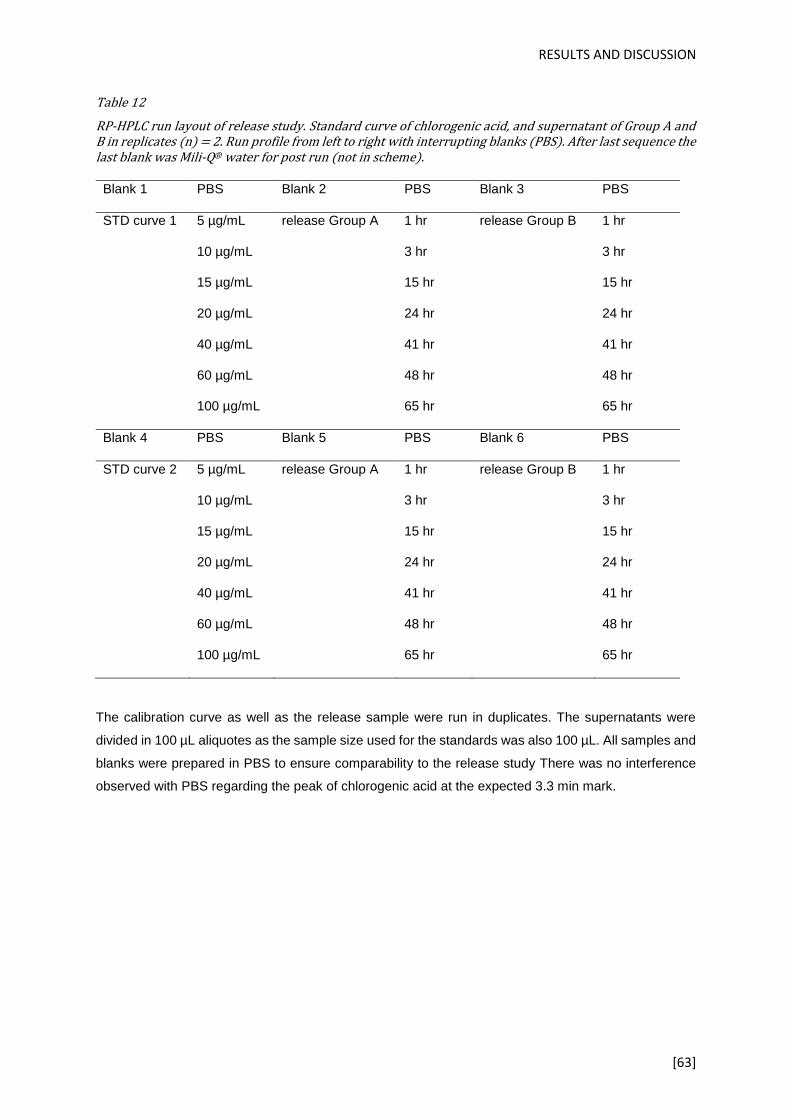
RESULTS AND DISCUSSION
[63]
Table 12
RP-HPLC run layout of release study. Standard curve of chlorogenic acid, and supernatant of Group A and B in replicates (n) = 2. Run profile from left to right with interrupting blanks (PBS). After last sequence the last blank was Mili-Q® water for post run (not in scheme).
Blank 1 PBS Blank 2 PBS Blank 3 PBS
STD curve 1 5 µg/mL
10 µg/mL
15 µg/mL
20 µg/mL
40 µg/mL
60 µg/mL
100 µg/mL
release Group A 1 hr
3 hr
15 hr
24 hr
41 hr
48 hr
65 hr
release Group B 1 hr
3 hr
15 hr
24 hr
41 hr
48 hr
65 hr
Blank 4 PBS Blank 5 PBS Blank 6 PBS
STD curve 2 5 µg/mL
10 µg/mL
15 µg/mL
20 µg/mL
40 µg/mL
60 µg/mL
100 µg/mL
release Group A 1 hr
3 hr
15 hr
24 hr
41 hr
48 hr
65 hr
release Group B 1 hr
3 hr
15 hr
24 hr
41 hr
48 hr
65 hr
The calibration curve as well as the release sample were run in duplicates. The supernatants were
divided in 100 µL aliquotes as the sample size used for the standards was also 100 µL. All samples and
blanks were prepared in PBS to ensure comparability to the release study There was no interference
observed with PBS regarding the peak of chlorogenic acid at the expected 3.3 min mark.

RESULTS AND DISCUSSION
[64]
Figure 20 Calibration curve of chlorogenic acid in PBS, number of replicates (n) = 2
The release profile of both groups show small instantaneous release of chlorogenic acid, followed by
almost no release over 65 hours. The experiment was designed so that each time point has a single
tube that was removed from the shaker accordingly, a plateau phase was expected after the initial
release in the first 3 hours. This was not the case, as not all samples expressed the same fast initial
release of chlorogenic acid.
Figure 21 Release profile of chlorogenic acid in Group A (+CaCl2) and Group B (-CaCl2), expressed as average concentration at each time point in PBS, number of replicates (n) = 2.
It appears that Group A (with CaCl2) expresses a faster instant release and an overall longer release at
the first few time points. This may be a consequence to a competitive reaction between the interaction
of chlorogenic acid and calcium chloride with PLGA. No plateau phase is observed at the later time
points, and cause behind why some particles express initial release and others do not is still not
understood.
y = 103536x - 391787R² = 0.987
0
2000000
4000000
6000000
8000000
10000000
12000000
0 20 40 60 80 100 120
AU
C
chlorogenic acid in µg/ml
-1
0
1
2
3
4
5
6
0 10 20 30 40 50 60 70
con
cen
trat
ion
(µ
g/m
l)
hours
Group A
Group B

RESULTS AND DISCUSSION
[65]
In conclusion the encapsulation of chlorogenic acid varied between PLGA particles. This may either
arise from the differences in particle composition or interaction of the chlorogenic acid with the PLGA
surface, or be a function of parameters used for the release studies (temperature of 28 °C and 40 spm)
being insufficient to induce release. Further release studies are required to investigate the underlying
cause of the inconsistent and disordered release profiles. A different approach to the delivery of
chlorogenic acid, for example using liposomes or surface derived PLGA nanoparticles as the delivery
vehicle, may be worthwhile to investigate in order to further optimise the delivery of these antioxidants
and therefore relieve induced oxidative stress.

CONCLUSION
[66]
6. CONCLUSION
In the present study the antioxidant activity of LMWAs in Sonchus oleraceus L were investigated using
an in vivo model of zebrafish embryos as an extension of a prior study regarding the antioxidant activity
of pūhā in vitro and whether the activity is maintained in vivo. Therefore, oxidative stress was induced
at 6 hpf old zebrafish embryos over a 24-hour period with auranofin (5 µM) and a following rescue
treatment with 250 µM chlorogenic acid. Chlorogenic acid is one of three main antioxidants found in
Sonchus oleraceus and expresses the highest antioxidant activity compared to chicoric acid and caftaric
acid in vitro. The concentration of chlorogenic acid was determined in a dose finding study where a
significant decrease in embryonal survival was correlated with an increase in the concentration of
chlorogenic acid between 500 µM and 700 µM CGA (r = 0.25, p = 0.003, Pearson correlation). Zebrafish
embryos treated with 5 µM AFN over 24 hours express a loss in pigmentation, haemorrhage and jaw
deformations. The malformations in the zebrafish are related to progenitor cells of neural crest cells that
are damaged by the free radical accumulation caused by auranofin. Damage caused by auranofin was
assessed with a newly developed scoring system. The scoring system evaluates individual zebrafish
larvae in the phenotypes pigmentation, oedema, haemorrhage, tail and jaw deformations with a score
from healthy (0) to severe (3) malformations. Zebrafish embryos that receive rescue treatment with
chlorogenic acid have a significant reduction in the overall score (p = 0.000, one-way ANOVA) and a
significant reduction in the individual score in the phenotypes pigmentation, haemorrhage and jaw
malformations compared to non-rescue and in haemorrhage assessment compared to the control (p =
0.000, one-way ANOVA). An attempt to quantify the reduction of free radicals after CGA treatment in
the zebrafish embryos was made using the fluorescent dye DCFH-DA, however the results from these
experiments were inconclusive.
As a way to enhance bioavailability of the LMWAs and to prolong clearance a nanoformulation using
PLGA was developed to encapsulate chlorogenic acid. The PLGA particles with chlorogenic acid exhibit
a size of 237 ± 26.29 nm, a PDI of 0.259 and a charge of -7 ± 4.9 mV with an entrapment efficiency of
CGA of 58%. The release of CGA by PLGA nanoparticles is expected to show an initial burst release
of surface bound chlorogenic acid in the first 3 hours and then a steady release over the next 3 days.
However, this was not observed in the tested formulation. An initial release is observed in some samples
but not all, and after the first 3 hours no measurable release is observed. The release profile was
determined over three days and analysed using gradient RP-HPLC, which was previously validated.
Overall, it can be concluded that chlorogenic acid maintains its antioxidant activity in zebrafish embryos
and is absorbed in quantities sufficient to arrest or reverse damage elicited by auranofin. The protective
effect of chlorogenic acid is especially evident regarding haemorrhage in the embryos provides insight
into the traditional use of pūhā in the Māori culture. Furthermore, is the zebrafish an ideal model to
investigate the migration of damaged cells in the early stages of development.
REFERENCES
[67]
7. REFERENCES
Multifunctional Nanoparticles for Drug delivery applications 2012.
Abouzeid AH, & Torchilin VP (2013). The role of cell cycle in the efficiency and activity of cancer nanomedicines. Expert Opinion on Drug Delivery 10: 775-786.
Akao T, Kimura T, Hirofuji Y-s, Matsunaga K, Imayoshi R, Nagao J-i, et al. (2010). A poly(γ-glutamic acid)–amphiphile complex as a novel nanovehicle for drug delivery system. Journal of Drug Targeting 18: 550-556.
Alam MN, Bristi NJ, & Rafiquzzaman M (2013). Review on in vivo and in vitro methods evaluation of antioxidant activity. Saudi Pharmaceutical Journal 21: 143-152.
Anand P, Nair HB, Sung B, Kunnumakkara AB, Yadav VR, Tekmal RR, et al. (2010). Design of curcumin-loaded PLGA nanoparticles formulation with enhanced cellular uptake, and increased bioactivity in vitro and superior bioavailability in vivo. Biochemical pharmacology 79: 330-338.
Angelucci F, Sayed AA, Williams DL, Boumis G, Brunori M, Dimastrogiovanni D, et al. (2009). Inhibition of Schistosoma mansoni Thioredoxin-glutathione Reductase by Auranofin: structural and kinetic aspects. The Journal of Biological Chemistry 284: 28977-28985.
Astete CE, Dolliver D, Whaley M, Khachatryan L, & Sabliov CM (2011). Antioxidant Poly(lactic-co-glycolic) Acid Nanoparticles Made with α-Tocopherol–Ascorbic Acid Surfactant ACS Nano 5: 9313-9325.
Azmir J, Zaidul ISM, Rahman MM, Sharif KM, Mohamed A, Sahena F, et al. (2013). Techniques for extraction of bioactive compounds from plant materials: A review. Journal of Food Engineering 117: 426-436.
Barenholz Y (2012). Doxil® — The first FDA-approved nano-drug: Lessons learned. Journal of Controlled Release 160: 117-134.
Bell TW (1890). Medical notes on New Zealand. In New Zealand Medical Journal 3: 65-83, 129-145.
Bilati U, Allémann E, & Doelker E (2005). Poly(D,L-lactide-co-glycolide) protein-loaded nanoparticles prepared by the double emulsion method—processing and formulation issues for enhanced entrapment efficiency. Journal of Microencapsulation 22: 205-214.
Bouayed J, & Bohn T (2010). Exogenous antioxidants—Double-edged swords in cellular redox state: Health beneficial effects at physiologic doses versus deleterious effects at high doses. Oxidative Medicine and Cellular Longevity 3: 228-237.

REFERENCES
[68]
Carlsen MH, Halvorsen BL, Holte K, Bøhn SK, Dragland S, Sampson L, et al. (2010). The total antioxidant content of more than 3100 foods, beverages, spices, herbs and supplements used worldwide. Nutrition Journal 9: 3-3.
Carney TJ, Dutton KA, Greenhill E, Delfino-Machin M, Dufourcq P, Blader P, et al. (2006). A direct role for Sox10 in specification of neural crest-derived sensory neurons. Development 133: 4619-4630.
Cohen-Sela E, Teitlboim S, Chorny M, Koroukhov N, Danenberg HD, Gao J, et al. (2009). Single and double emulsion manufacturing techniques of an amphiphilic drug in PLGA nanoparticles: Formulations of mithramycin and bioactivity. Journal of pharmaceutical sciences 98: 1452-1462.
Conner SD, & Schmid SL (2003). Regulated portals of entry into the cell. Nature 422: 37-44.
Cruz T, Gaspar R, Donato A, & Lopes C (1997). Interaction between polyalkylcyanoacrylate nanoparticles and peritoneal macrophages: MTT metabolism, NBT reduction, and NO production. Pharm Res 14: 73-79.
Danhier F, Ansorena E, Silva JM, Coco R, Le Breton A, & Préat V PLGA-based nanoparticles: An overview of biomedical applications 2012. Journal of Controlled Release 161: 505-522.
De Jong WH, & Borm PJA (2008). Drug delivery and nanoparticles: Applications and hazards. International Journal of Nanomedicine 3: 133-149.
Desai N, Trieu V, Yao Z, Louie L, Ci S, Yang A, et al. (2006). Increased antitumor activity, intratumor paclitaxel concentrations, and endothelial cell transport of cremophor-free, albumin-bound paclitaxel, ABI-007, compared with cremophor-based paclitaxel. Clinical cancer research : an official journal of the American Association for Cancer Research 12: 1317-1324.
Dordelmann G, Kozlova D, Karczewski S, Lizio R, Knauer S, & Epple M (2014). Calcium phosphate increases the encapsulation efficiency of hydrophilic drugs (proteins, nucleic acids) into poly(d,l-lactide-co-glycolide acid) nanoparticles for intracellular delivery. Journal of Materials Chemistry B 2: 7250-7259.
E. Mutschler GG, H. K. Kroemer, S. Menzel, P. Ruth (2013). Mutschler Arzneimittelwirkungen. In Mutschler Arzneimittelwirkungen. Wissenschaftlice Verlagsgesellschaft mbH: Germany, pp 534-535.
Elsaesser A, & Howard CV (2012). Toxicology of nanoparticles. Advanced drug delivery reviews 64: 129-137.
Elsdon B (1942). Forest lore of the Māori: Dominion Museum Bulletin 14.

REFERENCES
[69]
Engeszer RE, Patterson LB, Rao AA, & Parichy DM (2007). Zebrafish in The Wild: A Review of Natural History And New Notes from The Field. Zebrafish 4: 21-40.
Fako VE, & Furgeson DY (2009). Zebrafish as a correlative and predictive model for assessing biomaterial nanotoxicity. Advanced drug delivery reviews 61: 478-486.
Fang L, & Miller YI (2012). Emerging applications for zebrafish as a model organism to study oxidative mechanisms and their roles in inflammation and vascular accumulation of oxidized lipids. Free Radical Biology and Medicine 53: 1411-1420.
FDA (1994). Reviewer Guidance Validation of Chromatograyphic Methods.
Flohé L, & Harris JR (2007) Peroxiredoxin Systems: Structures and Functions. Springer Netherlands.
Fukai T, & Ushio-Fukai M (2011). Superoxide Dismutases: Role in Redox Signaling, Vascular Function, and Diseases. Antioxidants & Redox Signaling 15: 1583-1606.
Gould KS, Thodey K, Philpott M, & Ferguson LR (2006). Antioxidant activities of extracts from traditional Maori food plants. New Zealand Journal of Botany 44: 1-4.
Gupta RB, & Kompella UB (2006) Nanoparticle technology for drug delivery. Taylor & Francis: New York.
Gutteridge JMC (1994). Biological origin of free radicals, and mechanisms of antioxidant protection. Chemico-biological interactions 91: 133-140.
Hirn S, Semmler-Behnke M, Schleh C, Wenk A, Lipka J, Schäffler M, et al. (2011). Particle size-dependent and surface charge-dependent biodistribution of gold nanoparticles after intravenous administration. European Journal of Pharmaceutics and Biopharmaceutics 77: 407-416.
Huang W-y, Zhang H-c, Liu W-x, & Li C-y (2012). Survey of antioxidant capacity and phenolic composition of blueberry, blackberry, and strawberry in Nanjing. Journal of Zhejiang University Science B 13: 94-102.
Hunter RJ, Ottewill RH, & Rowell RL (2013) Zeta Potential in Colloid Science: Principles and Applications. Elsevier Science.
ICH (1994). Validation of analytical procedures: Text and Methodology, Q2(R1).
Karamać M, Kosińska A, Estrella I, Hernández T, & Dueñas M (2012). Antioxidant activity of phenolic compounds identified in sunflower seeds. Eur Food Res Technol 235: 221-230.
Kean WF, Hart L, & Buchanan WW (1997). Auranofin. Rheumatology 36: 560-572.

REFERENCES
[70]
Kilkenny C, Browne W, Cuthill IC, Emerson M, & Altman DG (2010). Animal research: Reporting in vivo experiments: The ARRIVE guidelines. British Journal of Pharmacology 160: 1577-1579.
Kim D-W, Kim S-Y, Kim H-K, Kim S-W, Shin SW, Kim JS, et al. (2007). Multicenter phase II trial of Genexol-PM, a novel Cremophor-free, polymeric micelle formulation of paclitaxel, with cisplatin in patients with advanced non-small-cell lung cancer. Annals of Oncology 18: 2009-2014.
Kim JA, Aberg C, Salvati A, & Dawson KA (2012). Role of cell cycle on the cellular uptake and dilution of nanoparticles in a cell population. Nat Nano 7: 62-68.
Kocbek P, Obermajer N, Cegnar M, Kos J, & Kristl J (2007). Targeting cancer cells using PLGA nanoparticles surface modified with monoclonal antibody. Journal of controlled release : official journal of the Controlled Release Society 120: 18-26.
Kwak J, Park OK, Jung YJ, Hwang BJ, Kwon S-H, & Kee Y (2013). Live Image Profiling of Neural Crest Lineages in Zebrafish Transgenic Lines. Molecules and Cells 35: 255-260.
Longmire M, Choyke PL, & Kobayashi H (2008). Clearance Properties of Nano-sized Particles and Molecules as Imaging Agents: Considerations and Caveats. Nanomedicine (London, England) 3: 703-717.
Love SA, Maurer-Jones MA, Thompson JW, Lin Y-S, & Haynes CL (2012). Assessing Nanoparticle Toxicity. Annual Review of Analytical Chemistry 5: 181-205.
Lyklema H (1995). Preface to volume II: Solid-liquid interfaces. In Fundamentals of Interface and Colloid Science. eds J. J. Lyklema A.d.K.B.H.B.G.J.F., & Stuart M.A.C. Academic Press, pp vii-ix.
Martin KR, & Barrett JC (2002). Reactive oxygen species as double-edged swords in cellular processes: low-dose cell signaling versus high-dose toxicity. Human & experimental toxicology 21: 71-75.
McCall RL, & Sirianni RW (2013). PLGA Nanoparticles Formed by Single- or Double-emulsion with Vitamin E-TPGS. Journal of Visualized Experiments : JoVE: 51015.
McDowell A, Thompson S, Stark M, Ou ZQ, & Gould KS (2011). Antioxidant activity of puha (Sonchus oleraceus L.) as assessed by the cellular antioxidant activity (CAA) assay. Phytotherapy research : PTR 25: 1876-1882.
McGraw HF, Nechiporuk A, & Raible DW (2008). Zebrafish dorsal root ganglia neural precursor cells adopt a glial fate in the absence of neurogenin1. The Journal of neuroscience : the official journal of the Society for Neuroscience 28: 12558-12569.

REFERENCES
[71]
Mugoni V, Camporeale A, & Santoro MM (2014). Analysis of Oxidative Stress in Zebrafish Embryos. e51328.
Nakajima H, Nakajima-Takagi Y, Tsujita T, Akiyama S-I, Wakasa T, Mukaigasa K, et al. (2011). Tissue-Restricted Expression of Nrf2 and Its Target Genes in Zebrafish with Gene-Specific Variations in the Induction Profiles. PloS one 6: e26884.
Newman T (2015). Radical Development, the developmental consequences of oxidative stress in zebrafishUniversity of Otago.
Newman TAC, Carleton CR, Leeke B, Hampton MB, & Horsfield JA (2015). Embryonic oxidative stress results in reproductive impairment for adult zebrafish. Redox Biology 6: 648-655.
Oh N, & Park J-H (2014). Endocytosis and exocytosis of nanoparticles in mammalian cells. International Journal of Nanomedicine 9: 51-63.
Onoue S, Yamada S, & Chan H-K (2014). Nanodrugs: pharmacokinetics and safety. International Journal of Nanomedicine 9: 1025-1037.
Ou ZQ, Rades T, & McDowell A (2015). Anti-ageing effects of Sonchus oleraceus L. (puha) leaf extracts on H(2)O(2)-induced cell senescence. Molecules 20: 4548-4564.
Ou ZQ, Schmierer DM, Rades T, Larsen L, & McDowell A (2013). Application of an online post-column derivatization HPLC-DPPH assay to detect compounds responsible for antioxidant activity in Sonchus oleraceus L. leaf extracts. The Journal of pharmacy and pharmacology 65: 271-279.
Ou ZQ, Schmierer DM, Strachan CJ, Rades T, & McDowell A (2014). Influence of postharvest processing and storage conditions on key antioxidants in puha (Sonchus oleraceus L.). The Journal of pharmacy and pharmacology 66: 998-1008.
OZF (2014). Standard operating procedures Otago Zebrafish Facility
Pandey KB, & Rizvi SI (2009). Plant polyphenols as dietary antioxidants in human health and disease. Oxidative Medicine and Cellular Longevity 2: 270-278.
Parveen S, Misra R, & Sahoo SK (2012). Nanoparticles: a boon to drug delivery, therapeutics, diagnostics and imaging. Nanomedicine: Nanotechnology, Biology and Medicine 8: 147-166.
Pathak Y, & Thassu D (2009). Recent Developments in Nanoparticulate Drug Delivery Systems In Drug Delivery Nanoparticles Formulation and Characterization. CRC Press, pp 1-15.

REFERENCES
[72]
Pecora R (2013) Dynamic Light Scattering: Applications of Photon Correlation Spectroscopy. Springer US.
Pereira JA, Oliveira I, Sousa A, Ferreira ICFR, Bento A, & Estevinho L (2008). Bioactive properties and chemical composition of six walnut (Juglans regia L.) cultivars. Food and Chemical Toxicology 46: 2103-2111.
Pool H, Quintanar D, Figueroa JdD, Marinho Mano C, Bechara JEH, God, et al. (2012). Antioxidant Effects of Quercetin and Catechin Encapsulated into PLGA Nanoparticles. Journal of Nanomaterials 2012: 12.
Popat A, Ross BP, Liu J, Jambhrunkar S, Kleitz F, & Qiao SZ (2012). Enzyme-Responsive Controlled Release of Covalently Bound Prodrug from Functional Mesoporous Silica Nanospheres. Angewandte Chemie International Edition 51: 12486-12489.
Ratnam DV, Ankola DD, Bhardwaj V, Sahana DK, & Kumar MNVR (2006). Role of antioxidants in prophylaxis and therapy: A pharmaceutical perspective. Journal of Controlled Release 113: 189-207.
Riegler J, Liew A, Hynes SO, Ortega D, O’Brien T, Day RM, et al. (2013). Superparamagnetic iron oxide nanoparticle targeting of MSCs in vascular injury. Biomaterials 34: 1987-1994.
Rigobello MP, Folda A, Baldoin MC, Scutari G, & Bindoli A (2005). Effect of auranofin on the mitochondrial generation of hydrogen peroxide. Role of thioredoxin reductase. Free radical research 39: 687-695.
Rizzo LY, Golombek SK, Mertens ME, Pan Y, Laaf D, Broda J, et al. (2013). In vivo nanotoxicity testing using the zebrafish embryo assay. Journal of Materials Chemistry B 1: 3918-3925.
Schleich N, Po C, Jacobs D, Ucakar B, Gallez B, Danhier F, et al. (2014). Comparison of active, passive and magnetic targeting to tumors of multifunctional paclitaxel/SPIO-loaded nanoparticles for tumor imaging and therapy. Journal of Controlled Release 194: 82-91.
Shahidi F (1997) Natural Antioxidants: Chemistry, Health Effects, and Applications. AOCS Press.
Srivastava AK, Bhatnagar P, Singh M, Mishra S, Kumar P, Shukla Y, et al. (2013). Synthesis of PLGA nanoparticles of tea polyphenols and their strong in vivo protective effect against chemically induced DNA damage. International Journal of Nanomedicine 8: 1451-1462.
Sykes EA, Chen J, Zheng G, & Chan WCW (2014). Investigating the Impact of Nanoparticle Size on Active and Passive Tumor Targeting Efficiency. ACS Nano 8: 5696-5706.
Torchilin V (2010). Passive and Active Drug Targeting: Drug Delivery to Tumors as an Example. In Drug delivery. ed Schäfer-Korting M. Springer Berlin Heidelberg, pp 3-53.

REFERENCES
[73]
Treuel L, Jiang X, & Nienhaus GU (2013) New views on cellular uptake and trafficking of manufactured nanoparticles. vol. 10.
Valko M, Leibfritz D, Moncol J, Cronin MTD, Mazur M, & Telser J (2007). Free radicals and antioxidants in normal physiological functions and human disease. The International Journal of Biochemistry & Cell Biology 39: 44-84.
Valko M, Rhodes CJ, Moncol J, Izakovic M, & Mazur M (2006). Free radicals, metals and antioxidants in oxidative stress-induced cancer. Chemico-biological interactions 160: 1-40.
Vertuani S, Scalambra E, Vittorio T, Bino A, Malisardi G, Baldisserotto A, et al. (2014). Evaluation of Antiradical Activity of Different Cocoa and Chocolate Products: Relation with Lipid and Protein Composition. Journal of medicinal food 17: 512-516.
Vicario-Parés U, Castañaga L, Lacave J, Oron M, Reip P, Berhanu D, et al. (2014). Comparative toxicity of metal oxide nanoparticles (CuO, ZnO and TiO2) to developing zebrafish embryos. J Nanopart Res 16: 1-16.
Vilela FC, Bitencourt AD, Cabral LDM, Franqui LS, Soncini R, & Giusti-Paiva A (2010). Anti-inflammatory and antipyretic effects of Sonchus oleraceus in rats. Journal of Ethnopharmacology 127: 737-741.
Vilela FC, Padilha Mde M, Alves-da-Silva G, Soncini R, & Giusti-Paiva A (2010). Antidepressant-like activity of Sonchus oleraceus in mouse models of immobility tests. Journal of medicinal food 13: 219-222.
Werner ME, Cummings ND, Sethi M, Wang EC, Sukumar R, Moore DT, et al. (2013). Preclinical Evaluation of Genexol-PM, a Nanoparticle Formulation of Paclitaxel, as a Novel Radiosensitizer for the Treatment of Non-Small Cell Lung Cancer. International journal of radiation oncology, biology, physics 86: 463-468.
Westerfield M (2000). The Zebrafish Book. A guide for the laboratory use of zebrafish (Danio rerio).
Wilczewska AZ, Niemirowicz K, Markiewicz KH, & Car H (2012). Nanoparticles as drug delivery systems. Pharmacological reports : PR 64: 1020-1037.
Wolfe KL, & Liu RH (2007). Cellular Antioxidant Activity (CAA) Assay for Assessing Antioxidants, Foods, and Dietary Supplements. Journal of Agricultural and Food Chemistry 55: 8896-8907.
Yen G-C, & Chen H-Y (1995). Antioxidant Activity of Various Tea Extracts in Relation to Their Antimutagenicity. Journal of Agricultural and Food Chemistry 43: 27-32.
Yeo Y (2013) Nanoparticulate drug delivery systems : strategies, technologies, and applications. Hoboken, New Jersey : Wiley.

REFERENCES
[74]
Yin J, Kwon G-J, & Wang M-H (2007). The antioxidant and cytotoxic activities of Sonchus oleraceus L. extracts. Nutrition Research and Practice 1: 189-194.
Yin J, Si C-L, & Wang M-H (2008). Antioxidant Activity of Flavonoids and Their Glucosides from Sonchus oleraceus L. Journal of Applied Biological Chemistry.
Zhao M, Lei C, Yang Y, Bu X, Ma H, Gong H, et al. (2015). Abraxane, the Nanoparticle Formulation of Paclitaxel Can Induce Drug Resistance by Up-Regulation of P-gp. PloS one 10: e0131429.