improving plant nutrient management fordeficient in soils and crops also increased. micronutrient...
TRANSCRIPT

OUT2 Crop residues
OUT1 Harvested products
OUT3 Leaching
OUT4 Gaseous losses
OUT5 Erosion
IN2 Manure
IN1 Mineral fertilizers
IN3 Deposition
IN4 Biological N fixation
IN5 Sedimentation
Animals
Crops
Soilorganic and
mineralN, P & K
IMPROVING PLANT NUTRIENT MANAGEMENT
FOR
BETTER FARMER LIVELIHOODS, FOOD SECURITY ANDENVIRONMENTAL SUSTAINABILITY
Proceedings of a Regional Workshop
Beijing, China12-16 December 2005
RAP PUBLICATION 2006/27

RAP PUBLICATION 2006/27
FOOD AND AGRICULTURE ORGANIZATION OF THE UNITED NATIONSREGIONAL OFFICE FOR ASIA AND THE PACIFIC
Bangkok, 2006
IMPROVING PLANT NUTRIENT MANAGEMENT
FOR
BETTER FARMER LIVELIHOODS, FOOD SECURITY ANDENVIRONMENTAL SUSTAINABILITY
Proceedings of a Regional Workshop
Beijing, China12-16 December 2005

ii
The designation and presentation of material in this publication do not imply the expression ofany opinion whatsoever on the part of the Food and Agriculture Organization of the UnitedNations concerning the legal status of any country, territory, city or area of its authorities, orconcerning the delimitation of its frontiers and boundaries.
NOTICE OF COPYRIGHT
All rights reserved. Reproduction and dissemination of material in this information product foreducational or other non-commercial purposes are authorized without any prior writtenpermission from the copyright holders provided the source is fully acknowledged.Reproduction of material in this information product for sale or other commercial purposes isprohibited without written permission of the copyright holders. Applications for suchpermission should be addressed to the Land Management Officer, FAO Regional Office forAsia and the Pacific, Maliwan Mansion, 39 Phra Athit Road, Bangkok 10200, Thailand.
FAO 2006
ISBN 978-974-7946-92-5
For copies write to: Yuji NiinoFAO Regional Office for Asia and the PacificMaliwan Mansion, 39 Phra Atit RoadBangkok 10200THAILANDTel: (+66) 2 697 4000Fax: (+66) 2 697 4445E-mail: [email protected]

iii
Foreword
Agricultural development in Asia and the Pacific has had its bright spots in terms of research anddevelopment in securing basic food needs and food reserves. The last decades have been marked bythe continuing development of new hybrids and many open pollinated, high yielding varieties thatdouble if not triple yields per unit area. This breakthrough provided alternative technologies forcountries that had limited arable lands (generally Pacific Island countries, particularly the SmallIsland States) and countries that had been losing their lands to unabated high population growth,urbanization, industrialization and even pollution (generally Asian countries like China, Indonesia,the Philippines and others). Unfortunately, because of the urgency of improving food security,agricultural policy and infrastructure support in many Asian and Pacific countries were generallybuilt around two basic short-term objectives with short-term benefits: improving crop yields andimproving the incomes of small and resource poor farmers, with minimal measures to ensure thathigh yielding plants be provided with adequate and balanced plant nutrients to avoid serious soilfertility depletion. Thus, glaring enough in many countries in the region, despite the availability ofhigh yielding plants and irrigation, is the stagnation of yields and decline of soil fertility broughtabout by (a) unsound fertilizer policies and (b) inadequate national efforts in monitoring andevaluating the combined impacts of fertilizer use and high yields on soil degradation, particularlyfertilizer-induced soil nutrient deficiencies.
In most instances, government policy-makers focused on providing support in the form of subsidiesfor high yielding seeds and irrigation, but rarely provided adequate support for proper and balancedplant nutrition. Fertilizers, wherever they are a part of government support, are heavily in favour ofUrea, the main fertilizer whose impact on the physical appearance of the plants is easily recognizableby the farmers. The net result was the excessive use of Urea which eventually created anunfavourable balance of nitrogen (N) with phosphorous (P) and potassium (K) nutrients. Thisnutrient imbalance has been recognized as the emerging major culprit in the decline and stagnationof food crop production and the general decline in soil fertility and production capacity in practicallyall countries in Asia and the Pacific region. A case in point was cited by the experience in India,which reported that as food production increased with time, the number of elements becomingdeficient in soils and crops also increased. Micronutrient deficiencies in soils over long periods ofnutrient supply imbalance in intensively used croplands are also emerging as yield limiting factors.Nutrient imbalances in intensively used agricultural lands can create a time-bound domino effect onthe emergence of deficiencies of secondary and micronutrients.
As a way to strengthen awareness and improve common understanding of the complex dynamics ofsustainable crop production, soil nutrient management and soil stability between and amongscientists and land use practitioners in Asia-Pacific, FAO conducted a three day “Regional Workshopon Improving Plant Nutrient Management for Better Farmer Livelihoods, Food Security andEnvironmental Sustainability”. Participants from 17 countries in the region discussed, elaborated onand identified country-relevant issues and gaps, and exchanged ideas and recommendations tocollectively formulate technical and policy measures with particular focus on developing bothcountry and regional options and actions for making Integrated Plant Nutrient Management (IPNM)the alternative technology for sustainable crop production and soil fertility management.
As a result of the thorough exchange of information and experiences on IPNM by the participants,the workshop opened up a new agenda that, in addition to ensuring food security, recognized theemerging role of the agricultural sector in promoting soil and land use stability. This will, therefore,require creation of an enabling agricultural policy environment that will incorporate social andenvironmental responsibility in overall crop production to ensure that all lands put into cultivation

iv
shall not in any manner lead to the degradation of human health, biodiversity and the environment.It is hoped that the result of this workshop will lead to greater awareness of and capacity building forfarm level nutrient management, more specifically in enhancing the capacity of farmers to useorganic and inorganic fertilizers safely, and in protecting the regions’ soil resources.
He ChangchuiAssistant Director-General and
Regional Representative for Asia and the PacificFood and Agriculture Organization of the United Nations

v
Acknowledgements
The workshop was ably hosted by the China Agriculture University (CAU) under the effectivecoordination of Dr Fan Mingsheng with the full support of Dr N. Mona, the FAO Representative inChina and CAU’s eminent agricultural scientists, led by Professor Zhang Fusuo.
Sixteen experts and practioners from various institutions in Asia and the Pacific made substantialcontributions to the active and practical exchange of applicable technologies, knowledge and lessonslearned in Integrated Plant Nutrition Management. The participants represented five South Asiancountries (Bangladesh, India, Nepal, Pakistan, and Sri Lanka), six Southeast Asian countries(Cambodia, Lao People’s Democratic Republic, Myanmar, the Philippines, Thailand and Viet Nam);three Pacific Island countries (Fiji, Papua New Guinea and Tonga) and two East Asian countries(China and Democratic People’s Republic of Korea).
Special mention should be given to the full support, unqualified contributions and effectiveparticipation provided by eminent scientists from different colleges and universities in China. Thisincludes the College of Resources and Environment Science China Agriculture University; Collegeof Resource and Environmental Sciences, Nanjing Agricultural University; State Key Laboratory ofSoil and Sustainable Agriculture Institute of Soil Science, Chinese Academy of Sciences; Soil andFertility Institute, Sichuan Academy of Agriculture Science; Northwest Sci-tech University ofAgriculture and Forestry, Institute of Soil and Water Conservation; Northwest Sci-tech University ofAgriculture and Forestry Resource and Environment College Shanxi, Institute of Soil and Fertilizer;and Institute of Atmospheric Physics, Chinese Academy of Sciences.
Much of the facilitation and guidance in the lively discussions on issues and solutions to theproblems related to integrated nutrient management were provided by FAO experts led by Dr RabindraRoy, Mr Hiroshi Hiraoka and Dr Yuji Niino.
Additional and very valuable experiences and insights into China’s efforts on INM were enhanced byfield visits arranged and sponsored by the China Agricultural University and with the help of Dr FanMingsheng whose active participation in the workshop was highly appreciated by the workshopparticipants.
We wish to thank Dr Fan Mingsheng and Professor Zhang Fusuo for compiling and Dr RogelioConcepcion for editing of these proceedings.

vi

vii
Table of Contents
Page
Foreword .................................................................................................................................. iii
Acknowledgements .................................................................................................................. v
Part I. The workshop .......................................................................................................... 1
Part II. Synthesis of Asia and the Pacific region’s perspective on nutrient
manegement and soil productivity ......................................................................... 1
Part III. Highlights of common country-level issues on integrated nutrientmanagement ............................................................................................................. 5
Part IV. Recommendations ................................................................................................... 9
Part V. Conclusions .............................................................................................................. 10
Part VI. Country papers ........................................................................................................ 11
SOUTH ASIAN COUNTRIES ......................................................................................... 13
Paper Number 1: BANGLADESH .......................................................................... 13
Paper Number 2: INDIA .......................................................................................... 26
Paper Number 3: NEPAL ......................................................................................... 41
Paper Number 4: PAKISTAN .................................................................................. 58
Paper Number 5: SRI LANKA ................................................................................ 73
SOUTHEAST ASIAN COUNTRIES ............................................................................... 94
Paper Number 6: CAMBODIA ................................................................................ 94
Paper Number 7: LAO PEOPLE’S DEMOCRATIC REPUBLIC........................... 99
Paper Number 8: MYANMAR................................................................................. 112
Paper Number 9: THE PHILIPPINES ..................................................................... 125
Paper Number 10: THAILAND (1) ......................................................................... 144
Paper Number 11: THAILAND (2) ......................................................................... 149
Paper Number 12: VIET NAM ................................................................................ 158
PACIFIC ISLAND COUNTRIES ..................................................................................... 166
Paper Number 13: FIJI ............................................................................................. 166
Paper Number 14: PAPUA NEW GUINEA ............................................................. 174
Paper Number 15: TONGA ...................................................................................... 184
EAST ASIAN COUNTRIES ............................................................................................. 188
Paper Number 16: CHINA ....................................................................................... 188
Paper Number 17: DEMOCRATIC PEOPLE’S REPUBLIC OF KOREA ............. 212
viii
Part VII. Lessons learned and experiences, technology measures and constraints inthe implementation of Integrated Nutrient Management (INM) ..................... 221
Annex Table 1. Lessons learned and experiences, technology measures and constraints inthe implementation of INM in Bangladesh .................................................. 223
Annex Table 2. Lessons learned and experiences, technology measures and constraints inthe implementation of INM in Cambodia ..................................................... 224
Annex Table 3. Lessons learned and experiences, technology measures and constraints inthe implementation of INM in China............................................................ 225
Annex Table 4. Lessons learned and experiences, technology measures and constraints inthe implementation of INM in Fiji ................................................................ 226
Annex Table 5. Lessons learned and experiences, technology measures and constraints inthe implementation of INM in India ............................................................. 227
Annex Table 6. Lessons learned and experiences, technology measures and constraints inthe implementation of INM in DPR Korea................................................... 228
Annex Table 7. Lessons learned and experiences, technology measures and constraints inthe implementation of INM in Lao PDR ...................................................... 229
Annex Table 8. Lessons learned and experiences, technology measures and constraints inthe implementation of INM in Myanmar...................................................... 230
Annex Table 9. Lessons learned and experiences, technology measures and constraints inthe implementation of INM in Pakistan........................................................ 231
Annex Table 10. Lessons learned and experiences, technology measures and constraints inthe implementation of INM in Papua New Guinea ...................................... 232
Annex Table 11. Lessons learned and experiences, technology measures and constraints inthe implementation of INM in the Philippines ............................................. 233
Annex Table 12. Lessons learned and experiences, technology measures and constraints inthe implementation of INM in Nepal ............................................................ 234
Annex Table 13. Lessons learned and experiences, technology measures and constraints inthe implementation of INM in Sri Lanka ..................................................... 235
Annex Table 14. Lessons learned and experiences, technology measures and constraints inthe implementation of INM in Thailand (1) ................................................. 236
Annex Table 15. Lessons learned and experiences, technology measures and constraints inthe implementation of INM in Thailand (2) ................................................. 237
Annex Table 16. Lessons learned and experiences, technology measures and constraints inthe implementation of INM in Tonga ........................................................... 238
Annex Table 17. Lessons learned and experiences, technology measures and constraints inthe implementation of INM in Viet Nam ...................................................... 239
Part VIII. Workshop programme and list of participants .................................................. 241
Annex Table 18. Workshop participants .................................................................................. 243
Annex Table 19. Workshop programme................................................................................... 247
Table of Contents (continued)
Page

1
Part I. The workshop
A. Objectives
The workshop brought together various senior scientists of Asia and the Pacific countries to freelyinteract and exchange information and knowledge gained in research and development on IntegratedNutrient Management (INM) and its impact on soil fertility and farmers’ yields and income. Theworkshop and ensuing discussions were designed to satisfy the following key objectives:
● Review the latest progress on integrated nutrient management;
● Identify integrated nutrient management issues and technical gaps;
● Formulate potential technical and policy measures and options for Integrated NutrientManagement, including methods and modalities in each country; and
● Identify common technical issues for regional action on integrated nutrient management.
B. Participants
The workshop was attended by senior soil and plant nutrition specialists from Bangladesh,Cambodia, China, DPR Korea, Fiji, Indonesia, Lao PDR, Myanmar, Nepal, Pakistan, Papua NewGuinea, the Philippines, Sri Lanka, Thailand, Tonga and Viet Nam including experts and staff ofFAO and China Agricultural University.
C. General design and scope of discussions
Individual country papers were presented by senior scientists from Asia and the Pacific region.Paper presentations were followed by a workshop which reviewed fertilizer use, soil fertility, andnutrient flow situations, lessons learned and shared experiences of the countries in research,technology development and transfer of knowledge and information on integrated nutrientmanagement. The participants, likewise, recognized that rapid urbanization is a common barrier tolong-term sustainable land management and agricultural land use development. The workshopparticipants discussed ways and means to promote close collaboration within Asia and the Pacificregion for future exchanges of information, data, expertise and experiences in integrated nutrientmanagement. There was a convergence of agreement for the adoption of South-South Cooperationand to strengthen future partnership with the FAO global network as the region’s common platformto promote interregional exchanges of country experts, enhance sharing of knowledge andexperiences in research, development and extension on integrated nutrient management and otheraspects of sustainable soil and land management technologies.
Part II. Synthesis of Asia and the Pacific region’s perspective on nutrientmanagement and soil productivity
The 1996 World Food Summit established a strong linkage between Sustainable Agricultural andRural Development (SARD) and food security. SARD has identified sound management and use ofavailable natural resources and the environment as both a prerequisite and a means of achieving theobjective of food security.
The participants recognized that Asia and the Pacific region has the highest share of global landresources and at the same time the highest population. The participants, likewise, confirmed that

2
many production areas in the region have been suffering from a rapid and continuous decline in theman-arable land ratio. This decline in productive land predisposes the remaining intensively-usedfarmlands to a high incidence of soil erosion and rapid decline in soil fertility, which altogether leadsto a decline in the capacity of their natural resources to sustain their respective country’s future foodneeds.
Agriculture in the region has undergone notable transformations during the last four decades. Theglobal success of the Green Revolution programme provided the initial global consciousness of thestrategic value of making sustained improvements in the individual country’s food self reliance andlikewise provided the foundation for the role of science and modern technologies in meeting presentand future challenges.
Over the years, yield improvements were obtained through increased area of irrigated lands,development and use of improved varieties, and increased use of oil-based fertilizers. Asian cerealproduction registered more than a 260 percent increase from 386 million tonnes in year 1965 to1 009 thousand tonnes in year 2004, with similar trends for other agricultural commodities.Furthermore, the region’s average yield of paddy rice doubled from 2.0 t/ha in 1965 to 4.1 t/ha in2004, while that of wheat more or less tripled from 0.97 t/ha to 2.87 t/ha.
The increasing competition between farming and urbanization for use of agricultural land creates thecondition for a paradigm shift to the conscious campaign to develop and promote the awareness thatIntegrated Plant Nutrient Management System as a national, regional and global strategy to combatloss of farm productivity is a profitable investment for sustainable rural livelihood, food security andthe environment.
In recent years, gains in technology-driven crop production were challenged and threatened by theincreasing pressure from the external environment, extreme climate changes and global oil marketsituation and its impact on cost and availability of Urea, the most preferred fertilizer by smallfarmers in the region. The last decades were marked by research and development of newsuper-hybrids, environment-friendly pest and disease management, introduction of better use offertilizers and increased investment in irrigation development. However, a parallel event in the formof an increasing incidence of regional drought and flooding as well as increasing deforestation anduse of fragile marginal lands jointly contributed to an accelerated erosion and massive loss in soilorganic matter in Asia and the Pacific region. Furthermore, in recent years and perhaps inunforeseen periods into the future, the unstable global oil situation and its direct impact on thedoubling of the cost of inorganic fertilizers, particularly that of Urea, shall be the dominant barrier tothe sustainability of food and agricultural production, incomes and livelihood of small, vulnerablepoor farmers in the region.
The dramatic improvements in yields in many Asia and Pacific countries have, likewise, led to largerproblems of soil nutrient mining, aggravated by the fact that this complex process of soil fertility lossremained unknown to many farmers and local field extension technicians. Soil nutrient mining isa phenomenon where the withdrawal of nutrients by crops exceeds the combined external nutrientsupply and the mobilization of soil nutrients, which over time results in the exhaustion of native soilnutrient reserves and induction of deficiencies in some micronutrients. These situations have hadlarge impacts on the incomes of small, poor farmer’s, which has definitely translated into a decline intheir capacity to continue the adoption of modern agricultural production technologies. If soilnutrient mining is not addressed properly and immediately, serious impairment of soil productivitywill result in irreversible soil degradation and permanent loss of income, which altogether willgreatly weaken farm-level self-reliance and national capacities for food self-sufficiency.

3
Fertilizer subsidies resulted in increased fertilizer importation and utilization and dramatic increasesin country’s production of cereals and other food crops. However, even as the country enjoyed thebonanza of low cost fertilizers and the consequent improvement in food security, researchers noteda continuing decline in soil fertility and yield increments and increasing requirements of fertilizersper unit area, including a phenomenal loss in soil productivity and deterioration of water quality.
The general trend in fertilizer importation in most Asia and Pacific countries indicated a generalpreference for Urea and very minimal for Potash. Senior scientists from India indicated that this isbecause Urea is the preferred and main source of nitrogen because it is cheaper, easily available andprovides rapid response. They further provided information on the increased nutrient gap wherenutrient exports, in the form of farm products consumed as food medicine and other products, exceedthe net nutrient imports in the form of applied fertilizers.
The widening gap between the withdrawal of soil nutrients to produce food and the provision offertilizer supplements to prevent the total depletion of native soil nutrients is becoming an importantcommon concern in Asia and the Pacific region. This situation is highly relevant, critical and timesensitive since the only and perhaps the quickest alternative mitigation measure to compensate forthe decline and loss of arable land is the sustained development and provision of yield improvingtechnologies, such as early-maturing hybrids and irrigation, which encourage huge and fastwithdrawal of soil nutrient reserves in short periods. When soil nutrient and fertilizationmanagement is faulty in these time-sensitive yield improvement initiatives, there are serious negativeconsequences on the terrestrial and coastal environment and long-term food production programme.Over time, the unabated loss of soil fertility will trigger the silent and undetected process ofdesertification and eventually lead to the total and irreversible loss of land productivity andpopulation carrying capacity in the region.
The inadequate management of applied nutrients has also created an undesirable flow of nutrients,with most of the unused fraction released to the rivers, groundwater, lakes and other freshwaterbodies or released to the air in gaseous forms contributing to air pollution. At the farm householdlevel, the cost-benefit of farm input has declined. At the national and regional level, the plantnutrient balance has been negatively affected and so has the food production potential.
The common barriers to sustainability of food security efforts in the region, including countries withsuccessful food production programmes such as Bangladesh, China, India, Pakistan, Republic ofKorea and Viet Nam, are summarized below:
● Declining trends in soil fertility and mining of soil nutrients. The adoption of intensivecultivation and short duration high yielding varieties and the blanket application of plantnutrients without the benefit of proper and timely soil analysis are proving to be inadequateto sustain the loss of soil nutrient reserves to sustain long-term and cost-effective high cropproduction.
● Decline in soil organic matter levels. Poor on-farm management of soil organic matteralong with sub-optimal use of organic and biological nutrient sources, combined with theconcurrent soil nutrient mining, poor water management and poor soil cover havecollectively caused the rapid degradation/decline of soil organic matter. The generalabsence of comprehensive national programmes on organic-based farming, nutrientrecycling, and composting along with poor land management practices has led to a loss ofsoil infiltration capacity and soil erosion that eventually has resulted in the rapid removal ofsurface soil organic matter by run off. Furthermore, while poor on-farm management couldbe attributed to a lack of proper information and technology transmission to the farmers insome areas, the reduced availability and access to organic resources, compounded by

4
undefined socio-economic factors are the outstanding constraints and barriers to the use ofadequate amounts and proportion of organic and inorganic fertilizers.
● Overuse and inefficient utilization of mineral fertilizers and resulting deterioration ofenvironmental quality. Many areas in the region witnessed both the conditions ofinadequate availability and affordability of key agricultural inputs like mineral fertilizers.There is a serious concern about the overdose of fertilizers as shown by the general trendfor some farmers to misuse and apply excessive amounts of inorganic fertilizers, especiallyUrea. Country reports from the China, India, the Philippines and other countries indicatesthat in recent years there has been a tremendous increase in the importation of Urea indisproportionate volume against phosphorous and Potash fertilizers. Inadequate awarenessconcerning efficient fertilizer use and appropriate practices have resulted in inefficientreleases of soil nutrients with respect to the actual needs of the plant for optimum growthand production into the already weakened ecosystem, causing water and soil pollution.
Participants clearly showed a regional convergence regarding policy and technical measures tocombat the decline in soil fertility and food supplying capacity of agricultural lands. Scientists in theregion are in common agreement on the need for the efficient and balanced use of nutrients by plantsand the need to apply scientific measures to ensure that soil fertility is sustained while engagingfarmers to improve their yields through the use of short maturing, proper water management and useof IPM.
Despite complex differences in sizes of population, socio-economic conditions and land areas,scientific communities, land use policy-makers and practitioners in Asia-Pacific countries havecommitted themselves to strengthening regional cooperation and national capacities to developa more rational integrated approach to nutrient and natural resources management and sustainableland management that link food production with rural livelihood, environmental protection andbiological diversity improvement. In terms of combating problems of declining production andyields among small poor farmers, Asia-Pacific countries have adopted a common approach, albeitwith differing efficiency and success, involving organic-based fertilization following balancefertilization principles and methods.
In response to the global search for cost-effective fertilization measures, farm waste recycling andaccelerated compost production, the oldest yet relevant alternative technologies have become theregion’s consensus for the convergence of socially acceptable cost reduction measures that helpstabilize soil productivity, farm income and livelihood of poor farming communities in Asia and thePacific region.
While some Asia-Pacific countries are at the crossroads to industrialization, agriculture generallyremained steadfast as the region’s primary industry to combat growing population and food securityneeds and environmental degradation. China and India, for instance, which have both the largestland area and population in the region and have moved successfully towards urban development andindustrialization, still consider agriculture the primary area of development and investment. In therecent years, China, along with most Asia-Pacific countries, has mobilized its scientific communitiesto address concerns about Integrated Nutrient Management to support sustainable agriculturaldevelopment for food security and securing rural areas against the vagaries of global and nationaleconomic development.

5
Part III. Highlights of common country-level issues on integrated nutrientmanagement
The summary of the lessons learned, policies and constraints in implementing integrated nutrientmanagement in Asia-Pacific countries are presented in the Annexes to Part VII (Tables 1 through 17).
Knowledge gaps in IPNS management between scientists and farmers remain a major factor in thecomplex dynamics of soil-plant nutrient management to effectively sustain the balance between soilnutrient reserves with actual plant nutrient uptake and nutrient export or removal from the farm.
The increasing collective participation of the private sector and local and international academicinstitutions in the region to provide agricultural producers with early maturing hybrid seeds that needto be fed with huge amounts of nutrients within short periods (110 to 120 days) is a big challenge forsoil and plant nutrition scientists. The shortened time for soil nutrient mobilization to meet thephenologically-related food demands of the plants make readily soluble/available chemical fertilizersa major consideration in the campaign for improving yields and food supplies to support a rapidlygrowing population.
The nutrient budgets in the agro-ecosystem as shown in some papers indicated the growing negativetrends for potash and phosphates and increasing trends for nitrogen. China, as corroborated by thesenior scientist from Bangladesh, reported that in the “1950s there was a small surplus of N withdeficits of P and K and then N and P became more balanced in the mid-1970s. The N and P budgetsthen show a surplus with K still in deficit. The nutrient surpluses of arable land reached 154 kg N/haand 31 kg P/ha in 2004. The increasing surpluses of N and P can be attributed mainly to increasingfertilizer inputs and steady application of organic manures from 1980 to 2003. Although the Kdeficit decreased from -1.89 mt in 1979 to -1.34 mt in 2004, there was still a serious shortage of K.In addition, nutrient inputs from the environment, especially N inputs, have also contributed to thenutrient surpluses, accounting for 18.6 percent of N, 1.7 percent of P, and 12.7 percent of K of totalinputs in 2004.”
A. INM issues for Asian countries
Asian agriculture is under persistent pressure to narrow the gap between food supplies and demandby the ever increasing human population, aggravated by significant loss of arable land fromurbanization and pollution. As a consequence of this negative trend in the food supplying capacityof the regions natural resource base, Asian countries have mainstreamed into their national policiesthe promotion and use of genetically improved short food crops, including livestock and fishes, asthe foundation of their food security programmes. This is further enhanced and fully supported bypolicy support for fertilizer subsidies to encourage farmers to use more and higher rates of fertilizersto ensure high crop yields.
Common barriers and root causes of the decline in agricultural land productivity and the ensuingthreat to food security in Asian countries include, but are not limited to the following:
1. Soil mining or internal loss of soil nutrient reserves to the plant and the groundwaterinduced by the imbalanced use of fertilizers, mostly through the excessive use of Urea;
2. Poor rationalization of chemical fertilizer importation to ensure easy access to appropriate,suitable and affordable fertilizer grades. In most cases, the importation and supply of Ureaexceeded phosphates and potash;
3. Inadequate understanding and absence of dedicated national programmes for organic-basedfertilization and balanced fertilization based on a sound soil testing programme;

6
4. Policy support for short maturing, high yield varieties (hybrid) without appropriateintegrated nutrient management practices to avert the incidence of soil mining andsoil/water degradation;
5. Fertilizer subsidies that are not based on the soil and plant nutrient needs of the country(e.g. Bangladesh, China, India, Pakistan and Sri Lanka);
6. High population and rapid urbanization and declining man-arable land ratio; and
7. Global oil issues and uncontrolled increases in the price of chemical fertilizers.
B. INM issues for Pacific Island countries
Pacific Island countries, in contrast to their Asian counterparts, have dedicated much of theiragricultural development to serving the needs of farm families and are built around the organizationand success of a network of home gardens.
In contrast to the capital intensive character of Asian agriculture, agricultural development in thePacific Island countries is basically based on low external input, small-scale farming systems,supported by traditional and indigenous technologies. They are largely dedicated to homeself-reliance composed of networks of small home gardens generally using simple tools andindigenous technologies to serve farm family needs and local markets. Compared to thepredominance of chemical fertilizers in the more advanced Asian countries, farmers in the PacificIslands are mainly dependent on natural fertilizer sources, recycling crop residues and natural soilfertility.
Some island countries have started to experience the pressures of increasing population and rapidurbanization and declining land availability per capita, which in the long-term could become a majorbarrier to a long-term, sustainable agricultural development programme for food security. Increasingareas of sloping farmlands are contributing to a higher incidence of erosion and long-term loss ofland productivity of scarce arable lands, particularly in coastal areas.
Common issues in nutrient management and barriers to food security in Pacific Island countries,because of the very nature of small backyard or home gardens, are listed below, to wit:
1. The natural ecological convergence of upland agriculture with coastal agriculture andfishery areas justify the unique and critical role of soil erosion control and management indeveloping an inter-landscape transboundary INM strategy for a watershed-wide soilfertility management programme;
2. Dependence on natural soil fertility and natural fertilizer sources and traditional plants andvarieties;
3. Soil erosion resulting from decreasing fallow periods, subsistence farming and increasinghuman demand for land and food;
4. Land use policy that protects scarce agricultural lands is in important consideration in theformulation of food security increasing population;
5. While low external inputs and multi-cropped home gardens, characterized by naturalnutrient recycling and low nutrient demands, result in low food outputs, they help farmerspreserve native soil nutrient reserves; and
6. Declining man-arable land ratio due to increased population and urbanization.

7
Additional discussions prior to formulation of recommendations
A collective review of lessons learned and knowledge about integrated nutrient management wasconducted by the senior scientists to define the measures needed to combat complex problems of soilnutrient mining and the decline in soil productivity. The self-review provided insights on themodalities adopted in packaging information and technologies. Critical gaps were identified toimprove the efficiency of delivery of services from various country institutions to the differentstakeholders, farmers, policy-makers and extension agents.
The participants recognized the need to distinguish among three kinds of stakeholders and themanner in which information and substantive contents are packaged and delivered. The results ofthese exercises are summarized below:
For the farmers:
● Provision and packaging of appropriate and farmer-friendly extension materials (sketchesand drawing illustration techniques, conduct of pilot on-farm demonstrations, preparationof easy-to-read soil fertility maps/charts, fertilizer recommendation charts, etc.);
● Establishment and promotion of Farmer Field Schools for community-based learning anddevelopment of Soil Doctors (adopted from Thailand’s experience) to facilitate farmer-to-farmer exchanges of knowledge and acquired technologies; and
● Elaboration and proper communication of monetary and environmental benefits of IPNS.
For the decision-makers:
● Mainstreaming of principles of nutrient management and elaboration of environmental andeconomic benefits derived from sound IPNS. This includes the preparation of policy briefsand position papers to elaborate the substantive economic and environmental benefits ofadopting IPNS;
● Illustration of IPNS benefits through presentation of national nutrient balance analysis;
● Conduct of pilot techno-demos to showcase the impact of IPNS on yield increasessupported by simple audience-friendly graphic illustrations of environmental benefits, andcost/return analysis;
● Brief on both positive and negative scenarios of IPNS adoption to address poverty and foodsecurity and long-term sustainable development; and
● Conduct and preparation of briefing materials on the environmental impacts of soundnutrient management practices.
For support institutions and change agents:
● Review of the extension approach (number of extension agents, extension methods);
● Promotion of the adoption of participatory approaches by all stakeholders (NGOs, theprivate sector, industry, researchers, academics, etc.);
● Provision of knowledge management to support IPNS networking (model, knowledge,scenario, scientific document); and
● Local campaign and support to IPNS.

8
The gaps and responses of the participants in the meeting are summarized in table (Table 1).
The participants, likewise, addressed the issue of availability and sufficiency of technicalinformation on IPNS. They put into proper context the discussion by defining the composition ofpolicy-makers at various levels of the government. The nature and category of information aresummarized below:
● National level information in the form of broad guidelines for national policy-makerscomposed of various country offices and Ministries (e.g. Agriculture, Environment,Finance, Science & Technology, etc.); Secretaries (e.g. Agriculture research policy-makers,Director-General of MOA/DOA); academic sectors; farmer organizations and councils andincluding national NGOs (e.g. NGOs in Bangladesh, Thailand and Viet Nam);
● Provincial level information in the form of specific guidelines and monitoring activities forthe provincial levels of policy-makers, composed of Secretary of Agriculture, ProvincialCouncils; and
● District or field level information in the form of specific technical knowledge managementcomposed of district level administrators and agriculture extension groups.
The participants collectively agreed on the benefits associated with the FAO programme forSouth-South Cooperation (SSC). The discussion covered a wide variety of issues for possible
Table 1. Technical options, needs and information gaps in transfer of informationon nutrient management practices
Technical issuesDo we have reliable
and optionsguidelines, manuals, What are the technical gaps?economic analysis?
Farmer awareness on Yes Lack site and nutrient informationsoil fertility issues
Accurate soil data Yes, not enough Expensive to acquire; not shared and properlycirculated
Crop potential Yes, not enough May need to develop and provide crop andagro-ecosystem specific pilot demonstration(crop models by ecosystem)
Farmers’ practices Yes Varying farmers attitudes towards changes intechnology packages
Climatic data Yes, not enough Need to have farmer-level data and higher(variation risk) accuracy in local climate forecasting
Technical information Yes, not enough Need to improve packaging, networking,interpretation for wider awareness and easierunderstanding by stakeholders at all levels(farmers, policy-makers and extension agents)
Fertilizer availability/use No Unreliable statistics and restricted regulationon fertilizer (entry into the country)
Farmer knowledge Partially More effective methods of communication andintegration of local and acquired knowledgeand technologies
Cost-benefit analysis Not enough Not updated, market changes, difficulty inincluding quantified values of environmentalservices (e.g. C-sequestration value)
9
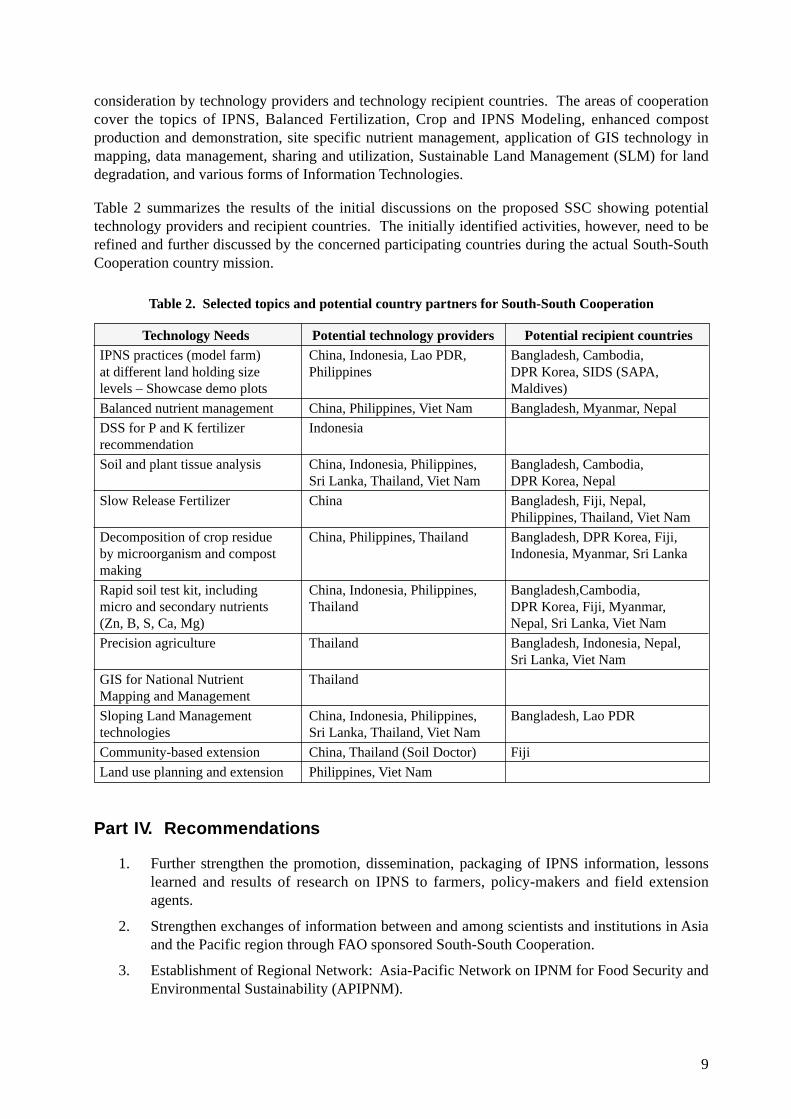
consideration by technology providers and technology recipient countries. The areas of cooperationcover the topics of IPNS, Balanced Fertilization, Crop and IPNS Modeling, enhanced compostproduction and demonstration, site specific nutrient management, application of GIS technology inmapping, data management, sharing and utilization, Sustainable Land Management (SLM) for landdegradation, and various forms of Information Technologies.
Table 2 summarizes the results of the initial discussions on the proposed SSC showing potentialtechnology providers and recipient countries. The initially identified activities, however, need to berefined and further discussed by the concerned participating countries during the actual South-SouthCooperation country mission.
Table 2. Selected topics and potential country partners for South-South Cooperation
Technology Needs Potential technology providers Potential recipient countriesIPNS practices (model farm) China, Indonesia, Lao PDR, Bangladesh, Cambodia,at different land holding size Philippines DPR Korea, SIDS (SAPA,levels – Showcase demo plots Maldives)
Balanced nutrient management China, Philippines, Viet Nam Bangladesh, Myanmar, Nepal
DSS for P and K fertilizer Indonesiarecommendation
Soil and plant tissue analysis China, Indonesia, Philippines, Bangladesh, Cambodia,Sri Lanka, Thailand, Viet Nam DPR Korea, Nepal
Slow Release Fertilizer China Bangladesh, Fiji, Nepal,Philippines, Thailand, Viet Nam
Decomposition of crop residue China, Philippines, Thailand Bangladesh, DPR Korea, Fiji,by microorganism and compost Indonesia, Myanmar, Sri Lankamaking
Rapid soil test kit, including China, Indonesia, Philippines, Bangladesh,Cambodia,micro and secondary nutrients Thailand DPR Korea, Fiji, Myanmar,(Zn, B, S, Ca, Mg) Nepal, Sri Lanka, Viet Nam
Precision agriculture Thailand Bangladesh, Indonesia, Nepal,Sri Lanka, Viet Nam
GIS for National Nutrient ThailandMapping and Management
Sloping Land Management China, Indonesia, Philippines, Bangladesh, Lao PDRtechnologies Sri Lanka, Thailand, Viet Nam
Community-based extension China, Thailand (Soil Doctor) Fiji
Land use planning and extension Philippines, Viet Nam
Part IV. Recommendations
1. Further strengthen the promotion, dissemination, packaging of IPNS information, lessonslearned and results of research on IPNS to farmers, policy-makers and field extensionagents.
2. Strengthen exchanges of information between and among scientists and institutions in Asiaand the Pacific region through FAO sponsored South-South Cooperation.
3. Establishment of Regional Network: Asia-Pacific Network on IPNM for Food Security andEnvironmental Sustainability (APIPNM).
10
Part V. Conclusions
1. The participants collectively expressed interest in the immediate formulation of programmeto support the implementation of South-South Cooperation to improve the transfer ofknowledge and information and strengthen capacity building within Asia and the Pacificregion.
2. The participants, with the full support of China and FAO, likewise recommended theformation and implementation of the Asia-Pacific Network on IPNM for Food Security andEnvironmental Sustainability (APIPNM). The following interim arrangements were agreedupon:
a. That there will be contribution either in cash or in kind from China and that this canbe done through a Memorandum of Agreement that will cover a period of five (5) years.Some potential donors and partners were identified:
● Donor institutions from Australia Germany and perhaps ADB,
● FAO may be able to support in the formulation and packaging of the formalproposal.
b. That the Chinese Agricultural University volunteered to initially act as secretariat toperform, among other relevant actions, some initial activities involving preparation ofa regional background paper for addressing policy-makers and in the preparation ofa draft network proposal.

11
Part VI. Country papers
13
South Asian Country
Paper Number 1
Integrated nutrient management forsustaining crop productivity and improvement of
soil fertility in Bangladesh agriculture*
Md. QuamruzzamanUpazilla Agriculture Office, Kutubdia Cox’s Bazer, Bangladesh
Summary
Bangladesh is the fifth most populous country in Asia and the 18th in the world who hassuccessfully attained self-sufficiency in food despite the decline in per capita land and increasein population. The country has opted for an agricultural development policy that graduallymoved farmers away from the traditional and rather static agriculture dependent on native soilfertility to a dynamic judicious fertilizer dependent farming. In the last three decades, foodgrain production has considerably increased due to substantial intensification of cropping,introduction of high yielding varieties (HYVs), and expansion of irrigated area and use ofchemical fertilizers. However, this has also led to widespread soil fertility depletion caused byfertilizer nutrient imbalance and serious nutrient gap between plant use and fertilizer applicationand mining out scarce native soil nutrients to support increases in yields of food crops. The useof chemical fertilizers mainly for N, P, K and S has been increasing steadily but they are notapplied in balanced proportion. Continously cropped areas were observed to have problems ofdecline in organic matter and those associated with imbalance use of fertilizers were found,aside for its impacts on P and K fertilization, to have emerging deficiencies of micronutrientslike Zn, B, Mn, Mo. Bangladesh adopted a strategy for balanced fertilization to promote soilbuilding to support sustainable land use system and ensure stable supply of food grains fromexisting agricultural lands. In this context and as a further response to economic recession, aswell as to conserve and improve soil fertility, the concept of integrated nutrient management(INM) system has been adopted.
1. Introduction
Bangladesh is situated between 20º34′ and 26º38′ north latitude and 88º01′ and 92º41′ east longitude.It is the fifth most populous country in Asia and ranks eighteenth in the global context. The countryhas a land area of 14.83 million hectares (m ha), population over 135 million with a density of morethan 800 person km-2, which is one of the highest in the world.
Primarily, the country is deltaic floodplain. The topography is flat with elevation not exceeding10 meters above mean sea level. The non-undulated topography is broken in the southeast by theChittagong Hill Tracts and hills in the northeastern part of the country. Floodplain and piedmontplains occupy almost 80 percent of the land area. Slightly uplifted fault blocks (terrace) occupyabout 8 percent and hills occupy about 12 percent of the land.
* This country report has not been formally edited and the designations and terminology used are those of the author.

14
The effective land area is roughly 12.31 m ha of which presently 7.85 m ha are under cultivation(BBS, 1996). During the last three decades per capita arable land declined from 0.17 ha in 1960 to0.07 ha in 1991 and presently reduced to less than 0.06 ha. The cropping intensity in the country is180 percent. Multiple cropped areas occupy about 35.8 percent, 51.4 percent and 12.8 percent of thenet cropped area. Agriculture contributes about 23.5 percent to the GDP.
During the last three decades, food grain production has increased considerably from about 11 mt in1970-71 to about 27 mt in 2002-03. Present demand of food is 22.55 mt and production is 28.38 mt.The major driving forces are substantial intensification of cropping, introduction of high yieldingvarieties (HYVs), and expansion of irrigated area and use of chemical fertilizers.
2. Soil fertility status
In the recent years, intensive crop cultivation using high yield varieties of crop with imbalancedfertilization has led to mining out scarce native soil nutrients to support plant growth and production,the dominant soil ecological processes that severely affected the fertility status and productioncapacity of the major soils in Bangladesh. Available data indicated that the fertility of most of oursoils has deteriorated over the years (Karim et al., 1994 and Ali et al., 1997), which is responsible fornational yield stagnation and in some cases, even declining crop yields (Cassman et al., 1997). Theuse of chemical fertilizers mainly for NPKS has been increasing steadily but they are not applied inbalanced proportion. For example, in 1996, 421:71:454:44 million tonnes of NPKS, respectively,were removed in grain and straw while in the same year 507:119:114:13 million tonnes were addedin the form of inorganic fertilizers. Considering, the recovery percentage of the added nutrients thegap was about 244:47:400:41 million tonnes of NPKS (Islam et al., 1998). Moreover, emergingdeficiency of micronutrients like Zn, B, Mn, Mo has been reported in some parts of the countryparticularly northwestern region. It is now well known that S and Zn deficiencies particularly in wetland rice soils in many parts of the country have been induced by imbalanced fertilization.Deficiencies of Ca and Mg are also prevalent in calcareous soils. On the other hand, organic mattercontent of most of the Bangladesh soils is very low where the majority fall below the critical level(1.5 percent). The organic matter content of Bangladesh soils in continuously cropped areas from1967 to 1995 has been depleted by 5 to 36 percent (Ali et al., 1997). One natural reason is thatorganic matter decomposition in soils with tropical climate, like Bangladesh, is high. Moreover, theaddition of organic materials to soil through FYM, compost and organic residues has been reducedconsiderably because a major portion of these organic residues (cow dung & crop residue) is used upas fuel by the rural people. The major reasons for the depletion of soil fertility in Bangladesh arelisted below:
a. The increased intensity of cropping, specially changes in crop sequence with HYV, makescurrent management practices, including fertilizer use less effective;
b. More fertilizers are being used on lands with poorer soils or uncertain irrigation facilities;
c. There is an imbalance in the supply of N, P and K with application of latter two nutrientsoften being too low;
d. Deficiencies of secondary and micronutrients are prevalent; and
e. Gradual decrease in soil organic matter and an increase in soil degradation (erosion,acidification, salinization, alkalization pollution, compaction etc.).

15
4. Need for balanced fertilization in Bangladesh agriculture
Imbalanced fertilizer use is both costly in terms of nutrient loss from soil mining, decline in foodsupply and loss of soil fertility and land productivity and the consequent decline in food production.
Bangladesh adopted a strategy for balanced fertilization to promote soil building to supportsustainable land use system and ensure stable supply of food grains from existing agricultural lands.
Bangladesh is gradually moving away from the traditional and rather static agriculture dependenton native soil fertility to a dynamic judicious fertilizer dependent agriculture. In a judiciousfertilizer-dependent agriculture, balanced fertilization strategy has to be a cornerstone of allactivities. Balanced fertilization is aimed at:
● Increasing crop yields;
● Increasing crop quality;
● Increasing farm income;
● Correction of inherent soil nutrient deficiencies;
● Improving soil fertility;
● Avoiding damage to the environment; and
● Restoring soil fertility and productivity of land that has been degraded by wrong andexploitative activities in the past.
Table 1. Soil nutrient mining status in Bangladesh (1998-99)
Location Dominant cropping Total yield Nutrient miningpattern (t/ha/yr) (kg/ha/yr)
Palima, Tangail Mustard-Boro-T. Aman 13.0 -190
Polashbari, Gaibandha Mustard-Boro-T. Aman 10.2 -270
Narhatta, Bogra Mustard-Boro-T. Aman 9.5 -280
Palima, Tangail Wheat-Jute-T. Aman 7.0 -240
Paba, Rajshahi Potao-Jute-T. Aman 34.5 -350
Thakurgaon Sugarcane intercropping 60.0 -80
Joypurhat Sugarcane intercropping 107.0 -60
Rajshahi Sugarcane intercropping 90.0 -62
Bogra Boro-GM-T. Aman 11.0 -180
Bogra Wheat-GM-T. Aman 7.5 -170
Source: DANIDA/SFFP.
3. Soil nutrient mining
Soil fertility and environment are closely interlinked: Depletion of soil fertility means degradationof the environment and likewise, its improvement also leads to a better environment. The depletionof nutrients (fertility erosion) is widespread on the earth as well as in Bangladesh. The major formsand causes of nutrient depletion include excessive crop nutrient uptake and removal, erosion,leaching, gaseous loss, irreversible fixation in the soil and immobilization in the trunks and branchesof tree crops.

16
Figure 2. Projection of fertilizer consumption and rice and wheat production in 2010
Nitrogen
Phosphate
Potassium
1980
-81
1981
-82
1982
-83
1983
-84
1984
-85
1985
-86
1986
-87
1987
-88
1988
-89
1989
-90
1990
-91
1991
-92
1992
-93
1993
-94
1994
-95
1995
-96
1996
-97
1 000 000
800 000
600 000
400 000
200 000
0
Years
Met
ric
tonn
es
Figure 1. Bangladesh annual consumption of fertilizer nutrient, 1980-81 to 1996-97
1981 1996 2010 projection
3.5
3.0
2.5
2.0
1.5
1.0
0.5
0.00
5
10
15
20
25
30
35
40
45
Ric
e an
d w
heat
pro
duct
ion
in m
illio
n m
tF
ertilizer consumption in m
illion mt
Year
Rice and wheat production Total N, P2O5, K2O
N P2O5 K2O
5. Fertilizer use in Bangladesh agriculture
Total requirement of fertilizers like Urea, TSP, SSP, MP, Gypsum and mixed fertilizer for cropproduction are 28.0, 5.0, 1.25, 1.5 and 3.0 lakh metric tonnes per year respectively. Among them60 percent of Urea and 100 percent of mixed fertilizer is produced in the country (personalcommunication with Deputy Director, Directorate of Agricultural Extension). Annual consumptionof chemical fertilizer is increasing at constant rate. Figure 1 depicted nitrogen, phosphorous andpotassium consumption in the country from 1980-81 to 1996-97 and Figure 2 explains trends ofchemical fertilizer consumption by two rice and wheat crops.

17
6. Projection of wheat and rice production and chemical fertilizer use
Considering 1980 as baseline, wheat and rice production were projected to 2010 both in terms ofyield and corresponding NPK use. The scenarios are illustrated in the Tables 2 and 3.
Table 2. Projection of wheat and rice production and NPK use up to 2010
CropWheat and rice production (million mt)
19811
19962 Diff. btw. 2010
1996-20101981-1996 Projection3
Rice 20.9 26.7 5.8 40.8 14.1
Wheat 1.0 1.4 0.4 2.0 0.6
Total 21.9 28.1 6.2 42.8 14.7
FertilizerFertilizer consumption (million mt)
19814
19965 Diff. btw. 2010
1996-20101981-1996 Projection
N 0.28 0.96 0.68 2.437 1.47
P2O5 0.12 0.14 0.02 0.357 0.21
K2O 0.03 0.10 0.07 0.257 0.15
Total 0.43 1.20 0.77 3.036 1.831 1981 average production calculated form FAOSTAT values for the years 1980, 81, 82.2 1996 average production calculated form FAOSTAT values for the years 1985, 96, 97.3 Projected production (source: Agriculture Towards 2010 (W89CS) ESD database, FAO).4 1981 average consumption calculated form FAOSTAT values for the years 1980, 81, 82.5 1996 average consumption calculated form FAOSTAT values for 1995 and FDI-II and ATDP/IFDC value for 1996-97.6 Calculation of projected total N, P2O5, K2O fertilizer consumption for the year 2010.
Ftot2010 = •Ftot B1-96/•Ftot81-96 •Ftot81-96 x 96-2010 + Ftot96
7 Calculation of individual N, P2O5, K2O, projected consumption for the year 2010.
N, P2O5, K2O = N, P2O5, K2O,/Ftot96 x Ftot2010
Table 3. Trend of different fertilizers used during the period of 1980 to 2003
Year Urea TSP SSP DAP MOP Gypsum Zinc AS Others1980-81 5.6 2.2 – 0.4 0.5 – * – 0.1
1981-82 5.2 2.1 – 0.5 0.5 – * – *
1982-83 6.3 2.1 – 0.7 0.5 * * – *
1983-84 7.1 2.6 – 0.9 0.6 * * – *
1984-85 8.3 3.2 – * 0.7 * * – *
1985-86 7.9 3.0 – * 0.6 * * – *
1986-87 9.2 3.4 – * 0.7 * * – *
1987-88 10.3 3.9 – – 0.9 * * * –
1988-89 11.4 4.2 – – 0.9 0.6 * * 173
1989-90 13.7 4.8 * – 1.2 0.7 * * 18
1990-91 133.0 5.1 0.1 – 1.5 1.0 * * 211
1991-92 15.3 4.6 0.4 – 1.4 1.2 * * –
1992-93 155.0 4.1 1.2 0.02 1.3 1.1 * * –
1993-94 15.8 2.3 1.7 0.30 1.0 0.9 * * 97
1994-95 17.5 1.2 5.3 0.02 1.5 0.8 – * –
1995-96 20.4 1.1 6.0 – 1.6 1.0 * * –

18
1996-97 21.2 0.7 5.3 – 2.2 0.9 * 0.1 –
1997-98 18.7 0.6 4.7 0.07 1.9 1.1 * 0.9 –
1998-99 19.0 1.7 3.6 0.4 2.1 1.3 * 0.1 –
1999-00 20.0 2.4 2.1 1.0 2.3 1.7 * 0.3 –
2000-01 21.1 4.0 1.4 0.9 1.2 1.0 * 0.1 –
2001-02 22.5 3.4 1.2 0.9 2.5 0.6 – – –
2002-03 22.4 3.3 1.3 1.2 2.8 0.4 – – –
Note: Figures in lakh (100 thousand) metric tonne.
Table 3. (continued)
Year Urea TSP SSP DAP MOP Gypsum Zinc AS Others
7. Plant nutrient balance system
The continuous recycling of nutrients in to and out of the soil is known as the nutrient balance,which involves complex biological and chemical interactions. Figure 3 constructed by Smaling,1993, provided the illustration of the basic simplified nutrient input – nutrient output balance system.
Figure 3. The plant nutrient balance system
Inputs Outputs
Mineral fertilizers
Organic manures
Atmospheric deposition
Biological nitrogen fixation
Sedimentation
Harvested crop parts
Crop residues
Leaching
Gaseous losses
Water erosion
The nutrient balance system has two parts: inputs that add plant nutrients to the soil and outputs thatexport them from the soil largely in the form of agricultural products. Important input sourcesinclude inorganic fertilizers; organic fertilizers such as manure, plant residues, and cover crops;nitrogen generated by leguminous plants; and atmospheric nitrogen deposition. Nutrients areexported from the field through harvested crops and crop residues, as well as through leaching,atmospheric volatilization, and erosion. The difference between the volume of inputs and outputsconstitutes the nutrient balance. Positive nutrient balance in the soils (occurring when nutrientadditions to the soil are greater than the nutrients removed from the soil) could indicate that farmingsystems are inefficient and in the extreme, that they may be polluting the environment. Negativebalance could well indicate that soils are being mined and that farming systems are unsustainableover the long-term. In case of negative nutrient balance, nutrients have to be replenished to sustainagricultural outputs and to maintain soil fertility for future.
However, targeting high yield with a high cropping intensity is the most logical way to raise the totalproduction from the country’s limited resources. Since the nutrient turnover in soil plant system isconsiderably high in intensive farming, neither the chemical fertilizers nor the organic and biologicalsources alone can achieve production sustainability. Even with balanced use of chemical fertilizers

19
high yield level could not be maintained over the years because of deterioration in soil physical andbiological environments due to low organic matter content in soils. In this context and as a furtherresponse to economic recession, and also to conserve and improve soil fertility the concept ofIntegrated Nutrient Management (INM) system has been adopted.
8. Concept of integrated nutrient management
The Integrated Nutrient Management (INM) is the maintenance of soil fertility for sustainingincreased crop productivity through optimizing all possible sources, organic and inorganic, of plantnutrients required for crop growth and quality in an integrated manner, appropriate to each croppingsystem and farming situation in its ecological, social and economic possibilities (Roy, 1986).
The basic concept underlying the principles of INM is to integrate all sources of plant nutrients andalso all improved crop production technologies into a productive agricultural system (Roy, 1986). Inother words, integrated nutrient management aimed to maintain the soil fertility and plant nutrientsupply to an optimum level for sustaining the desired crop productivity through optimization of thebenefits from all possible sources of plant nutrients in an integrated manner. Therefore, it isa holistic approach, where we first know what exactly is required by the plant for an optimum levelof production, in what different forms these nutrients should be applied to soil and at what differenttimings is the best possible method, and how best these forms should be integrated to obtain thehighest productive efficiency on the economically acceptable limits in an environment friendlymanner (Chundawat, 2001). One characteristic of the INM is that the fertilizer recommendationshould take into account the cropping system as a whole rather than individual crop in the system.This aspect is particularly important in case of phosphorous where the percentage utilization by thecrop to which it is applied is rather low and where there is residual effect to benefit the followingcrop. Similarly, the nitrogen contribution of legume crops in the cropping system will have to beconsidered. Besides, some crops show selective uptake of some specific elements. Moreover,nutrients supplied from other sources should be accounted for making up the gap between therecommended and actual levels of fertilizer application.
8.1 Components and technology
The main aim of the INM approach is to tap all the major sources of plant nutrients as illustrated inFigure 3 in a judicious way and to ensure their efficient use (Roy, 1986).
8.2 Goal of INM
Sustainable agricultural production incorporates the idea that natural resources should be used togenerate increased output and incomes, especially for low income groups without depleting thenatural resource base. INM’s goal is to integrate the use of all natural and man-made sources ofplant nutrients, so that crop productivity increases in an efficient and environmentally benignmanner, without sacrificing soil productivity of future generations (Gruhn et al., 2000). INM relieson a number of factors, including appropriate nutrient application and conservation and the transferof knowledge about INM practices to farmers through extension personnel.
8.3 Benefits of INM
Sufficient and balanced application of organic and inorganic fertilizers is a major component ofINM. However, the following research findings (Tables 4 through Table 8 and Figure 4) on INMtechnology in different soils and crops, cropping system/patterns of Bangladesh clearly revealed thebenefits of INM in respect of yield sustainability and improvement of soil fertility.

20
Table 4. Grain yield of wheat and T. Aman obtained in integrated nutrient management at Dinajpur,1994-97
TreatmentWheat grain yield (t/ha) T. Aman grain yield (t/ha)
1994-95 1995-96 1996-97 1997-98 Ave. 1995 1996 1997 Ave.
Control 0.93d 0.83 0.52d 0.20c 0.62 3.79c 3.24c 2.84e 3.29 3.91
100% NPKSZn 3.67a 3.30 3.61a 3.81a 3.60 4.88a 4.64a 4.18ab 4.57 8.16
75% NPKSZn 2.60b 2.67 2.04c 2.99b 2.58 4.11bc 4.08b 3.58cd 3.92 6.50
GM + 50% NPKSZn 2.90b 2.88 2.93c 3.08b 2.95 4.06bc 4.03c 3.73c 3.94 6.89
GM + 75% NPKSZn 2.58b 3.21 3.31b 3.88a 3.25 4.52abc 4.40a 4.03b 4.32 7.56
FYM + 50% NPKSZn 2.60b 2.80 2.87c 3.04b 2.83 4.04bc 3.70b 3.50d 3.75 6.57
FYM + 75% NPKSZn 3.80a 3.21 3.74a 4.22a 3.74 4.76ab 4.65a 4.21a 4.54 8.28
Note: Figures followed by some letters do not differ significantly at 5 percent level.
Source: BARI Annual Report.
Totalgrainyield
(kg/ha)
Table 5. Effects of combined use of fertilizers and manure/crop residues on the grain yield ofT. Aman rice
TreatmentsGrain yield (t/ha)
BAU farm BRRI farm
1998 1999 2000 Mean 1998 1999 2000 Mean
T1: Control 2.93g 2.66f 2.45f 2.68 2.78g 2.67g 2.62g 2.69
T2: 50% NPKS 3.85f 3.89e 6.51e 3.75 3.56f 3.80f 3.69f 3.68
T3: 70% NPKS 4.30def 4.38cde 3.94d 4.21 4.30de 4.32def 4.05def 4.22
T4: 100% NPKS 5.05abc 5.06ab 4.85bc 4.99 5.14ab 5.05abc 5.43abc 5.10
T5: 50% NPKS + RS 4.09ef 4.11de 4.03d 4.07 3.94ef 4.11ef 3.95ef 3.85
T6: 70% NPKS + RS 4.37def 4.43d 4.22d 4.34 4.49cd 4.64b-e 4.23de 4.45
T7: 50% NPKS + DH 4.81bcd 4.95b 4.86bc 4.87 5.18a 4.87a-d 5.13c 5.06
T8: 70% NPKS + DH 5.17ab 5.17ab 5.22abc 5.19 5.22a 5.29ab 5.53ab 5.35
T9: 50% NPKS + MBR 5.10ab 5.12ab 4.99bc 5.07 5.20a 5.05abc 5.23be 5.16
T10: 70% NPKS + MBR 5.41a 5.23a 5.31ab 5.32 5.42a 5.33ab 5.59ab 5.45
T11: 50% NPKS + CD 4.08ef 4.32cde 4.28d 4.23 4.10e 4.46cde 4.00def 4.49
T12: 70% NPKS + CD 4.55cde 4.66bc 4.82c 4.68 4.74bc 4.73a-e 4.34d 4.60
T13: 50% NPKS + PM 5.16ab 5.12ab 5.13abc 5.14 5.35a 5.02abc 5.54ab 5.30
T14: 70% NPKS + PM 5.47a 5.29a 5.47a 5.41 5.49a 5.34a 5.68a 5.50
CV (%) 6.40 6.30 5.50 – 5.10 7.80 –
Level of significance 0.01 0.01 0.01 – 0.01 0.01 –
Note: In column, figures followed by some letters do not differ significantly at 5 percent level by DMRT.
RS = Rice straw, DH = Dhaincha (Sesbania), MBR = Mungbean residue, CD = Cow dung andPM = Poultry manure
Source: Bangladesh Agricultural University, Mymensingh.

21
Table 6. Effect of rhizobial inoculum and chemical fertilizers on the yield and major yield contributingcharacters of cowpea at Joydebpur for 2002-2003
Nodule Dry Root Shoot Plant 1 000 Stover Seed Yieldnumber/ weight of weight/ weight/ height seed yield yield increase
Treatments 10 plants nodule/ 10 plants 10 plants (cm) weight (t/ha) (t/ha) over10 plants (g) (g) (g) control
(mg) (%)
NPKS 42d 223c 4.24c 29.1a 27.2a 113.1 1.76a 1.03b 28.75
PKS + Inoculum 132a 582a 4.85a 28.4a 27.6a 114.5 1.68a 1.13a 41.25
PKS 80c 456b 4.5b 22.2b 27.5a 112.1 1.69a 1.00b 25.00
Inoculum 99b 567a 3.5d 24.43b 27.4a 112.0 1.22b 1.01b 26.25
Control 29e 206c 2.62e 18.5d 27.1a 108.3 1.10b 0.80c –
CV (%) 6.06 3.67 3.44 6.04 6.92 7.39 9.48 6.18
Note: Means followed by a common letter are not significantly different at the 5 percent level by DMRT.
Source: Soil Science Division, BARI.
Table 7. Yield and yield attributes of tomato as affected by organic manure and chemical fertilizer
Plant Fruits/ Fruit Yield % increaseTr. height plant weight/ (t/ha) overNo. Chemical fertilizer PM CD (cm) (no.) plant (kg) control
kg/ha
T1 100% RD 2.5 0 58.8 38.7a 2.79a 75.00a 276
T2 100% RD of T1 0 2.5 54.8 35.0abc 2.44bc 66.10bc 232
T3 100% RD of T1 0 0 55.9 36.0abc 2.38c 64.80bc 225
T4 50% RD of T1 0 0 54.2 30.0bcd 2.27c 48.13d 141
T5 50% RD of T1 5 0 55.9 36.0abc 2.58bc 68.14ab 242
T6 50% RD of T1 10 0 57.0 36.7ab 2.70ab 70.81ab 255
T7 50% RD of T1 0 10 54.6 32.3a-d 2.34c 60.27c 202
T8 25% RD of T1 10 0 53.9 28.3cd 2.29c 52.12d 162
T9 25% RD of T1 0 10 51.8 26.0de 1.80d 45.49de 128
T10 0 10 0 50.7 25.7de 1.65d 40.69e 104
T11 0 0 10 49.9 19.7ef 1.21e 28.77f 44
T12 Nativenutrient 0 0 48.4 14.7f 0.85f 19.93g –
CV (%) 6.7 13.8 7.5 7.3
Note: Means followed by common letter(s) do not differ significantly at 5 percent level by DMRT.
RD = Recommended dose of chemical fertilizer = N150P45K80S25Zn2B1 kg/ha
Source: Soil Science Division, BARI.
Treatment combination
t/ha

22
Table 8. Yield and yield attributes of hybrid maize as influenced by lime and boron during the rabiseason of 2002-2003 at ARS, Burirhat, Rangpur
TreatmentPlant
Cob/plant Grain/cob Grain1 000 Grain
combinationheight
(no.)Length Breadth
(no.) wt/cob (g)grain yield
(cm) (cm) (cm) wt (g) (t/ha)
T1 = AL* + B0 198.3cd 1.24c 20.50d 7.54b 462.0c 302.7c 356.0c 6.19f
T2 = Dolo + B0 200.7cd 1.26c 21.22c 7.54b 466.0bc 306.7c 356.0c 6.50e
T3 = AL* + B1.5 202.3bc 1.27c 21.27c 7.7ab 471.30b 324.0b 368.7b 7.07d
T4 = Dolo + B1.5 204.3bc 1.26c 21.87b 7.90a 476.6b 326.0b 380.0b 7.53c
T5 = AL* + B3.0 205.0b 1.33b 22.13ab 7.99a 545.02ab 360.0a 413.0ab 7.70b
T6 = Dolo + B3.0 212.0a 1.40a 23.27a 8.00a 570.0a 367.3a 4.34.0a 8.23a
T7 = L0B0 195.7d 1.20d 20.30d 7.31c 450.0d 290.7d 346.7d 5.27g
LSD (0.05) 5.93 0.60 0.34 0.30 6.50 31.32 49.43 0.23
CV % 4.35 7.07 5.36 6.52 4.08 14.30 19.39 8.90
* AL = Agricultural lime.
Blanket dose: N300P50K125S20Zn4 kg/ha & cow dung 5 t/ha
Source: Soil Science Division, BARI.
Cob size
MAJOR SOURCES OF PLANT NUTRIENTS
B N F
MineralFertilizers
AtmosphericN
SoilNutrientReserve
OrganicMaterial
Figure 4. Major sources of plant nutrients

23
1983 1985 1987 1989 1991 1993 1995 1997 1999 1983 1985 1987 1989 1991 1993 1995 1997 1999
1983 1985 1987 1989 1991 1993 1995 1997 1999
1983 1985 1987 1989 1991 1993 1995 1997 1999
1983 1985 1987 1989 1991 1993 1995 1997 1999
1983 1985 1987 1989 1991 1993 1995 1997 1999
12
11
10
9
8
7
6
5
4
12
11
10
9
8
7
6
5
4
12
11
10
9
8
7
6
5
4
12
11
10
9
8
7
6
5
4
12
11
10
9
8
7
6
5
4
12
11
10
9
8
7
6
5
4
y = -0.1984x + 402.61R2 = 0.3663
y = -0.1104x + 228.97R2 = 0.2107
y = -0.1165x + 238.73R2 = 0.3366
y = -0.2269x + 460.1R2 = 0.5313
y = -0.1115x + 227.96R2 = 0.2086
K missing from balanced dose (-K)
P missing from balanced dose (-P)
y = -0.2088x + 424.53R2 = 0.4859
N missing from balanced dose (-N)
S missing from balanced dose (-S) Zn missing frombalanced dose (-Zn)
Gra
in y
ield
(t/
ha/y
r)G
rain
yie
ld (
t/ha
/yr)
Gra
in y
ield
(t/
ha/y
r)
No Fertilization
Figure 5. Long-term trends of MV rice yield under incomplete fertilization at BRRI,Gazipur during 1984-1998

24
8.4 Constraints
The major constrains for proper adoption and utilization of INM technology at farmer’s level arelisted below:
i) Farmers often have inadequate knowledge and funds, which compelled them tomis-purchase and mis-application of fertilizers. Most of the farmers are aware of fertilizersbut do not use it in balanced proportion;
ii) The linkage and interactions among researchers, extension services and NGO personnel areweak;
iii) Degradation of lands due to intensive cropping/over exploitation by the enormous pressureof the ever increasing population;
iv) Risks of water deficit in drought prone period are considered the most important deterrentto fertilizer use; and
v) During monsoon water erosion is a serious threat on soil fertility and productivity.
9. Conclusions
1. With the increasing cropping intensity, the use of chemical fertilizer is also increasing inBangladesh but due to imbalanced use, the fertility of the soils has been depleted.
2. Research findings showed very encouraging effects of INM technology on the higher yieldof many crops and cropping sequences of the country.
3. The benefits of INM technology have been demonstrated and disseminated to the farmersthrough extension personnel.
4. More motivations and subsidies are required for the adoption of INM technology by thefarmers.
5. Agricultural policy measures should be strengthened so that farmers get proper support,encouragement and guidance to switch from conventional agriculture towards technologyoriented agriculture.
References
Ali, M.M., S.M. Shaheed and D. Kubota. 1997. Soil degradation during the period 1967-1995 inBangladesh. II. Selected chemical characters. Soil Sci. Plant Nutr. 43: 879-890.
BARC. 1998. Land Degradation situation in Bangladesh. Soils Division, Bangladesh AgriculturalResearch Council, Dhaka 1215.
BARI. 1994-2003. Bangladesh Agricultural Research Institute Annual Report. BARI, Gazipur,Bangladesh.
BRRI. 2001. Bangladesh Rice Research Institute Annual Report. BRRI, Gazipur, Bangladesh.
BBS. 1996. Statistical year book, Bangladesh bureau of statistics.
Cassman, K.G., S.K. de Datta, D.C. OlK, J. Alcantra, M. Sason, J. Descalsota and M. Dizon. 1995. Yielddeclined and the nitrogen economy economy of long-term experiment on continuing, irrigated ricesystem in the tropics. pp. 181-222. In: R. Lal and B.A. Stewart (eds.) soil Management:Experimental Basis for sustainability and environmental quality. Lewis Publisher, London, UK.

25
Chundawat, B.S. 2001. Integrated nutrient management in tropical and subtropical fruits.
Indian J. of Horticulture. 58 (1&2): 59-69 pp.
DAE. 2005. Department of Agricultural Extension (DAE) Integrated Soil Fertility and FertilizerManagement Project (SFFP). Training Manual. DAE, Khamarbari, Dhaka, Bangladesh.
Gruhn, P., F. Goletti and M. Yudelman. 2000. Integrated nutrient management, soil fertility, andsustainable Agriculture: Current issues and future challenges. International food policy researchinstitute, Washington, D.C., USA. 3-31 pp.
Islam, M.F. and M.F. Haq. 1998. Integrated nutrient management with inorganic fertilizers and greenmanure in some dominant cropping patterns. In proceedings of the national workshop on integratednutrient management for crop production and soil fertility. 24-25 March, 1998. BARI, Gazipur,Bangladesh. 55-71 pp.
Roy, R.N. 1986. FAO, fertilizer programme with special reference to integrated plant nutrition system.Fertilizer in agricultural development. Krishak Bharati Cooperative Limited, New Delhi, India.149-169 pp.
Smaling, E.M.A. 1993. Soil nutrient depletion in Sub-Saharan Africa. In the role of plant nutrients forsustainable food crop production in Sub-Saharan Africa, ed. H. Van Reuler and W.H. Prims.Leidschendan, the Netherlands: VKP.

26
South Asian Country
Paper Number 2
Integrated nutrient management vis-à-vis cropproduction/productivity, nutrient balance, farmer
livelihood and environment: India*
A. Subba Rao and K. Sammi ReddyIndian Institute of Soil Science, Nabi Bagh, Berasia Road,
Bhopal – 462 038 (M.P.), India
Summary
India with a geographical area spreading over 329 million hectares is endowed with a complexdiversity of climate, soils, flora and fauna offering both a blessing and a challenge foragricultural development. The population of India with a growth rate of about 2.3 percent hascrossed one billion at the beginning of the century. The quality and richness of the countryresource endowments is constantly threatened by the huge population and increasing populationdensity and corresponding demand for arable lands and ensuring food security. The ‘greenrevolution’, which launched intensive use of high-yielding varieties of crops coupled with otherinputs like chemical fertilizers and irrigation water, was both a success in boosting food supplyand at the same a challenge in terms of combating the threat of imbalance fertilization theprimary cause of soil degradation and decline in soil fertility. The real challenge is the keep thepace of production under condition of decreasing per capita arable without losing landproductivity. As benchmark for this great challenge, researchers have estimated that the foodoutput of 200 million tonnes and fertilizer consumption of 17 million tonnes would result innutrient removal of 25 to 27 million tonnes leaving a nutrient gap of about 10 million tonnes.The country’s researchers and policy-makers have considered several soil and plant nutrientmanagement options to sustain soil fertility in their continuing effort to close the food andpopulation gaps, which primarily include the Integrated Nutrient Management, the balanced useof chemical based fertilizers and sourcing and processing all possible use of organic manures,biofertilizers, as well as the Integrated Farming System which improved both cropping systemsand livelihood opportunities of small farmers.
1. Food security and livelihood in India
Food security is the most important factor that determines the survival of human kind. Without foodsecurity, a nation cannot expect better life for its people. Famines in India are “a nightmare of thepast”. The green revolution witnessed in late 1960s has contributed immensely over the years tocereal production in India and hence a substantial increase in the net per capita availability of foodgrains was registered (Table 1). This has led to a nationwide sense of complacency that, in a way,slowed down the growth rate in agricultural production during 1990s, while the population continuedto grow at a high rate. The net result was a decline in the per capita food grain availability in theterminal decade of 20th Century. Even with present level of production, there is enough food in thecountry to meet energy and protein requirements of the current population, if the food were
* This country report has not been formally edited and the designations and terminology used are those of the author.
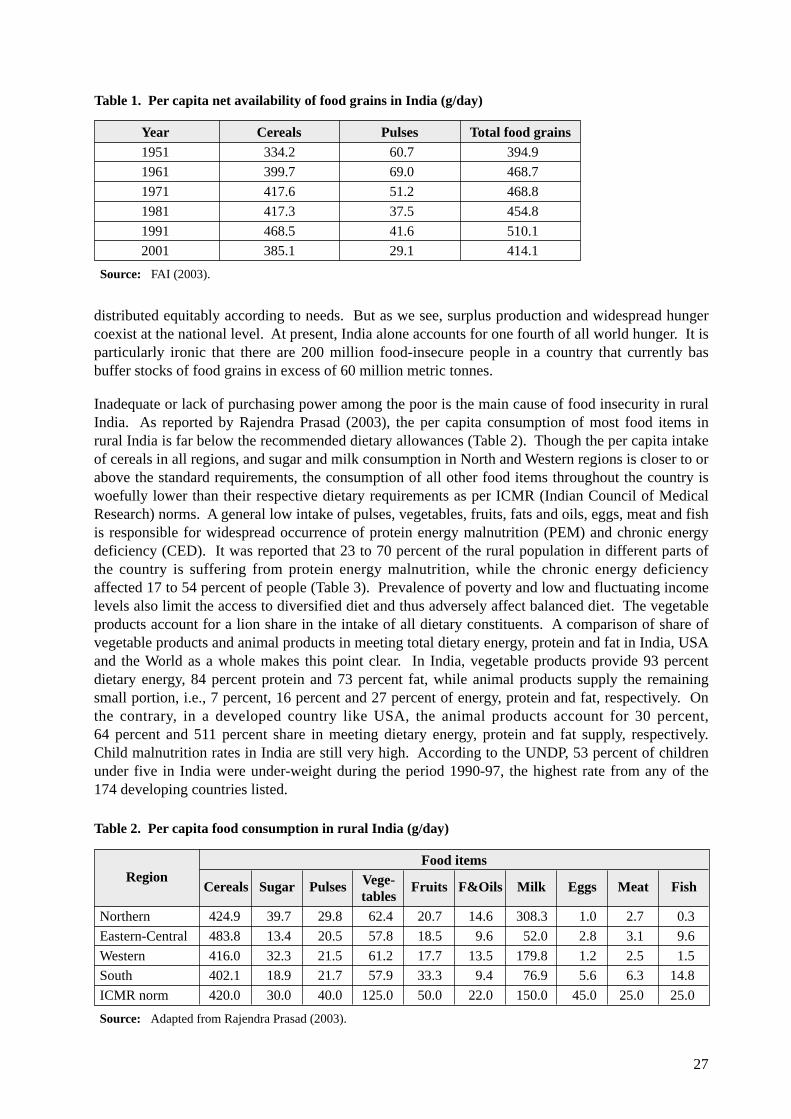
27
distributed equitably according to needs. But as we see, surplus production and widespread hungercoexist at the national level. At present, India alone accounts for one fourth of all world hunger. It isparticularly ironic that there are 200 million food-insecure people in a country that currently basbuffer stocks of food grains in excess of 60 million metric tonnes.
Inadequate or lack of purchasing power among the poor is the main cause of food insecurity in ruralIndia. As reported by Rajendra Prasad (2003), the per capita consumption of most food items inrural India is far below the recommended dietary allowances (Table 2). Though the per capita intakeof cereals in all regions, and sugar and milk consumption in North and Western regions is closer to orabove the standard requirements, the consumption of all other food items throughout the country iswoefully lower than their respective dietary requirements as per ICMR (Indian Council of MedicalResearch) norms. A general low intake of pulses, vegetables, fruits, fats and oils, eggs, meat and fishis responsible for widespread occurrence of protein energy malnutrition (PEM) and chronic energydeficiency (CED). It was reported that 23 to 70 percent of the rural population in different parts ofthe country is suffering from protein energy malnutrition, while the chronic energy deficiencyaffected 17 to 54 percent of people (Table 3). Prevalence of poverty and low and fluctuating incomelevels also limit the access to diversified diet and thus adversely affect balanced diet. The vegetableproducts account for a lion share in the intake of all dietary constituents. A comparison of share ofvegetable products and animal products in meeting total dietary energy, protein and fat in India, USAand the World as a whole makes this point clear. In India, vegetable products provide 93 percentdietary energy, 84 percent protein and 73 percent fat, while animal products supply the remainingsmall portion, i.e., 7 percent, 16 percent and 27 percent of energy, protein and fat, respectively. Onthe contrary, in a developed country like USA, the animal products account for 30 percent,64 percent and 511 percent share in meeting dietary energy, protein and fat supply, respectively.Child malnutrition rates in India are still very high. According to the UNDP, 53 percent of childrenunder five in India were under-weight during the period 1990-97, the highest rate from any of the174 developing countries listed.
Table 1. Per capita net availability of food grains in India (g/day)
Year Cereals Pulses Total food grains1951 334.2 60.7 394.9
1961 399.7 69.0 468.7
1971 417.6 51.2 468.8
1981 417.3 37.5 454.8
1991 468.5 41.6 510.1
2001 385.1 29.1 414.1
Source: FAI (2003).
Table 2. Per capita food consumption in rural India (g/day)
RegionFood items
Cereals Sugar Pulses Vege- Fruits F&Oils Milk Eggs Meat Fishtables
Northern 424.9 39.7 29.8 62.4 20.7 14.6 308.3 1.0 2.7 0.3
Eastern-Central 483.8 13.4 20.5 57.8 18.5 9.6 52.0 2.8 3.1 9.6
Western 416.0 32.3 21.5 61.2 17.7 13.5 179.8 1.2 2.5 1.5
South 402.1 18.9 21.7 57.9 33.3 9.4 76.9 5.6 6.3 14.8
ICMR norm 420.0 30.0 40.0 125.0 50.0 22.0 150.0 45.0 25.0 25.0
Source: Adapted from Rajendra Prasad (2003).

28
2. Threats to future food security and livelihood in India
2.1 Growing population
In India, unabated growth in population has been and will continue to be the single most factors thathave the potential to negate all the progress made in agricultural production. India’s population grewat an annual growth rate of around 2 percent in 1970s, 1980s and 1990s to reach 1 027 million in2001 and is estimated to increase further to 1 262 and 1 542 million by the year 2011 and 2021,respectively (Sekhon, 1997). Growing population means mounting more pressure on naturalresources to meet increased food demand. According to a conservative estimate (Kumar, 1998), thefood grain demand in India for the years 2010 and 2020 is projected to be 246 and 294 mt,respectively (Table 4). This means that India’s food grain production has to increase from 212 mt(highest production ever achieved in 2001-02) to 246 mt in 2010 and then to 294 mt in 2020. It is byall means a daunting task and the ability to accomplish this task determines the future food securityof the country.
Table 3. Extent of PEM and CED in rural India
RegionPercent of population with
Protein energy Chronic energymalnutrition (PEM) deficiency (CED)
Northern 34.9-36.9 23.0-44.0
Eastern and Central 23.5-58.2 17.1-57.3
Western 30.2-39.8 36.2-53.1
South 31.4-70.3 33.2-53.8
Source: Adapted from Rajendra Prasad (2003).
Table 4. Current production and future demands of food grains in India
Food itemEstimated demand (mt)
2010 2020Rice 93.1 3.6 122.1
Wheat 71.8 85.8 102.8
Total cereals 198.8 224.4 265.8
Pulses 13.2 21.4 27.8
Total food grains 212.0 245.8 293.6
Current (2001-02)production (mt)
2.2 Declining land to man ratio and size of farm holdings
With continued rise in population, the arable land to man ratio has decreased from 0.5 ha (1951) to0.14 ha at present and is expected to decline further to 0.08 ha by year 2020. The average number ofland holdings has also increased simultaneously from 77 million (1976-77) to over 115 million atpresent due to population growth and the law of inheritance of land property. The average size ofoperational farm holding is only 1.57 ha. Further, about 78 percent of the 115 million farm holdersin the country come under small and marginal category with the size of farm being less than 2 ha.The small size and scattered nature of the holdings will adversely affect the farm efficiency and willresult in high cost of production. This in turn will result in low productivity and thus reducedagricultural sustainability and food security.

29
2.3 Decreasing total factor productivity
The total factor productivity (TFP) is used as an important measure to evaluate the performance ofa production system and sustainability of its growth pattern. As stated earlier, adoption of greenrevolution technology led to a phenomenal growth in agricultural production during 1970s and1980s. But of late, there are signs of fatigue in the agricultural growth process. In spite of continuedgrowth of inputs, there has been no matching growth in agricultural production during 1990s,indicating a decrease in TEP. The declining trends of annual growth rate of productivity in respect ofall major crops (Table 5) are also suggestive of decreasing TFP in Indian agriculture. In fact, all thecrops except wheat registered a negative annual growth rate in their productivity during the recentpast (2000-01 to 2002-03). If this alarming trend is allowed to continue, it will spell doom on thecountry’s future food security prospects. Reasons for decreasing the total factor productivity are:(1) High nutrient turn over in soil-plant system coupled with low and imbalanced fertilizer use,(2) Emerging deficiencies of micro and secondary nutrients (S, Zn, B, Fe, Mn, etc.), (3) Soildegradation due to acidification, aluminum toxicity, soil salinization and alkalization, soil erosion,(4) Wide nutrient gap between nutrient demand and supply, and (5) Consequent deterioration in soilphysical, biological and chemical quality and low fertilizer use efficiency.
Table 5. Productivity growth rate of important crops in India
CropAnnual growth rate in productivity (%)
1980-81 to 1990-91 to 2000-01 to1989-90 1999-2000 2002-03
Rice 3.19 1.27 -0.72
Wheat 3.10 2.11 0.73
Pulses 1.61 0.96 -1.84
Total food grains 2.74 1.52 -0.69
Oilseeds 2.43 1.25 -3.83
Non-food grains 2.31 1.04 -1.02
All principal crops 2.56 1.31 -0.87
Source: Chhonkar and Dwivedi (2004).
3. Reasons for declining total factor productivity
3.1 Wide nutrient gap between nutrient demand and supply
The growth in fertilizer consumption slowed down during 1990’s and there is stagnation inconsumption during the last 4-5 years. After achieving a record consumption level of 18.1 mt ofNPK in 1999-2000, the total NPK consumption is hovering around 16-17 mt during the last 3 years(2001-04). At the present level of crop production, there exists a negative balance of 10 mt betweennutrient (NPK) demand by crops and supply of nutrient through application of fertilizer annually(Figure 1). The stagnant situation in fertilizer consumption and higher negative nutrient balance areposing a threat to soil quality and sustainable agriculture. It is now imperative to review the reasonsfor the stagnant trend in fertilizer consumption and take remedial action to alter this trend. Thestagnant trend in fertilizer consumption despite slow increase in maximum retail price of fertilizersreveals that besides pricing, there are various other reasons which affect the fertilizer consumption.Weather cannot be solely blamed for the stagnant situation as the performance of southwest monsoonhad been normal in the last few years (except 2000-03). The total NPK consumption did not exceed17 mt during the year-2003-04, in spite of having good southwest monsoon rainfall. Deteriorating

30
soil quality and the emerging deficiencies in secondary and micronutrients aside from majornutrients appear to be one of the major factors in the stagnation of fertilizer consumption. A cerealproduction of 5-10 t/ha/year in rice-wheat rotation, which is the backbone of India’s food securityremoves 380-760 kg N-P2O5-K2O per hectare per year. Farmers generally apply 50 percent to80 percent of this amount. Thus there is a gradual depletion of the inherent soil fertility.
3.2 Soil nutrient balances under intensive cropping systems
There are hardly any farm-level exercises which have been or are being conducted to monitornutrient balances in intensively cropped areas. It is generally accepted that soils are being mined andthat their nutrient capitals being continuously depleted throughout intensively cultivated areas. Noquantitative or semi-quantitative estimates, however, are available on nutrient recycling or balancesbased on various input-output components at the farm level. This is an area where some insightsfrom a few well-defined benchmark farms (not research stations) will be extremely valuable indeveloping sustainable systems, not only for site-specific adoption, but also for adoption to similarenvironments.
The fate of soil nutrient capital and balance in the two most important cropping systems of UttarPradesh is illustrated below (Table 6). These computations are primarily illustrative and based onseveral assumptions, due to the present inadequate database. The initial soil nutrient capital is takento reflect the soil’s low status in nitrogen, medium in phosphorus, and high in potassium for the plowlayer. Fertilizer inputs for the sugarcane-wheat system are typical of the practice. The analysisshows that after one cycle of the sugarcane-wheat system, the initial soil nutrient capital decreasedby 23 percent in the case of N, increased by 1.2 percent in the case of P but decreased by 104 percentin the case of K. The improvement in P status was attributed to its application to both the main cropsand input of FYM and press mud, that less was removed from the crop than was added and theability of P (unlike N) to accumulate in the soil. The large depletion in K was due to its very weakposition in the fertilizer use pattern and crop removal exceeding the K input.
Figure 1. Projected food grain production in relation to nutrient (N-P2O5-K2O) consumption, removaland gap
0
5
10
15
20
25
30
35
40
45
2003 2010 2025
Nut
rien
ts (
mt)
0
50
100
150
200
250
300
350
400Nutrient consumption (mt)
Nutrient removal (mt)
Nutrient gap (mt)
Food grain production (mt)
Food grain production (m
t)

31
Table 6. Nutrient balance after a sugarcane-wheat system in western Uttar Pradesh(productivity 120 mt cane/ha/2 crops + 3 tonnes wheat grain/ha)
Item N P2O5 K2OInitial available soil nutrient capital (kilograms per hectare)a 280 40 336
For sugarcane plant crop
Fertilizer input (kg/ha) 125 58 10
10 t/ha FYM (0.75-0.175-0.55) of N-P2O5-K2O 75 18 55
1 t/ha press mud (0.026-1.70-0.24% available N-P2O5-K2O) 1 17 2
Green manure (not practiced) 0 0 0
Crop residues (not recycled) 0 0 0
Total nutrient capital 481 133 403
Nutrient uptake by 60 t/ha sugarcane crop (kg/ha) 135 30 144
Losses from soil (25% of fertilizer N) 31 0 0
Nutrient balance after cane harvest (kg/ha) 315 103 215
For sugarcane ratoon crop
Starting soil nutrient capital 315 103 215
Fertilizer input (kg/ha) 62 29 5
3 t/ha cane residues recycled (0.4-0.18-1.28) 12 5 38
FYM not used 0 0 0
Total nutrient capital 389 137 258
Nutrient uptake by 60 t/ha ratoon crop (kg/ha) 135 30 188
Losses from soil (25% of fertilizer N) 16 0 0
Nutrient balance after ratoon 238 107 70
For wheat crop
Starting soil nutrient capital (kg/ha) 238 107 70
Fertilizer input 100 50 10
FYM not used 0 0 0
Crop residues burnt 0 0 38
Total nutrient capital 338 157 118
Nutrient uptake by 4 t/ha wheat crop (kg/ha) 96 36 132
Losses from soil (25% of fertilizer N) 25 0 0
Nutrient balance after wheat (kg/ha) 217 121 -14
Change in initial soil capital -63 81 -350
Percentage change -23 102 -104
Summary
Initial soil nutrient capital 280 40 336
Capital after sugarcane plant crop 315 103 215
Capital after sugarcane ratoon
Capital after wheat 217 121 -14
Capital after the system 217 121 -14
Change after 2 years (one crop cycle) in percent -63(-23%) 81(102%) -350 (-104%)
Source: Tandon (1995), based on PDCSR data, personal communication.
Corresponds to low, medium, and high fertility status for N, P, and K respectively.

32
The apparent K balance of long-term fertilizer experiment under maize-wheat-cowpea during27 years of cropping showed that mining of soil K occurred even under NPK and NPK + FYMtreatments, i.e. application of 15 t FYM/ha along with recommended rates of NPK (Swarup, 2002).This shows that the selection of suitable components of INM should vary with cropping systems andnutrient requirement. Integration of crop residues, along with farmyard manure and fertilizers, mayarrest the mining of K from soils where the production systems have higher K demand.
3.3 High nutrient turnover in soil-plant system coupled with low and imbalancedfertilizer use
Fertilizer consumption in India is grossly imbalanced since the beginning. It is tilted more towardsN followed by P. Further the decontrol of the phosphatic and potassic fertilizers resulted in more thandoubling the prices of phosphatic and potassic fertilizers. Thus, the already unbalanced consumptionratio of 6:2.4:1 (N:P2O5:K2O) in 1990-91 has widened to 7:2.7:1 in 2000-01 as against favourableratio of 4:2:1 implying there from that farmers started adding more nitrogen and proportionately lessphosphatic and potassic fertilizers. Even today, the situation is grim as far as fertilizer application byfarmers is concerned. In many areas the imbalanced fertilization is the root cause of poor crop yieldsand poor soil fertility status. Accordingly, agro-ecological regions 4, 9, 14, 15 and 18 and croppingsystems like rice-wheat, maize-wheat, rice-pulse, potato-wheat and sugarcane demands immediateattention to correct the imbalances in nutrient consumptions to prevent further deterioration of soilquality and to break the yield barriers. There is wide variation in the consumption ratios of fertilizersfrom region to region but in the absence of information on the extent of cultivated area and details ofcropping patterns in each agro-ecological region, it is difficult to estimate the crop removal of eachregion (Table 7).
Table 7. Critical areas of imbalances in fertilizer consumption
Sl. Agro- N P2O5 K2O N: Crops/ N P2O5 K2O N:No. ecologi- P2O5 cropping P2O5
cal systemregion
4 N8D2 34.0 9.6 1 3.6 Rice-wheat 205.0 47.0 1 4.35
9 N8C3 23.5 4.7 1 5.0 Maize-wheat 34.0 4.9 1 3.61
14 O8C4 17.3 3.4 1 5.1 Rice-pulse 7.4 2.1 1 3.47
15 A15C4 14.5 2.5 1 5.7 Potato-wheat 14.5 2.5 1 5.73
18 D2A5 11.4 2.9 1 3.9 Sugarcane 21.1 4.2 1 5.00
Source: Swarup and Ganeshamurthy, 1998.
3.4 Emerging deficiencies of secondary and micronutrient in soils
Intensive cropping systems are heavy feeders and are bound to heavily extract nutrients from thesoil. Hence, nutrient deficiencies are inevitable unless steps are taken to restore fertility levels.Deficiencies of essential elements in Indian soils and crops started emerging during the 1950s afterthe initiation of the government of Independent India, a five-year plan to give a fillip to foodproduction through intensification. As food production increased with time, the number of elementsbecoming deficient in soils and crops also increased (Figure 2). Unless corrective measures aretaken immediately, the list of essential elements becoming deficient is bound to increase further. Aclassical example of the effect of imbalanced fertilizer use is the fertility decline in an intensivecropping for over 25 years that has been reported by Swarup and Ganeshamurthy (1998). Whenonly N was applied the P and K status in soils at all the centers have gone down. When N & P were

33
applied the soil K status declined more conspicuously in alluvial soils (Ludhiana), Terai soils(Pantnagar) and laterite soils (Bhubaneshwar). All secondary and micronutrients generally declinedin all the soils.
Although not universal, deficiency of S has cropped up as serious obstacle in the sustainability ofyields in cropping systems particularly if a sulphur responsive crop like rice, oil seed or pulse crop isinvolved. The extent of S problems depends more on input of S through irrigation and atmosphere,the information from which is completely lacking. The results of long-term experiments (Table 8)show that response was very little in certain crops like wheat and jute and very conspicuous incertain other crops like rice and soybean.
050
100150200250300
Food grain production (mt)
N1950
NFe1960
NFePZnK1970
NFePZnKSM
n1980
NFePZnKSM
nB1990
NFePZnKSM
nB2000
NFePZnKSM
nB2010
Figure 2. Food grain production and emerging nutrient deficiencies in soils of the country due tointensive cropping (modified from source: Swarup and Ganeshamurthy, 1998)
Table 8. Mean grain yield response (kg/ha) of rice and wheat at Pantnagar
NutrientMean response over 5 years Mean response over 20 years
or FYM(1987-92) (1972-92)
Rice Wheat Rice WheatN 1 864 2 372 1 512 2 140
P 124 213 -16 47
K 211 109 430 71
S 183 184 261 150
Zn 520 543 285 307
FYM 587 645 745 623
Source: Swarup and Ganeshamurthy, 1998.
Micronutrient deficiencies in soils are also emerging as yield limiting factors. Analysis of 1.5 lakhsoil samples from different regions of the country indicated that about 47 percent of soils weredeficient in available Zn, 20 percent of samples were deficient in available B, 18 percent of sampleswere deficient in Mo, 12 percent of samples were deficient in available Fe and 5 percent of soilsamples were found deficient in available Cu. Among the micronutrients, zinc deficiency is widelyencountered followed by B, Mo and Fe, in that order. Field scale deficiency of Zn in crops is beingincreasingly reported. But suggestions that B and Mo as yield limiting factors are not convincing as

34
trials that include these elements rarely generate conclusive evidence to support this hypothesis.Field scale Mo deficiencies and Mn as a factor of yield decline is not common. However, exceptionto this is in the rice-wheat system on sandy soils and reclaimed sodic soil. Continuous cropping ofrice-wheat on these soils led to deficiency of Mn in wheat crop following leaching of reduced Mnfrom surface soils under rice culture. The productivity of wheat could be restored by soil and foliarapplications of Mn ( Swarup and Ganeshamurthy, 1998).
3.5 Soil degradation
It has been stated that of the total 328.73 m ha geographical area, nearly 188 m ha of land in thecountry is potentially exposed to various degradation processes (Sehgal and Abrol, 1994). The landarea subjected to degradation by way of soil displacement through erosion by water and wind isestimated at 148.9 and 13.5 m ha, respectively (nearly half of the area). About 13.8 m ha is underchemical deterioration due to loss of nutrients and organic matter, salinization and sodification. Soilacidification also rendered about 49 m ha of land degraded.
4. Integrated nutrient management strategies for sustainable foodsecurity and livelihood
Adequate plant nutrient supply holds the key to improving the food grain production and sustaininglivelihood. Nutrient management practices have been developed, but in most of the cases farmersare not applying fertilizers at recommended rates. They feel fertilizers are very costly and notaffordable and due there is a risk particularly under dry land conditions. Therefore, INM plays animportant role which involves integrated use of organic manures, crop residues, green manures,biofertilizers etc. with inorganic fertilizers to supplement part of plant nutrients required by variouscropping systems and thereby fulfilling the nutrient gap.
The basic concept underlying the principle of integrated nutrient management is to maintain oradjust plant nutrient supply to achieve a given level of crop production by optimizing the benefitsfrom all possible sources of plant nutrients. The basic objectives of IPNS are to reduce the inorganicfertilizer requirement, to restore organic matter in soil, to enhance nutrient use efficiency and tomaintain soil quality in terms of physical, chemical and biological properties. Bulky organicmanures may not be able to supply adequate amount of nutrients, nevertheless their role becomesimportant in meeting the above objectives. Long-term studies being carried out under all IndianCoordinated Research Project have indicated that it is possible to substitute a part of fertilizer Nneeds of kharif crop by FYM without any adverse effect on the total productivity of the systemin major cropping systems such as rice-rice, rice-wheat, maize-wheat, sorghum-wheat, pearlmillet-wheat, maize-wheat and rice-maize. Sustainable yield index (SYI) of maize-wheat croppingsystem after 27 years at Ranchi was the highest with integrated use of 100 percent NPK and FYM(Table 9). Organic manures alone cannot supply sufficient P for optimum crop growth because oflimited availability and low P concentration. The organic manures are known to decrease Padsorption/fixation and enhance P availability in P-fixing soils. Organic anions formed during thedecomposition of organic inputs can compete with P for the same sorption sites and thereby increaseP availability in soil and improve utilization by crops. Reddy et al. (1999) observed higher apparentP recovery by soybean-wheat system on Vertisol with a combination of fertilizer P and manure. TheINM strategies developed for different cropping systems all over the country are compiled andpresented in the Table 10.
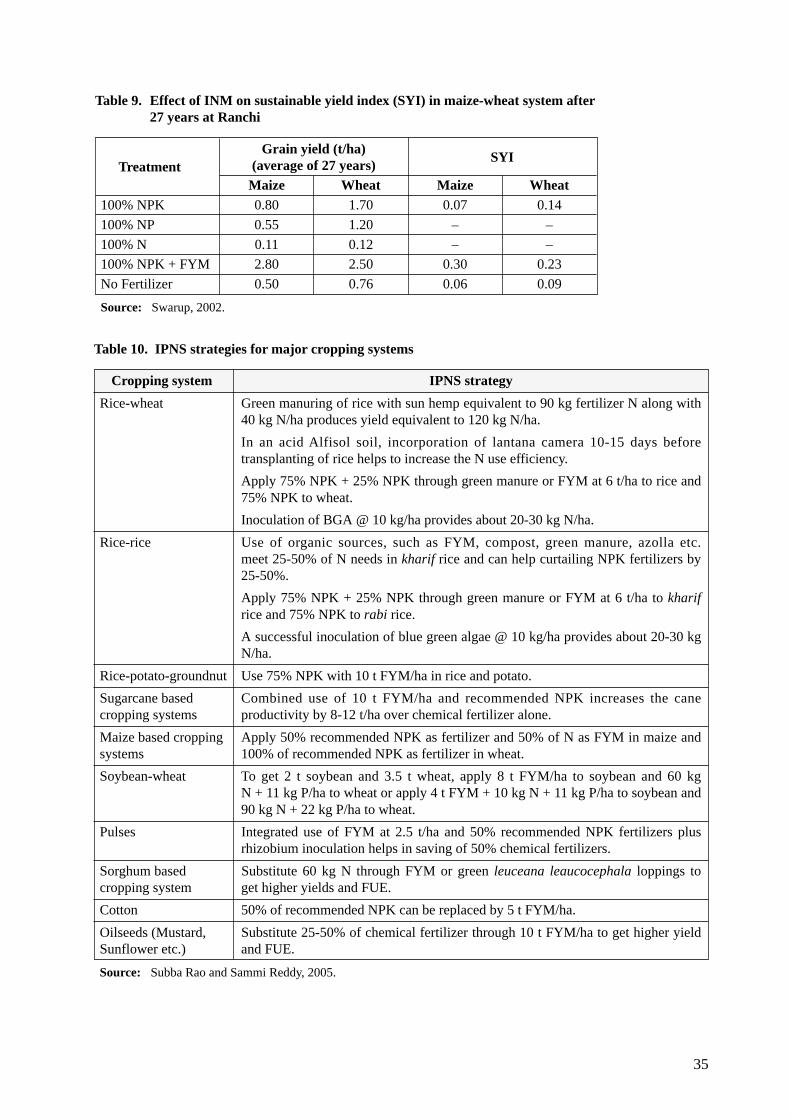
35
Table 9. Effect of INM on sustainable yield index (SYI) in maize-wheat system after27 years at Ranchi
TreatmentGrain yield (t/ha)
SYI(average of 27 years)
Maize Wheat Maize Wheat100% NPK 0.80 1.70 0.07 0.14
100% NP 0.55 1.20 – –
100% N 0.11 0.12 – –
100% NPK + FYM 2.80 2.50 0.30 0.23
No Fertilizer 0.50 0.76 0.06 0.09
Source: Swarup, 2002.
Table 10. IPNS strategies for major cropping systems
Cropping system IPNS strategy
Rice-wheat Green manuring of rice with sun hemp equivalent to 90 kg fertilizer N along with40 kg N/ha produces yield equivalent to 120 kg N/ha.
In an acid Alfisol soil, incorporation of lantana camera 10-15 days beforetransplanting of rice helps to increase the N use efficiency.
Apply 75% NPK + 25% NPK through green manure or FYM at 6 t/ha to rice and75% NPK to wheat.
Inoculation of BGA @ 10 kg/ha provides about 20-30 kg N/ha.
Rice-rice Use of organic sources, such as FYM, compost, green manure, azolla etc.meet 25-50% of N needs in kharif rice and can help curtailing NPK fertilizers by25-50%.
Apply 75% NPK + 25% NPK through green manure or FYM at 6 t/ha to kharifrice and 75% NPK to rabi rice.
A successful inoculation of blue green algae @ 10 kg/ha provides about 20-30 kgN/ha.
Rice-potato-groundnut Use 75% NPK with 10 t FYM/ha in rice and potato.
Sugarcane based Combined use of 10 t FYM/ha and recommended NPK increases the canecropping systems productivity by 8-12 t/ha over chemical fertilizer alone.
Maize based cropping Apply 50% recommended NPK as fertilizer and 50% of N as FYM in maize andsystems 100% of recommended NPK as fertilizer in wheat.
Soybean-wheat To get 2 t soybean and 3.5 t wheat, apply 8 t FYM/ha to soybean and 60 kgN + 11 kg P/ha to wheat or apply 4 t FYM + 10 kg N + 11 kg P/ha to soybean and90 kg N + 22 kg P/ha to wheat.
Pulses Integrated use of FYM at 2.5 t/ha and 50% recommended NPK fertilizers plusrhizobium inoculation helps in saving of 50% chemical fertilizers.
Sorghum based Substitute 60 kg N through FYM or green leuceana leaucocephala loppings tocropping system get higher yields and FUE.
Cotton 50% of recommended NPK can be replaced by 5 t FYM/ha.
Oilseeds (Mustard, Substitute 25-50% of chemical fertilizer through 10 t FYM/ha to get higher yieldSunflower etc.) and FUE.
Source: Subba Rao and Sammi Reddy, 2005.

36
4.1 Recycling of crop residues and green manuring
Management of crop residues is either through of the following 3 methods; removal, burning orincorporation into soil. Burning is a minor practice in India. Sidhu and Beri (1989) reported that insitu recycling of crop residues in rice-wheat rotation reduced grain yield of rice and wheat.Therefore, most of the farmers recycle the crop residues not by choice but due to combineharvesting, burn the residue causing loss of precious organic matter, plant nutrients andenvironmental pollution. Experiments conducted in Punjab have shown that co-incorporation ofgreen manure and crop residues of wheat and rice helped alleviate the adverse effects of unburnedcrop residues on crop yields (Table 11).
Table 11. Effects of incorporation of green manure (G.M.) and crop residue on grain yield of rice (t/ha)
Treatment 1988 1989 1990 1991 1992 1993Control (No N) 4.0 4.6 3.7 4.3 4.1 3.4
150 kg N/ha 6.3 6.6 6.2 6.5 5.7 5.6
180 kg N/ha 6.6 6.9 5.8 6.7 NT 5.3
G.M. 6.6 6.5 6.2 6.5 5.8 5.5
G.M. + wheat straw 6.9 6.9 6.4 6.8 5.6 5.5
G.M. + rice straw 6.9 6.9 6.7 7.0 5.9 5.3
l.s.d. (P = 0.05) 0.53 0.59 0.46 0.45 0.32 0.37
G.M. = Green manure.
4.2 Role of biofertilizers in INM under intensive systems
Several studies clearly indicate that among the different types of biofertilizers available at present,Rhizobium is relatively more effective and widely used. Considering an average N fixation rate of25 kg N/ha per 500 g application of Rhizobium, it is expected that 1 tonne of Rhizobium inoculantswill be equivalent to 50 tonnes of nitrogen. On the other hand, Azotobacter, which is used innon-legume crops has given inconclusive results. Similarly, Blue Green Algae (BGA) and Azollahave been reported to be effective only in certain traditional rice growing areas in the country.Meanwhile if BGA applied at 10 kg/ha fixes 20 kg N/ha, then 1 tonne of BGA has an equivalentfertilizer value of 2 tonnes of nitrogen. The beneficial effect of the organisms like Azospirillum andAzotobacter in suppression of soil-borne pathogenic diseases of crops is yet to be established ona pilot scale. Another important role of biofertilizers is liberation of growth substances, whichpromote germination and plant growth. Against the total anticipated biofertilizers demand of1 million tonne in the country, the current supply position is very low (<10 000 tonnes). There areseveral constraints to effectively utilize and popularize the use of biofertilizers. Some of theseconstraints are:
● Unlike mineral fertilizers, use of the biofertilizers is crop and location specific. A strainfound ideal at one location may be ineffective at another location due to competition ofnative soil microbes, poor aeration, high temperature, soil moisture, acidity, salinity andalkalinity, presence of toxic elements etc;
● Low shelf life of the microorganisms;
● Unlike mineral fertilizers, biofertilizers need careful handling and storage;
● Lack of suitable carrier material, for restoration and longevity in actual field conditions.
In order to overcome the above-cited constraints and make biofertilizers an effective supplementarysource of mineral fertilizers, these aspects need to be critically attended.

37
5. Constraints in use of organics complementary with mineral fertilizers
Convenience and advantages in use of fertilizers
Though fertilizers are costly inputs in agriculture, they are ‘concentrated’ source of plant nutrientswhich can be formulated or tailored before or just prior to field application as per needs of the cropsand can be applied with minimum transport and labour and at right time. Fertilizer use is high inirrigated crops, commercial crops and in peri-urban areas where awareness is high. The farmers areaware of the need for high nutrient use in high production areas under irrigated condition.
5.1 Selective use of fertilizers and manures
Fertilizer use is high in rice, wheat, sugarcane and cotton. Organic manures wherever available areinvariably used in some vegetable crops like potato, onion, chillies, spices like ginger and turmic, incereals like rice, in commercial crops like sugarcane, cotton and fruit crop banana. Green manuringis very prominent in rice and sugarcane and farmyard manure is commonly applied in arid andsemi-arid dry land areas where costly fertilizers are discouraged due to the risk associated with theiruse and also due to the need for water for irrigation/soil moisture for better utilization of the appliednutrients. Farmers are also aware of the need for organics in dry land agriculture where some sort ofstability to production is ensured because of its possible role in soil structure improvementand moisture storage and supply. The farmers in India apply good amount of organic manure(FYM, compost, goat, poultry and pig manure) at some periodicity to regenerate the soil fertilityafter three to five years of cropping.
5.2 Agro-ecological differences
Organic manure use is high in arid and semi-arid zones where rainfall/irrigation water or soilmoisture is a limitation.
5.3 Peri-urban/rural differences
Developed market encourages farmers to use fertilizers and produce more under intensive system ofcropping. Even small farmers use more fertilizers inputs, however in peri-urban areas, there is alsopossibility for use of agro-industrial or urban municipal wastes along with fertilizers to augment soilfertility. Farmers’ in remote areas with poor infrastructure and without access to market but areaware of the benefits of fertilizer use locally available organic sources.
5.4 Single multiple enterprises
Farmers who have less number of cattle may have to depend solely or mainly on fertilizers whereasfarmers who practice several occupations like cash and field crops, dairy or livestock, poultry,fisheries enterprise etc., have opportunities to use/recycle the wastes, manures preferentially andprofitably without depending on costly purchased inputs.
5.5 Land tenancy
The farmers who take land on tenure basis try to harvest high yields using mineral fertilizers andirrigation to ensure rapid returns to cover the cost of renting the land and may ignore the use oforganic manures especially in cereal crop production.

38
5.6 Lack of organic materials
Unavailability of organic materials especially animal manure and crop residues is a primaryconstraint in many areas.
5.7 Competitive use of organic resources
A very important example of competitive use is the use of cow dung as fuel because of the shortageof fuel wood. Similarly, crop straws or stalks like that of castor, red gram, cotton are used as fuel.Crop residues are also very valuable animal feed. Sometimes poultry manure/droppings are mixedwith other additives and used as fish or cattle feed.
5.8 High cost of organic manures
Cost of organic manures especially animal manures is high in peri-urban areas where these manuresare preferentially used in ornamental gardens, lawns and home gardens in raising vegetable crops.
5.9 Transport
Because organic manures are bulky, it is not convenient to transport and to apply them in all crops inall seasons. So it is applied conveniently in sufficiently good amount in remunerative crops at4-5 years interval especially in kharif crops.
5.10 Pests, diseases and weeds
Some believe that the organic manures may carry pests, pathogens and weed seeds and propagatethem in the current or following crops.
6. Farming systems approach
Besides the above stated constraints, to make INM a reality, micro-watershed based agriculturaldiversification through farming systems approach, consisting of crop and animal husbandry,horticulture, bee keeping, pisci culture, etc. are needed to be adopted. In general terms, the goal offarming systems approach is to increase and stabilize farm production and farm income. Havingdiverse enterprises creates opportunities for recycling, so that pollution is minimized because a wastein one enterprise becomes an input for another. The risk minimization, employment generation andsustained/increased household income are the benefits associated with multi-enterprise farmingsystems. Appropriate and situation-specific farm diversification models need to be developed anddiffused. Efforts are underway in different locations to develop farm diversification modelsinvolving judicious enterprise mix that may provide attractive income besides meeting householddemands from a given piece of farmland. One such model put forth by Behera and Mahapatra(1999) suggests an optimum integration of farm enterprises for a small land holding of 1.25 ha forBhubaneshwar conditions. In this particular model, land was allocated for different enterprises inproportion to their significance in household needs and demand in local market. It was shown thatwith the adoption of this diversification model, a net income of Rs.58 360/year was derived from1.25 ha farm land (Table 12). This kind of model is worth emulating in parts of the country as wellin our search for comprehensive food and nutritional security.

39
7. Current status of INM
Keeping the importance of organic resources in view, a lot of research has been done on integratednutrient management during last two decades in natural resource management (NRM) institutionsand state agricultural universities. This research has led to:
● Development of INM practices for major crops;
● Understanding the enhanced role of organic manures in increasing input use efficiency dueto their favourable effect on physical, chemical and biological condition of the soil;
● Establishing the beneficial role of integrated use of organic manures in improving nutrientcycling in different production systems in various types of soils;
● Beneficial role of INM in improving soil chemical, physical and biological quality forsustainable crop production; and
● The work on INM has been compiled and published in the form of books/bulletins byseveral institutions.
8. Research gaps in INM
The research gaps include:
● Mismatching of INM practices developed at research stations with the farmers’ resourcesand their practices;
● INM recommendations for different crops are not based on soil testing and nutrient releasebehaviour of the manures;
● Nutrient balance/flow analysis vis-à-vis soil fertility management practices with specialreference to INM at farm level needs to be worked out;
Table 12. A farm enterprise diversification model for 1.25 ha farmland at Bhubaneshwar andits economics
Employment TotalNet return
Return/RupeeComponents generation expenditure
(Rs.)invested
(man days) (Rs.) (Rs.)Field crops 98.2 3 315 5 638 2.70
Multistoried cropping 87.0 3 831 9 089 3.37
Pomology 18.4 900 1 466 2.63
Olericulture 96.4 3 812 8 302 3.18
Floriculture 4.0 125 100 1.80
Pisciculture 31.0 3 722 16 603 5.46
Poultry 23.0 9 240 981 1.10
Duckery 23.0 5 387 713 1.13
Mushroom cultivation 180.0 18 184 12 856 1.70
Apiary 1.0 170 1 180 7.94
Biogas 11.0 600 1 431 3.38
Total 573.0 49 286 58 360 2.18
Source: Behera and Mahapatra (1999).

40
● Nutrient release characteristics of farm residues in relation to their quality to developdecision support systems;
● Biofertilizers were not included as component of INM in many cases; and
● Integrated Farming Systems (IFS) approach needs to be encouraged for sustaininglivelihood in rural areas particularly for small and marginal farmers.
References
Behara, U.K. and Mahapatra, I.C. (1999). Indian J. Agron. 44: 431-39.
Chhonkar, P.K. and Dwivedi, B.S. (2004). Fertilizer News 49(11): 15-38.
FAI (2003). Fertilizer statistics 2002-2003. The Fertilizer Association of India, New Delhi.
Kumar, P. (1998). Food demand and supply position for India, Agric. Econ. Policy Paper 98-01, IARI,New Delhi.
Rajendra Prasad (2003). Fertilizer News 48(8): 13-26.
Reddy, D.D., Subba Rao, A., Sammi Reddy, K. and Takkar, P.N. (1999). Field Crops Research 62:180-190.
Sehgal, J.L. and Abrol, I.P. (1994). Land Degradation in India: Status and Impact. Oxford & IBHPublishing Co. Pvt. Ltd., New Delhi.
Sekhon, G.S. (1997). In: Plant nutrient needs, supply, efficiency and policy issues: 2000-2025(J.S. Kanwar and J.C. Katyal eds.), NAAS, New Delhi, pp. 78-90.
Sidhu, B.S. and Beri, V. Biol. Wastes 27: 15-27 (1989).
Subba Rao, A. and Sammi Reddy, K. (2005). Indian Journal of Fertilizers 1(4): 77-83.
Swarup, A. and Ganeshamurthy, A.N. (1998). Fertilizer News 43(7): 37-40 & 43-50.
Swarup, A. (2002) Fertilizer News 47(12): 59-73.
Tandon, H.L.S. (1995). In: Proceedings of the IFPRI/FAO workshop on plant nutrient management,food security, and sustainable agriculture: The future through 2020 (Eds.: P. Gruhn, F. Goletti andR.N. Roy), Viterbo, Italy, May 16-17, 1995. pp. 199-234.

41
South Asian Country
Paper Number 3
Plant nutrient management for improvingcrop productivity in Nepal*
D.P. Sherchan and K.B. KarkiSoil Science Division, Nepal Agricultural Research Council (NARC)
Kathmandu, Nepal
Summary
Nepal’s economy largely depends on its agriculture sector. Priority strategies, both technicaland legislative, have been put in place to achieve sustainable agricultural productivity. Severalresearch studies involving application of modern agriculture technologies have been conductedto address the problem of low crop production, soil fertility, nutrient imbalance and the like. Inthe legislative aspect, the Nepal had long formulated its Agriculture Perspective Plan (APP) toaccelerate agriculture economic growth. However, APP put emphasis on boosting up theagriculture production through use of chemical fertilizers and irrigation in high productionpotential areas. Researchers have noted the emerging deficiencies of micronutrients especiallyzinc, boron and molybdenum and are increasing in extent in intensively cropped areas indifferent ecological belts of the country. Zinc has become a yield limiting in the major riceproducing areas of the country. There is likewise a growing concern of the long-term impactsof fertilizer inadequacy and mismanagement in the rapid deterioration of soil health. Thecountry’s researchers have conducted a wide range of soil nutrient conserving activities thatincluded management of acid soils, the adoption of sloping agricultural technologies, the use ofbiofertilizers. The Twenty Years NARC vision (2021) is another strategic master plan foraction that was developed few years back to guide research and development activities in thecountry. It involves the conduct of efficacy testing transferrability of results of researches fromthe research stations to outreach sites where farmers will participate in testing the technology.
1. Introduction
Agriculture remains Nepal’s principal economy activity employing around 65.62 percent of thepopulation (23.3 million). The agriculture sector alone contributes 38.81 percent to the nationalGDP. The current food production is not sufficient to meet the food requirement of the growingpopulation which is at a rate of 2.25 percent indicating serious food insecurity (MOAC, 2005).Therefore, agriculture is a priority sector and there is a strong need to appraise the potentiality. Atthe same time subsistence farming has to be changed to commercial agriculture to uplift theeconomic status of poor people. Unavailability of appropriate technology, rain water erosion in thehills and mountains and nutrient mining, and increasing cropping intensities without judiciousfertilization application have been the major technical problems. Small land holding, subsistencefarming and poverty are social constraints. The potential arable land is already under cultivation andthere is not much scope to increase. The alternative option would be to cultivate the forest land andthe marginal land which are already at the state of degradation.
* This country report has not been formally edited and the designations and terminology used are those of the author.
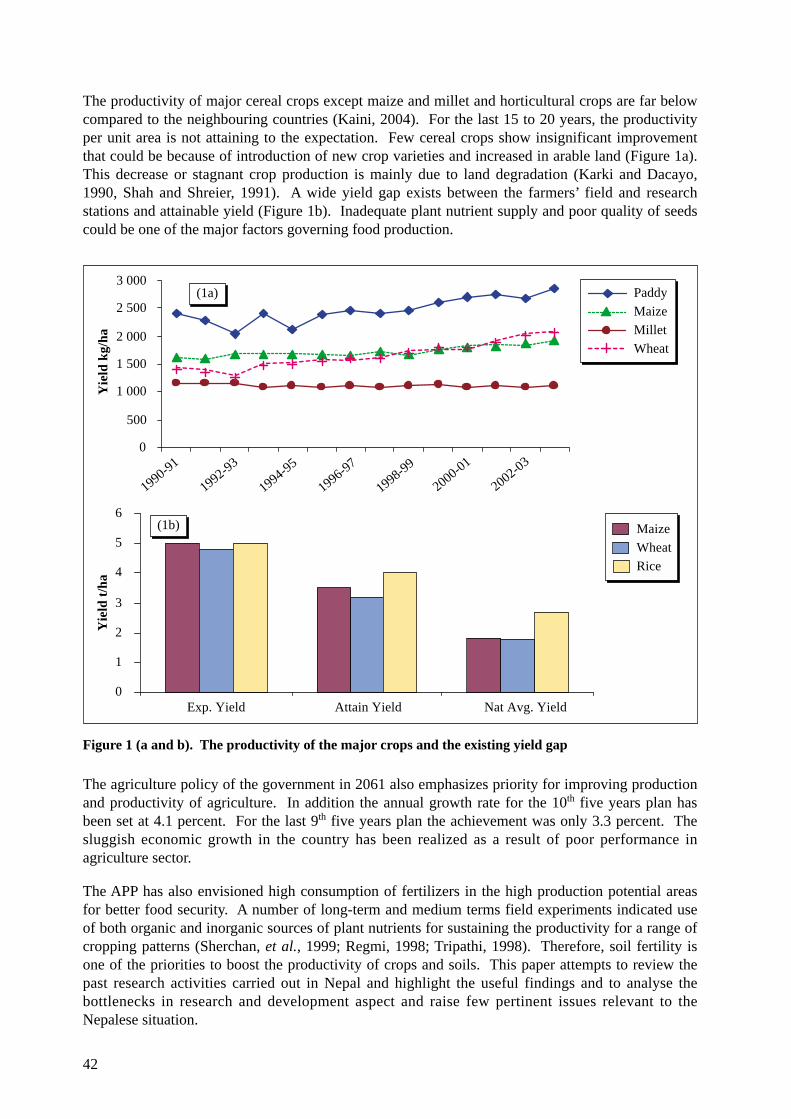
42
The productivity of major cereal crops except maize and millet and horticultural crops are far belowcompared to the neighbouring countries (Kaini, 2004). For the last 15 to 20 years, the productivityper unit area is not attaining to the expectation. Few cereal crops show insignificant improvementthat could be because of introduction of new crop varieties and increased in arable land (Figure 1a).This decrease or stagnant crop production is mainly due to land degradation (Karki and Dacayo,1990, Shah and Shreier, 1991). A wide yield gap exists between the farmers’ field and researchstations and attainable yield (Figure 1b). Inadequate plant nutrient supply and poor quality of seedscould be one of the major factors governing food production.
Figure 1 (a and b). The productivity of the major crops and the existing yield gap
0
500
1 000
1 500
2 000
2 500
3 000
1990-91
1992-93
1994-95
1996-97
1998-99
2000-01
2002-03
(1a)
Yie
ld k
g/ha
Paddy
Maize
Millet
Wheat
0
1
2
3
4
5
6
Exp. Yield Attain Yield Nat Avg. Yield
(1b) Maize
Wheat
Rice
Yie
ld t
/ha
The agriculture policy of the government in 2061 also emphasizes priority for improving productionand productivity of agriculture. In addition the annual growth rate for the 10th five years plan hasbeen set at 4.1 percent. For the last 9th five years plan the achievement was only 3.3 percent. Thesluggish economic growth in the country has been realized as a result of poor performance inagriculture sector.
The APP has also envisioned high consumption of fertilizers in the high production potential areasfor better food security. A number of long-term and medium terms field experiments indicated useof both organic and inorganic sources of plant nutrients for sustaining the productivity for a range ofcropping patterns (Sherchan, et al., 1999; Regmi, 1998; Tripathi, 1998). Therefore, soil fertility isone of the priorities to boost the productivity of crops and soils. This paper attempts to review thepast research activities carried out in Nepal and highlight the useful findings and to analyse thebottlenecks in research and development aspect and raise few pertinent issues relevant to theNepalese situation.

43
2. Source of plant nutrients
The various sources of plant nutrients in the Nepalese farming system have been identified (Carson,1992). Among them chemical fertilizer is becoming gradually a major source (Figure 2). Since theimport data indicates an increasing trend. However, earlier to the introduction of mineral fertilizerinto Nepal in 1952, crop production mainly depended on farmyard manure (Pandey and Joshy, 2000).Since fertilizer demand increased and the government agency, Agriculture Input Corporation (AIC)the sole authority in fertilizer import could not meet the demand, the HMG of Nepal deregularisedfertilizer import policy in 1996/1997. The total N, P, and K consumption is around 35 kg/ha. Thestatistics show around 75 percent of the total imported fertilizer is consumed in Terai (accessiblearea) and only was 25 percent in the hills and mountains. There has been constant complains on thequality and supply of fertilizers in the market after the deregulation of fertilizers policy.
Figure 2. Chemical fertilizer imported into the country
020 00040 00060 00080 000
100 000120 000140 000160 000180 000200 000
1990-91
1992-93
1994-95
1996-97
1998-99
2000-01
2002-03
AIC
PVT
Total
Impo
rted
mt
The HMG Nepal has appointed fertilizer inspectors in various districts, however, due to lack ofanalysis facilities, quality control is not easy. Monitoring to control the quality of fertilizers has beenin progress. The supply of chemical fertilizers on time is still not guarantee that restricts use on righttime and the majority of farmers cannot afford the costly fertilizers. Frequent change of fertilizerstypes loose confidence amongst poor farmers.
Cropping pattern, land drainage (soil moisture), access to resources cash, market opportunities,fertilizers types and crops species determine the nutrient management in the Terai, hills andmountains area. The irrigable areas is around 32 percent of the total arable land and the majority ofareas are rainfed. The bottleneck with the use of farmyard manure and compost are labouravailability, access to forest resources that restrict adequate supply of the composting materials. Thefarming system both in the hilly and flat land (Terai) is complex, diverse and predominantly resourcepoor. Pound et al. (1990) attempted to show the linkages between the forest, livestock and cropproduction (Figure 3) and soil management is influenced by these components. Therefore, theagriculture productions and productivity are largely determined by the soil management forimproving as well as maintaining the productivity of soils and crop for long-term without an adverseeffect on soil environment as well.

44
3. Nutrient flow and balance in the Nepalese farming system
Plant nutrients are coming to the soil system from various sources (Figure 4). Forest and livestockare the major sources of nutrients that have been influenced greatly by current changingcircumstances. External sources of plant nutrient particularly the chemical fertilizers depends onimports from outside, purchasing capacity of farmers and availability on right time. A limited studyconducted to estimate the nutrient balance showed mixed results. Ghani and Brown (1997) reportedthat the balance of plant nutrients N, P, K and S were estimated after the harvest of the early rice, themain season rice, the maize and the wheat. The early rice showed negative balance of K and S. Attwo sites N was negative but P was found to be positive balance in all the tested sites. After themaize harvest the N balance was found to be positive around 60 percent of the tested sites. But P, Kand S were largely negative. After the wheat harvest N, P, K and S were found strongly in negativebalance. This is very surprise to note that despite adequate K in the Nepalese soils the balance isnegative. However, Karki (2004) reported that reserve soil K in intensive farming areas is declining.Regmi et al. (2002) reported that application 40 kg/ha potash under rice-rice and wheat rotationcannot maintain K balance in soils. Pandey et al. (1998) reported results of a three years experimenton rice and wheat rotation in a low land rainfed condition that three major nutrients N, P and Kfound in negative balance after rice harvest. Application of 50 kg/ha nitrogen, 30 kg/ha phosphorusand 30 kg/ha potash were also found negative in balance. The result also indicated that farmyardmanure at a rate of 10 t/ha is not enough to maintain nutrient balance under rice and wheat rotationsystem. Pilbeam et al. (1998) estimated nitrogen balance in positive referring to the nutrientmanagement system of the middle mountain region. Bhattarai et al. (2000) reported negativebalance of the vegetables cultivation in the majority of study sites except at few locations. Theyhave emphasized use of bacterial fertilizers for maintaining productivity and soil health. However,there is lack of proper study to quantify by the nutrients contribution from various sources and lossesthrough the system.
Figure 3. The Nepalese farming system (Pound et al., 1995)
Forest
Household
LivestockCrops Draught/manure/bedding
Fodder bedding
Labou
r
Compo
st fe
ncin
g Fodder bedding
Labour
FuelTimberThatchingFood/medicine
Labour
Food/cash insuranceFood/
cash

45
4. Soil and nutrient losses from the hill slopes
Rain water erosion is a serious land degradation process in the hilly and slopy land that comprisesaround 86 percent of the total geographical area of the country. The experimental results have beenreviewed by Gardner et al. (1995) that indicates a bit of confusion about whether the soil loss fromtop soils is really a serious environmental degradation or not. Recently Shrestha et al. (2005)published that 32 t/ha of soil is lost every year from hill terraces which are rather serious theinconsistent results obtained from the various locations would be because of the method employed torecord losses. However, it has been well identified that more than 50 percent of soil loss occurredduring the early monsoon period. Gardner et al. (2000) found out that a nutrient loss throughleachate is more serious problem than in the sediments. Nitrate-N losses are high during thetransition period between the pre monsoon and main monsoon. K losses also found high in leachatein the early monsoon. Sherchan and Gurung (1992) reported decline of maize productivity over theyears because of top soil erosion (Figure 5).
Figure 4. Nutrient flow components in the Nepalese farming system
SOIL
CHEMICAL
FERTILIZERS
PEOPLEPLANT
GROWTH
By pass
compost
ASH
CROP
RESIDUESNIGHT
SOIL
COMPOST
STREAM
FARM
ANIMALS
feeding
feeding
feed
ing
REFUSE
Har
ves
tin
g
Firewood
Soil Erosion
Leaching
Plantuptake
Rainwater (N)
River sediment(N, P, K, OM)
Irrigation
Flooding
Weathered materialsFrom parent rock (P&K)
N f
ixat
ion
N v
ola
tiza
tio
n
Sedimentslost tosystem
Bu
rnin
g
DUNG URINE

46
5. Acid soils improvement
Amelioration of acid soils has been recommended by agriculturists since soils nearly 49 percent ofthe geographic area are acidic in reaction. Acidic condition hinders the availability of many essentialnutrients to crops. Karki and Dacayo (1990) recommended 6-9 t/ha of lime on various soils whereasSherchan (1998) reported that 2 to 4 t/ha lime requirement. However, considering remoteness andlack of logistics support especially in the hills there is a need to find out alternative ways. In thisconnection Tripathi (2001) initiated to select local and exotic germplasm of maize, wheat, uplandrice, soybean and black gram suitable to acidic environment. Tripathi (2000) further recommendedapplying lime in combination with compost or organic manure. He also recommended 2 t/ha appliedfor maize and wheat that would increase up to 35 percent yield over non limed plot. So this is one ofthe areas in nutrient management need to be studied systematically.
6. Bacterial fertilizers, BNF and organic manure
Significant achievements have been obtained in BNF research and its associated fields to improvethe productivity of legume crops in Nepal (Bhattarai and Maskey 1987). The productivity of themajor summer and winter legumes crops such as soybean and lentil have been increased throughusing effective inoculums in the farmers’ fields (Figure 6). The effective Rhizobium strains forsoybean, black gram, cowpea, lentil, chickpea, peanut, mungbean clover, desmodium, stylosanthees,
Figure 5. Relationship between cumulative soil loss and the maize productivity
0
1 000
2 000
3 000
4 000
5 000
6 000
20 40 60 80 1000
y = 5774.1e-0.0159x
R2 = 0.7252M
aize
yie
ld k
g/ha
Cumulative soil loss t/ha
67.5
47.049.039.6
64.7
0
1 000
2 000
3 000
4 000
0
20
40
60
80
Soybean Lentil Black gram Groundnut Broad Bean
Yie
ld k
g/ha
Percent incream
ent
Non-inoculated Inoculated Percent increament
Figure 6: Effect of the Rhizobium inoculum on the yield of leguminous crops

47
astragtalus, ipil-ipil, medicago and vetch are being maintained at Soil Science Division, NARC.Technologies for the preparation and application procedures have been well standardized.Rhizobium culture for different leguminous crops is on high demand. Since government agencieshave not been able to meet the demand private sectors are encouraged to do this job. Field researchconducted on various cropping patterns indicated that integrated use of organic and inorganic sourcesof plant nutrients is the most sustainable nutrient management. The crop productivity has beenfound quite encouraging (Figure 7 and 8a and 8b).
0.0
0.5
1.0
1.5
2.0
2.5
3.0
3.5
4.0
1 2 3 4 5 6
Years
Mai
ze Y
ield
t/h
a
Compost 15 t/ha + 60:30:30 NPK kg/ha 15 t/ha Compost 120:60:40
Control Compost 15 t/ha Compost 15 t/ha + 30 kg NTD
NPK (60:30:30) Organic + Inorganic fertilizer
0.00.51.01.52.02.53.03.54.04.55.0
Wheat kg/ha Rice t/ha
Yie
ld t
/ha
8a
Control NPK(140:40:200) Compost 20 t/ha 1/2 NPK & 1/2 Compost
0
5
10
15
20
25
30
35
2002-03 2003-04 2004-05 Mean
Yie
ld t/
ha
8b
Figure 7. Effect of organic and inorganic manure on the productivity of maize under maize relayedmillet systems
Figure 8a and 8b. Effect of inorganic and organic manure on rice, wheat and potato
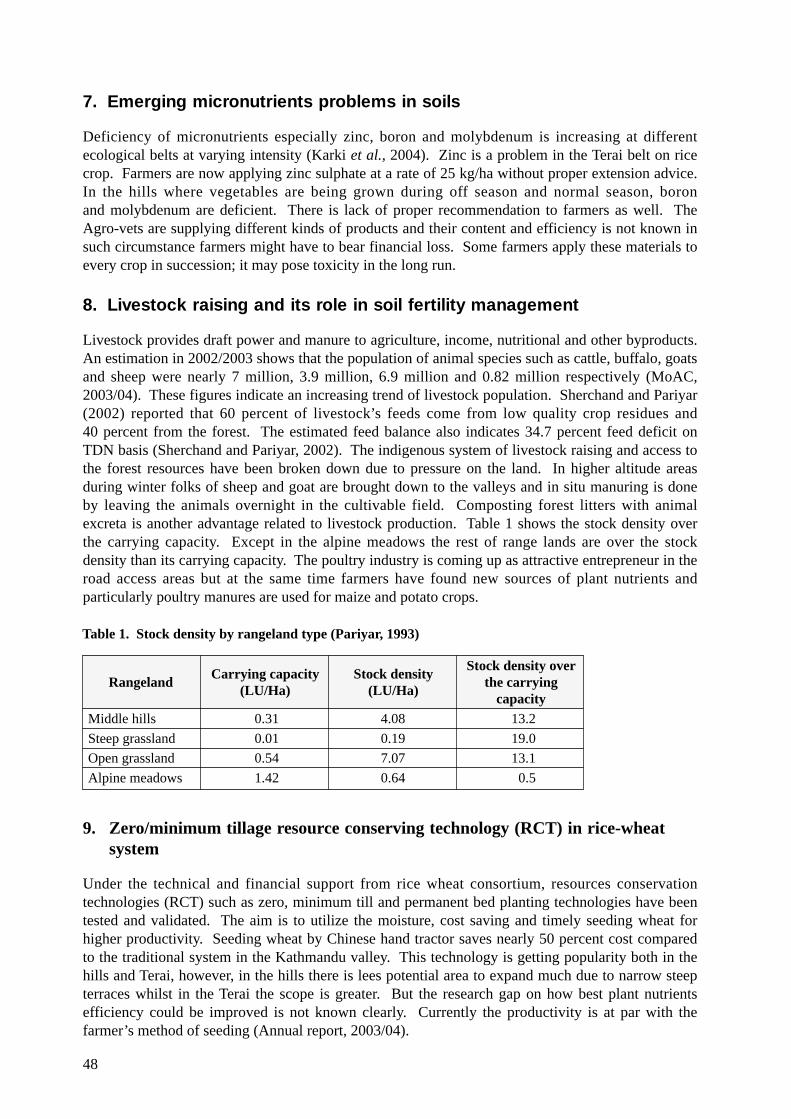
48
7. Emerging micronutrients problems in soils
Deficiency of micronutrients especially zinc, boron and molybdenum is increasing at differentecological belts at varying intensity (Karki et al., 2004). Zinc is a problem in the Terai belt on ricecrop. Farmers are now applying zinc sulphate at a rate of 25 kg/ha without proper extension advice.In the hills where vegetables are being grown during off season and normal season, boronand molybdenum are deficient. There is lack of proper recommendation to farmers as well. TheAgro-vets are supplying different kinds of products and their content and efficiency is not known insuch circumstance farmers might have to bear financial loss. Some farmers apply these materials toevery crop in succession; it may pose toxicity in the long run.
8. Livestock raising and its role in soil fertility management
Livestock provides draft power and manure to agriculture, income, nutritional and other byproducts.An estimation in 2002/2003 shows that the population of animal species such as cattle, buffalo, goatsand sheep were nearly 7 million, 3.9 million, 6.9 million and 0.82 million respectively (MoAC,2003/04). These figures indicate an increasing trend of livestock population. Sherchand and Pariyar(2002) reported that 60 percent of livestock’s feeds come from low quality crop residues and40 percent from the forest. The estimated feed balance also indicates 34.7 percent feed deficit onTDN basis (Sherchand and Pariyar, 2002). The indigenous system of livestock raising and access tothe forest resources have been broken down due to pressure on the land. In higher altitude areasduring winter folks of sheep and goat are brought down to the valleys and in situ manuring is doneby leaving the animals overnight in the cultivable field. Composting forest litters with animalexcreta is another advantage related to livestock production. Table 1 shows the stock density overthe carrying capacity. Except in the alpine meadows the rest of range lands are over the stockdensity than its carrying capacity. The poultry industry is coming up as attractive entrepreneur in theroad access areas but at the same time farmers have found new sources of plant nutrients andparticularly poultry manures are used for maize and potato crops.
Table 1. Stock density by rangeland type (Pariyar, 1993)
Carrying capacity Stock densityStock density over
Rangeland(LU/Ha) (LU/Ha)
the carryingcapacity
Middle hills 0.31 4.08 13.2
Steep grassland 0.01 0.19 19.0
Open grassland 0.54 7.07 13.1
Alpine meadows 1.42 0.64 0.5
9. Zero/minimum tillage resource conserving technology (RCT) in rice-wheatsystem
Under the technical and financial support from rice wheat consortium, resources conservationtechnologies (RCT) such as zero, minimum till and permanent bed planting technologies have beentested and validated. The aim is to utilize the moisture, cost saving and timely seeding wheat forhigher productivity. Seeding wheat by Chinese hand tractor saves nearly 50 percent cost comparedto the traditional system in the Kathmandu valley. This technology is getting popularity both in thehills and Terai, however, in the hills there is lees potential area to expand much due to narrow steepterraces whilst in the Terai the scope is greater. But the research gap on how best plant nutrientsefficiency could be improved is not known clearly. Currently the productivity is at par with thefarmer’s method of seeding (Annual report, 2003/04).
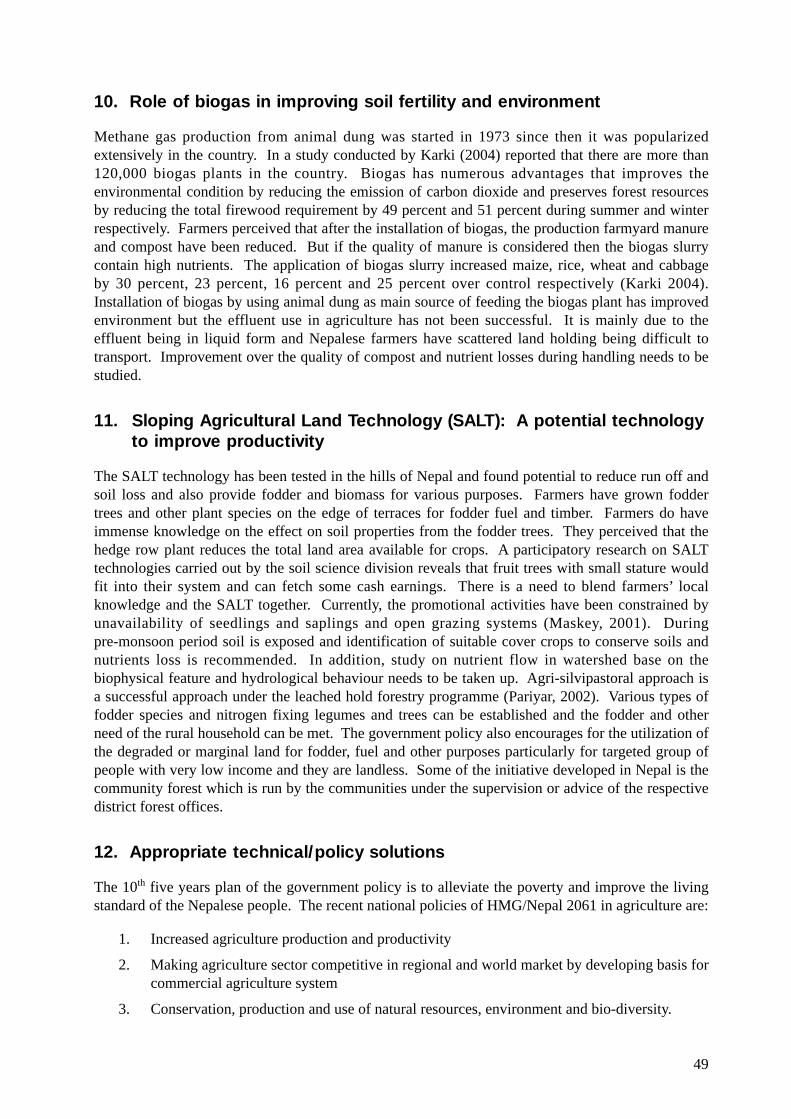
49
10. Role of biogas in improving soil fertility and environment
Methane gas production from animal dung was started in 1973 since then it was popularizedextensively in the country. In a study conducted by Karki (2004) reported that there are more than120,000 biogas plants in the country. Biogas has numerous advantages that improves theenvironmental condition by reducing the emission of carbon dioxide and preserves forest resourcesby reducing the total firewood requirement by 49 percent and 51 percent during summer and winterrespectively. Farmers perceived that after the installation of biogas, the production farmyard manureand compost have been reduced. But if the quality of manure is considered then the biogas slurrycontain high nutrients. The application of biogas slurry increased maize, rice, wheat and cabbageby 30 percent, 23 percent, 16 percent and 25 percent over control respectively (Karki 2004).Installation of biogas by using animal dung as main source of feeding the biogas plant has improvedenvironment but the effluent use in agriculture has not been successful. It is mainly due to theeffluent being in liquid form and Nepalese farmers have scattered land holding being difficult totransport. Improvement over the quality of compost and nutrient losses during handling needs to bestudied.
11. Sloping Agricultural Land Technology (SALT): A potential technologyto improve productivity
The SALT technology has been tested in the hills of Nepal and found potential to reduce run off andsoil loss and also provide fodder and biomass for various purposes. Farmers have grown foddertrees and other plant species on the edge of terraces for fodder fuel and timber. Farmers do haveimmense knowledge on the effect on soil properties from the fodder trees. They perceived that thehedge row plant reduces the total land area available for crops. A participatory research on SALTtechnologies carried out by the soil science division reveals that fruit trees with small stature wouldfit into their system and can fetch some cash earnings. There is a need to blend farmers’ localknowledge and the SALT together. Currently, the promotional activities have been constrained byunavailability of seedlings and saplings and open grazing systems (Maskey, 2001). Duringpre-monsoon period soil is exposed and identification of suitable cover crops to conserve soils andnutrients loss is recommended. In addition, study on nutrient flow in watershed base on thebiophysical feature and hydrological behaviour needs to be taken up. Agri-silvipastoral approach isa successful approach under the leached hold forestry programme (Pariyar, 2002). Various types offodder species and nitrogen fixing legumes and trees can be established and the fodder and otherneed of the rural household can be met. The government policy also encourages for the utilization ofthe degraded or marginal land for fodder, fuel and other purposes particularly for targeted group ofpeople with very low income and they are landless. Some of the initiative developed in Nepal is thecommunity forest which is run by the communities under the supervision or advice of the respectivedistrict forest offices.
12. Appropriate technical/policy solutions
The 10th five years plan of the government policy is to alleviate the poverty and improve the livingstandard of the Nepalese people. The recent national policies of HMG/Nepal 2061 in agriculture are:
1. Increased agriculture production and productivity
2. Making agriculture sector competitive in regional and world market by developing basis forcommercial agriculture system
3. Conservation, production and use of natural resources, environment and bio-diversity.

50
Before the inception of the current government policy, Agriculture Perspective Plan was in placedexclusively looking to accelerate the agriculture economic growth. The strategies envisaged in theAPP are as follows:
1. Major dominant food crops rice, maize, wheat and potato
2. High values crops apple, off season vegetables, vegetables seeds, sericulture and apiculture
3. Dairy production, animal nutrition high value fodder crops
4. Develop soil fertility and shallow tube well farming system
5. Develop strong outreach systems
6. Develop scientific information system
7. Develop close association with other organization in agriculture research
APP has emphasized to boosts up the agriculture production through use of chemical fertilizers andirrigation in high production potential areas. This would raise environmental effect on soil health.The Twenty years NARC vision (2021) is another strategies document that was developed few yearsback to guide research and development activities in the country. The strategies are:
1. Demand-driven and appropriate technology developed for priority client groups and fedinto uptake networks.
2. Demand-driven agricultural policy, trade, marketing and socio-economic researchconducted and fed into uptake networks.
3. Coordination and networking to maximise the impact of agricultural research enhanced.
4. NARC ability to achieve its objectives improved.
5. Mandated direct services delivered appropriately.
These all policy papers or documents address the poverty reduction with better agriculture growth,sustainability of the systems and environments for future and improve the capability to compete inthe world market. These all changing scenarios have an implication in current agriculture farmingand future sustainability of the system. Therefore, an integrated nutrient management which uses allsources of plant nutrients (mineral fertilizers, compost, bacterial fertilizers) could be scientificallyapplied. Sustainable plant nutrients management leads to improve productivity thereby improve thelivelihood of the people and better environment since it takes into consideration the factors that mayhave negative effect. Some of the appropriate solution and issues need to be addressed and they arediscussed in brief below:
A. Identification of research domain
There is a need to identify the domain for research and development. The flat land or the Terai isbasket for food production in Nepal although 66 percent of the populations live in Middle Mountainregion and food deficit is the major problem. Therefore, two domain that is Terai and hills and twosub-domain irrigated and non-irrigated. Irrigated area as high production potential domain and thehigh cropping intensity as well as consumption of mineral fertilizer is high. In non-irrigated areawith low cropping intensity including fertilizer consumption is low. In simpler terms the Khet land(irrigated level terrace in the hills) where rice-based cropping pattern is the major one and another isBari land (upland) where maize based is the major cropping pattern.
Therefore, the strategy should be to use balance application of chemical fertilizers along withmaking best use of organic resources. Green manuring practices should be promoted since its

51
positive effect on crop production has already been proven in warmer air temperature regime andirrigated domain. Both exotic green manuring plant species such as Sabena and the indigenous nonleguminous species as Adhatoda vassica (3.8 percent N), Artmesia vulgaris (2.5 percent N) havebeen tried, however, adoption is weak that might be because of labour, mechanization and othersocial factors. In the hills due to remoteness the use of chemical fertilizer is restricted very much butin the areas where nutrients deficient have been investigated, the right type of chemical fertilizerscan play a greater role. However, still the compost and farmyard manure would be the major sourcesfor plant nutrients, therefore, the quality production and proper management of compost or farmyardmanure would be priority in the hills. APP has also emphasized on organic matter management inthe hills (APP, 1995).
B. Chemical fertilizer import policy
Government lifted the single door system of importing chemical fertilizers expecting a free andhealthy competition in the market. The government has put subsidy in transportation of thefertilizers and provided improved seeds for twenty six very remote districts to support the foodsecurity. International donors fund import of chemical fertilizers was also established tocommensurate the demand and ensure the continuous supply. Till now there are limited choices forfarmers. The highest demand nearly more than 50 percent is Urea followed by DiammoniumPhosphate (DAP), Mutate of Potash (MoP) and few others. Mixed or multiple nutrients containingfertilizers would give much more benefit compared with straight fertilizers provided the market priceis affordable to farmers. Therefore, we should think whether the market price on certain chemicalfertilizer such as ammonium sulphate or Urea can be increased and at the same time the market pricecan be relaxed for mixed or complete fertilizers type.
C. Formulation of fertilizers recommendation
Joshi and Deo (1975) developed a comprehensive recommendation on economic use of fertilizersfor various crops in 1975. Since then, no further systematic work has been tried in Nepal. Wecan expect quite different response level due to change in cropping pattern, increasing intensityand change in soil fertility status. The current recommendation should tie up with thefarmer’s knowledge and should be most practical from farmer’s perspective. Site specific fertilizerrecommendation has been made to the important crops but farmers deviate and use their own rate offertilizer (Joshi, 1997). This indicates that farmers do have their own economic judgment which weoverlooked. Dissemination of information on chemical fertilizers handling would be an area forpromotion on the use of fertilizers.
D. Improve biological processes in soil system
Evidences indicate that research is needed to improve the quality and quantity of compost as well asits efficient management. Poor quality of compost and its poor management and decreasingproduction are some of the well known hurdles. In the Terai, animal dungs are largely used for fuelpurposes but gradually there has been increasing use for biogas or methane gas production. This hasbeen a positive change for better environment. But farmers are complaining of less production oforganic manure because of this new practice. The researchable areas identified are animalshed management for collection; reduction of the losses from rainwater and sun, and fasterdecomposition and use of all available biomass to improve their quality. It has also been stressed inthe 10th five-year plan of the government to conserve and utilize the natural resources andenvironment for the production and utilization of the organic fertilizers. However, we should havestrategies for farm level production and commercialization in an accessible areas.

52
An integrated nutrient model developed quite some time ago as shown below Figure 9 wasa successful programme but it has not been popularized or has not been well adopted by largenumber of farmers. There should be a follow up study to see the impact on soil fertility managementand to look on how best we can promote to wider areas.
Figure 9. Integrated plant nutrient components in the Nepalese farming system
Nutrient Management Soil Management
Crop Management
Soil Status
DecisionEnvironment
● Market access● Labour availability● Social equity● Natural resources● Food quality
● Soil texture● pH● Organic matter● Leaching● Erosion● Nutrient availability
● Reduced erosion● Balanced pH● Reduced leaching● Increased nutrient
availability
● FYM/Compost● Green manures● Organic matter● Biological fixation● Chemical fertilizers● Residue management
● Expected yield● Nutrient removal● Variety selection● Intercropping, planting method● Water management● Weeds, pests management
IPN
E. Soil moisture management and conservations/cover crops
Around 68 percent of the total cultivated land is rainfed. The efficiency of applied nutrient would begreater if the optimum moisture is available that eventually improve the crop productivity. Themulching practices, water harvesting and utilize them as life saving in the form of irrigation wouldbe an option. Since during monsoon more than 80 percent of the total rainfall occurs but the excesswater could be reserved for dry season use. Identification of suitable species which could be used ascover crops for early monsoon period would be a solution to mitigate the soil and nutrients losses.Maskey et al., (2000) also recommended research and development activities on cover crops sincebiomass availability could be a major issue in near future.
F. Inclusion of legumes in crop rotation
Both in the hills and Terai regions of Nepal, legumes are one of the important sources of protein andcovers around 316 010 ha area with total production of 265 360 mt (MoAC, 2004). However,N-fixing capacity of these legume crops varieties is low. So the priority work should be to develophigh productive varieties and improve the N-fixing capacity by developing appropriate strains.Currently, Soil Science Division has identified effective strains of most legume crops. The currentexport is 12.2 million USD. Therefore, pulses could be very attractive exportable commodity.

53
G. The role of women in soil fertility management
It is well emphasized the importance of women roles in soil fertility management practices (Turtonet al., 1995) since their overall contribution in agriculture is very high. Study reveals that compostpreparation and application in the field is solely the work of women in Nepal. However, we have notcaptured their knowledge and experiences to improve the plant nutrients management.
H. Organic product and commercialization
Organic farming is one of the policies of the government under the competitive and commercializedagriculture. In Nepal, commercialization in agriculture is yet to be promoted. The recent activitiesshow encouraging move. With the increasing living standard of the people there would be moredemand for quality products in the market and also for export. However, guidelines are not availablefor the production of organic produce.
I. Nutrient management through in watershed concept
The biophysical features of a watershed in Nepal are quite unique and do not match with each other.The hydrological behaviour depends upon the condition of a watershed as well. Crops and soilmanagement between the upper and lower catchments are also determined by the moisture regimeand temperature regime. The flow of nutrients cycle between the upper and lower catchments hasa strong relationship in soil fertility management. The rain water erosion occurs in the uppercatchments and gets deposition in the down valleys. This is the area where our attention is required.
13. Dissemination of technologies and capacity building
A. Research planning process
It has been felt that the spread and adoption of technologies is rather slow or weak. This could bedue to poor planning processes and setting of priorities. NARC recognizes that the first step wouldbe to strengthen the planning process. There are a series of discussion forums such as regionaltechnical working group, planning and coordination meeting, review meetings to address theseissues. Different stakeholders such as Government, Non-governmental Organization, private sectorsand innovative and progressive farmers participated in the meetings. Based on the problemsidentified by the working groups, projects are submitted to NARC (once a year) for researchfunding. Similarly for development activities proposals are developed and submitted to theDepartment of Agriculture, Ministry of Agriculture and Cooperative for approval of fund. Projectsare implemented in the following years after the concerned authorities approved the proposals.
B. Testing and validation of technologies
In the field of crops research, participatory research methodologies have been well standardized andbeing followed whilst it has been experienced difficult to follow the same approach in case of soilrelated activities. However, some of the successful approach experienced by the Sustainable SoilManagement Programme (SSMP) project can be expanded to other areas of Nepal. Group approachis reported as most appropriate method of diffusing technologies with limited financial, technical andmanagerial supports (SSMP, 2003). Diffusion of sustainable soil management (SSM) practices fromleader-farmer to group-farmer is considered to a low cost and demand driven extension approach.The leader-farmers can be developed as a resources person. They can also provide their expertise toother non-project areas. They have also found that farmers-led experiments are effective to diffuse

54
SSM technologies due to the involvement of the farmers. Initially, integrated pest management(IPM) project started the farmer’s field school (FFS) approach in pest management. The samemethod was also applied in SSM activities especially on compost and farmyard manure productionand management. This was found quite effective. A system approach is followed in case ofintegrated nutrient management aspect. Bhattarai et al., (2000) experience on the farmer’s fieldschool (FFS) approach is quite successful to demonstrate and validate the integrated nutrientmanagement systems in diverse agri-ecological and social environment condition. It has been foundthat farmers have developed their skills and adopted the technologies comparatively in short periodof time.
C. Technology testing and validation through NARC outreach sites
The technology developed on research farm will be further verified in out reach sites where farmerswill participate in testing the technology. All research stations and regional centres under the NARCumbrella have three to four outreach sites depending upon the area coverage for testing andvalidating the technologies. Field trials will be put in the farmers fields in close cooperation with thefarmers. At various critical stages of crops, visits will be made by the group of farmers. Interactionand discussion will be held to evaluate the technology. Neighbouring farmers will frequently visitthe experimental sites and interact with concerned technical staffs and the farmers actually testingthe technology. Observational visits of all the stakeholders such as extension workers, agriculturalplanners members of NGOs, private sectors including farmers will be organized when the crop isabout to be harvested. Detailed discussion on the pros and cons of the technology to be disseminatedwill be discussed and further verification will be done if needed. Socio-economic aspect of thetechnology will also be discussed. Then scaling up will be carried out. After the visit, posters andpamphlets will be prepared including media broadcasting.
D. Capacity building
Training is a strong means to improve the capability of the researcher, extension agent, NGOspartners and the clients or the ultimate end users. Various forms of training modules are beingorganized. Among them, training conducted in the field itself is the most effective. Female farmershave problem to attend the training since they can not stay overnight outside because of culturalproblem. It is also experienced that long duration training is not effective. Identification ofinnovative farmer to implement activities through him/her is also found effective approach.
14. Conclusions
The poor socio-economic condition is directly related to degradation of natural resources mainlyland, soil and forest that also eventually determine the sustainability of the system. These resourcesare gradually at danger state in Nepal due to population pressure. The difficult terrain conditionprevails smooth running of lives, however, we may have to exploit the potentiality. Since the rangeof agro-ecological environments is within a very short distance, agriculture provides a plenty ofopportunities to diversify. We feel that there is no dearth of policies to guide or lead either it isa research or development activities, however, the main bottlenecks would be the implementationphase that often lack in terms of cash/kinds and human resources. Soil fertility management is nodoubt a priority area. Based on our experiences and looking at the farming systems, the integratednutrient management approach to improve the productivity of crops and maintain a soundenvironment would be a sustainable approach. There are few areas where research is lacking such asthe contribution to plant nutrient from the various sources and need to quantify and measure thedeficit. However, dissemination and quicker adoption of soil fertility based technologies should be
55
the priority issues. For that we may have to improve the capability of personnel’s involved inresearch and development.
Acknowledgements
The authors are highly grateful to the Executive Director Dr Ram Pratap Sah for nominating the firstauthor to attend the workshop and encouragement to write the paper. Dr S.L. Maskey, Director forCrops and Horticulture Research and Mr S.B. Pandey, Director for Planning and Coordination,Nepal Agricultural Research Council are thankful for their suggestion and valuable criticism toimprove the content of the paper. We would also like thank the FAO Rome for giving usopportunities to attend the workshop and share our experiences in the field of plant nutrientmanagement as well as for financial support. Colleagues of Soil Science Division Mrs ShantiBhattarai, Mr S.K. Rai, Dr J. Tuladhar and Mr P. Sharma are also duly knowledge for their valuableinputs for preparing the paper.
References
A.P.P. (1995). Nepal Agriculture Perspective Plan (Main Report), HMG/N, APROSC, John MellorAssociates Inc. Washington D.C.
Bhattarai, S. and S.L. Maskey (1987). Use and Promotion of Bacterial fertilizer for legumes in Nepal.Proceedings of the first review and working group meeting on biofertilizers November, 15 to 16,pp. 199-205.
Bhattarai, S., S.L. Maskey, S.K. Gami, and R.K. Shrestha (2000). Environmental Friendly IntegratedPlant Nutrient Management for Sustainable Agriculture in Nepal. Training Manual on IPNMS. SoilScience Division, Khumaltar, Lalitpur.
Carson, B. (1992). The Land, the Farmer, and the Future: A Soil Fertility Management Strategy for Nepal.ICIMOD Paper No 1. Kathmandu, Nepal.
Gardner, R., K. Thapa, and R. Tripathi (1995). Soil Erosion From Overland flow on Hill slope. Land Use,Soil Conservation and Water Resources Management in the Nepal Middle Hills, Institute ofHydrology and Royal Geographycal Society, Nepal Agricultural Research Council (NARC),pp. 11.1 to 11.60.
Gardner, R., K. Mawdesley, B.P. Tripathi, S. Gaskin, and S. Adams (2000). Soil Erosion and NutrientLoss in the Middle Hills of Nepal. ARS Lumle, Soil Science Division (NARC), Queen Mary andWestfield college, University of London, UK.
Ghani, A. and M.W. Brown (1997). Improvement of Soil Fertility in Nepal Through Balanced Applicationof Fertilizer, Land Management Group, AgResearch, Raukura Agricultural Research Centre,Hamilton, NEWZEALAND.
Gregory, P.J. (1995). Soil Fertility Strategy: Report of a consultancy Visit by Prof. P.J. Gregory, for NRI,The University of Reading, Department of Soil Science, UK.
Joshy, D. and G.P. Deo (1976). Fertilizers Recommendations for Major crops of Nepal. Division of SoilScience and Agricultural Chemistry, Department of Agriculture, HMG/Nepal.
Karki, K.B. (2004). Improvement of Animal Dung, Biogas, Environment and Soil Fertility. Proceedings5th National Animal Science Convention Livestock development for Socio-economic empowermentorganized by NASA pp. 241-246.
Karki, K.B., Tuladhar, J., Uprety, R., and S.L. Maskey (2004). Distribution of plant availablemicronutrients in different ecological regions of Nepal. The paper presented at the InternationalWorkshop on Micronutrient in Southeast Asia held on September 8-11, 2004 in Kathmandu.

56
Karki, K.B. and J.B. Dacayo 1990. Assessment of Land Degradation in Southern Lalitpur of Nepal. Proc.14th Congress of International Society of Soil Science, Kyoto, Japan, August 12-19, 1991.
Maskey, R.B. (2001). Options for Sustainable Land Management in the Mid hills of Nepal: Experiencesof Testing and Demonstration of Contour Hedgerow Intercropping Technology. In: Tang Ya andP.M. Tulachan (eds.) Proceedings of an International Symposium held May 21 to 24, 2001 inKathmandu, pp. 79-84.
Maskey, S.L., R.K., Shrestha, B. Shrestha and Five others (2000). Strategies for Soil Fertility Research inthe hills of Nepal, Soil Science Division, Nepal Agric. Research Council (NARC), Khumaltar,Lalitpur, Nepal.
MoAC (2005). Statistical Information on Nepalese Agriculture (Time Series Information), Ministry ofAgriculture and Cooperatives, Agri-Business Promotion and Statistics Division, Agri StatisticSection, Singhdurbar, Kathmandu, Nepal, June 2005.
Pandey, P.R., S.P. Pandey and Y.G. Khadka (1998). Long-term Effect of Organic and Inorganic Fertilizerson rice-wheat system in Rainfed Low Land Condition of Khumaltar In: S.L. Masket et al., (eds.)Proceedings of First National Workshop on Long-term Soil Fertility Experiments fromAugust 11-13, 1998 and organized by Soil Science Division, NARC, pp. 116 to 134.
Pandey, S.P. (2000). Current Soil Fertility Management Recommendations, Constraints and Opportunitiesfor maize based Cropping systems in the hills of Nepal. In: B.P. Tripathi et al. (eds.) Proceedings ofa working group meeting of the Hill Maize Research Project Lumle3, Nepal August 16-18,CIMMYT, SDC and NARC. pp. 55-60.
Pandey, S.P. and D. Joshy (2000). Fertilizer Consumption and Food Grain Production in Nepal: (1965/66-1995/96), Soil Science Division, Nepal Agricultural Research Council (NARC), ISBN: 99933-557-0-4, Lalitpur, Khumaltar.
Pariyar, D. (2002). Agri-silvipastoral approach in Rehabilitation of the Degraded land and PovertyAlleviation. In: Wangdi et al., (eds.) Proceedings of the Fifth Meeting of Temperate Asia Pastureand Fodder Network held at RNRRC, Bajo, Bhutan from April 29 to May 4, 2002, pp. 102 to 110.
Pilbeam, C.J., B.P. Tripathi, D.P. Sherchan, P.J. Gregory and J. Gaunt (2000). Nitrogen balances forHouseholds in the mid hills of Nepal. Agriculture Ecosystems and Environment 79: 61-72.
Regmi, A.P. (1998). Long-term soil fertility Experiment on the Rice-wheat system at Bhairahawa In:Proceedings of First National Workshop on Long-term Soil Fertility Experiments, August 11-13,1998 pp. 85-94.
Sherchan, D.P. (1989). Review of work carried out on manure, fertilizers and biofertilizers since 1975 atPakhribas Agricultural Centre, PAC Working Paper No. 3, Dhankuta Nepal.
Sherchan, D.P., C.J. Pilbeam and P.J. Gregory (1999). Response of Wheat-rice and maize/millet systems tofertilizer and manure applications in the mid hills of Nepal. Experimental Agriculture Vol. 35,pp. 1-13.
Sherchand, L. and D. Pariyar (2005). Pasture, forage and Agro-forestry Technologies and TheirDissemination Status in Nepal. Paper presented at the Sixth National Outreach Workshop 2002,organized by Nepal Agricultural Research Council (NARC), Kathmandu, Asar 20, 2005.
SSMP (2004). Assessment of Sustainable Soil Management Activities by Farmers and CollaboratingInstitutions Experiences with Projects from 1999 to 2002 (First phase), Lalitpur, Pulchok,Kathmandu.
Shah, P.B. and H. Schreier 1991. Workshop in issues in soil fertility and erosion in the Middle mountainof Nepal. Workshop proceedings, Jhikhu Khola watershed, ISS/IDRC/UBC, Vancouver, Canada.1-2.

57
Shrestha, D.B., J.A. Zinck and E. Van Ranst. 2005. Modeling land degradation in the Nepalese Himalaya,Catena 59: 173-186.
Tripathi, B.P. (2001). Enhancement of Fertility and Crop Productivity for Acidic Soils in the Hills ofNepal. Lumle Technical Paper No. 2001/2, Agriculture Research Station, Lumle P.O. Box 1,Pokhara, Nepal.
Tripathi, B.P. (1998). An Overview on long-term effects of organic and inorganic fertilizers on crop yieldand soil properties in the eastern hills. In: Proceedings of First National Workshop on Lon-term SoilExperiment, August 11-13, 1998, pp. 182-197.
Turton, C.N., J. Tuladhar, A. Vaidy, J. Tuladhar, and K.D. Joshi (1995). Towards sustainable soil fertilitymanagement in the hills of Nepal, Lumle Agricultural Research Centre, P.O. Box 1, Pokhara, Nepal.
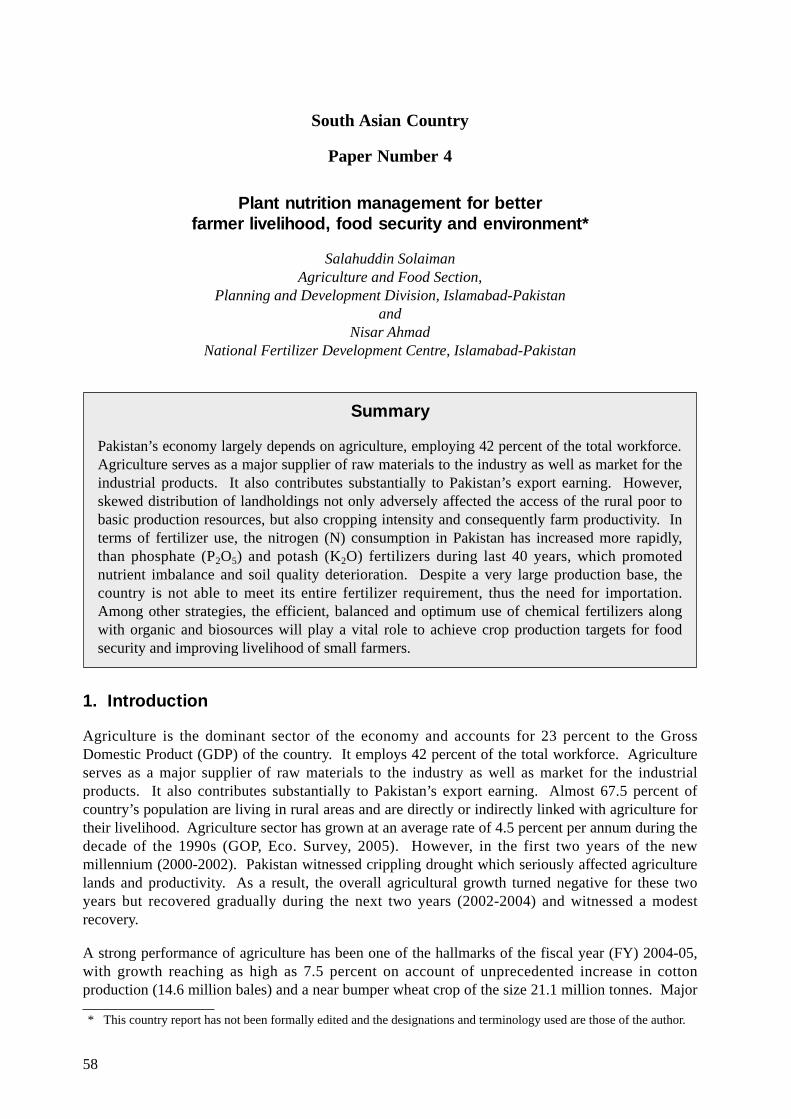
58
South Asian Country
Paper Number 4
Plant nutrition management for betterfarmer livelihood, food security and environment*
Salahuddin SolaimanAgriculture and Food Section,
Planning and Development Division, Islamabad-Pakistanand
Nisar AhmadNational Fertilizer Development Centre, Islamabad-Pakistan
Summary
Pakistan’s economy largely depends on agriculture, employing 42 percent of the total workforce.Agriculture serves as a major supplier of raw materials to the industry as well as market for theindustrial products. It also contributes substantially to Pakistan’s export earning. However,skewed distribution of landholdings not only adversely affected the access of the rural poor tobasic production resources, but also cropping intensity and consequently farm productivity. Interms of fertilizer use, the nitrogen (N) consumption in Pakistan has increased more rapidly,than phosphate (P2O5) and potash (K2O) fertilizers during last 40 years, which promotednutrient imbalance and soil quality deterioration. Despite a very large production base, thecountry is not able to meet its entire fertilizer requirement, thus the need for importation.Among other strategies, the efficient, balanced and optimum use of chemical fertilizers alongwith organic and biosources will play a vital role to achieve crop production targets for foodsecurity and improving livelihood of small farmers.
1. Introduction
Agriculture is the dominant sector of the economy and accounts for 23 percent to the GrossDomestic Product (GDP) of the country. It employs 42 percent of the total workforce. Agricultureserves as a major supplier of raw materials to the industry as well as market for the industrialproducts. It also contributes substantially to Pakistan’s export earning. Almost 67.5 percent ofcountry’s population are living in rural areas and are directly or indirectly linked with agriculture fortheir livelihood. Agriculture sector has grown at an average rate of 4.5 percent per annum during thedecade of the 1990s (GOP, Eco. Survey, 2005). However, in the first two years of the newmillennium (2000-2002). Pakistan witnessed crippling drought which seriously affected agriculturelands and productivity. As a result, the overall agricultural growth turned negative for these twoyears but recovered gradually during the next two years (2002-2004) and witnessed a modestrecovery.
A strong performance of agriculture has been one of the hallmarks of the fiscal year (FY) 2004-05,with growth reaching as high as 7.5 percent on account of unprecedented increase in cottonproduction (14.6 million bales) and a near bumper wheat crop of the size 21.1 million tonnes. Major
* This country report has not been formally edited and the designations and terminology used are those of the author.

59
crops account for 37.1 percent of agricultural value added, minor crops 12 percent and livestock46.8 percent.
Greater reliance is placed in achieving higher per unit production within a water constrainedenvironment. Another dimension to the whole scenario of agriculture performance is the climaticchange that to a great extent will determine the type, magnitude and productivity of Pakistan’sagriculture. The economics and technical feasibility of high input-output agriculture will come totest when all these emerging trends are taken into account simultaneously. Besides availability ofwater, the other factors hampering growth of sector are low productivity, inefficient use of water,degradation of land resources, ineffective transfer of technology and inefficient and unbalanced useof fertilizers.
The current population of the country is about 153 million, increasing at 1.87 percent per annum. Atthis trend total population will reach 167 million by year 2011 and 194 million by 2020 (NIPS,2005). Thus the main objectives of agriculture in the medium term development framework (MTDF,2005-2010) is to achieve self-reliance in agriculture commodities, ensure food security and maintainaverage annual growth rate of 5.2 percent per annum. Among other strategies, the efficient, balancedand optimum use of chemical fertilizers along with organic and biosources will play a vital role toachieve crop production targets for food security and improving livelihood of small farmers.
2. Small farmers’ livelihood in Pakistan
Despite all developmental efforts, Pakistan is facing many difficult challenges. One third of thepopulation still lives below the poverty line. The literacy rate is about 54 percent, access to qualityeducation is limited, income and regional inequalities are widespread, skill shortages are taking a tollin the economy’s productivity including agriculture. Based on the last Pakistan IntegratedHousehold Economic Survey (PIHES) 2000-2001, the official poverty line is estimated at Rs.748consumption expenditure per month per capita. Poverty estimates based on official poverty linesuggest that the poor accounted for 32.1 percent of Pakistan’s population in 2000-2001. Povertyestimates show a higher incidence of poverty in Pakistan’s rural areas. In 2000-2001, rural andurban poverty is estimated at 38.99 percent and 22.67 percent, respectively. The Government ofPakistan has set a target for reducing the poverty up to 21 percent by 2009-2010 and 13 percent bythe end of 2015. (Pakistan Millennium Development Goals 2005, Government of Pakistan).
Among all poor communities in Pakistan, the farmers and particularly small farmers are at worst intheir livelihood. They are deprived of most of the basic facilities. The reasons for miserability ofsmall farmers are having less land holding and consequently low income, in spite of getting thehigher productivity.
The most serious inequities at present exist in the rural areas mainly because of the pattern of landownership. Despite three land reforms (in 1959, 1972 and 1977), the land distribution in Pakistan ismuch skewed. The skewed distribution of landholdings has not only adversely affected the access ofthe rural poor to basic production resources, but also cropping intensity and consequently farmproductivity. Farms less than 5 hectare in size account for about 85.7 percent of farmers’ ownedonly 43.4 percent of the total farm area. On the other hand, large farmers of more than 10 hectarecomprised only 5.5 percent of all farmers account for 37.5 percent of the total farm area (Table 1).
This basic inequity in land holdings is clearly reflected in the differences in their respectiveeconomic and social positions as in the case in other economic sectors. The larger landowners havemore access to water, credit, fertilizer and other resources.

60
In contrast to this situation, when input use, particularly fertilizers and aggregate productivity atnational level is viewed with respect to farm size, an inverse relationship is quite evident. Fertilizeruse adoption by farm size is higher in small farmers in comparison to large farmers. It was foundthat small farms’ aggregate productivity in term of gross output value per cultivated hectare washigher (Fertilizer Use Survey at Farm Level in Pakistan, NFDC – March 2000).
Despite high use of inputs and better productivity the small farmers have little surplus to market andfarm income not sufficient to sustain livelihood. There is need to diversify and tap other sources ofincome other than crop sector such as livestock, etc. Most of the small farmers are unable to use thefacility of concessional credit because of cumbersome procedures for transacting a bank loan. Evenwithin the small farmer category there is a case for improving the condition of the poorest of thepoor.
3. Soil fertility status
The cultivated soils are calcareous and alkaline with pH 7.0 to 8.5. The data generated by public andprivate sector research organizations in the country reflect the general agreement about thedeficiency of nitrogen (N) in all the soils. In case of phosphorus (P) more than 90 percent soils haveinadequate soil phosphorus or can be called deficient. In case of potassium, the picture is not asclear as in case of N and P. The reports state the deficiency of potassium (K) exist up to 40 percentin soils, but crop responses to K are erratic and potash use is negligible. Among micronutrients,field-scale deficiencies of economic significance prevail in case of Zn, B, and Fe. The organicmatter content of the majority of cultivated lands averages around 0.5 percent. About 84 percent soilsamples analysed have shown that organic matter content is very low (Ahmed and Rashid, 2003).
4. Fertility supply
4.1 Domestic production
There are 14 fertilizer plants in the country. Of these, 8 are Urea plants, 2 of single superphosphate(SSP) and one each of Calcium Ammonium Nitrate (CAN), Nitrophos (NP), DiammoniumPhosphate (DAP) and NPK. The present fertilizer production capacity and actual production isgiven in Table 2. Urea plants have performed well, producing 110.6 percent of capacity during2004-05.
Table 1. Land distribution by farm size
Size of Farm % of total % of total % of Farmin hectare No. of Farms Farm Area Area cultivated
<2 57.6 15.5 93
2-<5 28.1 27.9 89
Sub-total 85.7 43.45-<10 8.8 19.1 83
Sub-total 8.8 19.110-<20 3.9 16.3 78
20-<60 1.4 13.0 67
>60 0.2 8.2 52
Sub-total 5.5 37.5Total 100 100
Source: Pakistan Agriculture Census 2000.
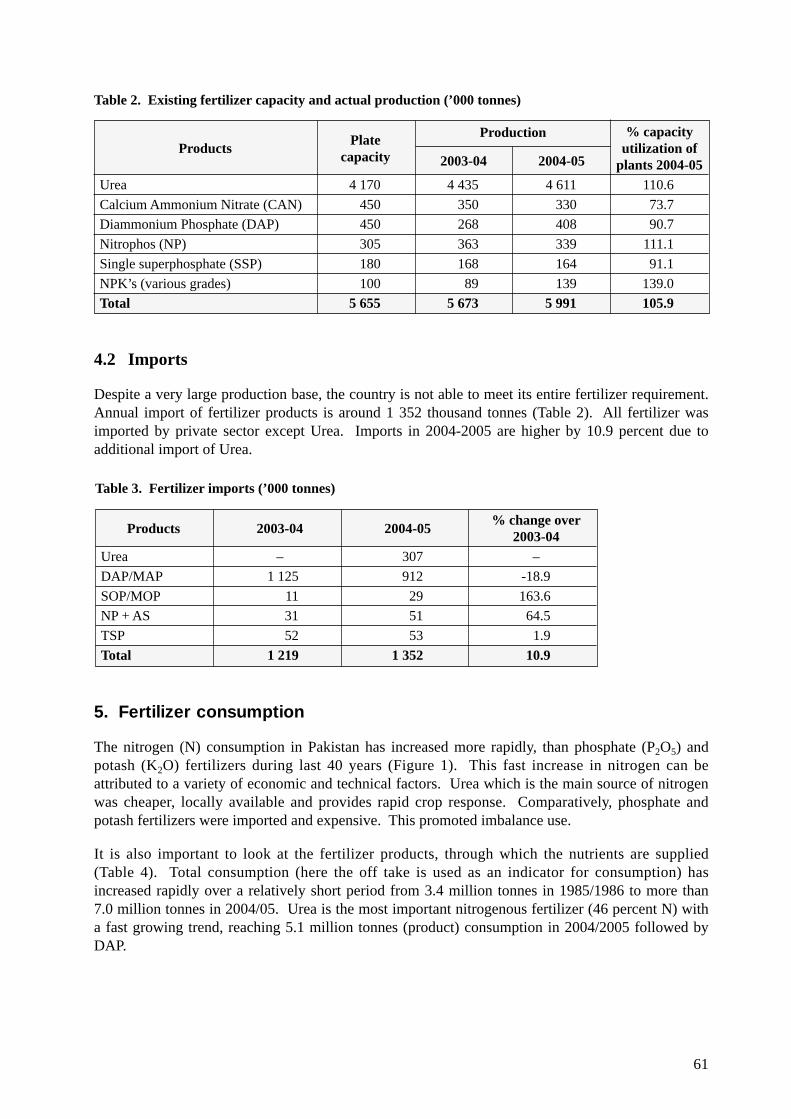
61
4.2 Imports
Despite a very large production base, the country is not able to meet its entire fertilizer requirement.Annual import of fertilizer products is around 1 352 thousand tonnes (Table 2). All fertilizer wasimported by private sector except Urea. Imports in 2004-2005 are higher by 10.9 percent due toadditional import of Urea.
Table 2. Existing fertilizer capacity and actual production (’000 tonnes)
Plate% capacity
Productscapacity 2003-04 2004-05
utilization ofplants 2004-05
Urea 4 170 4 435 4 611 110.6
Calcium Ammonium Nitrate (CAN) 450 350 330 73.7
Diammonium Phosphate (DAP) 450 268 408 90.7
Nitrophos (NP) 305 363 339 111.1
Single superphosphate (SSP) 180 168 164 91.1
NPK’s (various grades) 100 89 139 139.0
Total 5 655 5 673 5 991 105.9
Production
Table 3. Fertilizer imports (’000 tonnes)
Products 2003-04 2004-05% change over
2003-04Urea – 307 –
DAP/MAP 1 125 912 -18.9
SOP/MOP 11 29 163.6
NP + AS 31 51 64.5
TSP 52 53 1.9
Total 1 219 1 352 10.9
5. Fertilizer consumption
The nitrogen (N) consumption in Pakistan has increased more rapidly, than phosphate (P2O5) andpotash (K2O) fertilizers during last 40 years (Figure 1). This fast increase in nitrogen can beattributed to a variety of economic and technical factors. Urea which is the main source of nitrogenwas cheaper, locally available and provides rapid crop response. Comparatively, phosphate andpotash fertilizers were imported and expensive. This promoted imbalance use.
It is also important to look at the fertilizer products, through which the nutrients are supplied(Table 4). Total consumption (here the off take is used as an indicator for consumption) hasincreased rapidly over a relatively short period from 3.4 million tonnes in 1985/1986 to more than7.0 million tonnes in 2004/05. Urea is the most important nitrogenous fertilizer (46 percent N) witha fast growing trend, reaching 5.1 million tonnes (product) consumption in 2004/2005 followed byDAP.

62
Figure 1. Total fertilizer nutrient consumption in Pakistan
0
250
500
750
1 000
1 250
1 500
1 750
2 000
2 250
2 500
2 750
3 000
1966
/67
1968
/69
1970
/71
1972
/73
1974
/75
1976
/77
1978
/79
1980
-81
1982
-83
1984
-85
1986
-87
1988
-89
1990
-91
1992
-93
1994
-95
1996
-97
1998
-99
2000
-01
2002
-03
2004
-05
Nitrogen
Phosphate
Potash
Table 4. Fertilizer off take (equals consumption) by products in ’000 tonnes
1984-85 1994-95 2004-05UREA 1 429 3 152 5 120
CAN 72 304 330
AS 106 84 1
SSP 375 207 161
DAP 366 673 1 377
NP 35 301 354
TSP 44 22 91
SOP + MOP 44 27 25
NPKs 14 14 129
Total 2 485 4 783 7 589
Source: NFDC, 2005.
5.1 Consumption per hectare of cropped area
The application of plant nutrients per hectare of cropped land gives an indication of theintensification of agricultural production. Increase in arable land has been very marginal due to thenatural limitations and conditions. Increase in agricultural production had to be achieved throughhigher yields per hectare. One of the underlying factors was steady increase from a level of about20 kg/ha in early 1970’s to 161 kg/ha in 2004-2005. The increase in total application can beattributed largely to nitrogen, and to a lesser degree of phosphates (Figure 2).
The development in fertilizer consumption can be seen as a success. But what has been of concern isthe fact that only the consumption of N has increased, leaving the use of other nutrients at a very lowlevel. Since crops take the necessary nutrients mainly from soil resources, a depletion of these

63
reserves could be termed as soil mining. In the long run, a decrease in soil fertility with additionalnegative effects on the environment is to be expected. Table 5 indicates the extent of stagnation inimbalance which has stayed over the past years. Balanced crop nutrition requires the proper supplyof N, P and K plus other nutrients such as sulphur and micronutrients (Zn, B, Fe), as determined bysoil analysis.
The fertilizer consumption has grown at compound rate of 4.2 percent per annum, whereas growth inmajor crops was less than 2 percent. The N:P2O5 ratio did not change during the past 20 years. Theapplication of potash was negligible.
Source: NFDC, 2004/05.
Figure 2. Application rate in kg per ha nutrients
0
20
40
60
80
100
120
140
160
180
1972
-73
1974
-75
1976
-77
1978
-79
1980
-81
1982
-83
1984
-85
1986
-87
1988
-89
1990
-91
1992
-93
1994
-95
1996
-97
1998
-99
2000
-01
2002
-03
2004
-05
(Kg
nutr
ient
per
ha)
N
P2O5
K2O
NPK
Table 5. Fertilizer use and crop yields
YearCrop Yields kg/ha
Wheat Rice Cotton Sugarcane1985/86 75 3.2 1 881 1 567 515 35 700
1990/91 87 3.8 1 841 1 546 615 40 700
1995/96 111 4.0 2 018 1 835 601 47 000
2000/01 134 3.3 2 325 2 021 624 45 400
2004/05 161 3.2 2 540 1 995 769 48 000
Growth % 4.2 1.59 1.28 2.13 1.57
Source: NFDC, 2004/05.
Fertilizer use N:P(kg/ha) ratio
5.2 Impacts of balanced fertilizer use
Balanced fertilizer use is a key for efficiency and crop productivity. The comparison of yield formajor crops obtained from current farmer’s practices of fertilizer use and with balanced mix is givenin Table 6.

64
Thus, the present yield obtained by farmers is about 40-70 percent of that which can be obtainedwith recommended rates and balance use. It is, therefore, important to correct the balance.
6. Fertilizer demand
The quantum of fertilizer growth will depend upon water availability, and any increase in area andcommodity prices received by farmers. In the next five years Urea imports may reach 1.4 milliontonnes if no new capacity is added and DAP imports will be 1.6 million tonnes (Table 7). Theproposal for BMR in the existing Urea plants and new investment is under consideration subject toavailability of gas. However, it appears Urea and DAP imports will continue in the next 3-4 years.
Table 6. Crop yield comparison with current farmers’ practices of fertilizer use vs obtained withbalanced recommended level (kg/ha)
Sr.Crop
Yield obtained with balanced
No.fertilizer level
Trials Yield1 Wheat Irrigated 2 536 99 4 043 60
2 Wheat Rainfed 1 027 24 2 631 39
3 Rice IRRI 2 625 11 4 946 53
4 Rice (fine) 1 611 25 3 837 42
5 Cotton 1 773 25 2 400 74
6 Sugarcane 48 366 5 101 125 48
7 Maize 1 876 12 4 656 40
Source: Joint trials of FAO/NFDC/IMPHOS/Provinces.
Yield farmer’spractices Av.
of 3 years
% Yieldobtained
Table 7. Future demand forecast (’000 tonnes)
YearUrea DAP/MAP
Supply/Demand
Deficit or Supply/Demand
Deficit orproduction imports production imports
2004-05 (Actual) 4 797 5 120 -323 760 1 485 -725
2005-06 4 600 5 299 -699 450 1 589 -1 139
2006-07 4 600 5 485 -885 450 1 700 -1 250
2007-08 4 600 5 649 -1 049 450 1 819 -1 369
2008-09 4 600 5 819 -1 219 450 1 947 -1 497
2009-10 4 600 5 993 -1 393 450 2 083 -1 633
Growth % 3.2 7.0
Note: Supply contains domestic production + inventory of last year.i) Urea production capacity is 4 170 thousand tonnes but producing about 4 600 thousand tonnes annually
due to around the year availability of gas.ii) BMRE of FFBL 264 thousand tonnes expected in 2007.
iii) New Plant of Fatima and BMRE of Pak Arab is expected in 2009.iv) Engro has also plan for new plant.

65
7. Soil nutrient balance and flow analysis
A nutrient balance sheet gives the net changes in the crop environment over a given period: a season,a year, or longer. It is constructed by placing together all the additions to the crop environment andall the removals from that environment in the period studied. A comparison of additions andremovals gives the nutrients balance. If the balance is positive it indicates that the crops produced,together with other removals are not depleting the soil. However, an excessive positive balance mayrepresent over-fertilization, a waste of nutrients.
Negative balance means that the nutrients provided from all sources are not sufficient to support crop(and other) nutrient removal and therefore usually represent a drain on the soil. Repeated negativebalances lead to real soil depletion to the point where crop yields decline. In such situation,restoration of soil fertility is indeed difficult.
Crops remove quantities of all nutrients, including the secondary and micronutrients, but additionsoften do not supply the whole range. In Pakistan, the two principal fertilizers Urea and DAP do notprovide appreciable quantities of any nutrients other than N and P2O5. Farmyard Manure (FYM)contributes all nutrients to some extent. The green manure and biological sources only introduces Nfrom external sources (air); all else comes from the soil. The balance sheet works out on theseassumption: (FAO, 1996).
Additions to soil Removals from soilFertilizers Crop nutrient content exportedFYM VolatilizationBNF by legumes DenitrificationNutrient in irrigation water LeachingRain and thunderstorms Fixation of PhosphateAir Water erosionDustFlood watersFlood silt
The present report considers fertilizer application to be reflected in off take data. FYM data areestimates based on limited livestock surveys, estimated FYM proportion (25 percent) recovered formanure (and not fuel or lost), dung and urine production. BNF has been calculated from measuredN fixation by pulses, and the figure doubled to account for berseem clover, for which no N fixationdata were found.
Irrigation water is an important aspect of crop nutrition in Pakistan, as it is actually a dilute solutionof cations and anions. The K contribution in normal irrigation is substantial, overestimates of Ksupply, particularly when groundwater is major source.
Crop production figures were used to calculate nutrient removals in Pakistan. This is because allcrop residues are normally used for animal feed, fuel, house roofing and other purposes. The set ofconventional uptake efficiency percentages used in the calculations are set out below (FAO, 1998):
Normal (lower or “B”) Higher (upper or “A”)N P2O5 K2O N P2O5 K2O40 20 65 60 30 85
Based on these assumptions at national level there is negative balance of about 18 kg N, 25 kg P2O5
and 50 kg K2O per ha. However, if data are further disaggregated there is positive balance of N in

66
cotton zone. However, trend shows that depleting of soil is continuing despite improvement infertilizer use.
8. Integrated Plant Nutrient Management (IPNM) concept
The basic concept underlying the principle of Integrated Plant Nutrient Management (IPNM) is themaintenance and possibly increase of soil fertility for sustaining increased crop productivity throughoptimizing of all possible sources, organic and inorganic, of plant nutrients required for crop growthand quality in an integrated manner appropriate to each cropping systems and farming situationwithin its ecological social and economic possibilities (FAO, 1995; Tandon and Roy, 2004).
Integrated Plant Nutrition System is a conceptual approach and is imbedded on a philosophy ofsocial, economical, environmental and technological considerations, while Integrated Plant NutrientManagement (IPNM) is actually the technical and managerial aspects of achieving the objectives ofIPNS under farm situation. Soil fertility improvement following the IPNS approaches will:
● Raise soil productivity and food production, and will ensure food security at local level;
● Enhance resilience of the land to erosion and degradation;
● Enhance soil and agrobiodiversity;
● Enhance soil capacity to sequestrate carbon and mitigate the effect of climate change; and
● Ensure prosperity and healthy environment for the future generation. (Roy, 2000)
9. Components and technology
Agricultural research contributes towards component and technologies governing principle of cropproduction and of plant nutrition. Field research fills gaps and generates knowledge which istranslated into extension messages and disseminated to farmers. The main components of integratedplant nutrient management are (i) soil (ii) balance and efficient use of mineral fertilizers (iii) organicfertilizer sources (iv) green manures (v) biofertilizers, and (vi) industrial waste and city garbage.These are briefly discussed in the follow up sections with their relevance to Pakistan conditions.
9.1 Soil resources
Soil supplies all the known essential plant nutrients. However, due to crop intensification andcultivation of soils over the years there is continuous mining of the essential plant nutrients from thesoil. Most of the soils in Pakistan have poor status of available plant nutrients and can not supplyoptimum level for crop productivity. Soil fertility is depleting due to mining of essential plantnutrients. However, through good tilth and physical condition of soil, the nutrient availability can beimproved.
9.2 Chemical fertilizers
Balance and adequate use of chemical fertilizers is very important component of technology. It hasbeen discussed in detail in Section 5.0.
9.3 Farmyard Manure (FYM)
FYM consists of materials collected from animal droppings, beddings, and domestic sweep. Thevalue of animal manures has been recognized since ancient times. Based on number of animals, the

67
estimated contribution is shown in Table 8. However, it may be stated that about 50 percent ofanimal dropping is not collected. Of the collected about 50 percent is used as fuel. Thus, nutrientsrecycled to crops are about 1/4th of the total droppings.
9.4 Green manures
Green manuring with N-fixing leguminous crops improves soil fertility (Buresh et al., 1993) andenhances availability of other nutrients (Hundal et al., 1988; Nagarajah et al; 1989). The prominentcropping systems in Pakistan are:
i) Rice-wheat
ii) Cotton-wheat
iii) Mixed cropping (sugarcane-maize-wheat-cotton)
iv) Oilseed-pulses-wheat
The three cropping systems i) rice-wheat, ii) cotton-wheat and iii) mixed cropping are veryexhaustive. The cropping intensity is over 150 percent. The use of only nitrogenous and phosphaticfertilizers is causing potash, sulphur and micronutrient deficiencies restricting the yield potential.The sandwiching of green manuring crops in these tight cropping patterns is considered not only anexcellent source of nitrogen, but the intervention improves physical condition of soil and availabilityof other nutrients. The studies have shown that the contribution of green manure legumes was quitehigh at low level of nitrogen application through fertilizers and dropped with increase in rates(RRI, 1998; Mian et al., 1988 and Bhatti et al., 1985). The studies of pre-rice green manuring ofthree years showed a significant impact on yield of next wheat crop and reducing its N requirements.The studies further concluded that green manure production technology along with zero tillage(Conservation Agronomy) can benefit the exhaustive rice-wheat cropping system through N fertilizersaving and increase in grain yields (Mann, 2000, Zia et al., undated). Major green manure crops aredhaincha/jantar (Sesbania aculeatea) and guar (Cyamopsis tetragonolaba). However, trials on sunhemp (Crotalaria juncea) and tropical jantar (Sesbania rostrata) have also been conducted. Thenitrogen contribution from all these sources have been quantified from 70 to 100 kg/ha (Hussain,1996). In wheat-cotton system, there is generally no time for green manure except to try relaycropping. The farmers are also not prepared to sacrifice main crop.
Table 8. Livestock population, production of manure, and nutrient potential of manure in Pakistan
Animal No. of Droppings Urine Manure Total dry Total N Total Totalanimals (million moisture matter per year P2O5 K2O per(million tonnes (av. %) (million (’000 t) per year yearheads) per year) tonnes (’000 t) (’000 t)
per year)Cattle 23.77 208.3 103.6 79 43.7 1 159 477 1 242
Buffalo 26.15 267.0 134.2 79 56.1 1 492 611 1 600
Goat 59.15 33.1 21.5 65 11.6 595 204 512
Sheep 24.46 17.7 9.3 65 6.2 252 80 217
Poultry 357.18 8.1 0.0 54 3.7 120 68 31
Others 4.84 21.0 6.0 60 8.4 143 47 149
Total 495.55 555.2 274.6 129.7 3 761 1 213 3 049
Sources: (i) Livestock Census, 1996. (Figures modified/estimated for 2005). (ii) Hussain. 1996.

68
9.5 Crop residues
A huge quantity of crop residues such as wheat straw, cotton sticks, sugarcane trash/tops and ricehusk, etc., are available. But due to some economic compulsions such as need for animal fodder andfuel, the crop residues are partially recycled in the soil, or burned to clear field for next cropotherwise these may contribute in improving organic matter in the soil and thus keep it productive.Kallar grass is recognized as a salt tolerant grass capable of producing a good amount of biomass ondegraded soils in summer.
9.6 Filter cake and stillage
Pakistan sugar industry is producing about 1 million tonnes of filter cake every year, which is a richsource of organic matter, micro and macronutrients. Some sugar mills have molasses-baseddistillery plants, which produce stillage that contains nutrients especially potassium. The majorportion of filter cake is sold to the brick baking industry and stillage is drained out thus causing lossof plant nutrients and environmental pollution. If all these materials are recycled by compostingback to soil, it will provide essential plant nutrients for crop growth.
9.7 Sewage sludge, city garbage, industrial wastewater etc.
Sewage sludge, city garbage, industrial wastewater and effluents are also good source of plantnutrients. However, these materials require proper treatment to remove the toxic heavy metalsbefore application to crops. It is estimated that the urban areas of Pakistan generate about55 thousand tonnes of solid waste daily or about 20 million tonnes per annum (GOPa, 2005).However, this solid waste is not being properly managed and recycled for different useful purposesincluding pre-treatment and composting for crop nutrition. Sewage water is partially used for raisingvegetables near the urban areas without any pre-treatment. If adequate treatment of above wastematerials is managed before their application, they will not only supplement the chemical fertilizersbut the chance of environmental pollution will also be minimized.
9.8 Biofertilizers
A broad term used for products (carrier or liquid based) containing living or dormant microorganismslike bacteria, fungi, actinomycetes, algae alone or in combination which on application help in fixingatmospheric nitrogen or solubilise/mobilize soil nutrients in addition to secretion of growthpromoting substances for enhancing crop growth. ‘Bio’ means living and ‘fertilizer ’ meansa product which provide nutrients in usable form. Biofertilizers are also known as bio-inoculants ormicrobial cultures. Biofertilizers can be broadly classified into four categories.
● Nitrogen fixing biofertilizers: (Thizobium, Azotobacter, Azospirillum, Acetobacter BGA,Azolla)
● Phosphorus solubilising/mobilising biofertilizers (PSB or PSM): (P-solubilisinge.g. Bacillus Pseudomonas, Aspergillus etc. P-mobiliser e.g. VA-mycorrhiza).
● Composting accelerators (i) Cellulolytic (Trichoderma), (ii) Lignolytic (Humicola). Plantgrowth promoting rhizobacteria: (Species of Pseudomonas).
The Pakistan Agriculture Research Council (PARC), National Institute of Biotechnology and GeneticEngineering (NIBGE) and Provincial Agricultural Research Institutes are carrying out work onbiological fertilization. All these institutions are isolating strains of rhizospheric bacteria, whichhave potential for mobilizing atmospheric N, both on legumes and non-legumes. In greenhouse,

69
field and laboratory studies, effective microorganisms, in combination with NPK, green manure andFYM, have been shown to give yield responses of 18.3 percent in rice and 39 percent in wheat.Significant responses have also been reported in maize, peas and potatoes. NARC in collaborationwith Engro Chemical Pakistan Limited (ECPL) commercialized rhizobium specific for chickpea inthe name of Biozot. One packet of 500 gms was sold at Rs.50 to farmers. The project continued forthree years (1996 to 1998) covering an area of one thousand acre each year. On the average, yieldimprovement of 25-40 percent was recorded (personal communication with Biological Section).However, it could not sustain.
At NIBGE, isolates were tested for their ability to produce indole acetic acid (IAA) in therhizosphere and it was found that certain Pseudomonas spp. were most active. IAA, like 2:4D, canproduce nodule-like excrescence on wheat roots and has been shown to mobilize atmospheric Nthereby. Thus the prospects of providing partial N nutrition of wheat by inoculation of soil withisolates of Pseudomonas appear promising (Malik, et al., 1993). NIBGE based on its facilitiesincluding different capacity fermenters has already marketed its bio-fertilizer for rice under the namebiopower. This product has been used over 10 000 acres of rice growing areas, and response offarmers has been excellent (Malik, K.A., 1997). Rashid et al., 1998 at Ayub Agricultural ResearchInstitute reported that diazotroph bacterial inoculum increased wheat yield from 0 to 35 percent withlow to high nitrogen application.
NIBGE has also been carrying out experimentation with Azolla for rice nutrition. An earlierproblem, that Azolla would not survive the summer temperatures of Pakistan, has been overcome andthere are now several heat-tolerant strains available. Azolla has been combined with N fertilizer andrice rhizospheric diazotrophic bacteria in field trials, from which it was found that an Azolla coverwith 30 kg/ha N gave maximum rice yield, although biological nitrogen fixation (BNF) assisted inproviding N to the rice plants.
At PARC, another important biological fertilization study is being conducted on microorganisms,which solubilize soil P. It has been found that strains of Aspergillus niger and Penicillium spp. havesome solubilizing properties, not only in soil but also of P from rock phosphate.
At University of Agriculture, Faisalabad, Effective Microorganisms (EM) technology is beingadvocated, where claim has been made that this co-existing culture of five major types of beneficialmicroorganism has the potential to increase nutrient availability in the soil and thus cropproductivity. However, many scientists have expressed their reservations about the product due tobio-safety concerns and lack of scientific evidence.
10. Limitations in the adoption of IPNM
10.1 Package of technology
Technology has not been developed to suit different farms and farming systems. There is need ofcommitment at research extension and national level for bottom up participatory approach andleadership. More allocation of resources is required to develop state of art technology.
10.2 Low availability of FYM
Amount of FYM available for use in the field is low and insufficient for meeting the requirements ofcrops. Farmers lack proper knowledge about the preparation of FYM and composting. Most used asfuel. Alternate sources of energy are to be made available to farmers.

70
10.3 Limitations in use of green manuring
● Small size of holdings;
● High demand for fodder;
● Lack of proper knowledge about green manuring and legumes; and
● Lack of organized research
10.4 Limitation in use of crop residues
● The price of straw and stalks is very high and the farmers are not willing to leave cropresidues on the soil surface or incorporate into the soil as they fetch a good income fromstraw and stalks;
● Farmers dry crop residues and feed their cattle during winter when there is a shortage offodder;
● Farmers use crop residues as fuel energy source as they do not have access to other sourcesof energy;
● Crop residues are used as a construction material in mud houses or cattle sheds.
10.5 Limitation in use of biofertilizers
● Application techniques and efficiency of strain
● Packing the product in marketable form
● Shelf life
● Specified minimum population of concerned microbes
● Good quality
11. Conclusion
Integrated Plant Nutrient Management (IPNM) through balanced use of mineral fertilizers, combinedwith organics and biosources may usher into new era for sustainable crop production to achieve foodsecurity, improving livelihood of small farmers and poverty reduction. The combined use of allthese sources can lead to new green revolution. However, the national research institutions,universities, agriculture extension, private sector and government at policy level, all have to playtheir relevant role for technology development, its transfer and adoption at farm level in differentecological regions. The future approach will be to shift from increased use of fertilizer towardsoptimizing integrated management of all sources to address issues of low productivity, efficiency,soil nutrient depletion and environmental concerns. Government of Pakistan in Medium TermDevelopment Framework (MTDF/2005-10) has emphasized the importance of IPNM in fertilizer useand crop production strategies. It will get due attention at policy level.

71
References
Ahmad, N. and M. Rashid. 2003. Fertilizer and Their Use in Pakistan. Training Bulletin, third Edition,Islamabad.
Ahmad, N. 2000. Integrated Plant Nutrient Management in Pakistan: Status and opportunities. In: Proc.Integrated Plant Nutrient Management, NFDC, Islamabad pp. 18-39.
Ahmad, N. 2001. Integrated Plant Nutrient Management. Use of Inorganic and Organics: Status inPakistan. Paper presented at D-8 Workshop on “Promotion of Alternate/Organic Fertilizers” held inIslamabad, Pakistan, June 2001.
Bhatti, H.M., M. Yasin and M. Rashid. 1985. Evaluation of sesbania green manuring in rice-wheatrotation. In. Proc. Int. Symp. on Nitrogen and the Environment. P.275 NIAB, Faisalabad.
Chaudhry, T.M. 1985. Improvement of soil fertility. In. Proc. Int. Symp. on Nitrogen and the Environment.P.373, NIAB, Faisalabad.
FAO. 1985. Integrated Plant Nutrition Systems. FAO Fertilizer and Plant Nutrition Bulletin 12, Rome.
FAO. 1998. Plant Nutrition for Sustainable Agricultural Development in Pakistan. Main Report. MTF/PAK/003/FIA.
Government of Pakistan, 2005. Medium Term Development Framework 2005-2010. Planning Commission,Islamabad.
Government of Pakistan. (GOP). 2004. Agricultural Statistics of Pakistan, Economic Wing, Ministry ofFood, Agriculture and Livestock, Islamabad.
Government of Pakistan. (GOP). 2005. Pakistan Economic Survey. Economic Advisor’s Wing. FinanceDivision, Islamabad.
Government of Pakistan. (GOPa). 2005. Waste Management – taking the responsibility. Draft report2005, Ministry of Environment. Chapter-7.
Hussain, T. 1996. Manures and Organic Wastes. Soil Science. National Book Foundation, Islamabadpp. 387-403.
Ibrahim, M., N. Ahmed, A. Rashid and M. Saeed. 1992. Use of press-mud as source of phosphorus forsustainable agriculture. In. Proc. Symp. on Role of Phosphorus in Crop Production P.265. NFDC12/92.
Keerthisingha, G. et al., 2003. Plant nutrition: Challenges and Tasks ahead Conference, Rome, Italy,2003.
Lampe, S. 2000. Principles of integrated plant nutrition management system. In: Proc. Integrated PlantNutrient Management, NFDC, Islamabad pp. 3-17.
Maan, A.R., M. Sharif Zia and M. Salim. 2000. New dimensions in green manuring for sustainingproductivity of rice. In: Proc. Integrated Plant Nutrient Management, NFDC, Islamabad pp. 166-185.
Malik, K.A. 1997. Role of biofertilizers in sustainable crop productivity. Paper presented Training onEfficient and Bala of Fertilizers’. NFDC, Oct. 20-24, 1997.
Malik, K.A., G. Rasul, U. Hassan, S. Mehnaz and M. Ashraf. 1993. Proc. 6th Int. Symp. on N fixationwith non-leguminous. P.409 et. Seq. Ismailia.
Mian, et al., 1988. Fertilizer Use Efficiency in rice as influenced by organic manuring. Pak. J. of Soil Sci.3(1-2): 1-5.
Nagarajah, et al., 1989. Effect of sesbania azolla, and rice straw incorporation on kinetics of NH4, K, Fe,Mn, Zn and P in some flooded soils. Plant Soil. 116: 37-48.

72
NFDC. 1998b. Integrated Plant Nutrition Systems (IPNS): Combined Use of Organics and Inorganics.National Fertilizer Development Centre Publication 3/98.
NFDC. 2000. Fertilizer Use (1997-98) at Farm Level in Pakistan, Publication No.4/2000. Islamabad.
NFDC. 2005. Annual Fertilizer Review. Islamabad.
NFDC. 2005. Fertilizer Use Survey (2002-03). A micro-level assessment of Situation in Pakistan,Publication No. 2/2005. Islamabad.
NIPS. 2005. National Institute of Population Statistics, Pakistan.
Roy, R.N. 2000. Integrated Plant Nutrition Systems – Conceptual Overview. In: Proc. Integrated PlantNutrient Management, NFDC, Islamabad pp. 45-58.
RRI. 1988. Annual Report of Rice Research Institute (RRI), Kala Shah Kaku.
Tandon, H.L.S and R.N. Roy. 2004. Integrated Nutrient Management – A glossary of terms, FAO Romeand FDCO, Delhi.
Velayutham, M. undated. Integrated Plant Nutrition System – Key to soil Productivity Enhancement andSustainable agriculture Production. FAO regional office for Asia and the Pacific.
Wahhab, A; and T.M. Chaudhry. 1954. Role of legumes in improving soil fertility. Pak. J. Sci. Res. 6:37-44;48-51.
Zia et al., (undated). Sustaining productivity of rice-wheat system through integrated nutrient managementapproach (PARC).

73
South Asian Country
Paper Number 5
Improvement of plant nutrient management for better farmerlivelihood, food security and environment in Sri Lanka*
J.D.H. WijewardenaDepartment of Agriculture, Regional Agricultural Research &
Development Centre, Makandura, Gonawila, Sri Lanka
Summary
Sri Lanka is an agricultural country with diverse agro-climate and land resources. Agriculturalsoils are laterites which are generally acidic, low in organic matter and would require soundphosphorous management. Aside from low per capita land availability, soil fertility generallylimits crop production and would require considerable attention and support. However,fertilizers necessary for improving yields of food crops are imported. The total quantity offertilizer imported in 2002 was 568 072 mt. About 59 percent of this importation is Urea andthe rest are divided into other fertilizers such as sulphate of ammonia, triplesuperphosphate andmuriate of potash. Nutrient use imbalance and the general decline in soil fertility in Sri Langkais primarily policy-induced. The national government adopted a subsidy scheme for Urea,which inadvertently resulted in increased Urea consumption and the evident reduction in the useof P and K fertilizers. To alleviate to situation, the national government has taken steps tolocally produce phosphate fertilizers using local rock phosphate (eppawala rock phosphate). Inaddition, recently, to help farmers in adopting the rational use of Urea and general balance useof available organic and inorganic fertilizers the Ministry of Agriculture and the Department ofAgriculture developed a national policy for the promotion of Integrated Plant Nutrition System(IPNS) and its adoption by the farmers in Sri Lanka.
1. Introduction
Sri Lanka is an island which is situated in the Indian Ocean and lies between latitude 5o55' and9o50'N and longitude 79o42' and 81o53'E. The total land area of the island is 65 610 sq km.Population is estimated to be 20 million with an annual growth rate of 1.2 percent. The contributionto the gross domestic product (GDP) by agriculture is estimated to be 18.6 percent and employmentin the agriculture sector is 37.7 percent. Contribution to the GDP in the agriculture sector by rice is13.8 percent and other food crops 33.8 percent. Sri Lanka is divided into three major zones on thebasis of annual rainfall viz. wet (>2 000 mm), intermediate (1 000-2 000 mm) and dry (<1 000 mm)zones. The wet and intermediate zones are further categorized into low, mid and up-country regionsbased on elevation. The low country is situated at elevation between 0 and 300 m above mean sealevel (MSL), while midcountry is considered as the area between 300 m and 900 m elevation. Theup-country region is the area above 900 m elevation. Sri Lanka is generally described in terms of itsterrain as comprising of a central highland mass surrounded by undulating to flat plans. It can beobserved that about one third of the country is made up of hilly, mountainous or steep terrain.
* This country report has not been formally edited and the designations and terminology used are those of the author.

74
Three major agro-climatic regions, wet, intermediate and dry zone, are further sub divided into24 agro-ecological regions. According to the modern scheme of climatic zonation the wet zone ofSri Lanka falls within the humid tropics and the dry zone within the seasonally dry tropics. A smallsection in the northwest and southeast of the island falls within the semi-arid tropics. Four basictypes of rainfall, namely, monsoon, convectional, cyclonic and orographic, are identified in thecountry (Panabokke, 1996). There are two main cropping seasons namely “maha” (northeastmonsoon) – wet season from September to February and “yala” (southwest monsoon) – dry seasonfrom March to August. Due to availability of water, the “maha” is considered as the major croppingseason.
The main annual rainfall in Sri Lanka various from 2 500 to over 5 000 mm in the southwest of theisland, while in the northwest and southeast an annual rainfall is less than 1 250 mm. Rainfall overmost parts of the country follows a bimodal, seasonal pattern for the year. The minimum andmaximum air temperature various from 10 to 20oC in the Up-country Wet Zone (UCWZ) from 25 to32oC in Low Country Dry Zone (LCDZ). The regional differences in temperature are mainly due toattitude with the temperature falling about 1oC for every 150 m rise in elevation.
2. Soils
The major soil types in Sri Lanka are Lateritic soils, the Red Earths, and the Alluviums. They cover90 percent of Sri Lanka. The rest consisting saline soils and peat, are limited occurrence. Thirteengreat soil groups have been identified in Sri Lanka namely Rhodustalfs, Tropaqualfs, Haplustalf,Haplustox, Tropaquents, Natraqualfs, Ustipsamments, Quartzipsammets, Pellusterts, Eutropepts,Rhodudults, Tropudults and Tropohemists (Panabokke, 1996).
3. Food production
3.1 Rice
Rice has been cultivated in Sri Lanka for well over 2 000 years. Sri Lanka has 0.734 million ha ofrice lands (AgStat, 2004) of which 0.46 million ha (55 percent) are in the Low Country Dry Zone(LCDZ), 0.13 million ha (20 percent) in the low country intermediate zone (LCIZ), 9.14 million ha(25 percent) in the low country wet zone (LCWZ) and about 4.5 thousand ha are situated inup-country and midcountry areas. Rice cultivation accounts for a little more than 40 percent of thecultivated area. Presently, Sri Lanka produces 3.1 million tonnes of rough rice and national averageyield of 3.8 t/ha (CBSL, 2004). Domestic annual rice requirement in the year 2000 was 3.11 milliontonnes and it is estimated to be 3.46 million tonnes in the year 2010 (Abeysiriwardena andSandanayake, 2000). Rice is grown in diverse soil and environmental conditions in throughout thecountry. Rice is grown in almost all the grate soil groups and soil series found in Sri Lanka.
3.2 Vegetables
Approximately 60 000 ha of land is used for vegetable cultivation in Sri Lanka. (Maraikar et al.,1996). Vegetable crops grown in Sri Lanka could be divided into two major groups, the localvegetables and the low country vegetables. Popular low country vegetables are okra (Abelmoschusesculentus), eggplant (Solanum melongena), luffa (Luffa acutangula), snake gourds (Trichosanthescucumetina), bitter gourds (Momodica charantia), cucumber (Cucumis sativus), pumpkin (Cucurbitamaxima), and leafy vegetables, while, the exotic or up-country vegetables are bean (Phaseolusvulgaris), carrot (Daucus carota), beetroot (Beta vulgaris), cabbage (Brassica olerccea), leek(Allium ampeloprasum), and radish (Raphanus sativus). Low country vegetables are grown
-1
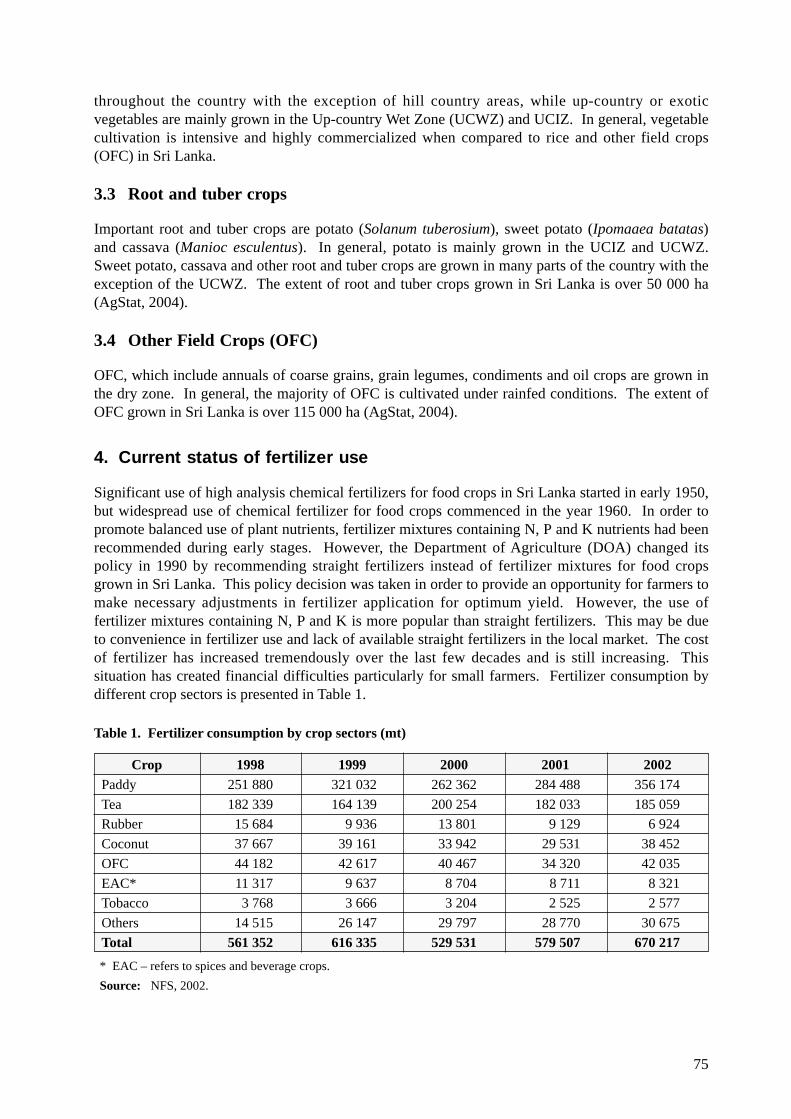
75
throughout the country with the exception of hill country areas, while up-country or exoticvegetables are mainly grown in the Up-country Wet Zone (UCWZ) and UCIZ. In general, vegetablecultivation is intensive and highly commercialized when compared to rice and other field crops(OFC) in Sri Lanka.
3.3 Root and tuber crops
Important root and tuber crops are potato (Solanum tuberosium), sweet potato (Ipomaaea batatas)and cassava (Manioc esculentus). In general, potato is mainly grown in the UCIZ and UCWZ.Sweet potato, cassava and other root and tuber crops are grown in many parts of the country with theexception of the UCWZ. The extent of root and tuber crops grown in Sri Lanka is over 50 000 ha(AgStat, 2004).
3.4 Other Field Crops (OFC)
OFC, which include annuals of coarse grains, grain legumes, condiments and oil crops are grown inthe dry zone. In general, the majority of OFC is cultivated under rainfed conditions. The extent ofOFC grown in Sri Lanka is over 115 000 ha (AgStat, 2004).
4. Current status of fertilizer use
Significant use of high analysis chemical fertilizers for food crops in Sri Lanka started in early 1950,but widespread use of chemical fertilizer for food crops commenced in the year 1960. In order topromote balanced use of plant nutrients, fertilizer mixtures containing N, P and K nutrients had beenrecommended during early stages. However, the Department of Agriculture (DOA) changed itspolicy in 1990 by recommending straight fertilizers instead of fertilizer mixtures for food cropsgrown in Sri Lanka. This policy decision was taken in order to provide an opportunity for farmers tomake necessary adjustments in fertilizer application for optimum yield. However, the use offertilizer mixtures containing N, P and K is more popular than straight fertilizers. This may be dueto convenience in fertilizer use and lack of available straight fertilizers in the local market. The costof fertilizer has increased tremendously over the last few decades and is still increasing. Thissituation has created financial difficulties particularly for small farmers. Fertilizer consumption bydifferent crop sectors is presented in Table 1.
Table 1. Fertilizer consumption by crop sectors (mt)
Crop 1998 1999 2000 2001 2002Paddy 251 880 321 032 262 362 284 488 356 174
Tea 182 339 164 139 200 254 182 033 185 059
Rubber 15 684 9 936 13 801 9 129 6 924
Coconut 37 667 39 161 33 942 29 531 38 452
OFC 44 182 42 617 40 467 34 320 42 035
EAC* 11 317 9 637 8 704 8 711 8 321
Tobacco 3 768 3 666 3 204 2 525 2 577
Others 14 515 26 147 29 797 28 770 30 675
Total 561 352 616 335 529 531 579 507 670 217
* EAC – refers to spices and beverage crops.
Source: NFS, 2002.
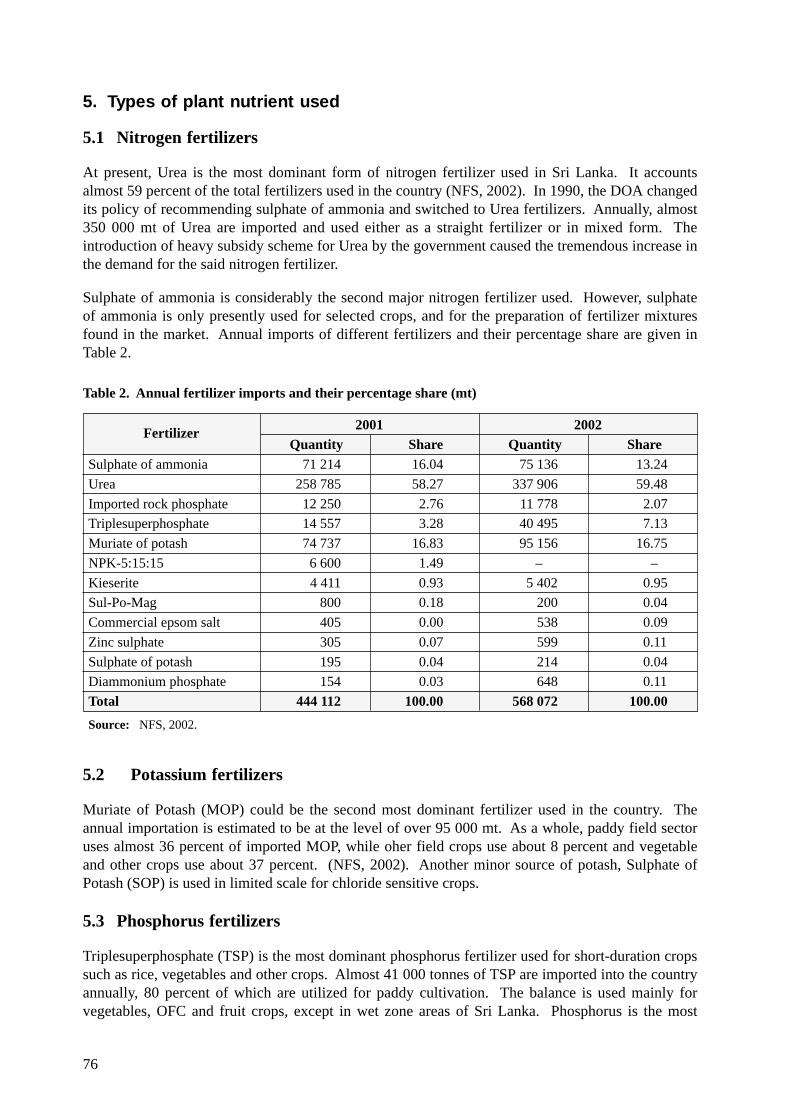
76
5. Types of plant nutrient used
5.1 Nitrogen fertilizers
At present, Urea is the most dominant form of nitrogen fertilizer used in Sri Lanka. It accountsalmost 59 percent of the total fertilizers used in the country (NFS, 2002). In 1990, the DOA changedits policy of recommending sulphate of ammonia and switched to Urea fertilizers. Annually, almost350 000 mt of Urea are imported and used either as a straight fertilizer or in mixed form. Theintroduction of heavy subsidy scheme for Urea by the government caused the tremendous increase inthe demand for the said nitrogen fertilizer.
Sulphate of ammonia is considerably the second major nitrogen fertilizer used. However, sulphateof ammonia is only presently used for selected crops, and for the preparation of fertilizer mixturesfound in the market. Annual imports of different fertilizers and their percentage share are given inTable 2.
Table 2. Annual fertilizer imports and their percentage share (mt)
Fertilizer2001 2002
Quantity Share Quantity ShareSulphate of ammonia 71 214 16.04 75 136 13.24
Urea 258 785 58.27 337 906 59.48
Imported rock phosphate 12 250 2.76 11 778 2.07
Triplesuperphosphate 14 557 3.28 40 495 7.13
Muriate of potash 74 737 16.83 95 156 16.75
NPK-5:15:15 6 600 1.49 – –
Kieserite 4 411 0.93 5 402 0.95
Sul-Po-Mag 800 0.18 200 0.04
Commercial epsom salt 405 0.00 538 0.09
Zinc sulphate 305 0.07 599 0.11
Sulphate of potash 195 0.04 214 0.04
Diammonium phosphate 154 0.03 648 0.11
Total 444 112 100.00 568 072 100.00
Source: NFS, 2002.
5.2 Potassium fertilizers
Muriate of Potash (MOP) could be the second most dominant fertilizer used in the country. Theannual importation is estimated to be at the level of over 95 000 mt. As a whole, paddy field sectoruses almost 36 percent of imported MOP, while oher field crops use about 8 percent and vegetableand other crops use about 37 percent. (NFS, 2002). Another minor source of potash, Sulphate ofPotash (SOP) is used in limited scale for chloride sensitive crops.
5.3 Phosphorus fertilizers
Triplesuperphosphate (TSP) is the most dominant phosphorus fertilizer used for short-duration cropssuch as rice, vegetables and other crops. Almost 41 000 tonnes of TSP are imported into the countryannually, 80 percent of which are utilized for paddy cultivation. The balance is used mainly forvegetables, OFC and fruit crops, except in wet zone areas of Sri Lanka. Phosphorus is the most

77
limiting plant nutrient in Sri Lankan soils. Notably, application of TSP has shown beneficial effectsfor crop growth and for subsequent high yields (Wijewardena, 1994). Local rock phosphate namedeppawala rock phosphate is mainly being used for fruit crops grown in the wet zone of Sri Lanka.However, a number of research studies conducted in relation to eppawala rock phosphate revealedthat it cannot match the P-supplying ability of TSP for annual crops, and its direct application asa source of P fertilizer for food crops will not be beneficial (Wijewardena, and Amarasiri, 1990;Wijewardena, 1998).
5.4 Compound fertilizers
The most popular compound fertilizers used in Sri Lanka are granular NPK with trace elements.One of the most important compound fertilizers used was NPK of the formulation 5:15:15 suppliedunder the Japanese Food Production Grant for paddy cultivation particularly in the wet zone of thecountry. This formulation of compound fertilizer was very popular among paddy farmers especiallyin the Low Country Wet Zone (LCWZ) where annual rainfall is over 2 500 mm. Various types ofcompound fertilizers with different formulations are also available in the local market despite theabsence of large imports of NPK compound fertilizer.
5.5 Magnesium fertilizers
Most popular magnesium fertilizer is dolomite which is available locally as calcium magnesiumlimestone. Dolomite is often used as a soil ameliorant for acid soils. It is mainly used for potato,vegetables and other horticultural crops. However, kieserite is also imported in limited quantitiesmainly for horticultural crops. Similarly, epsom salt is used to correct widespread magnesiumdeficiencies in fruits, vegetables and OFC.
5.6 Zinc sulphate
The Department of Agriculture in 2001 recommended application of zinc sulphate for rice grown indry and intermediate zones. In addition, zinc deficiency is a common problem in fruit cultivationparticularly of citrus. As a result, almost 600 mt of zinc sulphate was imported in 2002 to Sri Lanka.
5.7 Special fertilizers
Special fertilizers used in Sri Lanka are NPK formulations with trace elements, micronutrient,mixtures for hydrophonics, fertigation mixtures and fertilizer with growth promoting substances(Table 3). These fertilizers are used for vegetables, floriculture crops and other horticultural crops.Most of these fertilizers are comparatively high value fertilizers imported in small quantities.
Table 3. Imports of special fertilizer in the year 2002
Fertilizer Liquid (liters)Quantity Powder
granules (mt) (mt)NPK 2 296 179.5 21.0
NPK + TE 8 910 636.5 7.9
TE 6 001 47.1 18.9
Fertigation mixture – – 11.5
Hydro phonic mixture – – 12.0
TE = Trace Element
Source: NFS, 2002.

78
5.8 Liquid fertilizers
There are more than hundreds of types of liquid fertilizer that are available in the market. They areeither organic fertilizers or fertilizers containing both organic and chemical fertilizer. Even thoughthe DOA has not recommended liquid fertilizers, some farmers are using them for crops such asvegetables, onion, potatoes, floricultural crops, etc. By application of foliar fertilizers, farmersexpect to obtain attractive product, which can fetch high prices in the market rather than get theiryield increased.
6. Trends in plant nutrient use
Some economic factors play an important role in determining the quantity of chemical fertilizersused by farmers vis-à-vis yield response to added fertilizer, farm gate price of produce, price offertilizer, etc. Prior to 1966, use of low analysis fertilizer was a common feature for rice. Rockphosphate or bone meal and sulphate of ammonia were the sources of phosphorus and nitrogen,respectively. However, during the period of 1967 to 1978 Urea became the major source of nitrogen.Similarly, TSP replaced rock phosphate. The period from 1979 to 1989 indicates a high rate ofgrowth in fertilizer use for paddy. Introduction of high fertilizer responsive varieties and theenhanced area under irrigation are some factors that contributed to this growth. A setback in 1996was observed due to the price shock after the removal of fertilizer subsidy. It took almost 3-4 yearsto recover from this setback. Use of sulphate of ammonia was recommenced during the period1990-1994 due to transport restrictions on Urea to north and to the east because of security reasons.However, in 1990 the DOA changed its policy of recommending fertilizer mixtures for food cropsand switched to straight fertilizers due to increased flexibility in terms of adjusting amounts ofnutrients to suit the crop and soil. Still, a large number of fertilizer mixtures continue to be marketedin Sri Lanka. Most farmers prefer the mixtures, probably because they are less cumbersome to use,although they can be more costly than straight fertilizers per unit of nutrient. In general, for the pastseveral years, the use Urea fertilizer maintained an increasing trend.
6.1 Rice
Paddy consumes the largest part of chemical fertilizers. It accounts for approximately 50 percent ofthe overall use of chemicals fertilizers in Sri Lanka (Table 1). The main fertilizers used for paddycultivation are Urea, TSP and MOP. Though many farmers in dry and intermediate zones userecommended level of chemical fertilizers, farmers in wet zone use chemical fertilizers less than therecommended level. These facts indicate that overall fertilizer use is below the recommended level.This may be due to using less or no basal fertilizer for paddy cultivation by the farmers growingpaddy in marginal lands and in cultivation under rainfed conditions. The cost of cultivation of paddyin Sri Lanka is increasing from season to season. As a result, use of balanced NPK for rice has beendecreased. In addition to NPK fertilizers, the DOA has recommended once-a-year application ofzinc sulphate at the rate of 5 kg ZnSO4/ha for rice cultivation. Popularization of straight fertilizerand promotion of Integrated Plant Nutrition System (IPNS) in paddy cultivation have beenconducted by the DOA in recent past. It has been observed that there is a slow, but a steady growthin straight fertilizer use for paddy during the last few years. However, paddy fertilizer mixturesuch as ‘V’ mixture (5:15:15) and TDM (30:0:20) were also in wide use by rice farmers. Paddyproduction depends on several factors and imbalances in fertilizer usage need to be investigated forfuture improvements, as there had been a set back in the NPK ratios in the fertilizer application ofpaddy. In this regard, production increase programme conducted by the DOA namely “Yaya”demonstrations programme, had contributed positively to enhance higher productivity in paddycultivation.
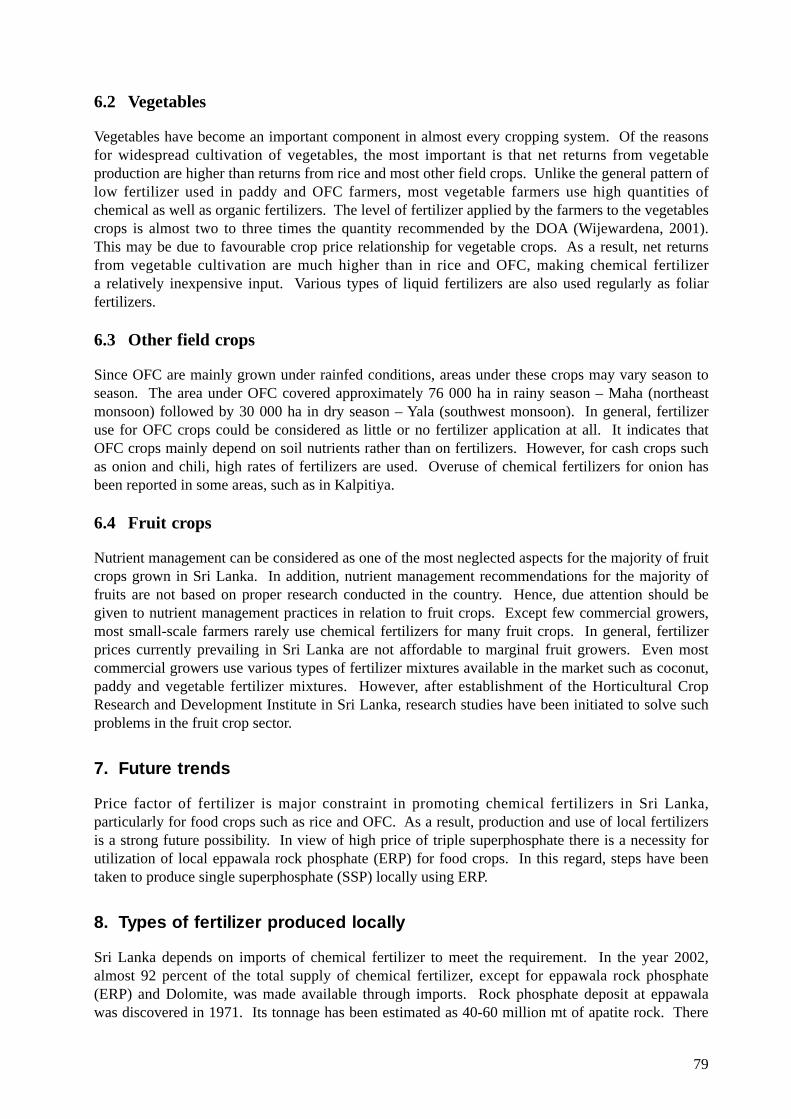
79
6.2 Vegetables
Vegetables have become an important component in almost every cropping system. Of the reasonsfor widespread cultivation of vegetables, the most important is that net returns from vegetableproduction are higher than returns from rice and most other field crops. Unlike the general pattern oflow fertilizer used in paddy and OFC farmers, most vegetable farmers use high quantities ofchemical as well as organic fertilizers. The level of fertilizer applied by the farmers to the vegetablescrops is almost two to three times the quantity recommended by the DOA (Wijewardena, 2001).This may be due to favourable crop price relationship for vegetable crops. As a result, net returnsfrom vegetable cultivation are much higher than in rice and OFC, making chemical fertilizera relatively inexpensive input. Various types of liquid fertilizers are also used regularly as foliarfertilizers.
6.3 Other field crops
Since OFC are mainly grown under rainfed conditions, areas under these crops may vary season toseason. The area under OFC covered approximately 76 000 ha in rainy season – Maha (northeastmonsoon) followed by 30 000 ha in dry season – Yala (southwest monsoon). In general, fertilizeruse for OFC crops could be considered as little or no fertilizer application at all. It indicates thatOFC crops mainly depend on soil nutrients rather than on fertilizers. However, for cash crops suchas onion and chili, high rates of fertilizers are used. Overuse of chemical fertilizers for onion hasbeen reported in some areas, such as in Kalpitiya.
6.4 Fruit crops
Nutrient management can be considered as one of the most neglected aspects for the majority of fruitcrops grown in Sri Lanka. In addition, nutrient management recommendations for the majority offruits are not based on proper research conducted in the country. Hence, due attention should begiven to nutrient management practices in relation to fruit crops. Except few commercial growers,most small-scale farmers rarely use chemical fertilizers for many fruit crops. In general, fertilizerprices currently prevailing in Sri Lanka are not affordable to marginal fruit growers. Even mostcommercial growers use various types of fertilizer mixtures available in the market such as coconut,paddy and vegetable fertilizer mixtures. However, after establishment of the Horticultural CropResearch and Development Institute in Sri Lanka, research studies have been initiated to solve suchproblems in the fruit crop sector.
7. Future trends
Price factor of fertilizer is major constraint in promoting chemical fertilizers in Sri Lanka,particularly for food crops such as rice and OFC. As a result, production and use of local fertilizersis a strong future possibility. In view of high price of triple superphosphate there is a necessity forutilization of local eppawala rock phosphate (ERP) for food crops. In this regard, steps have beentaken to produce single superphosphate (SSP) locally using ERP.
8. Types of fertilizer produced locally
Sri Lanka depends on imports of chemical fertilizer to meet the requirement. In the year 2002,almost 92 percent of the total supply of chemical fertilizer, except for eppawala rock phosphate(ERP) and Dolomite, was made available through imports. Rock phosphate deposit at eppawalawas discovered in 1971. Its tonnage has been estimated as 40-60 million mt of apatite rock. There

80
are two forms of rock phosphate fertilizers being produced in Sri Lanka, namely ERP and high gradeeppawala rock phosphate (HERP). HERP, could be considered as an improvement, which isprocessed by crushing pure apatite only. At present, annual production of ERP is 41 000 mt (Table 4),while HERP is almost 6 000 mt (Lanka Phosphate Ltd., 2005 Unpubl.). Though Sri Lanka importedhigh citric acid soluble rock phosphate, a few years ago after introduction of HERP, substitution ofimported rock phosphate (IRP) with HERP was done. As a result, rock phosphate fertilizers are notpresently being imported to the country. With the increased demand for plantation crops andalso with enhanced promotional efforts, the local supply of ERP had reached the highest levelachieved so far. Eppawala rock phosphate is used for perennial crops, such as tea, rubber, coconut,fruit crops etc.
Table 4. Annual production and issues of local rock phosphate (mt)
Operation 2000 2001 2002 2003Production 35 085 35 769 37 664 41 351
Issues 35 805 35 441 38 412 40 170
Experiments have been conducted during the past three decades to find out the suitability of ERP forannual crops (Nagarajah et al.,1979; Wijewardena and Amarasiri, 1990; Wijewardena, 1998).Removal of phosphate by annual crops like potato and vegetables are high as they generate a highbiomass within a short period of time. In addition, the shallow root system found in these plantsrequires soluble types of P fertilizers. As a result, direct application of rock phosphate sources arenot suitable for annual crops due to their low solubility in soil solution. However, partial acidulatedrock Phosphate (Wijewardena and Yapa, 1998), mixtures TSP and rock phosphate combinations,combined application of rock phosphate and organic manure showed beneficial effects for all annualcrops including rice, potato and vegetables. The Lanka Phosphate Limited (LPL) has producedlimited quantity of single superphosphate (SSP) from ERP, which contain more soluble P than ERP.At present, experiments are in progress to study the suitability of SSP as a source of P for annualcrops such as rice, vegetable and OFC.
Dolomite is mined and crushed by private firms in the Central Province of Sri Lanka. The estimateduse of dolomite as a fertilizer or soil ameliorant has arisen to about 20 000 mt. It is regularly used asa liming material for tea, fruit crops, vegetables and potatoes.
9. Cost of fertilizer products
Urea is subsidized in Sri Lanka. However, the local price of all other fertilizers including TSP, MOPand sulphate of ammonia was determined by the open market forces. The competition among thenumber of wholesalers also assisted in keeping the open market price competitive. The demand forUrea, owing to its subsidized price, was maintained at a reasonably high level. The price of otherfertilizers increased in the local market due to increase of oil prices in the world market. In general,however, price of Urea in Sri Lanka continues to be increased. The retail price of major fertilizer inselected ESCAP countries during the year 2002 indicated that comparative price of fertilizer appearto be high in Sri Lanka (NFS, 2002). Retail prices of fertilizers are presented in the Table 5. Thistable indicates that among commonly used fertilizers in Sri Lanka, TSP is the most expensive in thelocal market followed by MOP and Urea.

81
10. Fertilizer subsidies
The subsidy scheme for fertilizer was initiated more than a decade ago. However, since 1997, onlyUrea was subsidized in Sri Lanka. At present, subsidy for Urea is approximately US$230 per mt. Asa result, an increasing trend in use of nitrogen fertilizer was observed. In addition, a gradual andsubstantial reduction in use of P and K fertilizer is evident. This implies a deterioration of NPKratios in recent years. The international market price of Urea also increased during the year 2004.Application of the US dollar against the local currency, removal of national security levy on fertilizerand introduction of value added tax (10 percent) contributed to increase in Rupee expenditure onUrea. In keeping with the fluctuation in the international market price of Urea, reasonable importprices and the corresponding rates were fixed for implementation of the subsidy. At present, there isa substantial increase in the quantity imported under the subsidy scheme due to enhanced demand forfertilizer. However, fertilizer subsidy is a very strong political issue in Sri Lanka.
Recently elected government in Sri Lanka has decided to revise the subsidy scheme and implementa fixed subsidy for all three fertilizers such as Urea, TSP and MOP. Under this proposal, a 50 kg bagof any fertilizer will be US$3.5. This new scheme will be implemented with effect from 5 December2005. According to this new scheme, subsidy will be given only for straight fertilizers. Estimatedcost for proposed subsidy will be US$0.12 billion per year. However, the new proposal is targeted tosmall farmers in the country.
11. Depletion of soil organic matter
Soils in Sri Lanka are low in organic matter (Panabokke and Nagarajah, 1964; Wijewardena, 1995;Wickramasinghe and Wijewardena, 2003). Long-term experiments conducted over eight (8) seasonswith rice (J.D.H. Wijewardena, 2001 Unpubl.), potato and vegetables (Wijewardena, 1993;Wijewardena and Yapa, 1999) showed that there was no increase of organic matter in soil byapplication of organic manure 4 and 10 t/ha per crop, respectively. Research shows that the majorityof soils in main rice growing areas are low in organic matter (Table 6). As a result, many soilsfound in Sri Lanka are low in CEC. Cation exchange capacity levels in majority soils are lower than10 cmo1/kg (Panabokke, 1966). Under such conditions, retention of plant nutrients is low. Ingeneral, organic manures are useful in conserving soil fertility. As a result, seasonal application ofavailable organic manure sources showed beneficial effects of crop growth as well as overall soilfertility (Wijewardena 1993; 2000). Hence, a policy decision was taken by the Ministry ofAgriculture and the Department of Agriculture in 1999 to promote IPNS technology among farmersin Sri Lanka. This technology showed economical benefits as well as soil fertility improvement inrelation to various food crops grown in Sri Lanka (Wijewardena and Yapa 1999; Dissanayake, 2000).
National average yields of paddy and several other food crops have been stagnating over the lastdecade (Wickramasinghe and Wijewardena, 2003) requiring a new approach on how to increase at
Table 5. Average retail prices of important fertilizers (US$/mt)
Fertilizer 6th July 2000 12th Feb. 2001 18th July 2001 15th July 2002 10th Oct. 2002
Urea 70 70 70 70 110
Sulphate of ammonia 106 106 136 136 156
Triplesuperphosphate 192 192 172 210 210
Muriate of potash 165 165 186 199 199
Local rock phosphate 41 41 45 36 56
Source: NFS, 2002.

82
the national yield levels. Reasons for such problem may be due to declining of organic mattercontent, imbalance of major plant nutrients, and inadequacy of various micronutrients in most of thecultivated lands in Sri Lanka. As a result, these factors have adversely affected the overall soilfertility in cultivated lands in Sri Lanka. Soil organic matter content is one of the key parameterswhich influence the soil fertility and productivity. However, it should be noted that increase oforganic matter in soils is a difficult task due to prevailing high temperature in many parts of thecountry. In this regard, the seasonal applications of organic materials are necessary. Rice straw,animal manure, green manure, city wastes, crop wastes, etc. could be used as sources of organicmanure to maintain the organic matter content in soil. There was an indication that in all the zones,except in the low country wet zone (LCWZ), highest rice production occurs on soils with an organicmatter content of around 2 percent. However, at the LCWZ, soils with an organic matter content of4-6 percent gave better crop response (Dissanayake et al., 1993). In addition, high content oforganic matter was recorded in wet season (Maha) than in dry season (Rezania et al., 1992).However, a slight increase in soil organic matter content was evident with more intensive croppingof potato and vegetable cultivation in the up-country areas of Sri Lanka where low temperatures areprevailing due to high elevation.
12. Decline of plant nutrients
Agricultural lands diminish in crop production potential or suitability for crop production throughvarious types of land degradation in Sri Lanka (Nayakekorale, 1998). Being an agricultural country,Sri Lanka has to place much attention on soil degradation problem in consideration of the lowper capita land availability at present. The directly available land for human use was estimated at0.15 ha/person (Madduma Bandara, 2000). Soil fertility decline in Sri Lanka is mainly due todepletion of soil organic matter as well as loss of plant nutrients etc. Soil analytical studiesconducted in various parts of the country revealed that low plant nutrient content is a major threat tocrop production in Sri Lanka (Wijewardena, 1995; Nayakekorale and Prasantha, 1996). Thedepletion of soil nutrient due to leaching and run off could be considered as major course of fertilitydecline. Thus, many agricultural farming systems are becoming non-profitable to farmers.
Rice growing soils in Sri Lanka have very low content of P in available form (Tables 7 and 8). Ingeneral, P-fixing capacity of majority of soils is also high. Phosphorus deficiency in rice soils of themidcountry has been previously reported by Panabokke and Nagarajah (1964) and Maraikar et al.,(1983). Similarly, low available P in rice soils of the LCWZ (Wijewardena, et al., 1998) has been
Table 6. Soil organic matter content (percent) in major rice growing districts
District
1964* 1984** 2000***Organic matter content (%)
Organic matter content (%) <1% 1-3%No. of sites
Ampara 0.69-1.72 1.4 45 25
Anuradhapura 0.86-2.58 1.4 3 87
Polonnaruwa 0.86-2.58 1.9 20 75
Kurunegala 0.68-1.72 1.9 89 9
Hambantota 0.72-3.87 2.5 34 49
Badulla 2.59-6.45 2.0 26 40
* Panabokke, 1964; ** Rezania, 1984; *** Soil Testing Programme of the DOA, 2000.
(Adopted from: Wickramasinghe and Wijewardena, 2003)

83
reported. Critical level of available soil P in the soils of the LCDZ and LCIZ is about 3-5 mg/kg,while it is around 10-15 mg/kg in soils of midcountry wet zone (MCWZ) and MCWZ, to achievea yield response to added P. Rice farmers apply low quantities of P due to high cost of TPS inSri Lanka. Soil analysis conducted in different areas show that 63-80 percent soils are low availableP (Olsen P) except in some soils which grow potato and vegetables in rotation with rice(Wijewardena,1999) in the up-country intermediate zone (UCIZ).
Similarly, low available P in upland soils is also common in Sri Lanka: in soils of the UCWZ(Kumaragamage et al., 1999), UCIZ (Wijewardena, 1995; Wijewardena, 1996), and UCWZ(Wijewardena et al., 1999). High P-fixing capacity in up-country vegetable growing soils has beenreported by Withana and Kumaragamage (1993). A study conducted with 70 soil samples byWijewardena et al. (1999) reported that majority of soils collected from vegetable growing soils inthe LCWZ had available P below 20 mg/kg (73 percent sites), which is considered as the low contentof P according to the criteria set by the DOA in 1995. Similarly, Kumaragamage et al. (1999) alsoreported the low P availability in soils of the LCWZ.
However, build up of P could be seen in many intensive vegetable growing soils in Sri Lanka. Thiscondition is caused by indiscriminate use of organic and chemical fertilizers. Build up ofphosphorus in some potato and exotic vegetable growing soils in the up-country area particularly inUCWZ and UCIZ has been reported (Jeewananthan et al., 1995; Wijewardena, et al., 1996;Wijewardena, 1999). Similarly, occurrence of high available P due to use of high rates of deep litteras well as chemical fertilizers was observed in leafy vegetable growing soils in the LCWZ. Soilanalysis revealed that available P (Olsen’s) in these soils is as high as 2 500 mg/kg (J.D.H.Wijewardena, 2004 Unpubl.).
Field crops in Sri Lanka are traditionally cultivated in the dry and semi dry areas. Field crops onrainfed uplands receive inadequate fertilizer phosphorus and as a result, soils are relatively low inavailable P. However, crops such as chilli and onion on irrigated uplands receive excessive fertilizerP, thus, soils become generally high in available P.
Table 7. Uncultivated and cultivated soil characteristics in the up-country
Characteristic Uncultivated soil Cultivated soilpH (1:2.5; Soil: H2O) 4.0-5.5 4.5-6.0
OM (%) 1-2 2-4
Total N (%) 0.1-0.15 0.2-0.3
Olsen P (mg/kg) 2-10 20-400
Exchangeable K (meq/100 g soil) 0.1-0.2 0.2-0.5
Source: Wijewardena, 1995.
Table 8. Range of available P in rice, vegetable and fruit growing soils of the LCWZ
Rice* Vegetables** Fruits***Soil P No of sites Soil P No of sites Soil P No of sites
(mg/kg) (%) (mg/kg) (%) (mg/kg) (%)<5 33 <10 43 <5 41
5-10 36 10-20 30 5-10 28
10-20 26 20-30 3 10-20 17
>20 5 >30 24 >20 14
Source: * Wijewardena et al., 1998; ** Wijewardena et al., 1999a; *** Wijewardena et al., 1999b.

84
In Sri Lanka, most fruit crops are grown in home gardens under rainfed conditions. As a result, useof fertilizer for fruit crops is limited. Hence, fruit growing soils in Sri Lanka are low in phosphorus(Wijewardena et al., 1996; J.D.H. Wijewardena, 2003 Unpubl.).
All rice growing soils have different K supplying capacity. According to Panabokke and Nagarajah(1964), K status in rice growing soil was in a range of 39-59 mg/kg. The exchangeable K content ofrice growing soils in the LCWZ ranges between 27-94 mg/kg. In addition, coarse textured soilsfound in the LCDZ also contain the lower exchangeable K content at 47 mg/kg. In some cases, K inthese soils has been reported to be as low as 12-24 mg/kg (Weerasinghe, 1991). Almost 50 percentof the rice growing soils in the LCWZ have exchangeable K content of less than 58 mg/kg, which isconsidered as the critical soil K level for mineral or alluvial soils (Rezania, 1992). It has been alsoobserved that there is a declining trend in these soils when rice is grown continuously. Accordingto Wijewardena, et al., (1998), 48 percent of soils in the LCWZ contain exchangeable K below78 mg/kg of soil, while remaining soils contain more than 78 mg/kg of exchangeable K.
In the UCIZ, a total of 150 soil samples collected in 57 fields revealed exchangeable K valuesexceeding 300 mg/kg in soils fertilized for potato and vegetable crops for few decades(Wijewardena, 1999). Since P is also high in these soils, the DOA has recommended only N for ricegrown in this region. Similarly, high K contents in rice-vegetable cropping systems were alsoreported in the MCIZ (Joseph et al., 1988).
A study conducted by Wijewardena et al., (1999) reported low exchangeable K even in vegetableand tuber crops growing soils in the LCWZ. They showed that based on soil K standards introducedby the DOA (1997), 83 percent sites had a low soil K. Hence, application of K fertilizers isnecessary to improve soil fertility in the LCWZ vegetable and tuber crops growing soils to obtainhigh crop yields in the LCWZ. Similarly, low exchangeable K in soils of the LCWZ was alsoreported by Kumaragamage et al., (1999). Soils found in LCDZ and LCIZ are containing reasonableamount of exchangeable K. However it should be noted that K in LCDZ are higher than in LCIZ(Wijewardena, 2002).
Soils found in Kalpitiya peninsula were used to cultivate vegetable, chili etc. Though soils are poorin soil fertility, chemical fertilizers are used extensively for crops grown in this region. As a result,build up of some plant nutrient could be seen in these soils. However, exchangeable K content inthese soils is low. This could be expected due to the sandy nature of soils found in this area.
Investigations conducted (Joseph et al., 1988) in midcountry area revealed that accumulation of Kcould be seen in cultivated soils. Farmers use high rates of both organic and chemical fertilizers forvegetables and chemical fertilizers for vegetable crops grown in this region.
In both UCWZ and UCIZ, vegetable and tuber crops cultivation is intensive and highlycommercialized. In the UCWZ, vegetables are cultivated throughout the year in rotation with potato.In the UCIZ, vegetables are grown under upland rainfed, irrigated and lowland rice-based croppingsystems. Due to the hilly nature and high rainfall in this region, soils are rather poor in plant nutrientcontents. As a result, inherent soil fertility in Ultisoils (Kumaragamage et al., 1999) is very low.However, Ultisoils in the up-country contain reasonable quantity of K in exchangeable form(Wijewardena 1995a). In addition, most farmers in the up-country utilize inorganic fertilizermixtures in combination with large amount of organic manures with particular emphasis on the useof poultry litter and cattle manure. Wijewardena (1995) compared the characteristic of uncultivatedand cultivated soils in the up-country of Sri Lanka (Table 7). A total of 290 soil samples analysedby Wijewardena et al., (1996) reported that 44 percent of soil samples had K up to 160 mg/kg,50 percent of soil samples had K between 160-400 mg/kg and only 6 percent soil samples had Kmore than 400 mg/kg. A sampling programme conducted after rice crop included 68 fields for
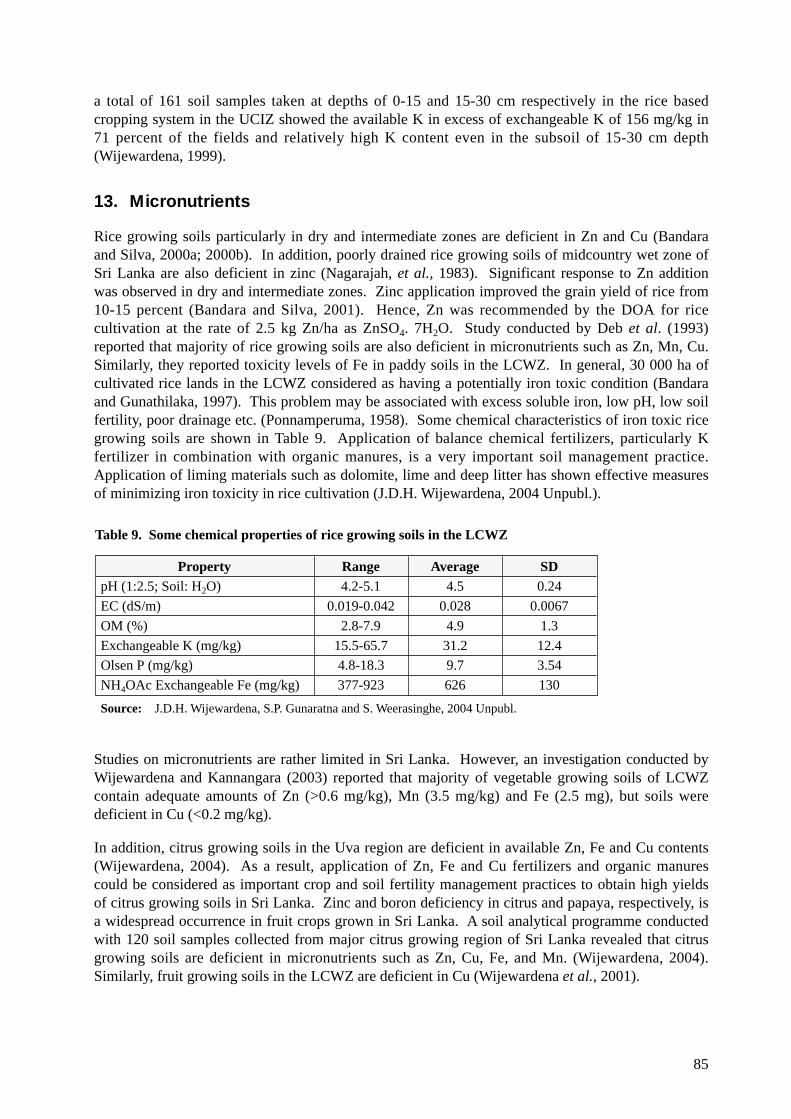
85
a total of 161 soil samples taken at depths of 0-15 and 15-30 cm respectively in the rice basedcropping system in the UCIZ showed the available K in excess of exchangeable K of 156 mg/kg in71 percent of the fields and relatively high K content even in the subsoil of 15-30 cm depth(Wijewardena, 1999).
13. Micronutrients
Rice growing soils particularly in dry and intermediate zones are deficient in Zn and Cu (Bandaraand Silva, 2000a; 2000b). In addition, poorly drained rice growing soils of midcountry wet zone ofSri Lanka are also deficient in zinc (Nagarajah, et al., 1983). Significant response to Zn additionwas observed in dry and intermediate zones. Zinc application improved the grain yield of rice from10-15 percent (Bandara and Silva, 2001). Hence, Zn was recommended by the DOA for ricecultivation at the rate of 2.5 kg Zn/ha as ZnSO4. 7H2O. Study conducted by Deb et al. (1993)reported that majority of rice growing soils are also deficient in micronutrients such as Zn, Mn, Cu.Similarly, they reported toxicity levels of Fe in paddy soils in the LCWZ. In general, 30 000 ha ofcultivated rice lands in the LCWZ considered as having a potentially iron toxic condition (Bandaraand Gunathilaka, 1997). This problem may be associated with excess soluble iron, low pH, low soilfertility, poor drainage etc. (Ponnamperuma, 1958). Some chemical characteristics of iron toxic ricegrowing soils are shown in Table 9. Application of balance chemical fertilizers, particularly Kfertilizer in combination with organic manures, is a very important soil management practice.Application of liming materials such as dolomite, lime and deep litter has shown effective measuresof minimizing iron toxicity in rice cultivation (J.D.H. Wijewardena, 2004 Unpubl.).
Table 9. Some chemical properties of rice growing soils in the LCWZ
Property Range Average SDpH (1:2.5; Soil: H2O) 4.2-5.1 4.5 0.24
EC (dS/m) 0.019-0.042 0.028 0.0067
OM (%) 2.8-7.9 4.9 1.3
Exchangeable K (mg/kg) 15.5-65.7 31.2 12.4
Olsen P (mg/kg) 4.8-18.3 9.7 3.54
NH4OAc Exchangeable Fe (mg/kg) 377-923 626 130
Source: J.D.H. Wijewardena, S.P. Gunaratna and S. Weerasinghe, 2004 Unpubl.
Studies on micronutrients are rather limited in Sri Lanka. However, an investigation conducted byWijewardena and Kannangara (2003) reported that majority of vegetable growing soils of LCWZcontain adequate amounts of Zn (>0.6 mg/kg), Mn (3.5 mg/kg) and Fe (2.5 mg), but soils weredeficient in Cu (<0.2 mg/kg).
In addition, citrus growing soils in the Uva region are deficient in available Zn, Fe and Cu contents(Wijewardena, 2004). As a result, application of Zn, Fe and Cu fertilizers and organic manurescould be considered as important crop and soil fertility management practices to obtain high yieldsof citrus growing soils in Sri Lanka. Zinc and boron deficiency in citrus and papaya, respectively, isa widespread occurrence in fruit crops grown in Sri Lanka. A soil analytical programme conductedwith 120 soil samples collected from major citrus growing region of Sri Lanka revealed that citrusgrowing soils are deficient in micronutrients such as Zn, Cu, Fe, and Mn. (Wijewardena, 2004).Similarly, fruit growing soils in the LCWZ are deficient in Cu (Wijewardena et al., 2001).

86
14. Organic fertilizer use in Sri Lanka
Since ancient times, manuring has been considered as one of the most important techniques toincrease and maintain soil fertility. Soil organic matter plays an important role in soil fertility. Ricestraw could be considered as a very valuable organic fertilizer material for rice grown in Sri Lanka.Since, many rice soils in Sri Lanka are low in soil fertility it should be noted that straw can besuccessfully used to improve the long-term soil fertility in many parts of the country. However,a large number of farmers burn the straw at the threshing site especially when there is no alternativeway of disposal. Majority of Sri Lankan farmers are fully unaware of the value of rice straw asa fertilizer material and a large quantity of rice straw is wasted. Despite the recommendation fromDOA, there is still low acceptance by farmers to apply rice straw as a source of organic manure.Some of the reasons for this are the following: cost and inconvenience of transporting the bulkymaterial to the field, unavailability of simple and inexpensive methods to apply straw to the fields inthe manner which does not hinder land preparation without causing adverse effects on the rice crop.
In general, rice straw is a valuable source of carbon, potassium, silicon, etc. It is also a convenientsource of organic manure in Sri Lanka, aside from being considerably the cheapest. Rice strawthereby could be considered as a very important organic fertilizer material for rice grown inSri Lanka (Dissanayake 2000). Long-term field experiments conducted at the LCWZ revealed thatstraw application in combination with NPK can increase the yield of rice as well as over all soilfertility (J.D.H. Wijewardena, 2000 Unpubl.). Hence, rice straw should be applied in combinationwith recommended chemical fertilizers. In order to get maximum benefits, the straw must beincorporated into the soil by 2-3 weeks before the land preparation or 3-4 weeks before planting ofrice.
On the other hand, the use of animal wastes for rice cultivation is very limited. Unlike for cashcrops, the costs of transportation of animal manure are too high to permit their application in ricecultivation. These considerations suggest that organic manure should be generated in the field itselfor in its near vicinity if the practice is to be accepted by farmers. In addition, sources of animalmanure are expensive due to high demand by vegetable and potato growers in the country. Asa result, rice farmers are not in a position to purchase organic fertilizers such as deep litter, cattlemanure, goat dung.
Alternatively, green manures have been added to rice fields for many years. Field experiments haveshown that chemical fertilizer can be reduced by addition of green manure. However, use of greenmanure in rice cultivation is not widespread primarily due to limited availability of suitable plantmaterials. Often it is applied to nursery area or to parts boarding the high lands. Experiments withGliricidia maculata and Tithonia diversifolia showed that 9 t/ha of these green manure incombination with 59 kg/ha NPK fertilizer gave rice yields more than the recommended NPK levels(Nagarajah, 1999). In addition, 4 seasons long-term experiment with Tithonia diversifolia, showedthat the amount of NPK fertilizer added to rice can be substantially reduced. Studies on the use ofSesbania sesban and S. rostrata as in situ green manures for lowland rice showed that both speciescan supply up to 50 percent of the recommended N fertilizer.
It is a common practice to apply organic sources, such as cattle manure and poultry manure, whengrowing vegetable and potato throughout the country. The up-country is considered as the regionwhere main potato and vegetable growing area of the country. Potato and vegetable cultivation inthe up-country is intensive and highly commercialized. A unique feature observed in the up-countryof Sri Lanka in potato and vegetable cultivation is the use of animal manure such as cattle andpoultry manure. Poultry manure, which has to be transported over a long distance, approximately200-250 km from west and Northwestern part of the country, is commonly used as a fertilizer at the

87
rate of 10-15 t/ha per crop (Wijewardena 1993; Wijewardena, 1995). Cattle manure is used asa fertilizer at the rate of 20-30 t/ha per crop (Maraikar et al., 1996). In the up-country, it could beconsidered more as farmyard manure rather than pure cattle manure because it contains largequantities of grass, straw and leftovers of bedding materials. However, farmers in the up-countryprefer to use farmyard manure than pure cattle manure. Cultivation of potato and vegetables hasnever included the application of cattle or poultry manure.
In vegetable cultivation, sunken beds are prepared and filed with cattle manure and covered withlayer of soil. Then, farmers apply chemical fertilizer mixtures, mixed with soil and irrigated1-2 days before planting. In the case of potato, cattle manure or poultry manure is spread along thefurrows and are covered with a layer of soil. Here, too, chemical fertilizer mixtures are applied andirrigated 1-2 days before planting potato tubers.
It is very important to note that farmers in the up-country apply poultry manure 3-4 days prior toplanting vegetable and crops and irrigate for 2-3 days if rains are not experienced within this period.By this practice, farmers avoid the harmful effects of poultry manure on their crops at the initialstage. In addition, farmers apply chemical fertilizer mixtures containing N, P and K or straightfertilizers 1-2 days prior to planting and mix with previously applied poultry manure. Afterirrigating for 1 or 2 days, poultry manure is mixed with chemical fertilizers before planting the crop.During the growing season, farmers top-dress their crops with NPK mixtures or TDM or Urea.
15. Use of foliar fertilizers
Potato and vegetable growers, particularly in the up-country, apply different kinds of foliar fertilizersduring the growing period at 6-7 days intervals at a high rate of 12 l/year/ha (Rezania et al., 1989).In general, foliar fertilizer is applied to vegetable crops grown in this region even just beforeharvesting. By these applications, farmers expect to obtain attractive vegetables, which can fetchhigh prices in the market rather than get their yield increased.
16. Use of liming materials
Application of liming materials such as dolomite and burnt lime is also a common practice for potatoand vegetable growers particularly in the up-country areas. Despite the recommendation of DOA toapply such materials at 2 t/ha/year if soil pH is below 5, farmers still apply almost 650 kg/ha(Wijewardena, 2001).
17. Nutrient balance
Rice is a biannual crop and it removes considerable amounts of nutrients especially potassium andsilica, which are found in straw and in grain. The total removal depends on the yield. Nutrientremoved by rice crop indicates a negative balance of P and K even with the application of DOArecommended levels (Table 10).
Rice crop removes more P and K than quantities applied as chemical fertilizers. However, thissituation could be improved by application of organic manures recommended by the DOA(Wickramasinghe and Wijewardena, 2003). It indicates that nutrient removed needs integrated useof organic and chemical fertilizers to compensate for the nutrient loss (Dissanayake, 2001).

88
18. Farm budgets in different cropping systems
The increasing total cost of production and declining profit have become significant issuesparticularly in rice and OFC. In high potential areas, nominal cost of production has doubled fromUS$0.04/kg in 1987/88 maha season to US$0.08/kg in 1998/99 maha season (Jayawardena, 2003).This analysis indicates that the real cost production per kg of paddy has become more prominent inlow potential areas, attributing to decreased productivity. Similar trend could be seen in many OFCcrops other than chili and onion. However, it is interesting to note that vegetables have become animportant component in almost every cropping system. Of the several season for widespreadcultivation of vegetables, the most important is that net returns from vegetable production are higherthan returns from rice and most other field crops (Table 11).
Table 10. Nutrient balance in different rice growing environments of Sri Lanka
AreaTotal removal
AmountBalance
(kg/ha)recommended
(kg/ha) Nutrient (kg/ha)LCDZ N 100 100 0
P 18 13 -5
K 106 28 -78
Up-country or Midcountry N 100 60 -40
P 18 13 -5
K 106 28 -78
LCWZ N 100 55 -45
P 18 13 -5
K 106 53 -78
In straw: N = 0.74 percent; P = 0.1 percent; K = 1.81 percent
In grain: N = 1.26 percent; P = 0.26 percent; K = 0.32 percent
Table 11. Comparison of net returns from cultivation of different crops per hectare(US$)
Crop Cost of cultivation Value of product Net returnRice 45.7 75 29.3
Potato 424.3 825 400.7
Tomato 123.3 188 56.7
Bitter gourd 123.6 160 36.4
Bean 144.8 280 135.2
Green gram 213.5 230 16.5
19. Soil test-based fertilizer recommendations
The soil test-based fertilizer recommendation programme introduced by the DOA has contributed, tosome extent, to prevent build up of P and K in the cultivated fields as well as to minimizegroundwater pollution (Tables 12 and 13). Under this programme, any farmer can get his soil

89
sample tested and obtain a site specific P and K fertilizer recommendation for rice, vegetables, tubercrops and OFC for a nominal fee of approximately US$3 (DOA, 1997). This programme helpedfarmers in the up-country to make substantial savings in the money spent to purchase fertilizers(Maraikar et al., 1996).
20. Pollution of water resources due to agricultural production
Almost one-third of land in Sri Lanka is cropped. Intensive agriculture associated with increasefertilizer and pesticide use has resulted in serious groundwater pollution in some areas of the island.Eastern, northern and some parts of northwestern parts have predominately permeable soils withshallow water tables, which are more susceptible to leaching with high application rates, making thegroundwater potentially hazardous. Groundwater and surface water of central highlands too arebecoming polluted with high application of nitrogenous fertilizers from both inorganic and organicsources. The use of fertilizers and pesticides in Sri Lanka is expanding rapidly as in otherdeveloping countries, particularly with the introduction of new high yielding crop varieties.
Nagarajah et al. (1983) reported that due to intensive cultivation of annual crops in Jaffna peninsula,the nitrate-nitrogen levels exceeds WHO recommended levels. The studies conducted in theKalpitiya peninsula indicate that leaching of chemical fertilizer from intensively cultivated landsseems to elevate the concentration of nitrates in groundwater (Kuruppuarachchi, 1995). He reportedthat most irrigation wells had nitrate-N concentrations in excess of the WHO guideline of 11.3 mg N/land often in excess of 22.6 mg N/l. Further, he reported that build up of nitrate is quite dramatic andhas been estimated at 1-2 mg N/l per annum.
In the up-country, potato and vegetables have been cultivated for several decades. The rates offertilizer applied by farmers are much higher than the quantity recommended by the DOA. Thelevels of chemical fertilizer applied by farmers to potato and vegetable crop are almost double ortriple the quantity recommended by the DOA (Wijewardena, 1996; Wijewardena, 2001). In addition,use of high rates of animal manure is also common in the up-country. Quantities added range from10 to 15 t/ha of poultry manure and from 20 to 30 t/ha of cattle manure (Wijewardena, 1993;
Table 12. Application rate of TSP for potato and vegetable crops based on soil test results
Application
Potato Cabbage Tomato BrinjalSoil P level rate of the
(mg/kg) recommendedlevel
<20 Full 270 270 270 325
20-30 Half 200 135 135 165
>30 Starter dose 70 70 60 85
Table13. Application rate of MOP for potato and vegetable crops based on soil test results (kg/ha)
Application
Potato Cabbage Tomato BrinjalSoil K level rate of the
(mg/kg) recommendedlevel
<160 Full 250 150 130 170
160-400 Half 130 90 90 110
>400 No application – – – –

90
Wijewardena, 1995). Due to the hilly nature and high rainfall in the area, rain could easily wash outapplied fertilizer. Wijewardena et al. (1995) and Wijewardena et al. (1999) monitored drinkingwater quality of wells in the UCIZ and UCWZ. NO3-N values reported in these areas were lowerthan values reported in Jaffna and Kalpitiya areas.
21. Integrated plant nutrition system
During the past decade, average yields of food crops including rice have been stagnant or declining.One of the reasons for this yield decline or stagnation is the unbalanced use of fertilizer. This trendin many cropping systems will result in soil mining leading to decline in soil fertility. In order toimprove soil fertility, it is important to follow environmentally-friendly plant nutrition managementpractices under what has been termed the Integrated Plant Nutrition System (IPNS). This conceptadvocates the balanced use of fertilizer for crop production. Also, when adding fertilizer to a crop, itwould be necessary to assess and take into account the contribution of different sources such as soil,water, organic manure, rain etc. to the nutrient pool.
Studies conducted in relation to plant nutrition management had shown that in many croppingsystems the integrated nutrient supply and management through judicious use of organic andchemical fertilizers would lead to sustainable crop production (Tables 14 and 15 ), as well as overallsoil improvement. Hence, the use of this technology is advantageous as it helps to improve fertilizeruse efficiency, improvement of long-term soil fertility as well as increase the benefit-cost ratio(Wijewardena and Yapa, 1999; Dissanayake, 2000).
Table 14. Rice yield and VCR with different fertilizer management practices
Treatment Yield (t/ha) VCRMean yield without chemical fertilizer 3.0 2.68
Mean yield with chemical fertilize 4.5 2.638
Mean yield with chemical fertilize + Rice straw 6.0 5.02
Mean yield with chemical fertilize + 9.8 8.22Rice straw + Cow dung + Green manure
Source: Dissanayake, 2000.
Table 15. Effect of organic and chemical fertilizers on crop yield (Data is shownfrom the last three seasons of an eight-season study)
TreatmentYield (t/ha)
Cabbage Tomato Bush beanNo fertilizer 6.4 2.2 5.1
NPK 33.0 7.2 10.7
Poultry manure 62.1 18.4 11.1
Poultry manure + NPK 81.8 24.6 15.8
NPK = Rates recommended by the DOA for each crop; Poultry manure = 10 t/ha.
In general, IPNS is a long-term approach to effective maintains soil and crop productivity. However,farmers expect immediate and quick economic benefits with IPNS practices. This hinders andrestricts adoption of IPNS at the farm level. Thus, creating an awareness of the benefits of IPNSamong farmers by introducing various methods of technology transfer would indeed help to solvethis problem. In addition, bulky organic manures and its application make IPNS labour intensive. In

91
this respect, Local and Government Organizations should encourage farmers by providing suitablefacilities to utilize such materials particularly in rice cultivation, as well as large-scaledemonstration, extension services conveying practical training and educational programme tofarmers.
References
Abeysiriwardena, D.S. de Z. and C. Sandanayake, 2000. Future rice research as directed by trends incultivated extent and yield of rice during the recent past. Proceedings of the Annual Symposium ofthe Department of Agriculture, Sri Lanka 2: 371-380.
AgStat, 2004. Pocket Book of Agricultural Statistics. Socio-economics and Planning Centre, Departmentof Agriculture, Peradeniya, Sri Lanka. Volume 1: 4.
Bandara, W.M.J. and G.A. Gunathilake, 1997. Effect of some soil amendments a bronzing in rice grownin iron toxic mineral soils of low country wet zone Krushi 16(1): 22-29.
Bandara, W.M.J. and L.C. Silva, 2000a. An assessment of micronutrient requirements for rice grown inLow Humic Gley soils of Low Country Dry Zone. Proceeding of the Annual symposium of theDepartment of Agriculture, Sri Lanka 2: 35-46.
Bandara, W.M.J. and L.C. Silva, 2000b. Effects of applied micronutrients on growth and grain yield ofrice grown in Low Humic Gley soils of Low Country Intermediate Zone. Journal of the soilsscience society of Sri Lanka 12: 40-50.
Bandara, W.M.J. and L.C. Silva, 2001. Rice crop response to Zn application in Low Humic Gley soils ofLow Country Intermediate Zone. Annuals of the Sri Lanka Department of Agriculture, 3: 9-18.
CBSL, 2004. Economic and Social Statistics of Sri Lanka 2004. Central Bank of Sri Lanka. 165 p.
Deb, D.L., D. Weerasuriya, A.A. Yasawardena and S.S. Nambuge, 1993. Available Zn, copper, manganeseand iron status of low country wet zone rice soils of Sri Lanka. Tropical Agriculturist 149: 35-44.
Dissanayake, S.T. 2000. Increasing rice yields through integrated plant nutrition systems to face the newmillennium. Paper presented at the international conference on Paddy Soil Fertility. April 24-27,2000 Manila, Philippines.
Dissanayake, S.T., A. Willekens and M. Rezania, 1993. Fertilizer demonstrations on rice and subsidiaryfood crops in Sri Lanka. Field Document No. 15, GCPF/SRL/047/NET. 65 p.
DOA, 1997. Soil – Test Based Fertilizer Recommendations. A Technical Working Document for SoilScientists of the Department of Agriculture, Peradeniya, Sri Lanka. 30 p.
Jayawardena, S.S.B.D.G. 2003, past, present and future of the golden grain, rice in Sri Lanka. RiceCongress 2000, Department of Agriculture, Peradeniya, Sri Lanka. 17-22.
Jeewananthan, B. Seneviratne, R. and Eriyagama, I. 1995. Phosphorus and potassium status of vegetablegrowing soils in midcountry and up-country in Sri Lanka. Krushi 15(2): 17-18.
Joseph, K.D.S.M., P.V. Hemachandra and S.D.G. Jayawardena, 1988. Response of rice to fertilizers ina rice-vegetable crop rotation in the Matale district. Tropical Agriculturist 144: 1-9.
Kumaragamage, D., H.B. Nayakekorale and L.P. Vidhana Arachchi, 1999. Risk and limitations of the wetzone zoils. In: Soils of the Wet Zone of Sri Lanka, Morphology, Characterization and Classification.(Ed. R.B. Mapa, S. Somasiri and S. Nagarajah) Special Publication No. 1, Soil Science Society ofSri Lanka, 139-159.
Kuruppuarachchi, D.S.P. 1995. Impact of irrigated agriculture on groundwater resource of Sri Lanka.Proc. Sri Lanka Ass. Advmt. Sci. 51(2): 49-66.
Madduma Bandara, C.M. 2000. Land Resources. Conditions and Trends. pp. 53-73. In Natural Resourcesof Sri Lanka (Ed.) P.G. Cooray.

92
Maraikar, S., S. Nagarajah and P. Loganathan, 1983. Phosphorus sorption characteristics of some lowlandrice soils of the midcountry wet zone of Sri Lanka. Tropical Agriculturist 139: 31-41.
Maraikar, S., S.L. Amarasiri and J.D.H. Wijewardena, 1996. Improving productivity of vegetablecultivation in Ultisols of Sri Lanka. Proceedings of an international conference on “Managing SoilFertility for Intensive Vegetable Production Systems in Asia” AVRDC, Tainan, Taiwan 270-282.
Nagarajah, S. 1999. Development of environmentally friendly plant nutrition management practices forSri Lanka. ESCAP/PRUDD/ FADINAP/CAP/99/182.40 p.
Nagarajah, S., M.M.M. Jauffer and B.M. Nizar, 1979. Phosphorus studies in the low land rice soil soils ofthe midcountry wet zone. Tropical Agriculturist BS: 1-22.
Nagarajah, S., B.M. Nizar, M.M.M. Jauffer and S. De Silva, 1983. Zinc as a limiting wet zone. TropicalAgriculturist 139: 67-75.
Nagarajah, S., B.N. Emerson, V. Abeykoon and S. Yogalingam, 1988. Water quality of some wells inJaffna and Kilinochchi with special reference to nitrate population. Tropical Agriculturist 144:61-78.
Nayakekorala, H.B. 1998. Human Induced soil degradation status in Sri Lanka. Journal of the SoilScience Society of Sri Lanka 10: 1-35.
Nayakekorala, H.B. and B.D.R. Prasantha, 1996. Physical and chemical characteristics of some erodedsoils in midcountry of Sri Lanka. J. Soil Sci. Soci. Sri Lanka 9: 17-31.
NFS, 2002. The Review of Fertilizer Year 2002. National Fertilizer Secretariat Ministry of Agricultureand Livestock, Sri Lanka. 75 p.
Panabokke, C.R. and S. Nagarajah, 1964. The Fertility characteristics of the rice growing soils of Ceylon.Tropical Agriculturist CXX: 3-28.
Panabokke, C.R. 1996. Soils and Agro-Ecological Environments of Sri Lanka Natural.
Resources, Energy and Science Authority of Sir Lanka. Natural Resources Series No. 2, 220 p.
Ponnamperuma, F.N. 1958. Lime as a remedy for a physiological disease of rice associated with excessiron. Int. Rice comm. News. 7(1): 10-13.
Rezania, M. 1992. Nutrient management of rice in major lowland rice soils of Sri Lanka. FAO FieldDocument 10. GCPF/SRL/047/NET.106 p.
Rezania, M., A. Willekens and S.T. Dissanayake, 1992. Status of pH, Organic Matter, Phosphorus andPotassium in Soils Under Cultivation of Field Crops in Sri Lanka. DOA/FAO, Field Document 12,83 p.
Weerasinghe, P., 1991. Response of irrigated lowland rice to addition of N, P and K fertilizers in Non-CalcicBrown Soils. Tropical Agriculturist 147: 75-84.
Wickramasinghe, W. M.A.D.B. and J.D.H. Wijewardena, 2003. Soil fertility management and integratedplant nutrition systems in rice cultivation. Rice Congress 2000, Department of Agriculture,Peradeniya, Sri Lanka. 125-140.
Wijewardena, J.D.H. 1993. Effect of organic and chemical fertilizers on vegetable cultivation inup-country intermediate zone. Tropical Agriculturist 149: 1-11.
Wijewardena, J.D.H. 1994. Response of potato and vegetable crops grown sequentially to phosphorusapplication in an Ultisol. Tropical Agriculturist 150: 27-34.
Wijewardena, J.D.H., 1995. Nutrient Management Under Intensive Cropping Systems. The Experience ofthe Vegetable Growing Systems of the Up-country of Sri Lanka. Proceedings of the Workshop onRural Credit for Crop Production in Sri Lanka. The Experience of the Block Demonstrations,Colombo, Sri Lanka. 38-49.

93
Wijewardena, J.D.H. 1996. Fertilizer management under intensive cropping systems in Sri Lanka. Paperpresented at the Regional Workshop on Fertilizer concepts with special reference to organicfertilizers. 6-9 May 1996, Tagaytay, Philippines.
Wijewardena, J.D.H. 1998. Effect of phosphorus sources and levels with particular emphasis onselectively mined eppawala rock phosphate on vegetable production. Journal of the NationalScience Council of Sri Lanka 26(2): 93-100.
Wijewardena, J.D.H. 1999. Nutrient availability in the rice soils of up-country Intermediate zone. Sri LankaJ. Agric. Sci. 36: 63-69.
Wijewardena, J.D.H. 2000. Comparison of animal manure sources on potato and vegetable cultivation inthe up-country. Annual Symposium of the Department of Agriculture, Sri Lanka 2: 357-369.
Wijewardena, J.D.H. 2001. Fertilizer and soil amendments use on potato in relation to soil fertility in ricebased cropping systems of up-country of Sri Lanka. Annals of the Sri Lanka Department ofAgriculture 3: 353-363.
Wijewardena J.D.H and S.L. Amarasiri, 1990. Comparison of Phosphate sources on growth of vegetableson an acid soil. Tropical Agriculturist 146: 67-66.
Wijewardena J.D.H. and U.W.S.P. Yapa, 1998. Efficiency of partially acidulated eppawala phosphate rockas a phosphorus source for potato and vegetables. J. Soil Sci. Soc. Sri Lanka 10: 72-87.
Wijewardena J.D.H. and U.W.S.P. Yapa, 1999. Effect of combined use of animal manure and chemicalfertilizer on potato and vegetable cultivation in the up-country of Sri Lanka. Sri Lankan J. Agric.Sci. 3: 70-82.
Wijewardena J.D.H. and E.H. Kannangara, 2004. Status of selected micronutrients in vegetable growingsoils of the low country wet zone of Sri Lanka. J. Soil Sci. Soc. Sri Lanka 15: 23-27.
Wijewardena, J.D.H., U.W.S.P. Yapa and M.K.G. Yatagama 1995. Water quality of selected wells in theup-country of Sri Lanka. Proceedings 52nd Annual Sessions Sri Lanka Association for theAdvancement of Science 1: 52-53.
Wijewardena, J.D.H., U.W.S.P. Yapa and M.K.G. Yatagama 1996. Status of selected chemicalcharacteristics of vegetable growing lands in the up-country intermediate zone. Proceedings52nd Annual Sessions Sri Lanka Association for the Advancement of Science 1: 49-50.
Wijewardena, J.D.H., J.B.K. Kannangara, P. Yohalingam and E.H. Kannangara, 1998a. Status of selectedchemical characteristics of rice soils in the low country wet zone. Proceedings 54th Annual SessionsSri Lanka Association for the Advancement of Science 1: 70-71.
Wijewardena, J.D.H., U.W.S.P. Yapa and M.K.G. Yatagama, 1998b. Drinking water quality of some wellsin the intensive vegetable growing areas in the up-country intermediate zone. Tropical Agriculturist152: 9-17.
Wijewardena, J.D.H., J.B.K. Kannangara, E.H. Kannangara and P. Yohalingam, 1999a. Status of selectedchemical characteristics of vegetable growing soils in the low country wet zone. Sri LankaAssociation for the Advancement of Science, Proceedings of the 55th Annual session, part I: 50.
Wijewardena, J.D.H., J.B.K. Kannangara, E.H. Kannangara and P. Yohalingam, 1999b. Status of someselected chemical characteristics of fruit growing soils in the low country wet zone. Sri LankaAssociation for the Advancement of Science, Proceedings of the 55th Annual session, part I: 94.
Wijewardena, J.D.H., J.B.K. Kannangara and P. Yohalingam, 2001. Status of selected micronutrients offruit growing soils in the low country wet zone of Sri Lanka. Krushi 19(3-4): 7-10.
Withana, A.K. and D. Kumaragamage, 1993. Retention of phosphorus by some surface soils of Sri Lanka.Trop. Agric. Res. 5: 61-68.

94
Southeast Asian Country
Paper Number 6
Soil fertility management and conservation under agricultureproductivity improvement project in Cambodia*
Ho PutheraDepartment of Agronomy and Agricultural Land Improvement, Ministry of Agriculture,
Forestry and Fisheries, Phnom Penh, Cambodia
Summary
The Royal Government of Cambodia after years of conflict has started in earnest, the basicprogrammes and works on the improvement of agricultural and soil productivity. In general,most soils released for use in various agriculture and food production programmes are acidic,low in organic matter and very poor in soil fertility. One of the recent efforts are dedicated tothe promotion and adoption of sustainable land management (SLM) in response to the country’scommitment to the United Convention to Combat Desertification, including land degradationand drought. The banner programme is the Agriculture Productivity Improvement Programme(APIP) which provided human and financial resources for the nationwide implementation of theSoil Fertility Management and Conservation (SFMC). Networks of on-farm techno-demoswere established in over 14 provinces to showcase different farming systems to improve soilfertility and also to improve farmer’s technology on plant nutrient management andimprovement. Massive soil and plant tissue samples for soil fertility analysis and fertilizer usecalibration were conducted and this now forms the critical benchmark and data base for futuresoil fertility programme and formulations for the Royal Government of Cambodia.
1. Introduction
Food and fiber production systems in the Royal Government of Cambodia now and into the futureneeds to meet three major requirements: (1) to provide adequate supply of safe, nutritious, andsufficient food for the world’s growing population, (2) to significantly reduce rural poverty throughaugmentation of household income derived from activities, and (3) to curb further degradation ofnatural resources, particularly land resources. These challenges have to be resolved in anticipationof unpredictable changes in global climate- a key factor in natural and agro-ecosystem productivity.Other major factors that will influence how agriculture meets the challenge of food security includeglobalization of markets and trade, increasing market orientation for agriculture, emergingtechnologies and increasing public concern about the impacts of unsustainable natural resourcemanagement.
It is imperative, therefore, to share lessons learned and focus on the strategic management andimplementation of the Sustainable Land Management (SLM) in pursuance of the objectives ofUnited Nation Convention to Combat Desertification (UNCCD).
* This country report has not been formally edited and the designations and terminology used are those of the author.

95
SLM initiatives through the Soil Fertility Management and Conservation (SFMC) in the country arebeing undertaken through:
● High quality research and development activities in different agro-ecosystem target areas todemonstrate, extend and raise awareness of SFMC technologies;
● Capacity building activities to strengthen the capability of partners to demonstrate andextend relevant SLM technologies to their farmer clients; and
● Effective coordination and information support to strengthen and improve the existingcollaborative with regions having similar problems.
2. Activities and achievements
While poor external participation, institutional limitations and national funding uncertaintieshave acted to impede progress, and that limited human and institutional skills have undermined thevalue of very good ‘Science’ in the SLM programme. For instance, the Agricultural ProductivityImprovement Programme (APIP) for SFMC has achieved its objectives within the design timetableas follows:
● Field activities of SLM core site saw the establishment, operation and maintenance of3 run off and soil loss monitoring sites. Data collection, collation and assessment completed.
From these works, rainfall patterns at each site with recorded annual rainfalls showed the followingsummarized data trends:
● Typically >2 500 mm rainfall level for all sites;
● 71 percent of rain occurs in falls of <10 mm/day, 24 percent in falls of 10-50 mm/day and4 percent in falls of >50 mm/day; and
● Similarly, low rainfall intensities (<10 mm/hr) were observed in 81 percent of rain events,and higher, more erosive intensities (>20 mm/hr) were observed in 9 percent of instancesreflecting catastrophic events such as various effective cyclones were recorded.
● The recorded/collected information and data suggests that run off is initiated at rainfalls inthe excess of 5-10 mm/day i.e. only in about 29-38 percent of all rainfall events. Run offunder ‘normal’ rainfall was typically <5 percent of total rainfall suggesting these soils isstable with low erosivity, respectively.
The recently collected soil loss data suggests that contour-based farm treatments can be groupedinto four broad categories, viz. (1) Farmers Practice (FP), (2) FP + vetiver, (3) FP + short tomedium-term cash crops, and (4) FP + agroforestry hedges. The actual annual soil losses per sitevary relative to FP (= 0 percent or no change). Obviously, the on-farm demonstrations using theabove 4 categories have one common message that reconfirmed hedgerows planted across the slopescan effectively control soil erosion. Figure 1 describes the following trends in relative annual soilloss:
1. Vetiver grass strips reduced soil losses to 30-50 percent of FP in the 2 years after planting,and to >90 percent after that;
2. Short to medium-term cash crop barriers reduced soil losses initially to 50 percent of FP,and to >90 percent after 3 years (very similar trend to vetiver grass); while,
3. Agroforestry hedges maintained soil losses at around 50 percent of FP during this time.

96
The network of SFMC on-farm techno-demos
The network of on-farm techno-demos covered and ensured the implementation of thousandson-farm demonstration and survey activities over 14 provinces. In addition to the technical dataon-farm production, due consideration was given to the three impact areas such as environmentalimpact, social impact and economic impact.
The quantified measurements of local impacts of the techno-demos in various sites resulted in thefurther development of farming system models for semi-commercial producers which consideredsoil fertility and erosion control, giving due consideration to the productivity of the hedges/barriers,especially as it affects needs and access of poor and vulnerable to basic production-improvingservices.
Cooperators showed through their country programmes that they could apply SFMC knowledgelearned during training. Coordination and technical backstopping visits supported on-the-jobtraining in areas relating to implementation, day-to-day management and demonstration oftechniques and collection, collation, analysis and reporting gathered data. Regular activitiesassociated with field trial management are being institutionalised and activities included as line itemsin Ministry budgets.
Timely technical assistance, training and capacity building activities and workshops on SFMCprovided:
● Technical assistance, training and capacity building activities involving 503 provincialtechnical staff, extension worker and private sectors participants (16 percent females).
● Effective links with other 6 national programmes, and the 14 PDAs network coordinatorattended. Cooperative links with regional and bilateral activities developed during Phase 1were strengthened to promote longer-term sustainability of national and regional activities.Successful regional staff exchanges added value to regional training workshops andcoordination and technical backstopping visits by allowing network members toshare experiences and extend ‘lessons learned’ to their peers. These experiences furtherrewarded both trainees and trainers through skill recognition, communication and personalnetworking.
Figure 1. Trends in relative annual soil loss for treatment groupings on APIP-SFMC sites
-120
-100
-80
-60
-40
-20
0
20
1 2 3 4 5 6
Per
cent
of
FP
Years after site establishment

97
Effective administration, management and information distribution systems allowed:
● Leadership;
● Effective distribution of information on SFMC/SLM several Agri-Notes, balanced approachto the network management function, and country programme 5 annual technical reports,and workshop reports.
A total of 3 440 soil samples were collected in the farmers field and field stations and were analysedto provide soil chemical properties and soil fertility relational data base and benchmarks. Thismassive and systematic soil sampling programme aimed to: (i) determine and/or confirm soil types,(ii) compare the soil and soil properties of the field station with those used by the farmers in theadjoining farms, and (iii) prepare an inventory of soil types, soil chemical properties and fertilizermanagement practices for these field areas. Inventory activities were undertaken in conjunction withother agronomic and infrastructure databases being developed for each field sites.
Table 1. Soil sampling and analysis by provinces
No. Provinces/Location Number of CollectedSoil Samples
1 Kampong Cham, Rubber farms 300
2 Kratie, SFMC field trial’s sites 660
3 Kampong Thom, SFMC field sites 600
4 Battambang, SFMC field sites 300
5 Svay Rieng, AQIP sites 420
6 Prey Veng, AQIP sites 380
7 Kandal, AQIP field sites 490
8 Takeo, AQIP field sites 35
Total 3 440
The Soil and Plant Analysis Laboratory’s mission is to provide a quality national soil, fertilizer andplant nutrient analysis service to encourage sustainable land management and improve food securityin Cambodia. Its purpose is to serve Government, national research institutions, NGOs,agribusinesses and farmers as a semi-autonomous agency under DAALI. The laboratory, likewise,participated in the regional soil and plant sample exchange programme.
3. Lessons learned
SFMC is an institutional capacity building programme of technical staff and extension workers andother stakeholders learning to work together under the leadership of DAALI under the NationalAction Programme (NAP). The processes of human and institutional capacity building and theactual knowledge and experiences gained in the hands-on implementation in the various stations andfarmer’s field provided important lessons learned and unlearned:
● To address SLM issues, and its function. For its operation, external funding is required,from one or more donors. Further, the network needs scientific and organizationalguidance, especially for the poor resources;
● The ability and willingness for further achieving SFMC/SLM needs time for developmentand guidance supporting a longer-term intervention;

98
● Integration into national and regional programmes and communication of experienceswithin and between national and regional organizations and activities with value added ofminimising risks associated with project isolation.
● Individual objective has to be consistent with the NAP’s objectives to encourage longer-term sustainability;
4. Problems and constraints
1. SFMC staff limited skills and knowledge on management, planning, monitoring andreporting;
2. Not enough resources for TA to supervise and provide on the job training;
3. Some specific natural and administrative constraints are recognized: (i) interruption offield activities by yearly flood occurrences (ii) Slow release of funds, (iii) Delays in arrivaland subsequent release of procured items, (iv) A lack of clear procedural guidance.
5. SWOT analysis
From field observations and analysis of data collected in the soil fertility and land management area,the following strengths, weaknesses, opportunities and threats (SWOT) were recognized:
● Strengths: Laboratory and provincial personnel are collaborating with other agencies.The Soil and Plant Analysis Laboratory is applying QA/QC procedures to further progresssoil fertility and land management activities. Counterparts and provincial cooperators areundertaking technical M&E visits to inspect field trial sites for experimental rigor.Counterparts have recognized their own limitations in many technical areas and see theneed for further technical training. Strong collegiate networks exist among counterparts.There is an awakening recognition of the value of applying a holistic approach to workingin a professional environment.
● Weaknesses: Land Management Office (LMO) and laboratory insufficient attention to:(1) trial design, (2) field and technical M&E activities. Not enough quality managementsupport to field operatives and farmers efforts to improve data management, analysis andreporting skills should also be continued.
● Opportunities: Counterparts should continue networking and collaborative landmanagement activities. Great potential exists for technical and laboratory staff to plan andundertake collaborative activities with CARDI, DAE, provincial NGOs and extension staff.This is especially so when linking field operations and specialized analytical functions inareas of plant nutrition, soil fertility and land management. However, institutional reformand ongoing technical ‘mentoring’ (i.e. as technical guidance) will be required for this tohappen smoothly. Also the sustainable management of land and resources is likely tobecome an increasingly important political issue in Cambodia. LMO should continue todevelop:
1. Expert knowledge in soil fertility management in order to become a storehouse ofrelated knowledge on land management and an adviser to government, NGOs, otheragencies, agribusinesses and farmers.
2. Simple, transparent administrative and financial management systems and practices tofurther streamline information flows in collaborative activities.
Institutional and legislative processes to develop national land management policies that linksustainable production and food security to appropriate land use strategies and practices.

99
Southeast Asian Country
Paper Number 7
Soil organic matter and soil fertility in thelong-term experiment of Lao People’s Democratic Republic*
Oloth SengtaheuanghoungSoil Survey and Land Classification Center,
National Agriculture and Forest Research Institute (NAFRI),Vientiane, Laos
andKhamla Phanthaboun
Northern Agriculture and Forestry Research Centre (NAFRec),Luangprabang Province
Summary
The Soil Survey and Land Classification Center (SSLCC) of Lao PDR conducted a long-termresearch on soil conservation and fertility management to address their major problem of soilerosion and attendant soil fertility loss. Experimentations have been carried out in twolocations in the northern and central regions: Luangprabang and Vientiane provinces. Thevarious land use and farming systems technologies were assessed and included: Agroforestry(teak + upland rice, peanut); Strip cropping (soybean, upland rice, peanut); Alley croppingmixed with Agroforestry (vetiver, flemingia + mango, banana as hedgerow); Hillside ditch(upland rice, peanut + mango on the dike). These technologies were compared to the farmer’spractice (mono-cropping of upland rice), whose current farming practices were found to havecaused serious soil erosion, the major reason of soil fertility decline among resource poorfarmers. The results showed that, over time, the continuous use of appropriate agroforestry andsoil management technologies and practices can improve and maintain soil fertility for theenhancement of crop yield and increase income.
1. Introduction
The Lao PDR has a land area of 23.7 million ha, about one million ha of which are under agriculture.There are 18.7 million ha of hills and mountains. Hills account for 50 percent and mountains30 percent, with slopes over 8 percent. Most of the hills and mountains are in the northern andcentral eastern part of the country where shifting cultivation is the major farming system.Luangprabang is the province with the highest area of shifting cultivation in the country.
The topography greatly influences the climate. Areas in the mountains usually receive high amountof rainfall than flat land area. The annual rainfall varies in amount and intensity from one area toanother which invariably caused various forms of soil degradation depending on the nature andsteepness of slopes and current farming practices.
* This country report has not been formally edited and the designations and terminology used are those of the author.
100
In 1973 only 12.7 million ha or 54 percent of total area remained under forest cover and was furtherreduced in 1989 to 11.2 million ha, or 47 percent of total area of the country. Barren land/mountains,and grassland now cover 10.2 million ha where about 5 million ha are under bush fallow due tocontinuous slash-and-burn practices.
Current farming practice is unsustainable due to reduced fallow periods resulting from populationincreases. The government instituted a national policy to stop slash-and-burn cultivation as a way toprotect the country’s forest resources. However, this policy, which failed to consider management ofpopulation growth, unnecessarily resulted in the controlled reduction of access and availability oflands to growing upland communities and individual upland farming families. As a result, fallowperiods have rapidly decreased, thereby causing a serious decline in soil fertility, nutrient depletion,soil compaction, weed problems, and consequent soil degradation.
This paper presents the result of the two long-term soil fertility on-farm research sites inLuangprabang (northern part) and Vientiane (central part) from 1994 to 2001.
2. Objectives of the long-term research
a. To monitor the improvement and/or degradation of soil resources under differenttechnologies applied
b. To assess the economical returns of different soil management practices
3. Materials and methods
3.1 Location and site characteristics
Luangprabang’s site
The site is located at longitude 102.10ºE and latitude 19.44ºN, within elevation of about 400 mabove sea level in Houaykhot village, Xiengngeun district, Luangprabang province. The topographyis classified as low hilly land with slope ranging from 25-35 percent.
The climate is classified as wet and dry tropical climate which is characterized by two distinctiveseasons: the rainy season covers the months of April to October and the dry season, November toMarch. The annual rainfall of the area ranges from 1 100 mm to 1 400 mm. Monthly averagerainfall distribution at the site from 1994 to 2001 is shown in Table 1.
The soil is classified as Typic Haplustaft, clay loam, isohyperthermic developed on shales. Soilprofile description of the experimental site is show in Table 2.
Vientiane site
The site is located at longitude: 102.20ºE and latitude: 18.17ºN at Hineherb village, Hineherbdistrict, Vientiane province. The topography is a low hill with slope ranging from 20-35 percent, theelevation is about 250 m above sea level, the climate is classified as wet and dry monsoon tropical,with annual rainfall of about 1 400-2 000 mm. The rainy season starts from May to September andthe dry season start from October to April. Monthly average rainfall distribution at the site from1995 to 2000 is shown in Table 3.
The soil is classified as typic haplustult clayloam isohyperthermic, developed on sandstone andsiltstone. Soil profile description of the experimental site is shown in Table 4.

101
Table 1. Monthly average rainfall, from 1994 to 2000 at Luangprabang site
MonthYear
Jan. Feb. Mar. Apr. May June July Aug. Sept. Aug. Nov. Dec.Total
1994 0 3.6 107.8 25.4 150.0 143.6 213.8 262.4 105.6 262.4 19.8 76.5 1 134
1995 0 0 3.8 50.0 200.5 117.4 205.4 326.3 108.8 326.3 80.3 0 1 252
1996 0 20 39.8 150.3 146.7 109.8 195.6 201.5 164.3 201.5 65.2 0 1 268
1997 0 0 29.6 115.6 122.8 132.6 211.5 249.3 108.7 249.3 8.0 0 1 015
1998 33.4 4.6 29.7 158.3 162.0 107.8 117.8 289.2 61.8 289.2 42.8 13.0 1 064
1999 2.5 0 32.7 114.3 267.8 268.2 112.8 137.0 173.5 137.0 33.2 34.3 1 260
2000 0 0 18.7 178.0 259.6 117.5 334.6 138.9 137.6 138.9 30.0 0 1 303
2001 0 33.1 70.8 118.5 141.3 340.1 236.3 165.6 110.6
Table 2. Soil profile descriptions of Luangprabang site
Depth (cm) Profile descriptionA 0-12 Dark brown, (7.5 yr 4/2 moist) clay loam, moderate coarse sub angular blocky
structure, firm, sticky and plastic, many tubular pore, many medium to fine roots,abrupt wavy boundary, pH 6.
Bt1 12-45 Dark brown (7.5 yr 4/2 moist) heavy clay, sticky and very plastic, many fine roots, fewfine weatherable material, clear smooth boundary.
Bt2/C Brown (7.5 yr 5/4 moist) heavy clay, moderate medium sub angular blocky structure,very firm, sticky and very plastic, very few fine roots, about 5 percent of weatherableshale fragments.
Table 3. Monthly average rainfall, from 1995 to 2000 at Vientian site
MonthYear
Jan. Feb. Mar. Apr. May June July Aug. Sept. Aug. Nov. Dec.Total
1995 2.3 3.2 12.5 92.5 160.9 368.8 579.0 596.4 269.0 6.3 3.1 0 2 094
1996 2.3 14.1 42.2 112.4 193.2 219.1 259.8 399.4 214.6 85.8 0 0 1 542
1997 1.9 0 2.1 63.6 186.4 217.4 577.9 318.1 208.6 67.4 0 0 1 643
1998 0 0 0 16.0 156.3 347.5 359.8 470.4 167.6 65.1 1.2 0 1 583
1999 0 0 17.1 59.8 361.7 218.9 236.3 340.5 266.7 5.2 4.80 0 1 511
2000 0 13.1 12.5 120.8 270.6 326.0 255.1 371.5 308.8 69.5 4.10 0 1 752
2001 0 0 78.7 18.6 320.8 144.2 254.8 392.6 287.9
Table 4. Soil profile description of Vientiane site
Depth (cm) Profile descriptionAp 0-20 Strongly brown (7.5 yr/4.6 moist) clay loam, moderate medium angular blocky
structure, hard when dry, firm when moist, slightly sticky when wet, moderate mediumtubular pores, many medium tubular roots, abrupt wavy boundary pH = 4.9
Btcs 20-40 Yellowish red (5 yr 4/6 moist) light clay, moderate medium subangular blockystructure, slightly firm and sticky when wet, many medium interstitial rootsand moderate medium interstitial pores, few fine concretion, abrupt wavy boundarypH = 4.8
Bts1 40-69 Reddish brown (5 yr 4/4 moist) heavy clay, moderate fine subangular blocky structure,slightly hard firm, very sticky, many fine roots, few very fine interstitial poresgradually wavy boundary pH = 4.9
Btcs2 60-120 Dark red (2.5 yr 3/6 moist) heavy clay, moderate fine subangular blocky structure,slightly hard, firm, very sticky, few very fine interstitial pores, with 40 percent ofconcretions pH = 5.4

102
Table 5. Total soil loss (t/ha) from 1994-2001 at Luangprabang site
Treatment 1994 1995 1996 1997 1998 1999 2000 2001 AverageAgroforestry 3.47 6.55 4.67 2.77 2.38 1.17 0.98 1.09 2.88
Strip cropping 2.07 4.71 3.55 3.45 3.20 2.52 2.59 2.35 3.05
Alley cropping 3.56 1.76 0.45 0.14 0.27 0.21 0.32 0.24 0.86
Hillside ditches 2.66 2.41 0.56 0.19 0.15 0.32 0.52 0.35 0.89
Farmer’s practice 4.88 9.21 5.23 3.90 9.63 8.62 3.69 3.47 6.07
3.2 Experimental design
The experiment was carried out using a randomized complete block design with 3 replications.Individual plot is 10 x 24 m at Luangprabang site and 10 x 20 m at Vientiane site. The validatedtreatments were as follows:
Luangprabang site
● T1 Agroforestry (teak, and rice)
● T2 Strip cropping (rice and soybean)
● T3 Alley cropping using vetiver and mango trees as hedgerow
● T4 Hill side ditches with mango trees on the bund
● T5 Farmer’s practice
Vientiane site
● T1 Farmer’s practice (random planting)
● T2 Alley cropping using flemingia congesta as hedgerow
● T3 Alley cropping using flemingia congesta + banana as hedgerow
● T4 Agroforestry (rice and teak)
At Vientiane site, in 1998, 1999 and 2000, 100 kg of Diammonium Phosphate (18N, 46P) with1 500 kg of powered lime were applied for peanut in T2 and T3. There is no fertilizer use inLuangprabang site.
4. Results and discussion
4.1 Soil loss
An average total annual soil loss from different treatments at Luangprabang site from 1994 to 2001and Vientiane site from 1995 to 2001 are shown in Tables 5 and 6.
The highest soil loss occurred in farmer practice (T5) with amount of soil loss of 6.07 t/ha. Alleycropping (T3) is most effective in reducing soil loss (0.86 t/ha), followed by the hillside ditches(1.89 t/ha).
The Agroforesty and strip cropping treatment can reduce soil loss equivalent, at 2.88 and 3.05 t/ha,respectively.
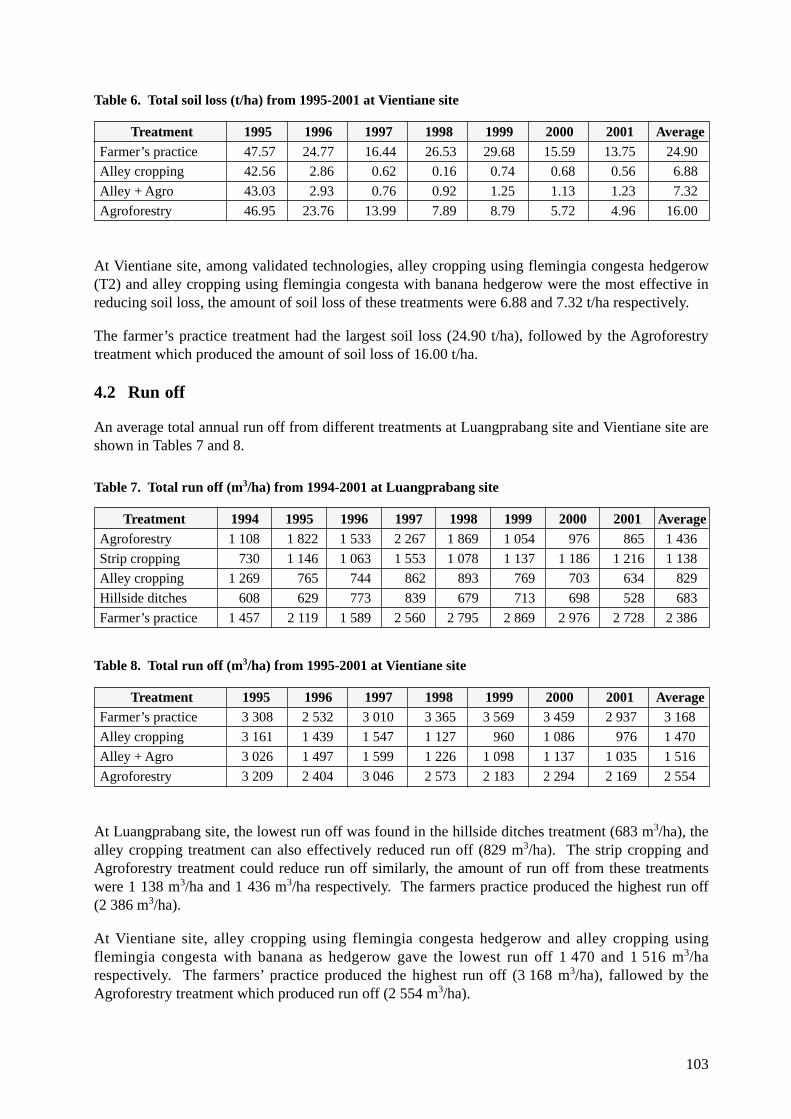
103
At Vientiane site, among validated technologies, alley cropping using flemingia congesta hedgerow(T2) and alley cropping using flemingia congesta with banana hedgerow were the most effective inreducing soil loss, the amount of soil loss of these treatments were 6.88 and 7.32 t/ha respectively.
The farmer’s practice treatment had the largest soil loss (24.90 t/ha), followed by the Agroforestrytreatment which produced the amount of soil loss of 16.00 t/ha.
4.2 Run off
An average total annual run off from different treatments at Luangprabang site and Vientiane site areshown in Tables 7 and 8.
Table 6. Total soil loss (t/ha) from 1995-2001 at Vientiane site
Treatment 1995 1996 1997 1998 1999 2000 2001 AverageFarmer’s practice 47.57 24.77 16.44 26.53 29.68 15.59 13.75 24.90
Alley cropping 42.56 2.86 0.62 0.16 0.74 0.68 0.56 6.88
Alley + Agro 43.03 2.93 0.76 0.92 1.25 1.13 1.23 7.32
Agroforestry 46.95 23.76 13.99 7.89 8.79 5.72 4.96 16.00
Table 7. Total run off (m3/ha) from 1994-2001 at Luangprabang site
Treatment 1994 1995 1996 1997 1998 1999 2000 2001 AverageAgroforestry 1 108 1 822 1 533 2 267 1 869 1 054 976 865 1 436
Strip cropping 730 1 146 1 063 1 553 1 078 1 137 1 186 1 216 1 138
Alley cropping 1 269 765 744 862 893 769 703 634 829
Hillside ditches 608 629 773 839 679 713 698 528 683
Farmer’s practice 1 457 2 119 1 589 2 560 2 795 2 869 2 976 2 728 2 386
Table 8. Total run off (m3/ha) from 1995-2001 at Vientiane site
Treatment 1995 1996 1997 1998 1999 2000 2001 AverageFarmer’s practice 3 308 2 532 3 010 3 365 3 569 3 459 2 937 3 168
Alley cropping 3 161 1 439 1 547 1 127 960 1 086 976 1 470
Alley + Agro 3 026 1 497 1 599 1 226 1 098 1 137 1 035 1 516
Agroforestry 3 209 2 404 3 046 2 573 2 183 2 294 2 169 2 554
At Luangprabang site, the lowest run off was found in the hillside ditches treatment (683 m3/ha), thealley cropping treatment can also effectively reduced run off (829 m3/ha). The strip cropping andAgroforestry treatment could reduce run off similarly, the amount of run off from these treatmentswere 1 138 m3/ha and 1 436 m3/ha respectively. The farmers practice produced the highest run off(2 386 m3/ha).
At Vientiane site, alley cropping using flemingia congesta hedgerow and alley cropping usingflemingia congesta with banana as hedgerow gave the lowest run off 1 470 and 1 516 m3/harespectively. The farmers’ practice produced the highest run off (3 168 m3/ha), fallowed by theAgroforestry treatment which produced run off (2 554 m3/ha).
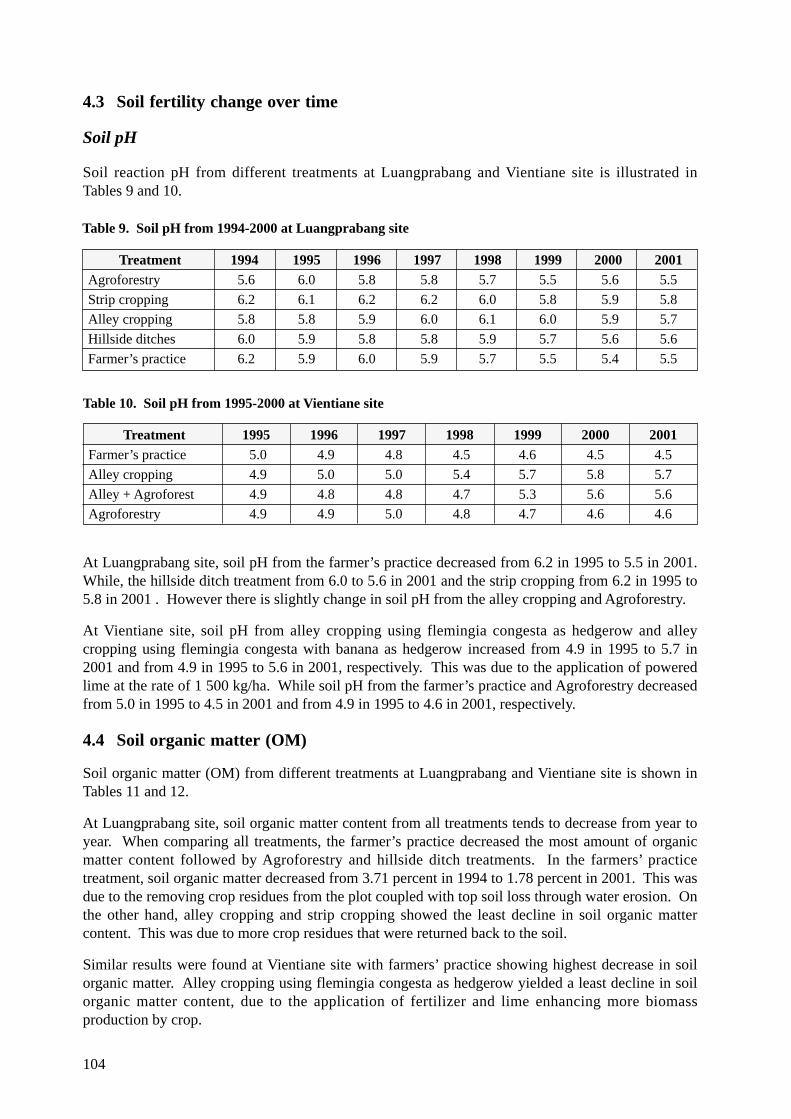
104
4.3 Soil fertility change over time
Soil pH
Soil reaction pH from different treatments at Luangprabang and Vientiane site is illustrated inTables 9 and 10.
Table 9. Soil pH from 1994-2000 at Luangprabang site
Treatment 1994 1995 1996 1997 1998 1999 2000 2001Agroforestry 5.6 6.0 5.8 5.8 5.7 5.5 5.6 5.5
Strip cropping 6.2 6.1 6.2 6.2 6.0 5.8 5.9 5.8
Alley cropping 5.8 5.8 5.9 6.0 6.1 6.0 5.9 5.7
Hillside ditches 6.0 5.9 5.8 5.8 5.9 5.7 5.6 5.6
Farmer’s practice 6.2 5.9 6.0 5.9 5.7 5.5 5.4 5.5
Table 10. Soil pH from 1995-2000 at Vientiane site
Treatment 1995 1996 1997 1998 1999 2000 2001Farmer’s practice 5.0 4.9 4.8 4.5 4.6 4.5 4.5
Alley cropping 4.9 5.0 5.0 5.4 5.7 5.8 5.7
Alley + Agroforest 4.9 4.8 4.8 4.7 5.3 5.6 5.6
Agroforestry 4.9 4.9 5.0 4.8 4.7 4.6 4.6
At Luangprabang site, soil pH from the farmer’s practice decreased from 6.2 in 1995 to 5.5 in 2001.While, the hillside ditch treatment from 6.0 to 5.6 in 2001 and the strip cropping from 6.2 in 1995 to5.8 in 2001 . However there is slightly change in soil pH from the alley cropping and Agroforestry.
At Vientiane site, soil pH from alley cropping using flemingia congesta as hedgerow and alleycropping using flemingia congesta with banana as hedgerow increased from 4.9 in 1995 to 5.7 in2001 and from 4.9 in 1995 to 5.6 in 2001, respectively. This was due to the application of poweredlime at the rate of 1 500 kg/ha. While soil pH from the farmer’s practice and Agroforestry decreasedfrom 5.0 in 1995 to 4.5 in 2001 and from 4.9 in 1995 to 4.6 in 2001, respectively.
4.4 Soil organic matter (OM)
Soil organic matter (OM) from different treatments at Luangprabang and Vientiane site is shown inTables 11 and 12.
At Luangprabang site, soil organic matter content from all treatments tends to decrease from year toyear. When comparing all treatments, the farmer’s practice decreased the most amount of organicmatter content followed by Agroforestry and hillside ditch treatments. In the farmers’ practicetreatment, soil organic matter decreased from 3.71 percent in 1994 to 1.78 percent in 2001. This wasdue to the removing crop residues from the plot coupled with top soil loss through water erosion. Onthe other hand, alley cropping and strip cropping showed the least decline in soil organic mattercontent. This was due to more crop residues that were returned back to the soil.
Similar results were found at Vientiane site with farmers’ practice showing highest decrease in soilorganic matter. Alley cropping using flemingia congesta as hedgerow yielded a least decline in soilorganic matter content, due to the application of fertilizer and lime enhancing more biomassproduction by crop.

105
4.5 Soil phosphorus available
Soil phosphorus available (P2O5) from different treatments at Luangprabang and Vientiane site isshown in Tables 13 and 14.
Table 11. Soil organic matter (percent OM) from 1994-2001 at Luangprabang site
Treatment 1994 1995 1996 1997 1998 1999 2000 2001Agroforestry 2.65 2.58 2.49 2.29 1.89 1.75 1.73 1.85
Strip cropping 2.30 2.25 2.65 2.98 2.52 2.14 1.98 2.18
Alley cropping 3.00 3.09 2.95 2.92 2.78 2.46 2.19 2.30
Hillside ditches 3.18 3.00 3.00 3.12 2.85 2.35 2.18 2.20
Farmer’s practice 3.71 3.68 3.35 2.86 2.58 2.23 1.75 1.78
Table 12. Soil organic matter (percent OM) from 1995-2001 at Vientiane site
Treatment 1995 1996 1997 1998 1999 2000 2001Farmer’s practice 2.25 2.62 2.50 2.30 2.15 1.53 1.50
Alley cropping 2.52 2.50 2.48 2.22 2.23 2.13 2.10
Alley + Agro 2.30 2.30 2.38 2.16 1.94 1.97 1.98
Agroforestry 2.37 2.30 2.30 2.12 1.89 2.09 2.06
Table 13. Soil phosphorus available (P2O5 ppm) from 1994-2001 at Luangprabang site
Treatment 1994 1995 1996 1997 1998 1999 2000 2001Agroforestry 6.7 7.5 6.5 6.8 6.2 5.9 5.3 5.3
Strip cropping 4.0 4.5 4.1 4.3 3.8 3.6 3.2 3.3
Alley cropping 4.6 4.8 4.2 4.3 2.9 2.8 2.6 2.9
Hillside ditches 6.7 5.2 5.2 6.1 5.9 4.6 4.3 4.5
Farmer’s practice 5.2 5.4 5.3 5.2 5.3 4.9 4.8 4.4
Table 14. Soil phosphorus available (P ppm) from 1995-2001 at Vientiane site
Treatment 1995 1996 1997 1998 1999 2000 2001Farmer’s practice 5.7 5.2 5.0 4.3 3.9 2.7 2.7
Alley cropping 3.0 3.2 3.3 5.1 8.3 12.3 12.5
Alley + Agro 3.7 4.0 6.1 9.5 11.3 13.8 14.9
Agroforestry 3.0 2.9 2.7 2.5 1.3 1.3 1.7
At Luangprabang site, phosphorus available from all treatments decreased over time this was maydue to uptake by annual crops every year and coupled with no input of phosphorus fertilizer.
At Vientiane site, there was obvious evident that phosphorus available under alley cropping usingflemingia congesta as hedgerow and alley cropping using flemingia congesta with banana ashedgerow, phosphorus available increased from 3.0 ppm in 1995 to 12.35 ppm in 2001 and from3.7 ppm to 14.9 ppm in 2001. This was due to the application of diammonium phosphate (18N,46P) at the rate of 100 kg/ha/year.

106
Phosphorus available under farmers practice decreased over time from 3.0 ppm in 1995 to 2.7 ppmin 2001, followed by the Agroforestry that decreased from 3.0 ppm in 1995 to 1.7 ppm in 2000.
4.6 Soil potassium available
Soil potassium available (K) from different treatments at Luangprabang and Vientiane site is show inTables 15 and 16.
Table 15. Soil potassium available (K2O mg/100 g) from 1994-2000 at Luangprabang site
Treatment 1994 1995 1996 1997 1998 1999 2000 2001Agroforestry 19.3 18.6 16.3 15.4 12.1 12.5 10.9 11.2
Strip cropping 25.6 24.5 25.7 26.3 23.0 21.5 22.4 21.3
Alley cropping 18.8 19.2 18.0 18.0 16.7 13.5 12.0 13.2
Hillside ditches 31.2 28.5 28.0 30.8 27.6 25.4 20.8 19.3
Farmer’s practice 29.0 30.5 29.7 28.5 20.9 15.6 13.2 13.4
Table 16. Soil potassium available (K2O mg/100 g) from 1995-2000 at Vientiane site
Treatment 1995 1996 1997 1998 1999 2000 2001Farmer’s practice 29.2 30.0 29.7 25.6 23.4 24.0 18.5
Alley cropping 24.0 24.5 24.9 21.6 20.8 21.5 15.7
Alley + Agro 25.5 27.5 27.3 24.5 23.8 22.8 16.8
Agroforestry 20.0 20.7 20.7 19.5 18.7 18.6 15.4
At Luangprabang site potassium available from all treatments declined over time. Potassiumavailable under farmer practice decreased from 29.0 mg/100 g in 1994 to 13.4 mg/100 g in 2001,Under Agroforestry treatment, potassium declined from 19.3 mg/100 g in 1994 to 11.2 mg/100 g in2001, hillside ditches from 31.2 mg/100 g in 1994 to 19.3 mg/100 g in 2001; alley cropping from18.8 mg/100 g in 1994 to 13.2 mg/100 g in 2001 and strip cropping from 25.6 mg/100 g in 1994 to21.3 mg/100 g in 2001. This was due to uptake by annual crops every year and coupled with noinput of potassium fertilizer. Similar feature was found at Vientiane site.
4.7 Crop yield
4.7.1 Rice yield
Average upland rice yield from different treatments at Luangprabang and Vientiane site is shown inTables 17 and 18.
Table 17. Rice yield (kg/ha) from 1994-1997 at Luangprabang site
Treatment 1994 1995 1996 1997 2001 AverageAgroforestry 1 102 1 570 778 failure no crop 862
Strip cropping 317 491 517 116 failure 360
Alley cropping 745 1 078 716 failure failure 634
Hillside ditches 397 930 807 failure failure 533
Farmer’s practice 816 1 100 856 failure failure 693

107
At Luangprabang site, the Agroforestry treatment gave highest yield 862 kg/ha. This due to cropdensities is well regularly arranged, when compare with the farmer practice, followed by the farmerpractice which produced rice yield of 634 kg/ha.
The alley cropping and hillside ditches gave the lowest yield (634 kg/ha and 533 kg/ha respectively).The lower yields of these treatments were because part of the area on these plots was used forvegetative hedgerow and ditches.
Similar feature, was found at the Vientiane site, the highest rice yield was found under Agroforestywith the yield of 1 036 kg/ha, followed by the farmer practice, alley cropping using flemingia ashedgerow, which produced yield of 924 kg/ha and 890 kg/ha respectively.
Alley cropping using flemingia congesta with banana produced less rice yield than the othertreatments with yield of 816 kg/ha, this was due to the effect of shading and nutrient competitionfrom banana.
At both sites, upland rice yield seemed to decline from year to year, this was due to the monocropping of upland rice, and without legume crop rotation.
4.7.2 Peanut yield
Average peanut yield from different treatments at Luangprabang and Vientiane site is shown inTables 19 and 20.
Table 18. Rice yield (kg/ha) from 1995-1997 at Vientiane site
Treatment 1995 1996 1997 2001 AverageFarmer’s practice 1 270 941 563 575 837
Alley cropping 1 160 972 538 1 031 925
Alley + Agro 1 150 820 478 967 853
Agroforestry 1 420 1 160 528 no crop 1 036
Table 19. Peanut yield (kg/ha) from 1998-2000 at Luangprabang site
Treatment 1998 1999 2000 AverageAgroforestry – – – –
Strip cropping 764 958 676 799
Alley cropping 436 550 432 472
Hillside ditches 463 500 369 444
Farmer’s practice 652 894 498 681
Table 20. Peanut yield (kg/ha) from 1998-2000 at Vientiane site
Treatment 1998 1999 2000 AverageFarmer’s practice 468 689 429 528
Alley cropping 867 1 059 732 886
Alley + Agro 526 763 360 549
Agroforestry – – – –

108
Table 21. Banana yield (kg/ha) from 1996-2000 at Vientiane site
Treatment 1995 1996 1997 1998 1999 2000 AverageFarmer’s practice – – – – – – –
Alley cropping – – – – – – –
Alley + Agro – 3 800 5 600 2 240 720 112 2 494
Agroforestry – – – – – – –
At Luangprabang site, the strip cropping produced highest yield (799 kg/ha), this was due to havingregular crop density, followed by the farmer practice which produced yield of 681 kg/ha. Thelowest yield were under alley cropping and hillside ditches treatments with yield of 472 kg/ha and444 kg/ha respectively. This was due to the effect of shading canopy of mango threes.
At Vientiane site, the alley cropping using flemingia congesta as hedgerow gave the highest yield(868 kg/ha), this was due to the application of Diammonium Phosphate at the rate of 100 kg/ha andpowered lime at the rate of 1 500 kg/ha. It was observed that under alley cropping using flemingiacongesta with banana as hedgerow even fertilizer and lime used as the same rate of alley croppingusing flemingia as hedgerow, the yield was still low. This was due to the effect of shading canopyand the competition of nutrient element from banana.
4.7.3 Banana yield
Average banana yield from alley cropping treatment using flemingia congesta with banana ashedgerow at Vientiane site is shown in Table 21.
At Vientiane site, banana yield under alley cropping using flemingia congesta with banana ashedgerow was higher in the first two years with yields of 3 800 kg/ha in 1995 and 5 600 kg/ha in1996, then declined from year to year. It was noticed that banana can not maintain yield for longperiod of time.
4.7.4 Mango yield
Average mango yield from alley cropping and hillside ditches treatments at Luangprabang site isshown in Table 22.
At Luangprabang site, after three years old of mango trees, since 1998 the yield of mango underhillside ditches increased from year to year with yield of 215 kg/ha in 1998, 636 kg/ha in 1999 and920 kg/ha in 2000. Similar feature was found under alley cropping treatment.
Table 22. Mango yield (kg/ha) from 1994-2000 at Luangprabang site
Treatment 1994 1995 1996 1997 1998 1999 2000 2001 AverageAgroforestry – – – – – – – – –
Strip cropping – – – – – – – – –
Alley cropping – – – – 197 517 890 1 519 780
Hillside ditches – – – – 215 636 920 2 072 960
Farmer’s practice – – – – – – – –

109
4.7.5 Biomass yield
Total biomass (rice straw and peanut residues) of different treatments at Luangprabang and Vientianesite are shown in Tables 23 and 24.
Table 23. Total crop residues (t/ha) from 1994-2000 at Luangprabang site
Treatment 1994 1995 1996 1997 1998 1999 2000 TotalAgroforestry 5.53 7.85 3.75 17.13
Strip cropping 3.48 4.53 3.97 1.74 4.25 5.16 3.55 26.68
Alley cropping 3.80 5.44 3.79 – 2.40 2.93 2.30 20.65
Hillside ditches 2.12 4.10 4.62 – 2.60 2.78 2.00 18.22
Farmer’s practice
Table 24. Total crop residues (t/ha) from 1995-2000 at Vientiane site
Treatment 1995 1996 1997 1998 1999 2000 TotalFarmer’s practice
Alley cropping 5.67 4.81 2.68 3.84 4.69 3.24 24.93
Alley + Agro 5.25 4.01 2.54 2.29 3.49 1.59 19.16
Agroforestry 6.74 5.71 2.62 15.07
At Luangprabang site the highest biomass was recorded in the strip cropping which producedbiomass of 26.68 t/ha, including, soy been residues, and rice straw, followed by the alley croppingand hillside ditches treatment which produced biomass of 20.65 t/ha and 18.22/ha respectively.While, for the farmer practice treatment crop residues were removed out from the plot.
At Vientiane site, the highest biomass was found under alley cropping using flemingia as hedgerowwhich gave the biomass of 24.93 t/ha. This was due to the application of fertilizer with limeenhancing biomass production of crops. Followed by the alley cropping treatment using flemingiacongesta with banana as hedgerow gave biomass of 19.16 kg/ha. The least biomass was found underAgroforestry treatment, because, after three years old of teak, any crop could not be planted underteak canopy. For the farmer practice crop residues were removed out from the plot.
4.7.6 Net return
Net return (US$/ha) from different treatments at Luangprabang and Vientiane site is shown inTables 25 and 26.
Table 25. Net return (US$/ha) from 1994-2000 at Luangprabang site
Treatment 1994 1995 1996 1997 1998 1999 2000 AverageAgroforestry -211.39 24.03 -56.17 -157.22 – – – -100.19
Strip cropping 62.67 104.19 48.85 6.87 73.26 136.91 47.17 68.56
Alley cropping -554.54 -33.67 -75.45 -157.09 76.46 232.30 331.66 -180.33
Hillside ditches -605.30 -58.40 -51.90 -148.04 91.24 265.87 330.05 -176.68
Farmer’s practice -108.28 -42.09 -52.00 -154.51 37.59 115.63 -9.20 -30.41

110
At Luangprabang site, highest negative net return was found under hillside ditches and alleycropping treatments in the first year of operation. This was due to the high cost of plating material(mango seedlings) coupled with the cost of establishing measure of soil erosion control (ditches andvetiver hedgerow). However, high net return could be received in the succeeding later year withadditional income derived from mango trees. Strip cropping gave positive net return for all yearsdue to income from soybean and peanut rather than upland rice. Farmer practice gave negativeincome in the first four years due to lower price of upland rice. A positive net income could bereceived when legume crop (peanut) replaced to rice. Agroforestry gave negative net return in thefirst year of operation (1995) due to the high cost of planting materials (teak seedlings) and in thelater year due to crop could not be inter cropped under teak canopy.
At Vientiane site, negative net return occurred for all treatment in the first year of operation.Positive net return could be received in the second, third, fourth and fifth year, however the highestnet income occurred in the thirst year (156.86 US$/ha), for the alley cropping using flemingiahedgerow with banana, when high income derived from banana. After that net return decreased fromyear to year, due to the declining of banana yield. Followed by the alley cropping using flemingiacongesta as hedgerow, which could receive positive net return from 1998 to 2000 when upland ricereplaced by peanut. Farmer practice gave negative net return for the most of the year due to lowcrop yield.
5. Conclusions
After seven years of long-term research (1994-2000) on sloping land for sustainable agriculture inLao PDR, a number of conclusions can be made.
a. Among soil and crop management technologies being validated in Lao PDR, alley croppingusing vetiver and flemingia congesta as hedgerow and hillside ditches were very effectivein reducing run off and soil loss. The farmer’s practice of planting crop without soilconservation measures caused high run off and soil loss.
b. Soil fertility changed after seven years of cropping, the decreasing soil organic matter underfarmer’s practice was evident after several cropping, the alley cropping and strip croppingshown the least decrease in soil organic matter content. The application of fertilizer andlime for alley cropping treatment resulted in increasing level of phosphorus content and soilpH.
c. Crop yield (annual crop) could be maintained in the first two years, after that declined fromyear to year.
d. Alley copping using vetiver with mango trees as hedgerow and hillside ditch plantingmango trees on the bunds gave high net income in later year (sixth and seven year) aftertrees produced fruits.
e. Alley cropping using flemingia congesta with banana as hedgerow gave high net income insecond, third and fourth year and declined in later year.
Table 26. Net return (US$/ha) from 1995-2000 at Vientiane site
Treatment 1995 1996 1997 1998 1999 2000 AverageFarmer’s practice -133.23 -140.67 -187.02 -12.99 54.58 -38.03 -65.34
Alley cropping -216.27 -116.05 -174.05 4.85 153.90 53.61 -42.00
Alley + Agro -308.23 95.22 156.86 38.56 110.94 -47.56 45.79
Agroforestry -259.09 -93.56 -185.26 – – – -179.30

111
References
National statistic center, 1994, basically statistic on socio-economic development in Lao PDR.
Soil Survey and Land Classification center, 1994, report on soil physical and chemical characteristics inLao PDR.
Soil Survey and Land Classification center, 1995 report on soil Survey of Luangprabang province.
Forest planning and Inventory Agency, 1995, report on forest cover and land use in Lao PDR.
Annual report, Management of sloping land for Sustainable in Lao PDR, 1994.
Annual report, Management of sloping land for Sustainable in Lao PDR, 1995.
Annual report, Management of sloping land for Sustainable in Lao PDR, 1996.
Annual report, Management of sloping land for Sustainable in Lao PDR, 1997.
Annual report, Management of sloping land for Sustainable in Lao PDR, 1998.
Annual report, Management of sloping land for Sustainable in Lao PDR, 1999.
Annual report, Management of sloping land for Sustainable in Lao PDR, 2000.

112
Southeast Asian Country
Paper Number 8
Improving plant nutrient management for betterfarmer-livelihood, food security and environment*
S. Htay WinLand Use Division, Myanma Agriculture Service
Summary
Cereal crops such as paddy rice and maize are very important in Myanmar not only for localconsumption but likewise for export. The country, being dominated by degraded soils andresource poor farming communities, is basically depend on indigenous nutrient of the soil andnatural fertilizer for crop production. Most soils used for crop production were recorded tosuffer from the deficiency of major (N and P) and micronutrients (zinc) and other secondaryplant nutrients. Typical crop is paddy rice whose area covers about 62 percent of the net grownarea. In 1992, soil samples were collected from different states and division of the country.Comprehensive analysis of their chemical contents done in Agricultural Research of Finlandindicated nutrient imbalance and soil infertility. Hence, Land Use Division and ExtensionDivision of Ministry of Agriculture cooperated in carrying-out the movement of IntegratedNutrient Management. In this regard, organic matter production sites are all over the countryand are continuously encouraged by the government. On the other hand, the farmers arepracticing compost making in various ways, such as pit, heap and efficient storage technique.The government has also been providing support for field testing of the efficacy of biofertilizersin collaboration with international institution.
1. Introduction
No one can survive without plant and soil meeting the essential needs of life being. Moreover, plantswould need the soil to supply their nutrients for sustained growth and productivity. Allowingunsustainable extraction of native soil nutrients for plant growth and production will result todegradation of the soil and its environment. If the situation remained uncontrolled, the recovery ofthe loss of soil productivity may be difficult, if not irreversible, since it takes hundreds of years ofnatural parent material decomposition processes to develop a new productive soil.
Union of Myanmar is geographically situated on western side of Indochina peninsular, between9º32' to 28º31' North Latitude and 92º to 101º East longitude. It share 5 858 km of internationalborders with China, India, Bangladesh, Thailand and Laos.
Total land area of Myanmar is 676 577 sq km, stretching for 2 276 km along the sea coast. Thewestern, northern and eastern parts of the country are hilly regions with altitudes varying from 915 to2 134 metres. It is the longest country on the main land of Southeast Asia.
* This country report has not been formally edited and the designations and terminology used are those of the author.

113
Myanmar has tropical and subtropical climates with three seasons, rainy season (mid May to midOctober), the dry cold season (mid October to mid February), and the hot season (mid February tomid May).
The average annual rainfall varied from 728 mm to 5 825 mm according to the different regionstopography. The coastal and hilly regions received 1 045 to 5 825 mm and the central, dry zone, has728 mm to 849 mm. The temperature differs according to season and region. Seasonal temperaturevariation lies from about 30º to 34º Celsius in hot season and 10º to 15º Celsius in cold season fordry zone area, central Myanmar. In contrast, in the hilly region such as Chin Hill and Shan Plateauhas a maximum temperature of 29º Celsius and minimum of as low as 7º Celsius.
The total population is recently estimated at 55.14 million (2004-2005) with 2.02 percent growthrate. The population is concentrated in southern part of Myanmar especially in delta area. Around75-80 percent of the total population at present is residing in rural areas and engaging withAgriculture, Livestock and fishery activities of which 43 percent of the rural population is land lessfarm labour. The country is blessed with rich water resources and favourable climate that make riceas the national crop and indicator of success in agricultural production.
Economically, Myanmar largely based on agriculture sector, the backbone of its economycontributed 44 percent of GDP (2002-03), 34 percent of total export earning (2001-02) and employ61.4 percent (2002-03) of the labour force.
Geographically and topographically, Myanmar consists of the series of river valleys running fromnorth to south as slope direction divided from each other by mountain ranges and plateau. The countryis surrounded by a mountain barrier on the west north and east with a plateau at the eastern part.Four major rivers are Ayeyarwaddy, Chindwin, Thanlwin, Sittaung and Ayeyarwaddy forms a largedelta that is food bowl of the country and strategic location to the major port of “City Yangon”.
Considering the topography, landform, climate, natural vegetation and agriculture, Myanmar isdivided into nine natural regions such as:
● Yakhine coastal strip (Western)
● Taninthayee coastal strip (Southern)
● Western mountain region
● Northern hilly region
● Central Myanmar (Dry Zone)
● Ayeyarwaddy delta
● Bago Yoma (Central mountain ranges)
● Sittaung river valley and
● Shan plateau (Eastern)
Myanmar constitutes with 135 national races living in 7 States and 7 Divisions. As Myanmar isAgriculture country, land and soil fertility related to the plant nutrient management and soilconservation is undoubted play vital roles. Especially, in crop growing areas, plant nutrientmanagement is an important national programme not only for improving food security but also forthe environmental protection and management. In Myanmar, the Ministry of Agriculture andIrrigation has laid down the following three main objectives:
● Surplus in paddy
● Sufficiency in edible oils
● Increased production and export of pulses and industrial crops

114
2. Status of cultivable land area and soil type
Myanmar is rich with the natural resources such as favourable land, water sources etc. Total land areacovers 67.69 million hectares, with arable lands limited to only 17.38 million hectares, or 26 percentof the total land area in Myanmar. The actual land utilization in Myanmar is shown in Table 1.
The country has altogether 24 different soil types classified by soil analysis of Land Use Divisionand related with adaptable crops as shown in Table 2.
Table 1. Land utilization of Myanmar (2003-2004)
Type of land Area (million ha) PercentAgriculture Land (A + B) 17.38 25.67(A) Net Sown 10.30 15.22
Le 5.79 8.55
Ya 2.97 4.40
Kanin/Kyun 0.51 0.75
Orchard 0.78 1.15
Other 0.25 0.37
(B) Cultivable Land 7.08 10.45Fallow 0.51 0.75
Cultivable waste 6.57 9.70
(C) Reserved Forest 15.29 22.58(D) Other Forest 18.16 26.84(E) Other land 16.86 24.91 Total 67.69 100.00
Table 2. Soil types of Myanmar
Sr.Soil type
Area% Suitable crops
No. (mil. ha)1 Fluvisol 0.74 1.1 Pulses, Chilies, Onion, Vegetable, Groundnut,
Paddy, Jute, Maize, Sesame
2 Gleysol 3.07 4.5 Paddy, Pulses, Sesame, Maize, Sugarcane,Vegetable. Groundnut, Cotton, Jute, Tobacco
3 Gley-Gleysol 0.56 0.8 Paddy, Jute
4 Gleysol-Calcaric 0.06 0.1 Paddy, Chilies, Pulses, Sorghum, Maize, Cotton
5 Ferralsol (plinthic) 0.59 0.9 Mango, Durian, Rubber, Coconut, Cassava,Pineapple, Banana, Oil palm
6 Ferralsol (rhodic) 9.97 14.7 Forest, Rubber, Pine-apple, Horticulture, Mango,Tea, Coffee
7 Ferralsol (xanthic) 8.36 12.4 Forest, Rubber, Pine-apple, Horticulture, Mango,Tea, Coffee
8 Gleysol (humic) 0.20 0.3 Mangrove Forest
9 Arenosol 0.24 0.4 Forest
10 Solonchak (thionic fluvisol) 0.04 0.1 Mangrove Forest
11 Gleysol (solonchak) 2.24 3.3 Paddy, Vegetable, Jute, Sugarcane, Pulses
12 Cambisol (d) 1.09 1.6 Upland crop, Horticulture, Maize, sesamum
13 Nitosol (cambisol) 0.53 0.8 Horticulture, Sesame, Groundnut

115
Table 2. (continued)
Sr.Soil type
Area% Suitable crops
No. (mil. ha)14 Catena of luvisol 1.78 2.6 Paddy, Chilies, Groundnut, Sesame, Cotton,
Pulses, Sugarcane, Fodder, Sunflower, Sorghum,Vegetable
15 Vertisol 0.48 0.7 Paddy, Groundnut, Sesame, Pulses, Sunflower,Sugarcane, Chilies, Sorghum, Fodder
16 Acrisol 4.13 6.1 Upland rice, Coffee, Tea, Vegetables, Groundnut,Sesame, Maize, Pulses, Niger
17 Cambisol (h) 6.29 9.3 Forest
18 Cambisol (c) 1.37 2.0 Forest
19 Cambisol (orthic) 2.46 3.6 Forest
20 Cambisol (orthic) 2.19 3.2 Forest
21 Cambisol (gelic) 2.60 3.8 Natural reserved
22 Andosol 0.05 0.1 Forest
23 Lithosol (turfy primitive) 0.24 0.4 Forest
24 Lithosol (primitive crushed 0.29 0.4 Foreststone)
25 Not suitable for crop 18.12 26.8 –
Total 67.69 100
3. Status of crop area and crop production
The diverse agro-ecological conditions prevailing in the country have allowed Myanmar to growover 60 different crops species of economic importance. Due to the population growth rate andmarket demand in Myanmar, government emphasize the extension of cultivable land and croppingintensity to increase crop yield per acre. Unfortunately, however, the national government did notprovide equal and adequate attention to the judicious management of soil and environmentalresources for sustainable plant growth and production. Yearly status of crop sown area and cropproduction is shown in Table 3.
4. Past and present situation of plant nutrient status
After 1948, mountains ranges with low population growth rate but with plenty of cultivable landshave used the shifting cultivation method. The central dry zone areas with optimal populationgrowth rate used only one crop growing system and delta areas with large population growth rateused continuous rice growing system year after year.
These strategies resulted to soil erosion and degradation as well as increase the plant nutrientdeficiency. However, at that time, land utilization and population growth rate are harmonious, hencethe farmers could still use the fallow system.
In 1976, the government encouraged the implementation of production programmes that combinedthe use of high yielding varieties and increased application of chemical fertilizers. The immediateimpact of the programme is the accelerated attainment of high rice yield per acre. However, inlong-term, the high yields were not sustained because of incomplete provision of supply includingappropriate amounts and combination of chemical fertilizers. This is explained by the fact that highyielding plant varieties take up large amount of nutrient from the soil and the inability to replenish

116
the lost nutrients causes severe nutrient depletion and the corresponding decline in crop production.This situation holds true for perennial crops. A case in point is the practice of low and unbalancedfertilizer use in a continuous cropping in the Upper Delta region and large uptake and export of plantnutrients resulted in a negative soil fertility budget and subsequent loss of soil fertility, decline incrop yields and deterioration of environmental quality.
5. Soil and plant nutrient relationship
Soils are an integral part of the ecological system which serves as natural resource base to supportthe production of our basic food and fiber needs. Soils are the fundamental medium for plant growthand basically act as the storehouse for the water and nutrients essentials for plant growth. In mostinstances, the natural supply of nutrient form the soil remained inadequate to meet the needs of theplant and which therefore threatened the overall supply of food and fiber needs of the country.
The improper cropping systems and cropping patterns which is centered on the increase in the cropdensity per unit area and mono-cropping to compensate for less arable lands caused the increasingdepletion of soil fertility. The inability to formulate balanced fertilizer formula has wide and farreaching impacts on soil fertility characterized by serious nutrient deficiency and the increasingproblems on micronutrient deficiencies as in the increasing incidence of serious zinc deficiency ina continuous irrigated rice growing in the country.
Table 3. Yearly status of crop area and production in Myanmar
Sown area ha ’000 Production mt ’000Crop Name
1988-89 2004-05Increased
1988-89 2004-05Increased
(%) (%)1 Paddy 4 778 7 008 147 2.91 3.60 124
2 Wheat 135 103 76 1.07 1.34 125
3 Maize 138 307 223 1.60 2.67 167
4 Sorghum 177 230 129 0.72 0.79 109
5 Black gram 92 747 813 0.79 1.05 133
6 Green gram 50 787 1 586 0.51 0.91 180
7 Butter bean 34 55 163 1.12 1.06 95
8 Sultapya 35 63 181 0.66 1.03 154
9 Soybean 34 138 402 0.80 1.10 137
10 Chickpea 138 196 142 0.75 1.10 146
11 Pigeon pea 138 553 400 0.78 0.95 122
12 Garden pea 50 787 1 586 0.58 0.96 167
13 Groundnut 548 672 122 0.85 1.36 160
14 Sesame 1 212 1 513 125 0.22 0.38 170
15 Sunflower 212 533 252 0.73 0.69 95
16 Cotton 179 315 176 0.37 0.65 174
17 Jute 49 27 55 1.09 1.02 94
18 Rubber 78 199 256 0.37 0.57 155
19 Sugarcane 50 146 293 50.16 49.42 99
20 Coffee 14 14 103 0.47 0.55 118
21 Potato 14 34 133 8.76 13.04 149
22 Virginia tobacco 2 4 218 5.09 7.06 139
Sr.No.

117
In Myanmar, cereal crop such as paddy and maize are very important not only for local consumptionbut for export. Pulses, oilseed crop, and major group in rice based cropping system accreting to thenature of crop, soil and weather relationship. Other crops needed to be improved to attain foodsecurity and raw materials for industry.
Rice requires a high N input and moderate to high soil fertility. Intensive rice cropping with2-3 crop/year and larger yields results in a risk of depleting the soils reserves of phosphorus andpotassium. The amount of nutrients, particularly P and K, are forever lost by the soil and will needto be considered in fertilizer formulation. Those however, stored in the rice straw that containedlarge amount of K and roots can be recovered as nutrient source depending on whether these arerecycled or plowed back to field or removed from the field for use as animal feed, fuel, or other uses.
The optimal ratio of fertilizer N: P: K to be applied is site/soil specific as it depends on the yieldtarget and the supply of each nutrient from soil indigenous sources. Optimal N, P and K uptake atharvest of modern rice varieties:
Plant partN P K
Kg uptake/grain yieldGrain 9 1.8 2
Straw 6 0.8 13
G + S 15 2.6 15
A. Plant nutrient in crop in growing soil
In 1992, soil samples were collected from different states and division of the country. These sampleswere comprehensively analysed for their chemical contents in Agricultural Research of Finland. Theresults of the analysis showed that:
● 30 percent of all soil samples have lower pH 5.5 and these are acidic soil. Most of the soilsin Myanmar are suitable for crop growing.
● Organic matter content is low and most of the paddy lands are deficient in phosphatenutrients and 70 percent of which are very low condition. Bago division, Yangon,Ayeyarwaddy (Delta), Mandalay, Sagaing, Magwe division and Mon and Yakhaing Stateshave very low phosphorus status. In 50 percent of soils, potassium also low and very lowcondition and the rest 40 percent is moderate.
● Zn deficiency occurred in Mandalay, Bago west and Ayeyarwaddy (Zn content low andvery low condition).
● S and Boron deficiency break down is 70-80 percent of the total growing soil. Especially,in oil palm growing area, Boron deficiency is very serious.
B. Nutrient loss
The nutrient loss and increasing soil infertility in Myanmar are attributed to the following situations:
● Soil erosion by water
● Acidic soil problem in high rainfall areas such as mountainous regions. In this condition,P is fixed and unavailable for plant use and the Al, Mn and Fe could have reached toxiclevels for some plants.

118
● Soil degradation and depletion of soil fertility by wind erosion in dry zone area. (In theseregions, not only less rainfall but parent material, groundwater table result in salinityproblem and nutritional imbalance.)
● Traditional farming such as shift cultivation, lack of proper agronomic practices, forestburning and more crop production in low fertility land without fertilizer induces the soilfertility depletion and even increased the risks to the natural environment.
● Poverty and soil fertility reduction: Most of the farmers in Myanmar are resource poor andbasically depend on the indigenous nutrient of the soil and natural fertilizer for cropproduction. They simply can not afford to buy fertilizers especially under current increasesin the cost of fertilizer such as Urea, TSP, MOP.
C. Nutrient deficiency
As the typical crop is paddy, its growing areas cover about 62 percent of the net grown area wheremajor nutrient N, P deficiencies and minor nutrient Zn, S deficiencies are greater.
N deficiency
Nitrogen deficiencies occurs in all of the major rice growing regions area (Ayeyarwaddy, Bago,Mandalay Division and Dry Zone areas) caused by low fertilizer use efficiency (Losses fromvolatilization, denitrification, in correct timing and placement, leaching or run off and temporarilyimmobilized by soil microbes.) and very low organic matter content, poor indigenous N supply andalkaline and calcareous soils. In Myanmar, farmers utilize Urea fertilizer as sources of N. N affectsall parameter of plant growth that contributes to yield. N reaction related to the demand for othernutrients such as P, K and S.
P deficiency
P deficiency rarely occurs in rice growing regions except acid soil, acid sulphate soil saline and sodicsoil, peat in dry zone soil area and in coastal regions. Thus, deficiencies cannot affect economicyield target. Low indigenous soil P, supplying insufficient application of mineral P fertilizer, high Pfixation capacity in soil or erosion losses and crop establishment in direct seeded rice growing areaswhere plant density is high and root system are shallow occurs P deficiencies. The farmers used toapply chemical fertilizer such as only Urea and do not apply P and K fertilizer in long-term,imbalance nutrient occurred and damaged the natural balance of soil and environment.
Zn deficiency
Zn deficiencies largely occur in major rice growing areas especially in irrigated areas. Zincdeficiency generally occur in intensively cropped soils, triple rice crop systems, calcareous, sodic,saline neutral, old acid sulphate soil, peat and sandy soil, highly weathered area. The deficiency iswidely spread in rice growing areas of delta, dry zone and coastal area.
S deficiency
It occurs in dry zone area, many rural areas and irrigated rice-grown areas. In these areas, depletionof soil S is evident because of intensive cropping, use of S free fertilizer, small quantities of SO4
2- inirrigation waters and forest burning. Sandy soils are also prone to S deficiency.

119
Fe deficiency
Fe toxicity affects wide range of the rice growing areas, due to flood occurrence in long time, lowpH, acid condition and poor root oxidation and large Fe+2 concentration. Common feature of Fetoxicity sites are poor drainage and low soil CEC in lowland rice growing areas and highland peatsoils.
6. Activities of integrated nutrient management in Myanmar
Land Use Division and Extension Division of MOAI cooperated in carrying-out the movement ofIntegrated Nutrient Management. The activities include the following:
● Dissemination to the farmers on the proper use of scientific and modern agrotechnique suchus more utilization of chemical fertilizer and organic manure and provision of chemicalfertilizer.
● Laying down the planning of long-term and short-term for soil fertility, prevention of soildegradation and environmental deterioration.
● Implementation of Research and demonstration in soil problem areas.
● Implementation of the soil and nutrient management project and soil conservation methods.
7. Production and utilization of chemical fertilizer and organic manure
Plants obtain their nutrients from two main sources of fertilizer application and indigenous nutrientsin soil. These sources are necessary to be applied in balance ration to the soil. Chemical fertilizer isundoubtedly one of the agricultural inputs to increase the high yield when used in proper time,proper nutrient balance and combination and in adequate amount as needed by specific farm site andplant varieties.
In Myanmar, chemical fertilizer application for paddy crop started in 1956-1957. However, properapplication was adopted in 1978 as part of the package of the IR 8, the first high yielding variety thatsupports the Green Revolution campaign. After 1978, farmers widely used chemical fertilizerbecause of the proven good response to the applied chemical fertilizer by high yielding rice varieties.Government encouraged the farmers to use the chemical fertilizer by subsidizing the prices and byconstructing three (3) Urea Processing Plants with the planned production of about 300 thousandstonnes per years.
Table 4 shows that the highest utilization of chemical fertilizer reached the level of about415 thousand tonnes in 1985 and 1986. This trend was attributed to the implementation of theSpecial High Yield (SHY) Programme adopted by each township in Myanmar. However, after 1986,utilization of chemical fertilizer descended because inability to sustain the support for SHYprogramme. In 1991-1992 with the adoption of summer rice programme, the fertilizer utilizationresumed the positive growth. However, due to the high fertilizer prize, fertilizer utilization onceagain declined after 1995-1996.

120
8. Domestic production of fertilizer
Myanmar established 3 state own factories, which can produce capacity of 425 000 tonnes of Ureaper annum, was constrained by lack of utilities and cost of power generation, which limit thefactories to operate at an annual average of only 46 percent of its capacity. Table 5 shows yearlydomestic production of Urea.
Table 4. Utilization of chemical fertilizer in Myanmar
Fertilizer use in rice cultivation Table equivalent nutrientYear mt (’000) mt (’000)
Urea TSP Potash Others Total N2 P2O5 K2O Total
1985-86 4 907 288 103 24 – 415 132 47 14 193
1991-92 – 137 22 2 – 161 63 10 1 64
1996-97 5 880 163 50 23 27 263 79 27 16 122
1997-98 5 789 94 19 1 3 117 43 8 1 52
1998-99 5 761 124 9 3 – 136 57 4 2 63
1999-2000 6 391 156 33 8 – 197 72 15 5 92
2003-04 157 98 10 – 205 72 45 6 123
Source: MAS planning division (1999-2000).
Ricesown area
’000 ha
Table 5. Domestic production of Urea in Myanmar
YearCapacity Capacity
No. Locationestablished
thousand utilization (%)tonne/annum 1993-94
1 Sale Plant A 1970 70 65(Magwe Division) Plant B 1984 85
2 Kyunchaung 1970 70 57(Magwe Division)
3 Kyawzwa 1985 200 59(Magwe Division)
Total 425 46
Notes: Capacity initialization is based on 330 days.
Source: Agro-chemical News in brief, vol. XVII, No. 3. 1994.
9. Fertilizer import
Since 1990, the government of Myanmar has initialized trade liberalization policies. Owing tothis policy, the government and private sector imported various fertilizers in 2003-2004 shown inTable 6.
10. Fertilizer distribution
After 1990, with initiation of trade liberalization policies, the private sector participated andcompeted with government agencies (e.g. Myanmar Agriculture Service, MAS) in the fertilizerprocurement and distribution. For distribution of fertilizer, MAS was holding its role because of itsstorage facilities and agricultural extension staffs who could reach the grass root level of farmers.Moreover, sometimes MAS’s fixed prices were cheaper than that of private sectors.

121
At present, the private fertilizer trade grows significantly in Myanmar. The local traders mainlyimport Urea fertilizer from Qatar, Iran and Indonesia and phosphates fertilizers from theneighbouring counties like People’s Republic of China and Thailand. Private entrepreneurs put up inthe local market and import fertilizers through borders trade as well as normal trade. In Myanmar,states and division authorities, the member of State Peace and Development Council (SPDC) are alsoresponsible to increase the agriculture production. Some of the regional commanders got fertilizersfrom local entrepreneurs and distribute to farmers in term of after harvest payment with help of MASextension staffs.
11. Soil nutrient budget and nutrient uptake
The results of the study of the Phosphate Potash Institute (PPI) in 1993 showed the soil nutrientbudget and nutrient uptake in Table 7 and the result on the Yearly Nutrient Input and Output studyare shown in Table 8. The study for the fertilizer requirements for Urea, T-Super, and potash areshown in Table 9.
Table 6. Fertilizer import (2003-04, metric tonne)
Sr.Type of fertilizer Border trade Normal trade Total
No.1 Urea 109 506 47 979 157 485
2 T-Super 78 255 19 500 97 755
3 Potash 205 10 000 10 205
4 Compound 25 372 7 516 32 888
5 Ammonium Nitrate 4 159 – 4 159
6 Ammonium Sulphate 435 13 448
7 Foliar Spray – 138 138
8 Others – 440 440
Table 7. Soil nutrient budget and nutrient uptake in Myanmar
CropNutrient uptake (tonne, ’000)
N P2O5 K2O MgO CaOEdible Crop (1) 16.1 18.2 451 140 618 79 87
Fruit 0.7 3.2 30 11 36 5 8
Vegetable 0.2 3.5 13 2 10 2 7
Case Crop (2) – – – – – – –
Perennial Crop (3) 0.5 0.2 3 1 7 1 1
Total 17.5 25.1 497 154 671 87 103
Remark: (1) Paddy, Maize, Soybean, Groundnut, Cassava and Sweet potato; (2) Sugarcane, Tobacco, Coco, Tea,Coffee; (3) Coconut, Oil palm.
Source: PPI Singapore, 1995, FAO, 1994, IFAW-Fertuse.
Sown acre Yield tonne(million) (million)

122
12. Organic fertilizer utilization
The rise in fertilizer prices in Myanmar affected the poor farmers in Myanmar, who have no optionsleft but to depend on the use of any available organic and natural fertilizers. Because of itsaffordability to most resource poor farmers, the expanded uses of FYM become more important inmaintaining crop yields and in sustaining good soil quality and soil fertility. Moreover, Myanmarhas tried to introduce the decomposition technology. The raw materials for compost making werenot enough because of the increasing multi-user demands and uses of crop residues and weeds.
As a part of the campaign to boost organic matter utilization, Myanmar embarked the enhancing ofthe green maturing technique and organic fertilizer production. Notable efforts are done on theSesbania Rostata, one of the many species found to be promising green manure crop by theresearchers in Myanmar. According to research findings, at the seed rate of 22 kg/ha. Sesbaniaplants gives additional equivalent N inputs of 42.5 kg/ha when plowed in at the age of two monthsafter sowing. The researchers likewise recognized a number of practical constraints that preventwidespread acceptance of the sesbania-base green manure technology. This includes area shortagefor seed production, moisture availability, and short duration between crop sequences, need for newimproved cropping pattern and draught power scarcity and many others that affects farmer labouruse and availability. Whatever the case may be, with the persistent yearlong educationalprogrammes, the farmers have started adopting the technology and likewise have improved furthertheir awareness that the use of green manure improves soil structure, its fertility and crop yields.
Currently, organic matter production sites are all over the country and are continuously encouragedby the government. The private sectors and local government are doing their share in the advocacyand promotion organic farming as shown by production of organic fertilizers from wastes of urbanand agro-based industry sectors.
Table 8. Yearly input & output data of soil nutrient in Myanmar
ParameterNutrient input & output, tonne (’000)
N P2O5 K2O MgO CaOInputNatural fertilizer 107 54 143 57 25
Chemical fertilizer 49 14 5 5 15
OutputPlant Nutrient Uptake 497 154 671 87 104
(-341) (-86) (-523) (-25) (-64)
Nutrient RequirementKg/ha 48 12 73 4 9
lb/acre 43 11 65 4 8
Table 9. Yearly fertilizer requirement of Myanmar
Measurement Unit UreaTriplesuper-
Potashphosphate
National tonne (’000) 741 191 871
Per acre lb/acre 43 11 65
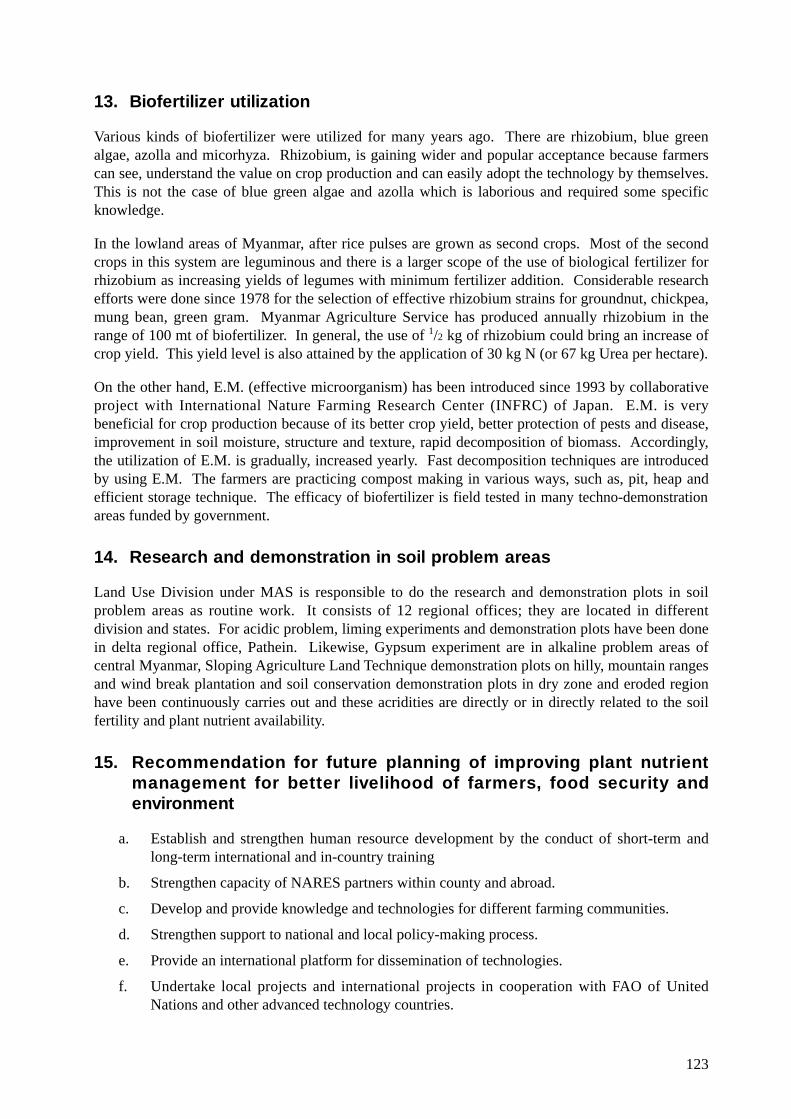
123
13. Biofertilizer utilization
Various kinds of biofertilizer were utilized for many years ago. There are rhizobium, blue greenalgae, azolla and micorhyza. Rhizobium, is gaining wider and popular acceptance because farmerscan see, understand the value on crop production and can easily adopt the technology by themselves.This is not the case of blue green algae and azolla which is laborious and required some specificknowledge.
In the lowland areas of Myanmar, after rice pulses are grown as second crops. Most of the secondcrops in this system are leguminous and there is a larger scope of the use of biological fertilizer forrhizobium as increasing yields of legumes with minimum fertilizer addition. Considerable researchefforts were done since 1978 for the selection of effective rhizobium strains for groundnut, chickpea,mung bean, green gram. Myanmar Agriculture Service has produced annually rhizobium in therange of 100 mt of biofertilizer. In general, the use of 1/2 kg of rhizobium could bring an increase ofcrop yield. This yield level is also attained by the application of 30 kg N (or 67 kg Urea per hectare).
On the other hand, E.M. (effective microorganism) has been introduced since 1993 by collaborativeproject with International Nature Farming Research Center (INFRC) of Japan. E.M. is verybeneficial for crop production because of its better crop yield, better protection of pests and disease,improvement in soil moisture, structure and texture, rapid decomposition of biomass. Accordingly,the utilization of E.M. is gradually, increased yearly. Fast decomposition techniques are introducedby using E.M. The farmers are practicing compost making in various ways, such as, pit, heap andefficient storage technique. The efficacy of biofertilizer is field tested in many techno-demonstrationareas funded by government.
14. Research and demonstration in soil problem areas
Land Use Division under MAS is responsible to do the research and demonstration plots in soilproblem areas as routine work. It consists of 12 regional offices; they are located in differentdivision and states. For acidic problem, liming experiments and demonstration plots have been donein delta regional office, Pathein. Likewise, Gypsum experiment are in alkaline problem areas ofcentral Myanmar, Sloping Agriculture Land Technique demonstration plots on hilly, mountain rangesand wind break plantation and soil conservation demonstration plots in dry zone and eroded regionhave been continuously carries out and these acridities are directly or in directly related to the soilfertility and plant nutrient availability.
15. Recommendation for future planning of improving plant nutrientmanagement for better livelihood of farmers, food security andenvironment
a. Establish and strengthen human resource development by the conduct of short-term andlong-term international and in-country training
b. Strengthen capacity of NARES partners within county and abroad.
c. Develop and provide knowledge and technologies for different farming communities.
d. Strengthen support to national and local policy-making process.
e. Provide an international platform for dissemination of technologies.
f. Undertake local projects and international projects in cooperation with FAO of UnitedNations and other advanced technology countries.
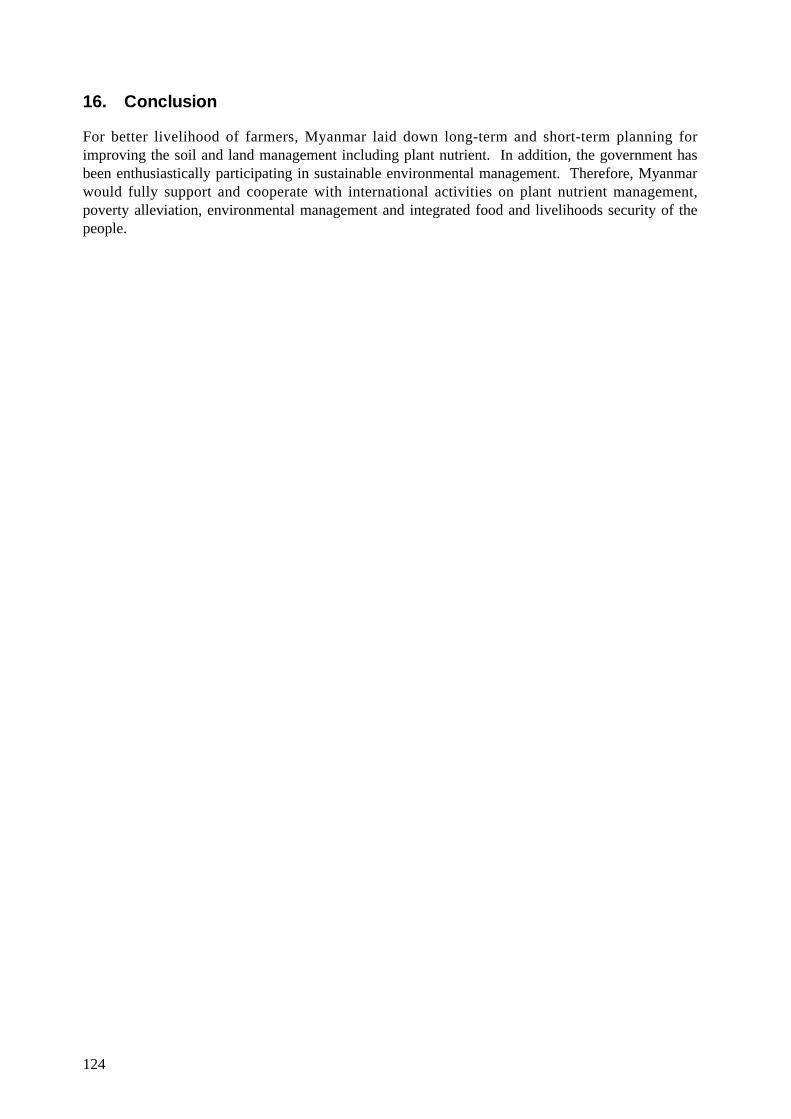
124
16. Conclusion
For better livelihood of farmers, Myanmar laid down long-term and short-term planning forimproving the soil and land management including plant nutrient. In addition, the government hasbeen enthusiastically participating in sustainable environmental management. Therefore, Myanmarwould fully support and cooperate with international activities on plant nutrient management,poverty alleviation, environmental management and integrated food and livelihoods security of thepeople.