improving long term evolution network signal quality using...
TRANSCRIPT
American Journal of Mobile Systems, Applications and Services
Vol. 4, No. 2, 2018, pp. 6-12
http://www.aiscience.org/journal/ajmsas
ISSN: 2471-7282 (Print); ISSN: 2471-7290 (Online)
* Corresponding author
E-mail address:
Improving Long Term Evolution Network Signal Quality Using Resource Block Allocation
Eli-Chukwu Ngozi Clara1, *, Onoh Greg Nwachukwu2
1Department of Electrical & Electronics Engineering, Alex Ekwueme Federal University Ndufu-Alike, Ebonyi State, Nigeria
2Department of Electrical & Electronics Engineering, Enugu State University of Science and Technology, Enugu State, Nigeria
Abstract
With every passing day, the importance and number of people that uses data services experiences a geometrical growth. From
product survey and testing, marketing and advertisement of products, online sales and purchase of products, execution of
employee training and development programs, multimedia conferencing, advance research programs and the likes, the use of
Long Term Evolution (LTE) technology has no limit. But all these afore-mentioned merits are marred by poor network signal
quality which is an integral part in measuring the network Quality of Service (QoS). To improve the network signal quality
using block call allocation, data traffic sessions (drive test) were conducted in Port-Harcourt cluster for the existing LTE
networks daily for twelve (12) weeks using a pre-defined test route. Result showed a network signal quality improvement of
13.02% and 25.87% for 1 and 2 units rise in the allocated Resource Blocks (RBs) respectively.
Keywords
LTE, QoS, Data Traffic Sessions, Network Signal Quality, Resource Blocks
Received: June 13, 2018 / Accepted: July 6, 2018 / Published online: August 31, 2018
@ 2018 The Authors. Published by American Institute of Science. This Open Access article is under the CC BY license.
http://creativecommons.org/licenses/by/4.0/
1. Introduction
With every passing day, the importance and number of
people that uses data services experiences a geometrical
growth. From product survey and testing, marketing and
advertisement of products, online sales and purchase of
products, execution of employee training and development
programs, multimedia conferencing, advance research
programs and the likes, people appreciate and yarn for faster
data service with optimum reception of images and videos
that were transferred. The introduction of Long Term
Evolution (LTE) is to serve as an improvement on the
performance of Wideband Code Division Multiple Access
(WCDMA) in terms of speed and quality. With this high
expectation of subscribers of the LTE technology, the design,
planning, deployment of equipment and its overall service
should curtail congestion, possess small response time with
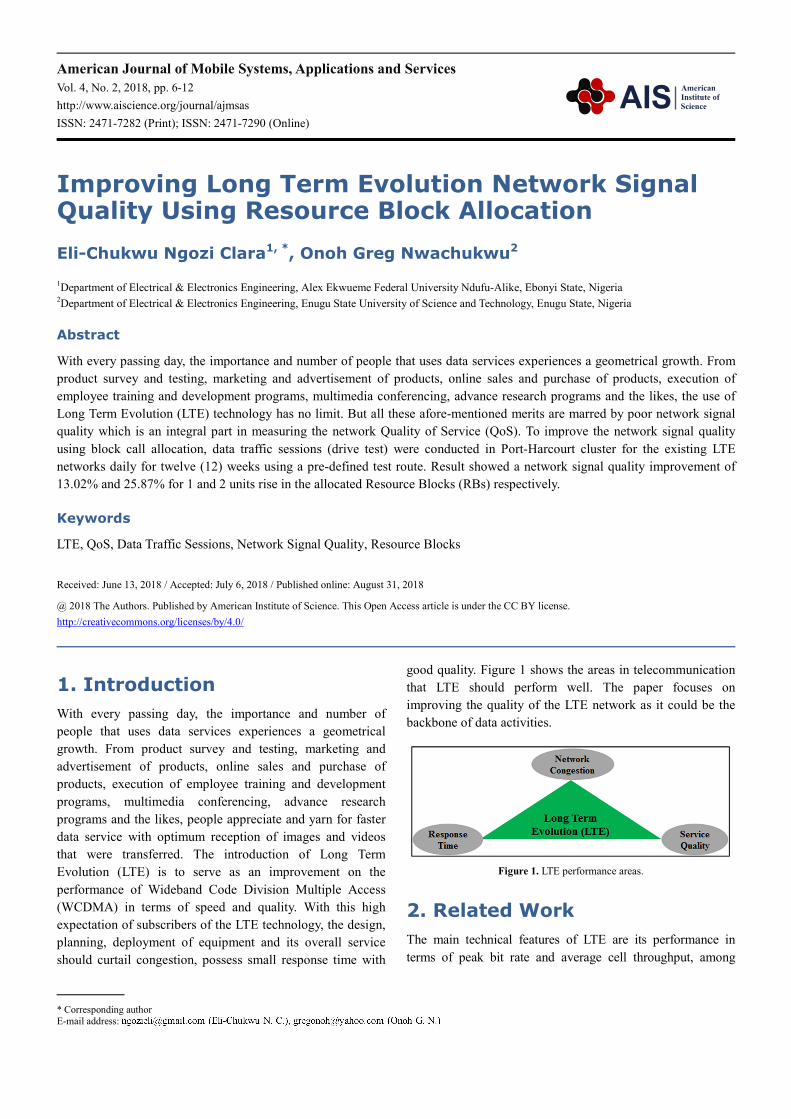
good quality. Figure 1 shows the areas in telecommunication
that LTE should perform well. The paper focuses on
improving the quality of the LTE network as it could be the
backbone of data activities.
Figure 1. LTE performance areas.
2. Related Work
The main technical features of LTE are its performance in
terms of peak bit rate and average cell throughput, among

7 Eli-Chukwu Ngozi Clara and Onoh Greg Nwachukwu: Improving Long Term Evolution Network Signal
Quality Using Resource Block Allocation
others. LTE entails a great technological improvement as
compared with the WCDMA [1]. The most popular mobile
application is the video streaming in the application of
multimedia. The above task is achievable by means of
developing the LTE (Long Term Evolution) in the world of
mobile. With low latency and high data rates in the
applications of multimedia the effective services is provided by
the LTE technology features [2]. This technological
improvement can be affected by various antenna parameters on
the downlink performance. Cell coverage and capacity in
different macro-cellular network scenarios for various
combinations of antenna parameter configurations determines
the Signal to Interference Noise Ratio (SINR) performance and
cell throughput [3]. During radio resources allocation,
transmitters may cause significant amount of interference to
the cellular network. Such interference can be avoided or
reduced if the radio resources are allocated intelligently with
the coordination from the eNodeB [4]. The four basic Radio
Resource Management (RRM) measurements in Long Term
Evolution (LTE) system are Channel Quality Indicator (CQI),
Reference Signal Received Power (RSRP), Reference Signal
Received Quality (RSRQ), and Carrier Received Signal
Strength Indicator (RSSI). A measurement of channel quality
represented by Signal to Interference plus Noise Ratio (SINR)
is used for link adaptation along with packet scheduling,
whereas RSRP and RSRQ are needed for making handover
decision during intra-eUTRAN (evolved Universal Terrestrial
Random Access Network) handover in LTE [5]. The
performance of an LTE network can be measured considering
the head of line delay, probability of packet loss and the delay
threshold for different types of data [6]. The overall network
performance can also be measured in terms of mobility. A self-
optimizing algorithm tunes the handover parameters of the
LTE system to diminish negative effects such as service drops
[7]. With higher mobility, the various network performance
parameters like signal to interference to noise ratio,
throughput, received signal strength indicator etc. get affected
[8]. There are two kinds of handover algorithms that adjust the
handover (HO) parameters of LTE (Long-Term Evolution)
eNodeB (evolved NodeB) to improve the overall network
performance and diminish negative effects [9]. During data
traffic session, parameters tend to fade as the UE gets to areas
of poor or limited coverage. The signal coverage and capacity
of the system are improved through antenna tilting [10]. With
the radio capacity and expected output, the usage of LTE
technology will definitely be affected by congestion. Hence,
the challenge of scheduling user transmissions on the downlink
system should be addressed. Embedding a multiuser scheduler
with Proportional Fairness (PF) can be used to effectively
schedule resource among User Equipment (UE). Numerical
results show that the PF scheduler provides a superior fairness
performance with a modest loss in throughput, as long as the
user average SINRs are fairly uniform. A suboptimal PF
scheduler can also be considered, as it has a much lower
complexity at the cost of some throughput degradation [11].
One of the challenges to be handled by LTE is the quality of
transmitted signals. A gain control scheme/strategy maximizes
SINR and reduces the transmit power [12]. The User
Equipment (UE) reports Channel Quality Indicator (CQI)
values depending on a linear mapping function from effective
Signal to Noise Ratio (SNR). The reported CQI value gives a
corresponding Modulation and Coding Scheme (MCS) and
data throughput [13]. With the ever-growing subscriber
database of the technology, LTE is currently being upgraded
with the aim of doubling the capacity over High-Speed Packet
Access (HSPA). It is sensitive to inter-cell interference and as
such the power control becomes decisive to provide the
required SINR, while controlling at the same time the
interference caused by neighbouring cells [14]. Signal quality
and strength, temporal and network operator factors are all
essential in modelling the performance of an LTE system [15].
The aim of this paper is to model signal quality performance
in LTE and propose parameter adjustment on parameters that
influences signal quality.
3. Research Procedure
The research aims at improving signal quality in LTE using
mathematical models. The network is studied to understand
various signal quality parameters, their impact on the
network and various parameter adjustments to improve the
overall signal quality.
3.1. Data Collection of Signal Quality
Parameters
A telecommunication data collection technic called drive test
was used to collect LTE data from three (3) operators in
Nigeria as shown in Figure 2.
Figure 2. LTE drive test setup.
American Journal of Mobile Systems, Applications and Services Vol. 4, No. 2, 2018, pp. 6-12 8
The drive test setup uses Testing Equipment for Mobile
System (TEMS) software version 16.0.3, 3 TEMS phones
(Samsung S5), a Global Positioning Service (GPS) and a
power inverter. Files of equal sizes were downloaded from a
dedicated server while the car goes through the defined
routes. The test route covers the urban areas in Port-Harcourt,
Nigeria and it was for a period of 12 weeks.
3.1.1. Signal Quality Parameters
In LTE, the Reference Signal Received Quality (RSRQ) is
the parameter used by the system to report the quality of the
transmitted or received signal. The RSRQ is an important
parameter for measuring a cell, site and an entire network
(LTE) performance as it helps the User Equipment (UE) to
perform functions such as cell reselection and handover.
���� =����� ∗ ����
��� (1)
_ _ _ _All
RB Number of resource blocks allocated=
The process of reporting transmitted signal quality in LTE goes
through some mathematical process and as such, some parameters
combine to give the signal quality. These parameters are:
RSRP
The Reference Signal Receive Power (RSRP) is the linear
average of reference signal power (in dB) across the
specified bandwidth. As Rx-level and RSCP denotes the
signal coverage of GSM and WCDMA respectively, the
RSRP is her equivalent in LTE. The quality of any signal can
be measured only when signals are transmitted and signals
are only transmitted when there is network coverage.
From eqn. 1, ���� =���� ∗ ���
����� (2)
SINR
When signals are transmitted, the quality of the signal upon
reception tends to fade or degrade. This could be as a result
of interference (channels or cells) or noise in the tested area.
The Signal-to-Interference Noise Ratio is the ratio of
measured usable signal power to the summation of the
average interference power from the other channels or cells
and the background noise.
SINR = 10log(λ*NS) + RSRQ (3)
NS = 12subscribers/Resource Block (RB)
λ = α * β-1
Reference_signalα = and
_ _ _ ( )Physical Downlink Shared Channel PDSCHβ =
Hence, SINR = 10log(12λ) + RSRQ (4)
SNR
The Signal-to-Noise Ratio is a KPI that compares the desired
signal to the level of background noise in the system.
SNR = RSRQ(λ * NS) (5)
RSSI
The Received Signal Strength Indicator is the entire received
power including the wanted power from the serving cell as
well as all co-channel power and other sources of noise.
From eqn. 1, ���� =�����∗ ����
���� (6)
Resource Block (RB)
This is the smallest unit of resource that is allocated to a user
during traffic session. During traffic session, the UE requests
for RBs based on the data service it wants to perform.
Let BW
C =Channel Bandwidth,
/SC uN =Number of Subcarrier/User
SCF =Frequency of Subcarrier and
RqRB =Number of Resource Block Requested
���� =���
���/�∗��� (7)
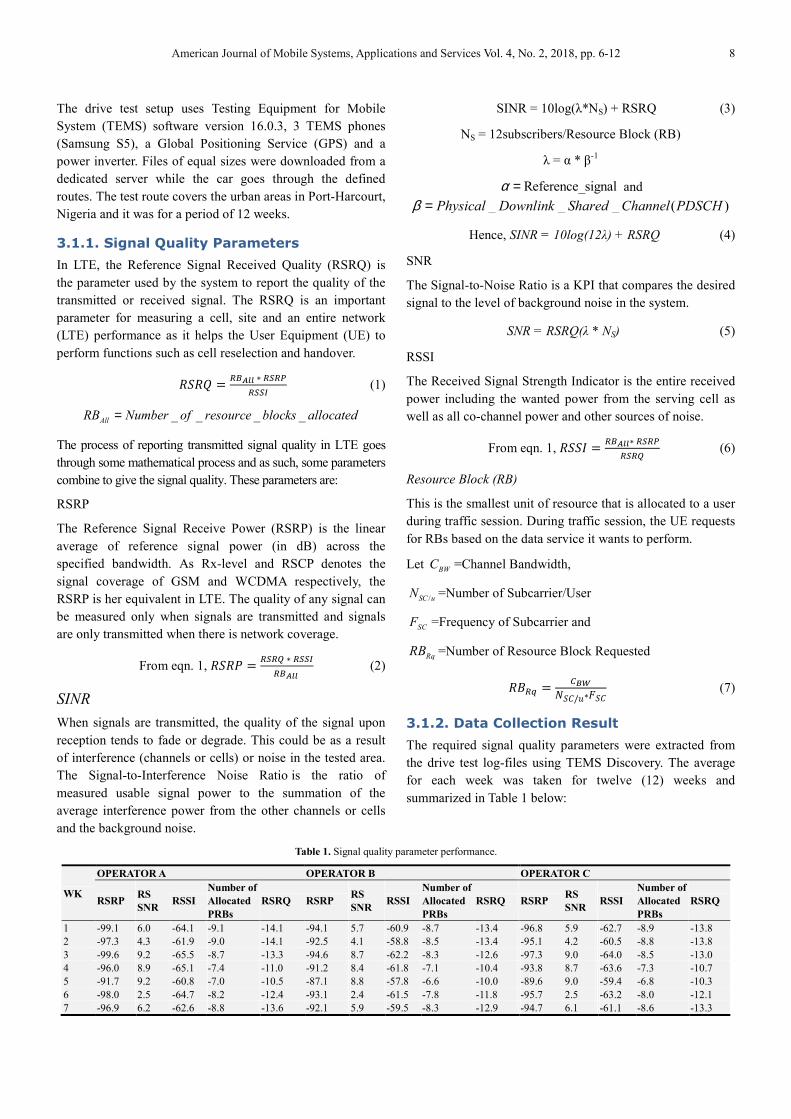
3.1.2. Data Collection Result
The required signal quality parameters were extracted from
the drive test log-files using TEMS Discovery. The average
for each week was taken for twelve (12) weeks and
summarized in Table 1 below:
Table 1. Signal quality parameter performance.
WK
OPERATOR A OPERATOR B OPERATOR C
RSRP RS
SNR RSSI
Number of
Allocated
PRBs
RSRQ RSRP RS
SNR RSSI
Number of
Allocated
PRBs
RSRQ RSRP RS
SNR RSSI
Number of
Allocated
PRBs
RSRQ
1 -99.1 6.0 -64.1 -9.1 -14.1 -94.1 5.7 -60.9 -8.7 -13.4 -96.8 5.9 -62.7 -8.9 -13.8
2 -97.3 4.3 -61.9 -9.0 -14.1 -92.5 4.1 -58.8 -8.5 -13.4 -95.1 4.2 -60.5 -8.8 -13.8
3 -99.6 9.2 -65.5 -8.7 -13.3 -94.6 8.7 -62.2 -8.3 -12.6 -97.3 9.0 -64.0 -8.5 -13.0
4 -96.0 8.9 -65.1 -7.4 -11.0 -91.2 8.4 -61.8 -7.1 -10.4 -93.8 8.7 -63.6 -7.3 -10.7
5 -91.7 9.2 -60.8 -7.0 -10.5 -87.1 8.8 -57.8 -6.6 -10.0 -89.6 9.0 -59.4 -6.8 -10.3
6 -98.0 2.5 -64.7 -8.2 -12.4 -93.1 2.4 -61.5 -7.8 -11.8 -95.7 2.5 -63.2 -8.0 -12.1
7 -96.9 6.2 -62.6 -8.8 -13.6 -92.1 5.9 -59.5 -8.3 -12.9 -94.7 6.1 -61.1 -8.6 -13.3

9 Eli-Chukwu Ngozi Clara and Onoh Greg Nwachukwu: Improving Long Term Evolution Network Signal
Quality Using Resource Block Allocation
WK
OPERATOR A OPERATOR B OPERATOR C
RSRP RS
SNR RSSI
Number of
Allocated
PRBs
RSRQ RSRP RS
SNR RSSI
Number of
Allocated
PRBs
RSRQ RSRP RS
SNR RSSI
Number of
Allocated
PRBs
RSRQ
8 -96.3 5.7 -65.3 -9.4 -13.9 -91.5 5.5 -62.0 -8.9 -13.2 -94.1 5.6 -63.8 -9.2 -13.6
9 -107.8 9.3 -63.5 -7.5 -12.8 -102.5 8.9 -60.3 -7.2 -12.2 -105.4 9.1 -62.0 -7.4 -12.5
10 -88.5 14.4 -58.1 -6.4 -9.8 -84.1 13.7 -55.2 -6.1 -9.3 -86.5 14.0 -56.8 -6.3 -9.6
11 -93.3 10.0 -62.7 -6.8 -10.2 -88.6 9.5 -59.6 -6.5 -9.7 -91.1 9.8 -61.3 -6.7 -9.9
12 -102.3 9.2 -72.6 -7.0 -9.9 -97.2 8.8 -69.0 -6.7 -9.4 -100.0 9.0 -70.9 -6.9 -9.7
From the data collection result in table 1 above, it is obvious
that the signal quality of the operators in the tested area falls
short in performance which led to longer latency and low
data throughput. Although the signal coverage (RSRP) and
signal strength (RSSI) negatively affected the signal quality,
in this research, interest is in the physical resource block and
how it affects the signal quality. Figures 3, 4, 5 and 6 shows
the relationship between the various radio quality parameters
and the network signal quality.
Figure 3. Radio quality parameter (RSRP) and Signal quality (RSRQ) performance chart.
The mean signal quality and referenced signal receive power
during the test period was -11.83 and -94.87 respectively. The
RSRP has a very weak relationship of 0.183 with the overall
system transmitted quality. Hence, eqn. 8 estimates the signal
quality given the Signal Quality Parameter (SQP) where ie ’s
are the errors.
RSRQ = β0 + (β1 * SQP) +1/��∑ � !" #$ (8)
RSRQ = 1.352 + (0.139* RSRP) (9)
Figure 4. Radio quality parameter (RS SNR) and Signal quality (RSRQ) performance chart.

American Journal of Mobile Systems, Applications and Services Vol. 4, No. 2, 2018, pp. 6-12 10
The mean signal quality and referenced signal signal-to-noise
ratio during the test period was -11.83 and 7.73 respectively.
There is a positive relationship of 0.464 between the RS SNR
the overall system transmitted quality. Such that any form of
improvement on RS SNR value improves the system’s
quality performance. Using eqn. 8,
RSRQ = -14.793 + (0.383 * RS SNR) (10)
Figure 5. Radio quality parameter (RSSI) and Signal quality (RSRQ) performance chart.
The mean signal quality and referenced signal strength indicator during the test period was -11.83 and -62.36 respectively.
There is no relationship between the RSSI and the overall system transmitted quality.
RSRQ = -10.833 + (0.016 * RSSI) (11)
Figure 6. Radio quality parameter (Allocated Resource Blocks) and Signal quality (RSRQ) performance chart.
The mean signal quality and allocated resource block during
the test period was -11.83 and -8 respectively. There is a very
strong relationship of 0.911 between the allocated resource
blocks and the overall system transmitted quality. An
increase in the allocated resource block will improve the
network signal quality.
RSRQ = -3.467 + (1.602 * PRBsall(i)) (12)
3.2. Research Target
LTE channel bandwidth is ≥ 3MHz and applying eqn. 7, the
least requested physical resource block is 15RBs. From the
drive test log-files and parameters extracted, the signal
quality of the considered operator in the first two weeks
particularly operator A requires optimization. The research
aims at improving network signal quality through the

11 Eli-Chukwu Ngozi Clara and Onoh Greg Nwachukwu: Improving Long Term Evolution Network Signal
Quality Using Resource Block Allocation
allocation of resource blocks.
4. Result and Analysis
The drive test log-files show some degree of relationship
between the signal quality and the allocated resource blocks.
When there is an increase in the number of allocated resource
block, the reported signal quality from the UE improves.
Figures 7 and 8 shows the signal quality performance when
the allocated resource block is increased by 1 and 2 units
respectively with the same radio environment from the log-
file collected and discussed in section 3.1
Figure 7. Signal quality parameter performance chart.
RSRQTunning A = -0.665 + (1.423 * PRBsall) (13)
A unit increase in the allocated resource block gives a mean signal quality of -10.29.
Figure 8. Signal quality parameter performance chart.
RSRQTunning B = -0.628 + (1.413 * PRBsall) (14)
Increasing the allocated resource block by 2 units gives a
mean signal quality of -8.77.
With the above, it is conclusive to say that an increase in the
allocated resource block size will lead to an improved
network signal quality. From the test performed and
discussed in section 3.1, the maximum allocated resource
block is 9 and with an increase of 2 units, the proposed
allocated resource block is 11 < 15 the available resource
block.
5. Conclusion
In the Nigerian telecommunication industry, LTE (4G)

American Journal of Mobile Systems, Applications and Services Vol. 4, No. 2, 2018, pp. 6-12 12
technology is the latest deployment in some urban areas to
cushion the effect of low data throughput during data traffic
sessions resulting from poor network signal quality. The
research considered the importance of resource blocks
allocation during data traffic sessions as it affects the network
signal quality performance. Result showed a network signal
quality improvement of 13.02% and 25.87% for 1 and 2 units
rise in the allocated resource blocks respectively.
Hence, designing a more robust resource block scheduling
algorithm or allocation technique should be considered in
future research.
Competing Interests
The authors declare that they have no competing interests.
Original Manuscript
The authors declare that the manuscript is original and the
data contained herein are authentic
The authors assure that all data used for the manuscript are
properly acknowledged and the manuscripts is only
submitted to this journal.
Acknowledgements
The authors are thankful to Mr. Chika Albert, an optimization
Engineer with the network operator who provided us with
cell ref to enable us carryout the real rime measurement of
the network environment. We also appreciate the chief editor
and the anonymous reviewers that will painstakingly take
their time to review this paper.
References
[1] Martin-Sacristan D, et al (2009): On the way towards 4th-generation mobile: 3GPP LTE and LTE-advanced, EURASIP Journal on Wireless Communication and Networking 2009.
[2] Thilagavathi J. and Meena K (2014): Assessment of Quality-of-Experience for Video Streaming over LTE Network. International Journal of Computer Science and Information Technology & Security (IJCSITS), ISSN: 2249-9555 Vol. 4, No. 1, February 2014.
[3] Osman N. C, Seppo H, Jyri H, (2010): Analysis of antenna parameter optimization space for 3GPP LTE, Institute of Electrical Electronics Engineering 2010.
[4] Zulhasnine M, Huang C, Srinivasan A, (2010): Efficient resource allocation for device-to-device communication underlaying LTE network, Institute of Electrical Electronics Engineering 2010.
[5] Afroz F. et al (2015): SINR, RSRP, RSSI AND RSRQ measurements in Long Term Evolution networks.
International Journal of Wireless & Mobile Networks (IJWMN) Vol. 7, No. 4, August 2015.
[6] Chayon H. R et al (2017): An Improved Radio Resource Management with Carrier Aggregation in LTE Advanced. Applied Science Vol. 7, No. 394, April 2017.
[7] Thomas J, Irina B, John T, Ingrid M, Thomas K, (2010): Handover parameter optimization in LTE self-organizing networks, Institute of Electrical Electronics Engineering 2010.
[8] Parikh J and Basu A. (2016): Effect of Mobility on SINR in Long Term Evolution Systems. ICTACT Journal on Communication Technology, March 2016, Volume: 07, Issue: 01.
[9] Luan L. et al (2012): Optimization of Handover Algorithms in LTE High-speed Railway networks. International Journal of Digital Content Technology and its Applications (JDCTA) Volume 6, Number 5, March 2012.
[10] Harald E, Siegfried K, Marcus G, (2011): Vertical antenna tilt optimization for LTE base stations, Institute of Electrical Electronics Engineering 2011.
[11] Kwan R, Leung C, Zhang J, (2009): Proportional fair multiuser scheduling in LTE, pp 461 – 464, Institute of Electrical Electronics Engineering 2009.
[12] Rihonen T, Werner S, Wichman R, (2009): Optimized gain control for single-frequency relaying with loop interference, Institute of Electrical Electronics Engineering 2009.
[13] Xiaowen L, Qianjun F, Liuwei S, (2011): An effective SINR link to system mapping method for CQI feedback in TD-LTE system, Institute of Electrical Electronics Engineering 2011.
[14] Castellanos U. C, et al (2008): Performance of uplink fractional power control in UTRAN LTE, Institute of Electrical Electronics Engineering 2008.
[15] Cainey J et al (2014): Modelling Download Throughput of LTE Networks. 10th IEEE International Workshop on Performance and Management of Wireless and Mobile Networks.
Biography
Ngozi Eli-Chukwu received a Bachelor of
Engineering (B. ENG) degree in Electrical
and Electronics in 2003 and a Masters of
Engineering (M.ENG) in Communication
Systems Engineering in 2008 from Enugu
State University of Science and Technology
Nigeria. She has a Post Graduate Diploma
(PGD) degree in Project Management in 2015 from University of
Liverpool, London. She is a lecturer at Alex Ekwueme Federal
University, Ndufu-Alike, Ikwo, Ebonyi State, Nigeria. She is
currently pursuing her Ph.D. degree in the same field, but
specializing in Communication Engineering. Her current research
interest includes: Internet of Thing, cognitive communication,
QoS, wireless sensor networks.