improving home care financials with lean six sigma
TRANSCRIPT

Improving Home Care Financials with Lean Six Sigma
Rebecca Kjonegaard, MSN, RN, CICLean Six Sigma Black Belt

Integrated Delivery System
79,674 annual discharges
2,060 licensed beds
14,749 employees
2,600 physicians
2,764 volunteers
$2.1 billion in annual revenues
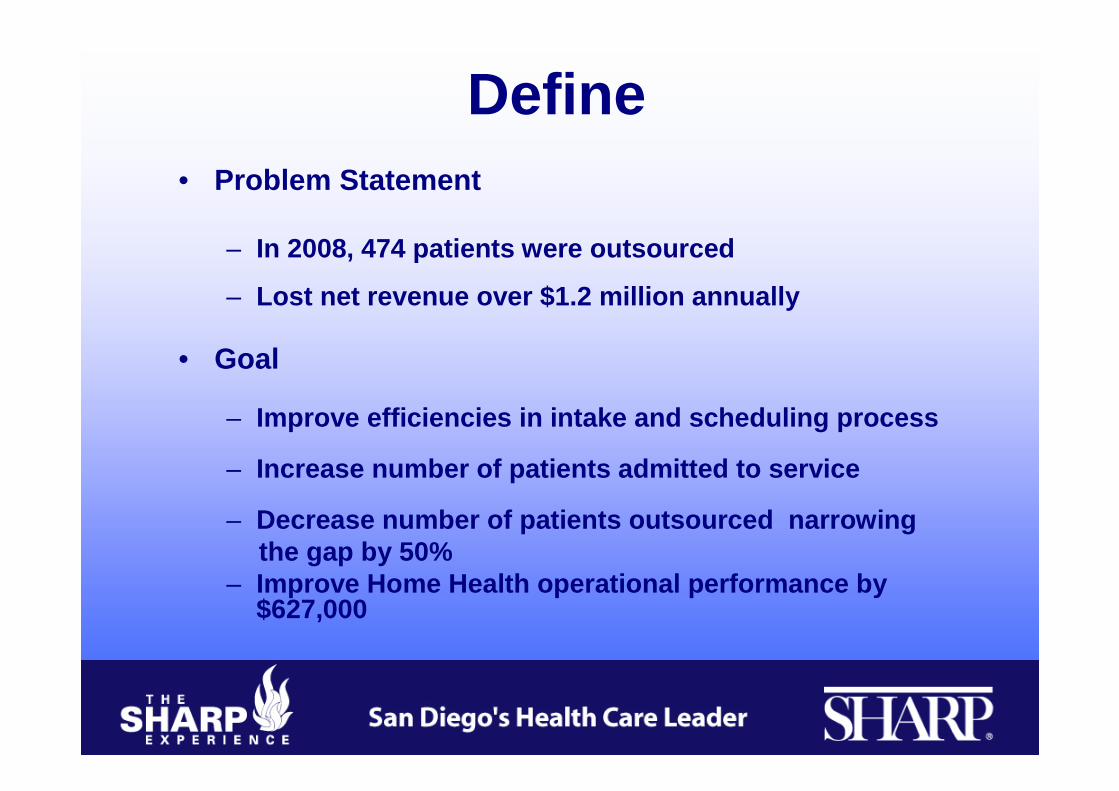
• Problem Statement
– In 2008, 474 patients were outsourced
– Lost net revenue over $1.2 million annually
• Goal
– Improve efficiencies in intake and scheduling process
– Increase number of patients admitted to service
– Decrease number of patients outsourced narrowing the gap by 50%
– Improve Home Health operational performance by $627,000
Define

Key Project Metrics• Outsourced
– 69,237 DPMO– 2.9 sigma– 7% of our business is outsourced– Goal: Reduce by 50%
• Not seen within 48 hours– 194,594 DPMO– 2.3 sigma– 19.5% non-compliant– Goal: Reduce by 50%

MeasureIntake-Scheduling Process
Current State
Excessive delay due to clerk placing worksheet in bin and intake staff selectively working referrals
Overall time 42 hrs

18% of our patients are not seen within the 48 hour state requirement
Measure48 hour Target
02468
101214161820
48 hour
Per
cent
of C
ases
Exc
eedi
ng 4
8 ho
ur
18% (23/130)
Good

Analyze
Delay in Intake –Scheduling process
Scheduling
Workflow
Referrals
Fax not taken off of Fax immediately
Inappropriate referral
Incomplete referrals
Too many different forms/worksheets that intake/liaison has to fill out, etc.
Nurse does not have the skills so cannot see patient
Not syncing timely, schedules not showing up
Schedules not entered, not current
Too many different computer program sources that intake/liaison has to look through
Not getting back to a patient I’ve seen before, someone else is starting from scratch
Not enough staff later in the week

21% of referrals are not admitted which are determined at the end of the intake process – accounts for 14% hours spent on non-admitted cases
AnalyzeNot Admitted During Intake in the
Office March 2009
0
5
10
15
20
25
Not Admitted During Intake Process
perc
ent n
ot a
dmitt
ed
21% (27/130)
Good

Analyze
5% not admitted when the clinician visits the patient to admit for Home Health services – accounts for 5.6% hours spent on non-
admitted cases
Not Admitted in the FieldMarch 2009
0
1
2
3
4
5
6
Not Admitted in Field
Per
cent
Not
Adm
itted
5% (7/130)
Good

The Home Health Intake Department receive the highest number of referrals on Wednesday
Day of Week Referral Received in March 2009
0
5
10
15
20
25
30
35
40
Sun Mon Tue Wed Thur Fri Sat
Day of Week
Num
ber
of r
efer
rals
Analyze

Schedule of Nurse and PT March 2009
More staff scheduled at beginning of week inconsistent with referrals and patients being admitted
Analyze

Both Nursing and Physical Therapist have low compliance with syncing twice a day
Percent Sync in February 2009
0%
10%
20%
30%
40%
50%
60%
Nurse and PT
Per
cent
Syn
c%Nurse sync
%PTsync
39%(104/265)
49% (237/484)
Good
Analyze
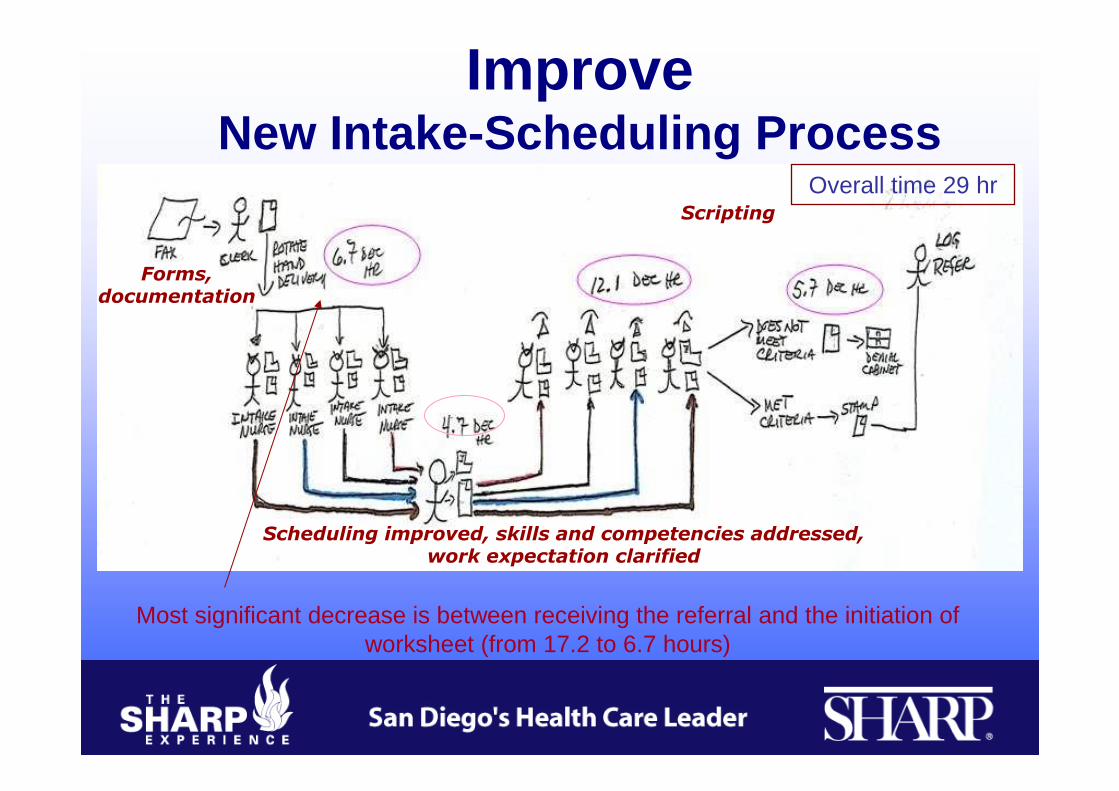
ImproveNew Intake -Scheduling Process
Most significant decrease is between receiving the referral and the initiation of worksheet (from 17.2 to 6.7 hours)
Forms,documentation
Scheduling improved, skills and competencies addressed,work expectation clarified
Scripting
Overall time 29 hr

Total Time for Intake Process
Comparing the baseline and remeasure the Mann-Whitney Test indicated statistical significance with a p value .0033
Baseline
March 2009Remeasure
April 2009
Improve

Not statistically significant between March and April
Comparing March and June the Two Proportions test indicated statistical significance with a p value <0.05
48 hour TargetMarch, April, June
0
5
10
15
20
25
30
March April June
Month
Pec
ent o
utsi
de o
f 48
hour
18% (23/130)
24% (13/55)
6%
( 4/65)
Good
Improve

Not statistically significant between March and AprilNot statistically significant between March and June
but trending in the right direction
Not Admitted To Service During IntakeMarch, April, June 2009
0
5
10
15
20
25
30
March April June
Month
Per
cent
not
adm
itted
21%
(27/130)22%
(12/55)23%
(15/65)
Good
Improve

Not statistically significant between March and AprilNot statistically significant between March and June
but trending in the right direction
Not Admit in the FieldMarch, April, June 2009
0
5
10
15
20
25
30
March April June
Month
Per
cent
not
adm
it
5% (7/130)
9%
(5/55) 3%(2/65)
Good
Improve

Sponsor Improves
• Staffing patterns• Staff skills and competency• Education for referring agencies

In March the most referrals received on WednesdayIn June the most referrals received on Thursday
Both are inconsistent with staff schedule
Week Day Referral Received March and June 2009
0
10
20
30
40
50
Mon Tue Wed Thu Fri Sat Sun
Day of the week
Num
ber
of r
efer
rals
March
June
Referrals Received

In both March and June most admissions on Thursday which is inconsistent with staff schedule
Day of Week AdmissionsMarch and June 2009
0
10
20
30
40
50
Mon Tue Wed Thu Fri Sat Sun
Day of Week
Num
ber
of A
dmis
sion
s
March
June
Patient Admissions

Schedule of Nurse and PTRN & PT Schedule for June 09
0
20
40
60
80
100
120
140
160
180
200
Mon Tue Wed Thu Fri Sat Sun
Num
ber
of R
N a
nd P
T
RN
PT
More staff scheduled in beginning of week which is inconsistent with referrals and admissions

Continued low compliance by Nurses and Physical Therapists with syncing twice a day resulting in schedule conflicts
Synchronization Feb and June 2009
0
10
20
30
40
50
60
70
80
90
100
Nursing PT
Per
cent
Syn
c
Feb
June
49%
(237/484)40%
(204/517)
39%
(104/265)39%
(100/255)
Good
Field Staff Synchronization
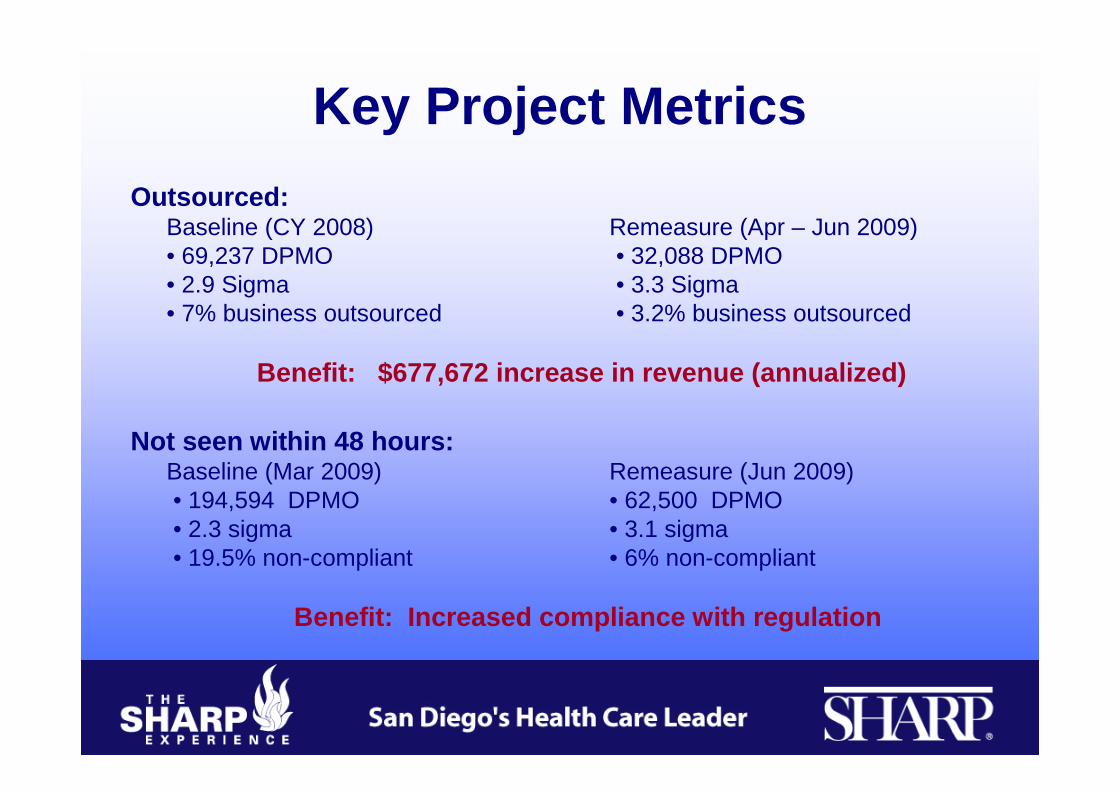
Key Project Metrics
Outsourced:Baseline (CY 2008) Remeasure (Apr – Jun 2009)• 69,237 DPMO • 32,088 DPMO• 2.9 Sigma • 3.3 Sigma• 7% business outsourced • 3.2% business outsourced
Benefit: $677,672 increase in revenue (annualized)
Not seen within 48 hours:Baseline (Mar 2009) Remeasure (Jun 2009)• 194,594 DPMO • 62,500 DPMO • 2.3 sigma • 3.1 sigma• 19.5% non-compliant • 6% non-compliant
Benefit: Increased compliance with regulation

Key Project Metrics
Field staff synchronization:Baseline (Feb 2009) Remeasure (Jun 2009)• 544,726 DPMO • 606,218 DPMO• 1.3 Sigma • 1.2 Sigma• 45.5% synching • 39% synching
Takeaway: More effort focused on understanding root c ause of problem and developing solutions to change behavior

Lessons Learned• Progress made – not so easy
• Identified resistance in key stakeholders• Staff lack of knowledge on Six Sigma
methodology slowed the progress• Addition of new team member changed
group dynamic
• Large team difficult to manage• Limited champion involvement impacts
overall follow through

Questions & Discussion