lean six sigma toolkit lean overview
TRANSCRIPT
©2007 Expedia Inc. 1
Lean Six Sigma ToolkitLean Overview
©2007 Expedia Inc. 2
This page left blank
©2007 Expedia Inc. 3
Purpose & Agenda
• The purpose of this program is to provide the key concepts and skills for understanding some of the basic tools used in evaluating a process
• Our Agenda • Overview of the concepts and tools used to create a lean
enterprise
Objectives and Expectations
• By the end of this module, participants should understand: • What are the elements of a lean enterprise • How Lean supports Key Business Objectives • Strategy and Tactics of a Lean Transformation • Lean Methods and Tools

©2007 Expedia Inc. 4
This page left blank
©2007 Expedia Inc. 5
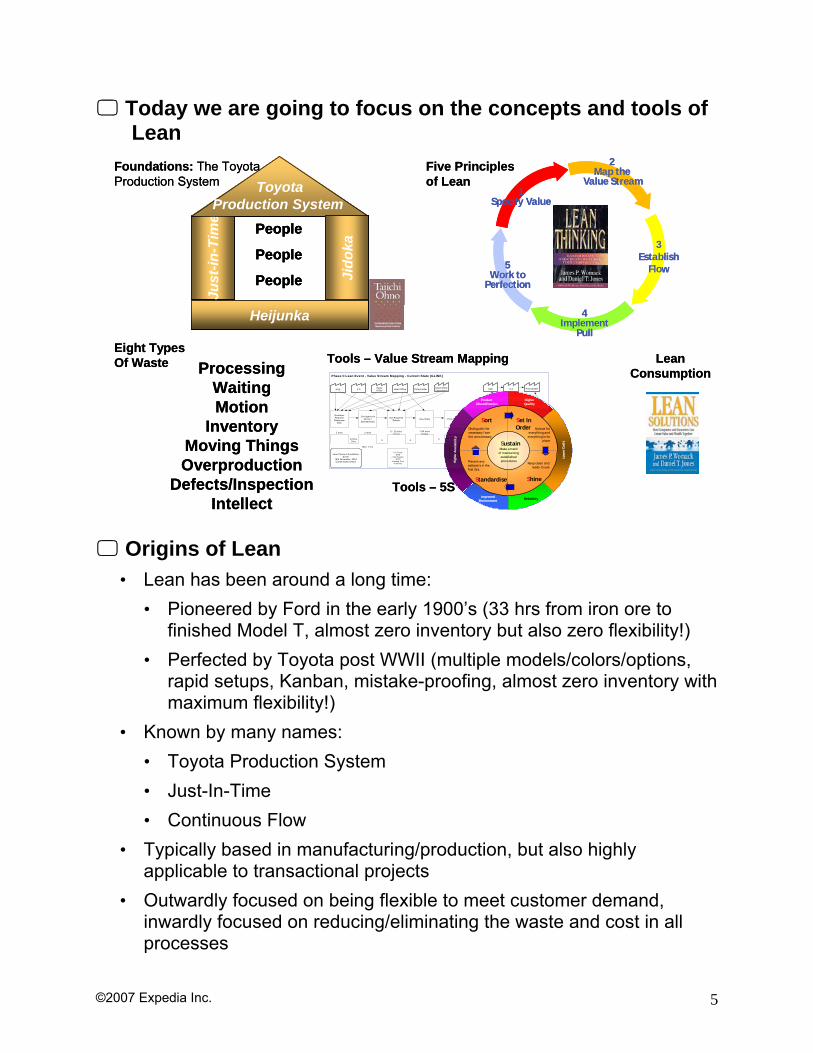
Today we are going to focus on the concepts and tools of Lean
Origins of Lean • Lean has been around a long time:
• Pioneered by Ford in the early 1900’s (33 hrs from iron ore to finished Model T, almost zero inventory but also zero flexibility!)
• Perfected by Toyota post WWII (multiple models/colors/options, rapid setups, Kanban, mistake-proofing, almost zero inventory with maximum flexibility!)
• Known by many names: • Toyota Production System • Just-In-Time • Continuous Flow
• Typically based in manufacturing/production, but also highly applicable to transactional projects
• Outwardly focused on being flexible to meet customer demand, inwardly focused on reducing/eliminating the waste and cost in all processes
Just
-in-T
ime
Heijunka
ToyotaProduction System
People
People
People Jido
ka
Foundations: The Toyota Production System
Just
-in-T
ime
Heijunka
ToyotaProduction System
People
People
People Jido
ka
Just
-in-T
ime
Heijunka
ToyotaProduction System
People
People
People Jido
ka
Foundations: The Toyota Production System
3Establish
Flow
4Implement
Pull
5Work to
Perfection
1Specify Value
2 Map the
Value StreamFive Principlesof Lean
3Establish
Flow
4Implement
Pull
5Work to
Perfection
1Specify Value
2 Map the
Value StreamFive Principlesof Lean
Processing WaitingMotion
InventoryMoving ThingsOverproduction
Defects/InspectionIntellect
Eight TypesOf Waste Processing
WaitingMotion
InventoryMoving ThingsOverproduction
Defects/InspectionIntellect
Eight TypesOf Waste Lean
ConsumptionLean
Consumption
QuotationRequest
DetermineSSC
SalesOffice
Get Agency #(GLink /
Spreadsheet)
Get RequiredDetails Input Data Print Quote Log Quote Package
Head Office Policyholder Head OfficeCommissions KAE IFAKAE IFA
Phase II Lean Event - Value Stream Mapping - Current State (GLINK)
- Inv Funds- NRD
- Commission- WOP
- Existing Cont- Authority
5 mins 2 mins 0 - 30 mins10 mins
1-30 mins5 mins - 30 secs
0 0 0
0 minsnon-batch
or Lengthof day
remaining
Lean Phase II QuotationsEvent
16th November. 2004Cardiff Sales Offiice
Touch Time: 28.5 mins
Cycle Time: Variable (2.5-10.5 Hours)(Working to end of day post process)
Post
0-7Hrs2Hrs
Man: 1min
1-20 mins5 mins 1 min
1 min - 3Hours
1 min
Policyholder
0
Volume:9 Per Region Per Day
H igh
er A
vaila
b ilit
y
Low
er C
osts
Product Diversification
Higher Quality
ReliabilityImproved Environment
Distinguish the necessary f rom the unnecessary
Set InOrder
Make a habit of maintaining
established procedures
Sustain
Sort
Standardise
A place for everything and
everything in its place
Keep clean and ready to use
Prevent any setback’s in the first 3s’s
Shine
High
er A
vaila
b ilit
y
Low
er C
osts
Product Diversification
Higher Quality
ReliabilityImproved Environment
Distinguish the necessary f rom the unnecessary
Set InOrder
Make a habit of maintaining
established procedures
Sustain
Sort
Standardise
A place for everything and
everything in its place
Keep clean and ready to use
Prevent any setback’s in the first 3s’s
Shine
Tools – Value Stream Mapping
Tools – 5S
©2007 Expedia Inc. 6
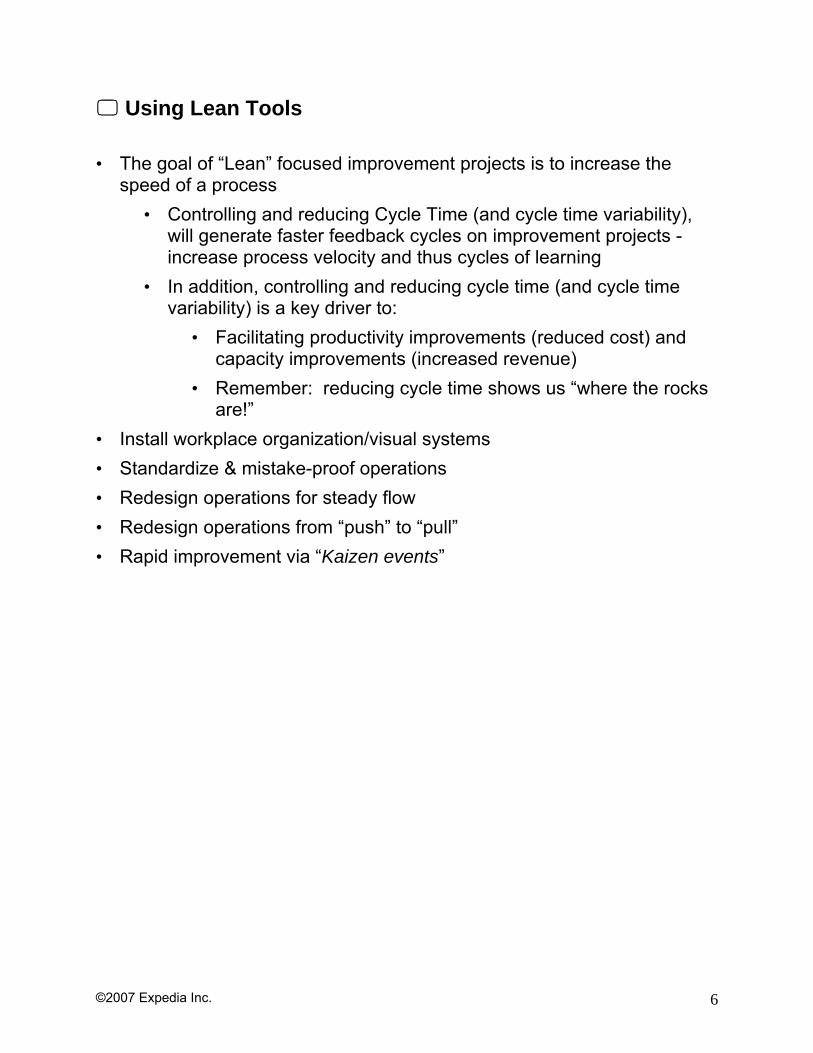
Using Lean Tools • The goal of “Lean” focused improvement projects is to increase the
speed of a process • Controlling and reducing Cycle Time (and cycle time variability),
will generate faster feedback cycles on improvement projects - increase process velocity and thus cycles of learning
• In addition, controlling and reducing cycle time (and cycle time variability) is a key driver to:
• Facilitating productivity improvements (reduced cost) and capacity improvements (increased revenue)
• Remember: reducing cycle time shows us “where the rocks are!”
• Install workplace organization/visual systems • Standardize & mistake-proof operations • Redesign operations for steady flow • Redesign operations from “push” to “pull” • Rapid improvement via “Kaizen events”

©2007 Expedia Inc. 7
Using Lean Tools
Application
Tool
Process Improvement
(Quality) Phase Applied (DMAIC)
Process Efficiency
(Lean)Expedia Six Sigma Training
Activity Network DiagramDefine,
Analyze, Improve
√ Black Belt training
Affinity diagram Define, Measure, Improve √ Green Belt training, Champion training, Kaizen training, SOM-10
Benchmarking Define, Improve √ Green Belt training, Black Belt Training, Champion training, SOM-10
Brainstorming Define, Measure, Analyze, Improve √ Green Belt Training, Kaizen Training, SOM-10
Champion trainingControl Charts (p, np, c, u, I, MR, Run, x-bar & R) Analyze, Control √ Green Belt Training, Black Belt Training, SOM-12
Champion training
Control Plans Improve, Control √ Green Belt Training, Black Belt Training, Champion training
Cost of Poor Quality - Concepts of Waste Define, Measure, Analyze √ Green Belt Training, Black Belt Training, SOM-5
Champion training
Current State Value Stream Mapping Measure Analyze √ Green Belt Training, Black Belt Training, SOM-7 Champion training, Kaizen training
Cycle Time Data Analysis Analyze √ Green Belt Training, Black Belt Training, SOM-11 Champion training
Five "S" Define, Improve √ Green Belt Training, Black Belt Training, SOM-12 Champion training, Kaizen training
Interrelationship DiagramDefine,
Analyze, Improve
√ Black Belt training
Kaizen Improve √ Green Belt Training, Black Belt Training, SOM-12 Champion training
Kanban System Improve √ Black Belt Training
Matrix DiagramDefine,
Analyze, Improve, Control
√ Green Belt Training, Black Belt Training, Champion training
Nominal Group Technique Define, Deploy √ Green Belt Training, Black Belt Training, SOM-10 Champion training
Poke-Yoke (Mistake Proofing) Control √ Green Belt Training, Black Belt Training Champion training
Prioritization MatricesDefine,
Analyze, Improve
√ Green Belt Training, Black Belt Training, Champion training
Process Balancing (TAKT time) Analyze Contol √ Green Belt Training, Black Belt Training, SOM-11 Champion training
Process Efficiency (PCE, PCT) Analyze, Improve, Control √ Green Belt Training, Black Belt Training, SOM-11
Champion training
Process Mapping Define, Improve √ Green Belt Training, Black Belt Training, SOM-2 Champion training
Throughput Yield (First time and rolled) √ Green Belt Training, Black Belt Training, Kaizen Training, Champion training
Tree Diagrams Define, Measure √ Green Belt Training, Black Belt Training, SOM-8 Champion training
Value Added/ Non-Value Added Analysis Analyze √ Green Belt Training, Black Belt Training, SOM-7 Champion training
Value Stream Mapping - Future State Improve √ Green Belt Training, Black Belt Training, SOM-7 Champion training
Visual Management Measure Control √ Green Belt Training, Black Belt Training, SOM-12 Champion training
WIP Cap Analyze Improve √ Green Belt Training, Black Belt Training, SOM-11 Champion training
Failure Modes and Effect Analysis (FMEA) Measure, Analyze, Improve √ Green Belt Training, Black Belt Training, SOM-9
Champion training
Histograms Analyze √ Green Belt Training, Black Belt Training, SOM-6 Champion training
Pareto Charts Define, Analyze, Improve, Control √ Green Belt Training, Black Belt Training, SOM-6
Champion training
©2007 Expedia Inc. 8
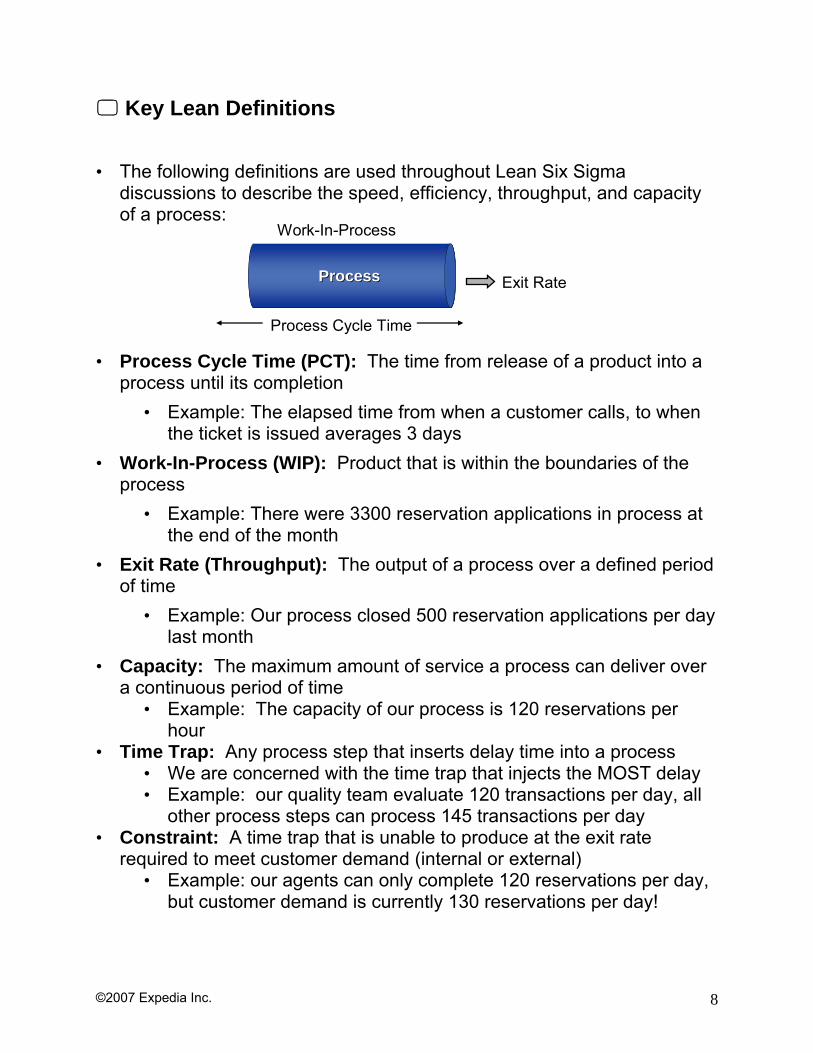
Key Lean Definitions • The following definitions are used throughout Lean Six Sigma
discussions to describe the speed, efficiency, throughput, and capacity of a process:
• Process Cycle Time (PCT): The time from release of a product into a
process until its completion • Example: The elapsed time from when a customer calls, to when
the ticket is issued averages 3 days • Work-In-Process (WIP): Product that is within the boundaries of the
process • Example: There were 3300 reservation applications in process at
the end of the month • Exit Rate (Throughput): The output of a process over a defined period
of time • Example: Our process closed 500 reservation applications per day
last month • Capacity: The maximum amount of service a process can deliver over
a continuous period of time • Example: The capacity of our process is 120 reservations per
hour • Time Trap: Any process step that inserts delay time into a process
• We are concerned with the time trap that injects the MOST delay • Example: our quality team evaluate 120 transactions per day, all
other process steps can process 145 transactions per day • Constraint: A time trap that is unable to produce at the exit rate
required to meet customer demand (internal or external) • Example: our agents can only complete 120 reservations per day,
but customer demand is currently 130 reservations per day!
ProcessProcess
Work-In-Process
Exit Rate
Process Cycle Time
©2007 Expedia Inc. 9
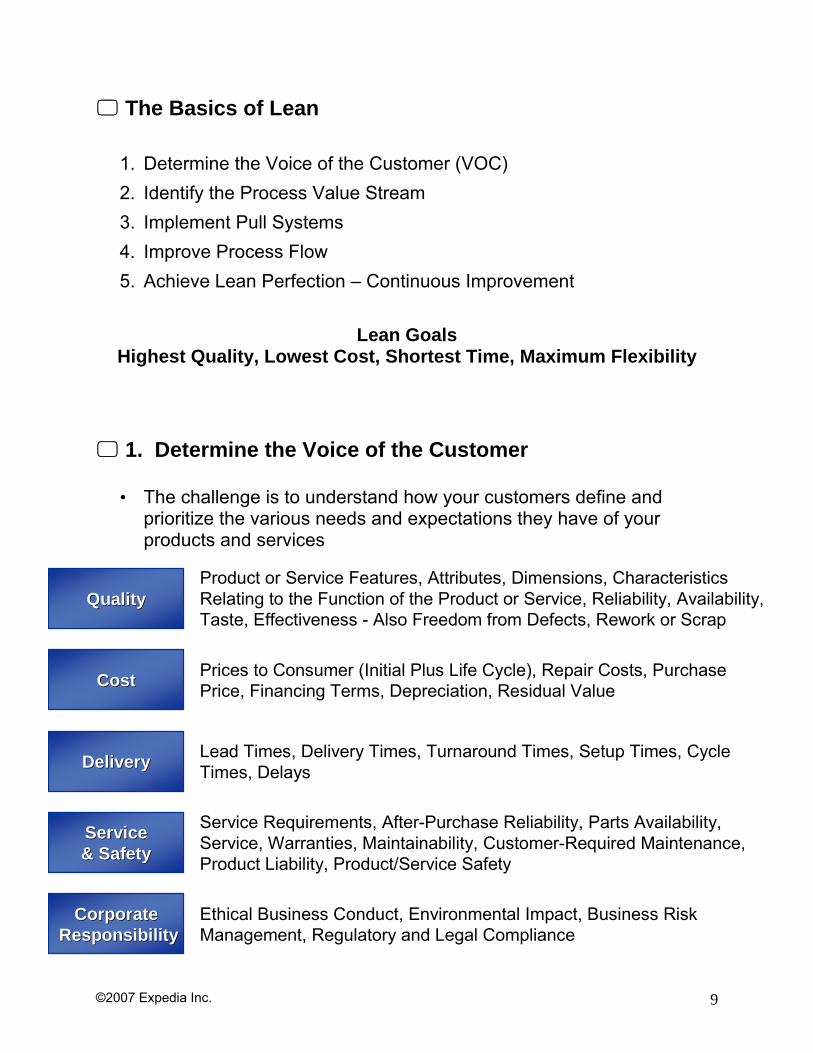
The Basics of Lean
1. Determine the Voice of the Customer (VOC) 2. Identify the Process Value Stream 3. Implement Pull Systems 4. Improve Process Flow 5. Achieve Lean Perfection – Continuous Improvement
Lean Goals
Highest Quality, Lowest Cost, Shortest Time, Maximum Flexibility
1. Determine the Voice of the Customer
• The challenge is to understand how your customers define and prioritize the various needs and expectations they have of your products and services
QualityQualityProduct or Service Features, Attributes, Dimensions, Characteristics Relating to the Function of the Product or Service, Reliability, Availability, Taste, Effectiveness - Also Freedom from Defects, Rework or Scrap
CostCost Prices to Consumer (Initial Plus Life Cycle), Repair Costs, Purchase Price, Financing Terms, Depreciation, Residual Value
DeliveryDelivery Lead Times, Delivery Times, Turnaround Times, Setup Times, CycleTimes, Delays
ServiceService& Safety& Safety
Service Requirements, After-Purchase Reliability, Parts Availability, Service, Warranties, Maintainability, Customer-Required Maintenance, Product Liability, Product/Service Safety
CorporateCorporateResponsibilityResponsibility
Ethical Business Conduct, Environmental Impact, Business Risk Management, Regulatory and Legal Compliance
©2007 Expedia Inc. 10
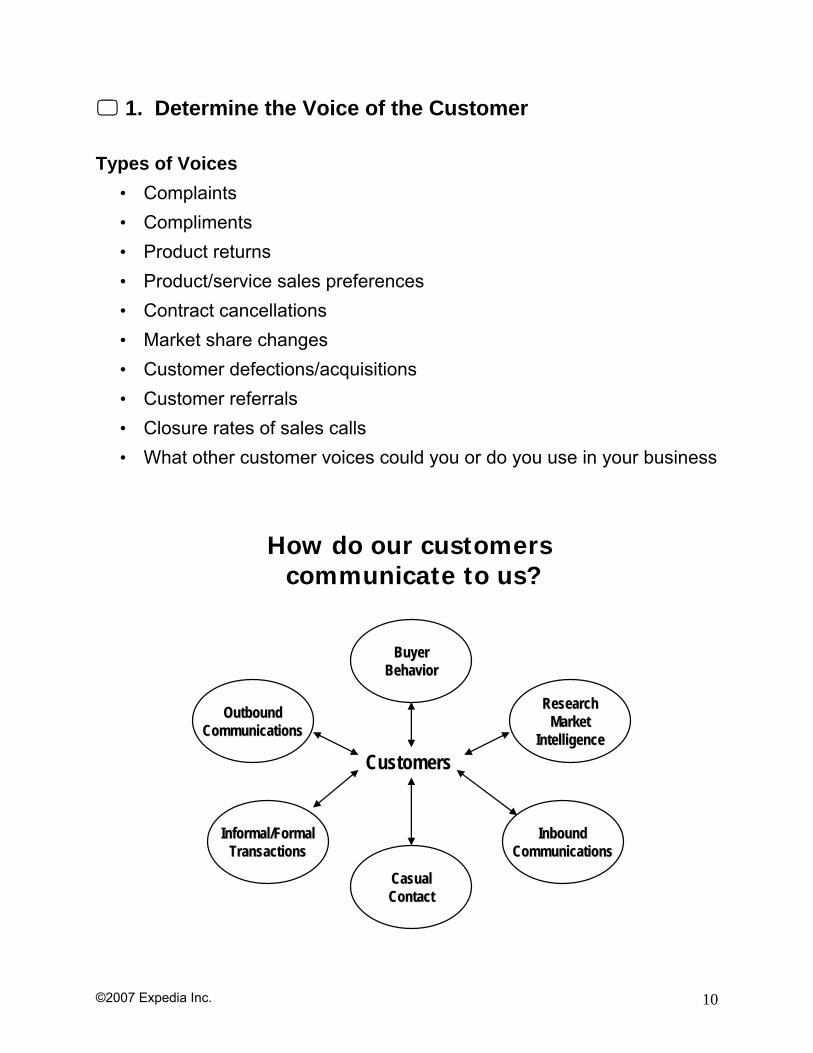
1. Determine the Voice of the Customer Types of Voices
• Complaints • Compliments • Product returns • Product/service sales preferences • Contract cancellations • Market share changes • Customer defections/acquisitions • Customer referrals • Closure rates of sales calls • What other customer voices could you or do you use in your business
BuyerBuyerBehaviorBehavior
Informal/FormalInformal/FormalTransactionsTransactions
OutboundOutboundCommunicationsCommunications
CasualCasualContactContact
InboundInboundCommunicationsCommunications
ResearchResearchMarketMarket
IntelligenceIntelligenceCustomers
How do our customers communicate to us?
©2007 Expedia Inc. 11
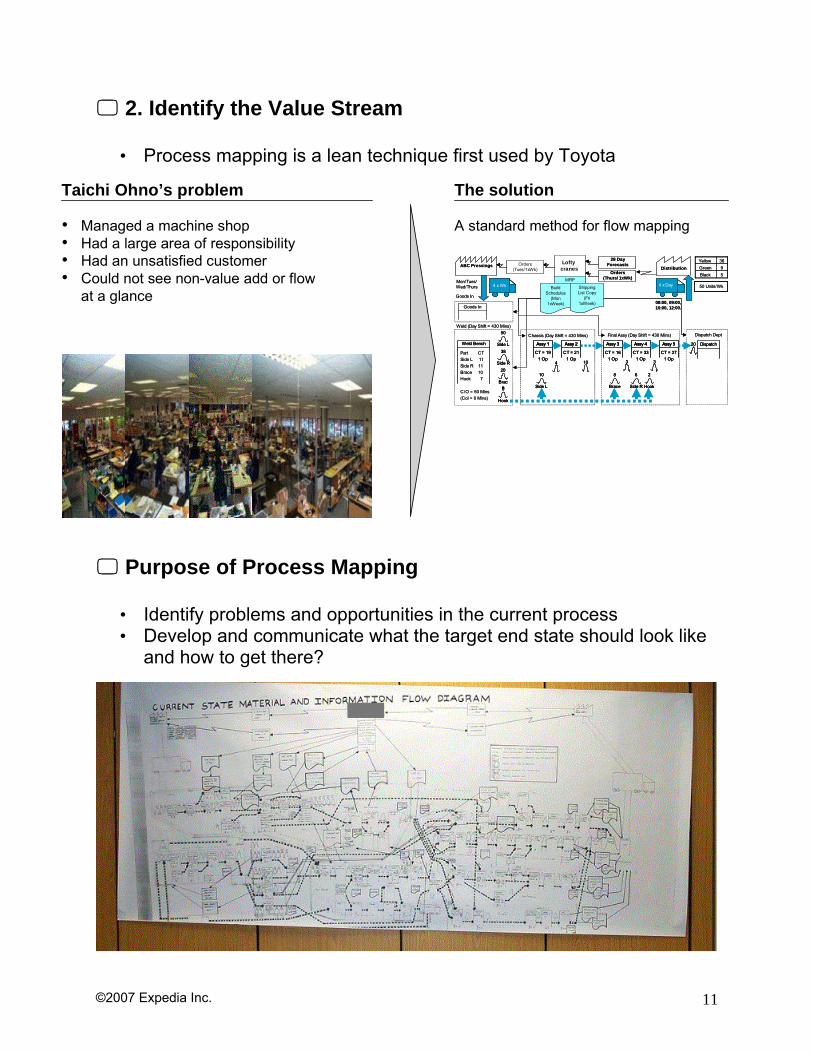
2. Identify the Value Stream
• Process mapping is a lean technique first used by Toyota
Purpose of Process Mapping
• Identify problems and opportunities in the current process • Develop and communicate what the target end state should look like
and how to get there?
Taichi Ohno’s problem
• Managed a machine shop• Had a large area of responsibility• Had an unsatisfied customer• Could not see non-value add or flow
at a glance
The solution
A standard method for flow mapping
5Black9Green36Yellow
50 Units/Wk
Distribution
28 DayForecasts
Orders(Thurs/ 1xWk)
Goods In
Brace
20
Goods In
Side L
50
Hook
0
Side R
38
Assy 2
CT = 211 Op
Weld (Day Shift = 430 Mins)
Dispatch
Dispatch Dept
20
3104 3
Chassis (Day Shift = 430 Mins)
Side R
6
Side L
10
Brace
8
Hook
2
Final Assy (Day Shift = 430 Mins)
Assy 3
CT = 161 Op
Assy 4
CT = 331 Op
Assy 5
CT = 271 Op
Assy 1
CT = 191 Op
Weld Bench
Part CTSide L 11Side R 11Brace 10Hook 7
C/O = 50 Mins(Col = 0 Mins)
ABC Pressings
4 x WkMon/Tues/ Wed/Thurs
MRP
Orders(Tues/1xWk)
ShippingList Copy
(Fri1xWeek)
BuildSchedules
(Mon1xWeek)
Lofty cranes
4 x Day
08:00, 09:00, 10:00, 12:00.
5Black9Green36Yellow
50 Units/Wk
Distribution
28 DayForecasts
Orders(Thurs/ 1xWk)
Goods In
Brace
20
Brace
20
Goods In
Side L
50
Side L
50
Hook
0
Hook
0
Side R
38
Side R
38
Assy 2
CT = 211 Op
Assy 2Assy 2
CT = 211 Op
Weld (Day Shift = 430 Mins)
DispatchDispatch
Dispatch Dept
2020
33101044 33
Chassis (Day Shift = 430 Mins)
Side R
6
Side R
6
Side L
10
Side L
10
Brace
8
Brace
8
Hook
2
Hook
2
Final Assy (Day Shift = 430 Mins)
Assy 3
CT = 161 Op
Assy 3Assy 3
CT = 161 Op
Assy 4
CT = 331 Op
Assy 4Assy 4
CT = 331 Op
Assy 5
CT = 271 Op
Assy 5Assy 5
CT = 271 Op
Assy 1
CT = 191 Op
Assy 1Assy 1
CT = 191 Op
Weld BenchWeld Bench
Part CTSide L 11Side R 11Brace 10Hook 7
C/O = 50 Mins(Col = 0 Mins)
ABC Pressings
4 x Wk4 x WkMon/Tues/ Wed/Thurs
MRP
Orders(Tues/1xWk)
ShippingList Copy
(Fri1xWeek)
BuildSchedules
(Mon1xWeek)
Lofty cranes
4 x Day4 x Day
08:00, 09:00, 10:00, 12:00.
©2007 Expedia Inc. 12
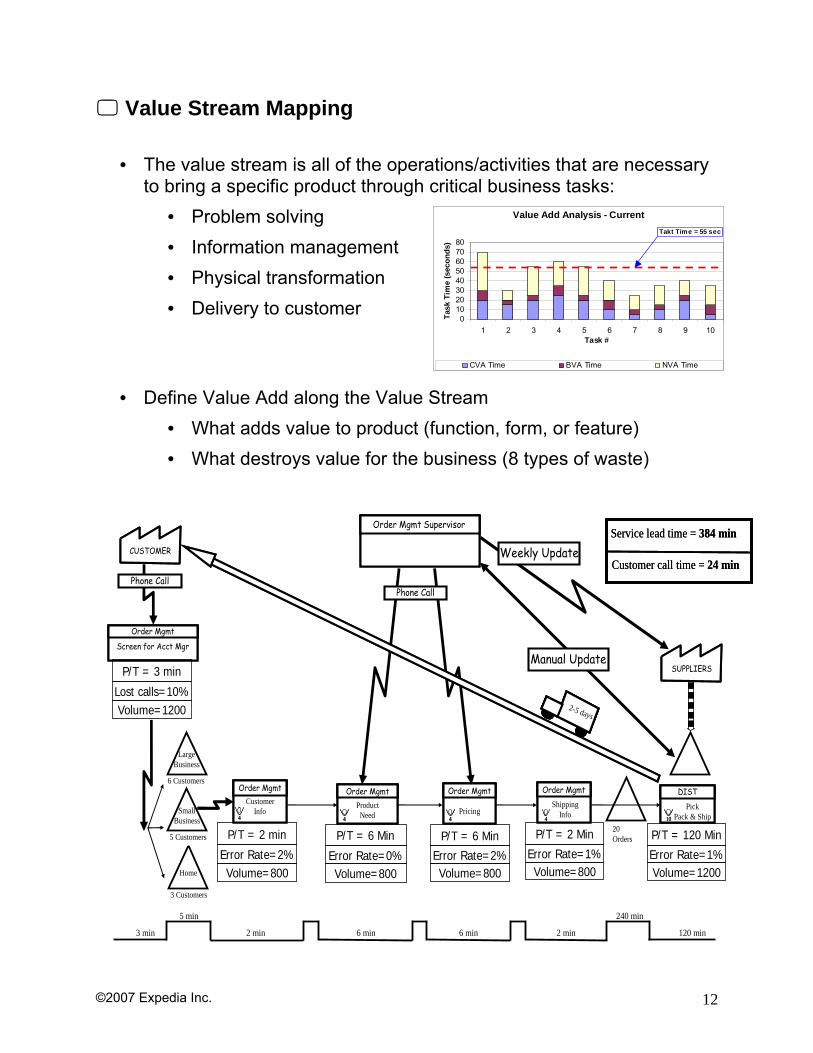
Value Stream Mapping
• The value stream is all of the operations/activities that are necessary to bring a specific product through critical business tasks:
• Problem solving • Information management • Physical transformation • Delivery to customer
• Define Value Add along the Value Stream • What adds value to product (function, form, or feature) • What destroys value for the business (8 types of waste)
Value Add Analysis - Current
01020304050607080
1 2 3 4 5 6 7 8 9 10Task #
Task
Tim
e (s
econ
ds)
CVA Time BVA Time NVA Time
Takt Time = 55 sec
1
Order Mgmt Supervisor Order Mgmt Supervisor
CUSTOMERCUSTOMER
DISTDISTOrder MgmtOrder MgmtOrder MgmtOrder MgmtOrder MgmtOrder Mgmt Order MgmtOrder Mgmt
Screen for Acct Mgr
Order Mgmt
Screen for Acct Mgr
Order Mgmt
P/T = 2 min
Error Rate=2%Volume=800
P/T = 6 Min
Error Rate=0%Volume=800
P/T = 6 MinError Rate=2%Volume=800
P/T = 2 Min
Error Rate=1%Volume=800
20 Orders
3 min
Phone Call
LargeBusiness
Home
6 Customers
5 Customers
3 Customers
SmallBusiness
CustomerInfo
44
ProductNeed44
Pricing44
ShippingInfo44
P/T = 3 min
Lost calls=10%Volume=1200
PickPack & Ship
P/T = 120 Min
Error Rate=1%Volume=1200
1010
2 min 6 min 6 min 2 min 120 min
240 min5 min
Customer call time = 24 min
Service lead time = 384 min
Customer call time = 24 min
Service lead time = 384 min
SUPPLIERSSUPPLIERS
2-5 days2-5 days
Manual Update
Weekly Update
Phone Call
©2007 Expedia Inc. 13
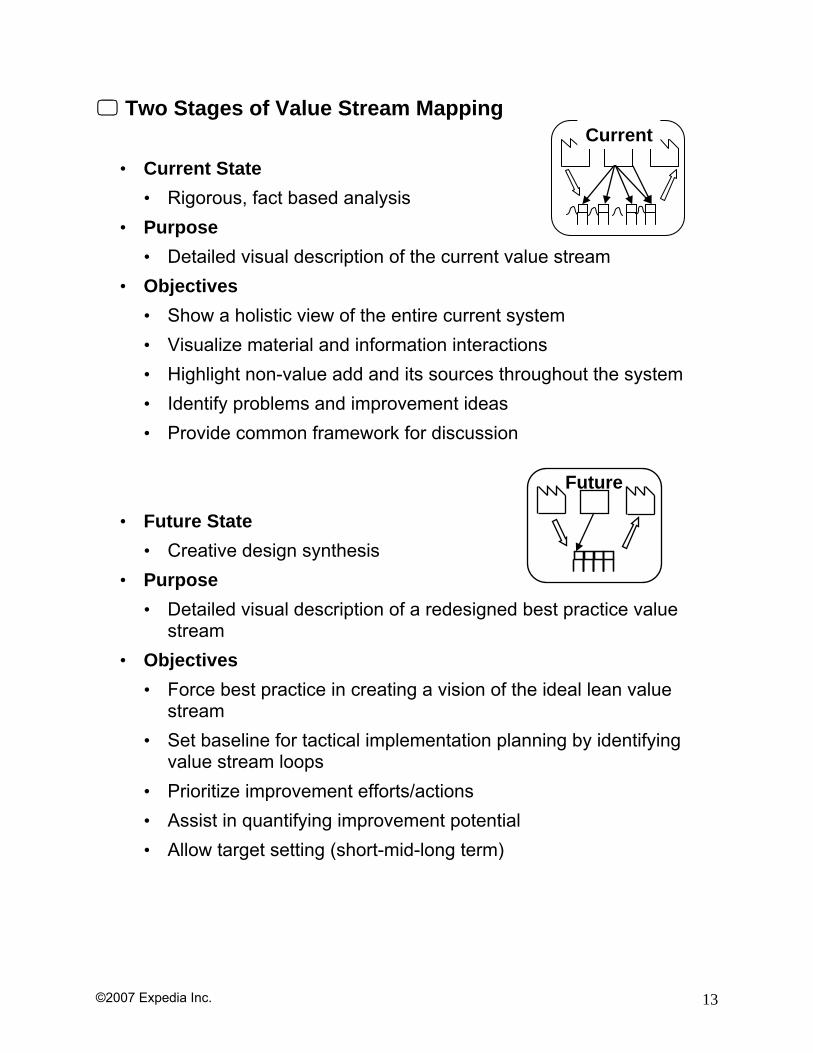
Two Stages of Value Stream Mapping
• Current State • Rigorous, fact based analysis
• Purpose • Detailed visual description of the current value stream
• Objectives • Show a holistic view of the entire current system • Visualize material and information interactions • Highlight non-value add and its sources throughout the system • Identify problems and improvement ideas • Provide common framework for discussion
• Future State • Creative design synthesis
• Purpose • Detailed visual description of a redesigned best practice value
stream • Objectives
• Force best practice in creating a vision of the ideal lean value stream
• Set baseline for tactical implementation planning by identifying value stream loops
• Prioritize improvement efforts/actions • Assist in quantifying improvement potential • Allow target setting (short-mid-long term)
Future
Current
©2007 Expedia Inc. 14
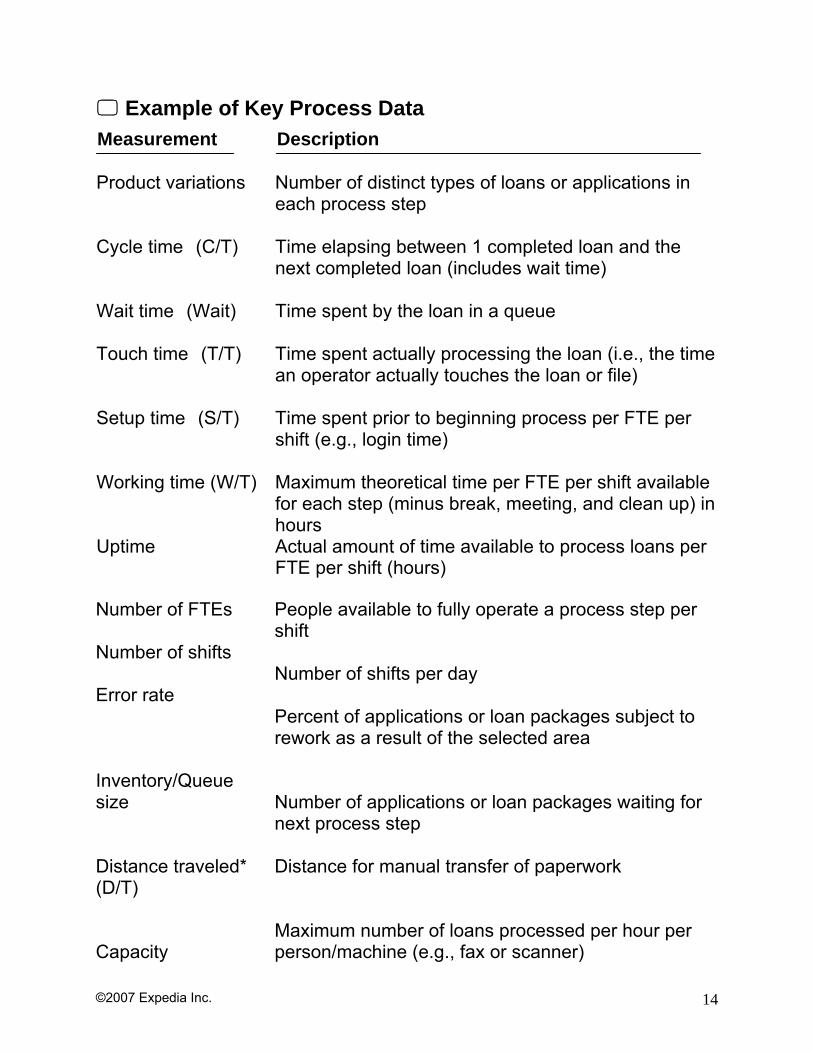
Example of Key Process Data
Description Measurement
Product variations Cycle time* (C/T) Wait time* (Wait) Touch time* (T/T) Setup time* (S/T) Working time (W/T) Uptime
Number of distinct types of loans or applications in each process step Time elapsing between 1 completed loan and the next completed loan (includes wait time) Time spent by the loan in a queue Time spent actually processing the loan (i.e., the time an operator actually touches the loan or file) Time spent prior to beginning process per FTE per shift (e.g., login time) Maximum theoretical time per FTE per shift available for each step (minus break, meeting, and clean up) in hours Actual amount of time available to process loans per FTE per shift (hours)
Number of FTEs Number of shifts Error rate
Inventory/Queue size Distance traveled* (D/T) Capacity
People available to fully operate a process step per shift Number of shifts per day Percent of applications or loan packages subject to rework as a result of the selected area Number of applications or loan packages waiting for next process step Distance for manual transfer of paperwork Maximum number of loans processed per hour per person/machine (e.g., fax or scanner)
©2007 Expedia Inc. 15
Lean Mission Statement Develop the Ability:
• To understand that waste simply: • Raises cost • Produces no corresponding benefit • Threatens all of our jobs
• To recognize and identify waste • To have the courage to call it waste • To have the desire to eliminate waste • To apply tools/techniques to eliminate waste • To understand the benefits of eliminating waste
• External (customer satisfaction, shareholder value) • Internal (employee satisfaction, financial improvement)
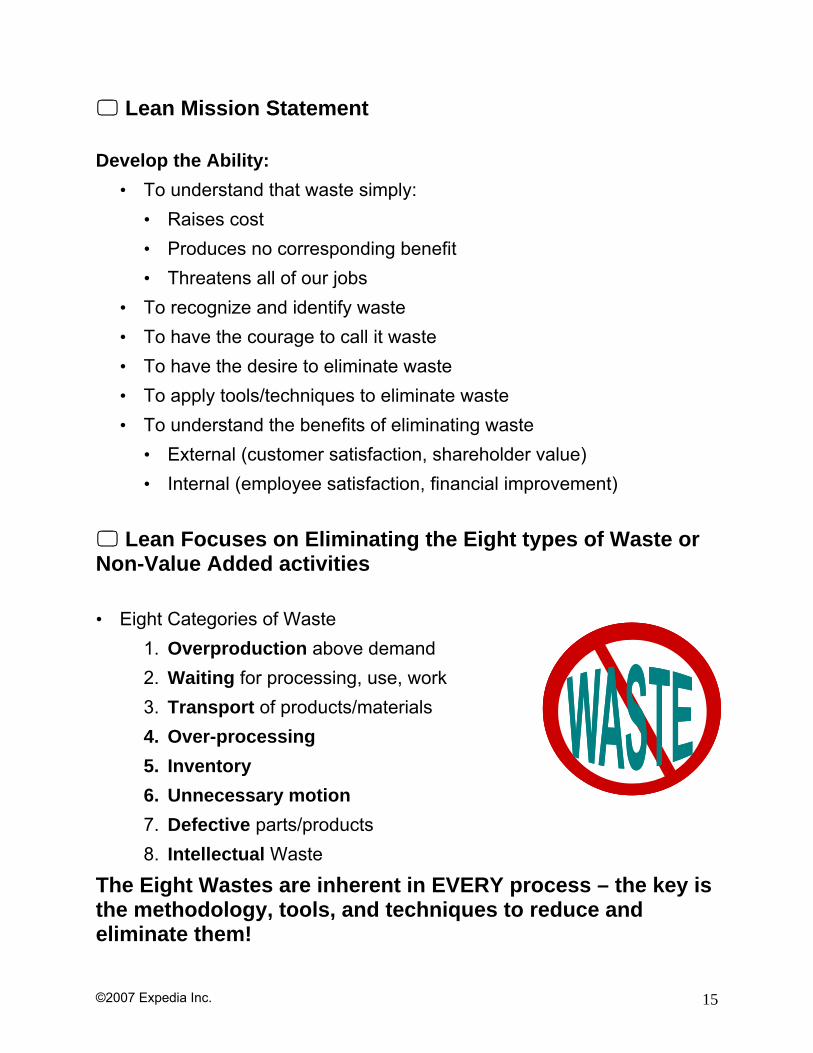
Lean Focuses on Eliminating the Eight types of Waste or
Non-Value Added activities • Eight Categories of Waste
1. Overproduction above demand 2. Waiting for processing, use, work 3. Transport of products/materials 4. Over-processing 5. Inventory 6. Unnecessary motion 7. Defective parts/products 8. Intellectual Waste
The Eight Wastes are inherent in EVERY process – the key is the methodology, tools, and techniques to reduce and eliminate them!

©2007 Expedia Inc. 16
Waste… According to Webster
• Material left over, rejected or thrown away • Refuse that accumulates about habitations • Being wild and uninhabited • To spend money or use property carelessly (syn. squander)
Waste…According to Customers
• Something that consumes resources but adds no value to a product or service
• Value is defined by the customer • “Non-value-added”
The Opposite of Waste: “Value-Added”
• Any activity which changes a product or service in a way that
enhances value from a customer’s perspective “The ability to eliminate waste is developed by giving up the belief that there is ‘no other way’ to perform a given task. It is useless to say, ‘It has to be done that way,’ or ‘This can’t be helped!’
At Toyota, we have found that there is always another way.”
– Study of the Toyota Production System
©2007 Expedia Inc. 17
Why Focus on Waste? • Because most processes are 95–99% non-value-added, a focus on
minimizing waste is the best leverage for an improvement effort
Overproduction • Making more than required by next process • Making earlier than required by next process • Making faster than required by next process • Causes of overproduction
• Just-in-case logic • Misuse of automation • Long process set-up • Unleveled scheduling • Unbalanced work load • Over engineered • Redundant inspections
NVA 95% VA 5%
©2007 Expedia Inc. 18
Waiting Waste • Idle time created when waiting for processing, use, work…
• Unbalanced work load • Unplanned maintenance • Misuses of automation • Upstream quality problems • Unleveled scheduling
• Examples • Signing documents • Batch Processing
Transport Waste • Transporting parts and materials around the facility
• Poor facility layout • On-line approvals • E-mail forwarding
• Examples • Walking information to post room /Scanning / Legal • Handoffs
©2007 Expedia Inc. 19
Over Processing Waste • Effort that adds no value to the product or service from the customer’s
viewpoint • Product changes without process changes • Just-in-case logic • True customer requirements undefined • Over processing to accommodate downtime Lack of communications • Redundant approvals • Extra copies/excessive information
• Examples • Duplicate Vetting Processes • Producing more than customer demands- Marketing Literature
©2007 Expedia Inc. 20
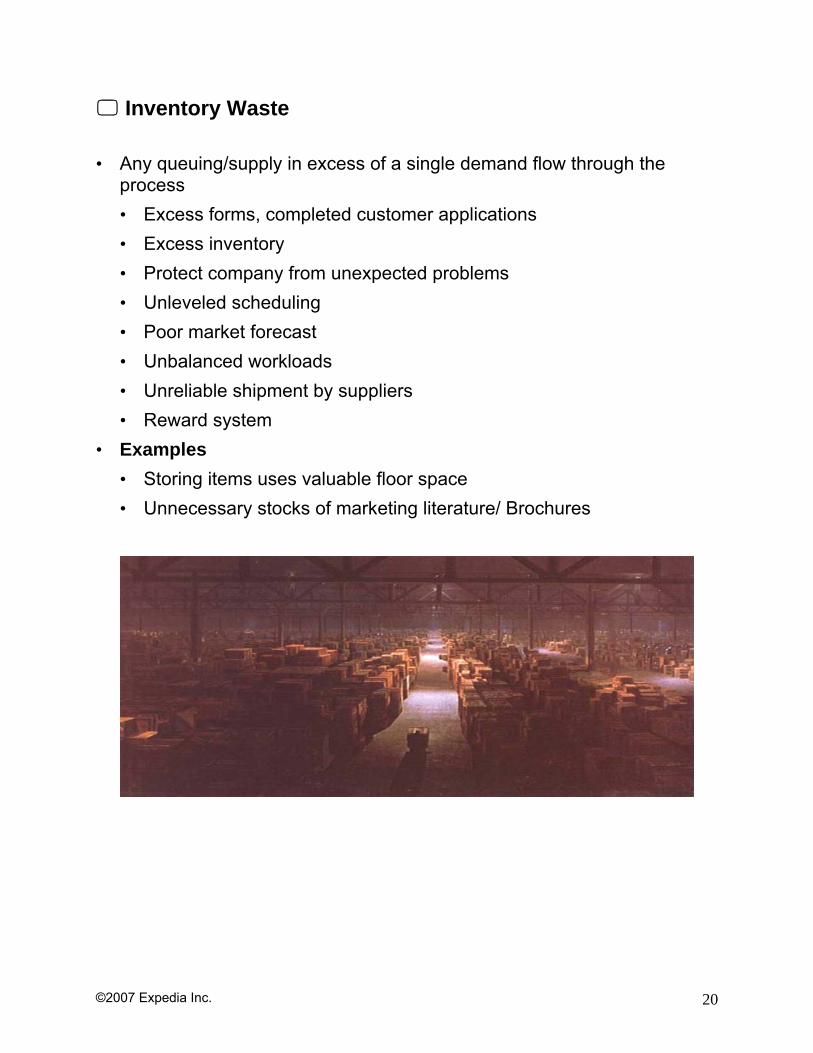
Inventory Waste • Any queuing/supply in excess of a single demand flow through the
process • Excess forms, completed customer applications • Excess inventory • Protect company from unexpected problems • Unleveled scheduling • Poor market forecast • Unbalanced workloads • Unreliable shipment by suppliers • Reward system
• Examples • Storing items uses valuable floor space • Unnecessary stocks of marketing literature/ Brochures
©2007 Expedia Inc. 21
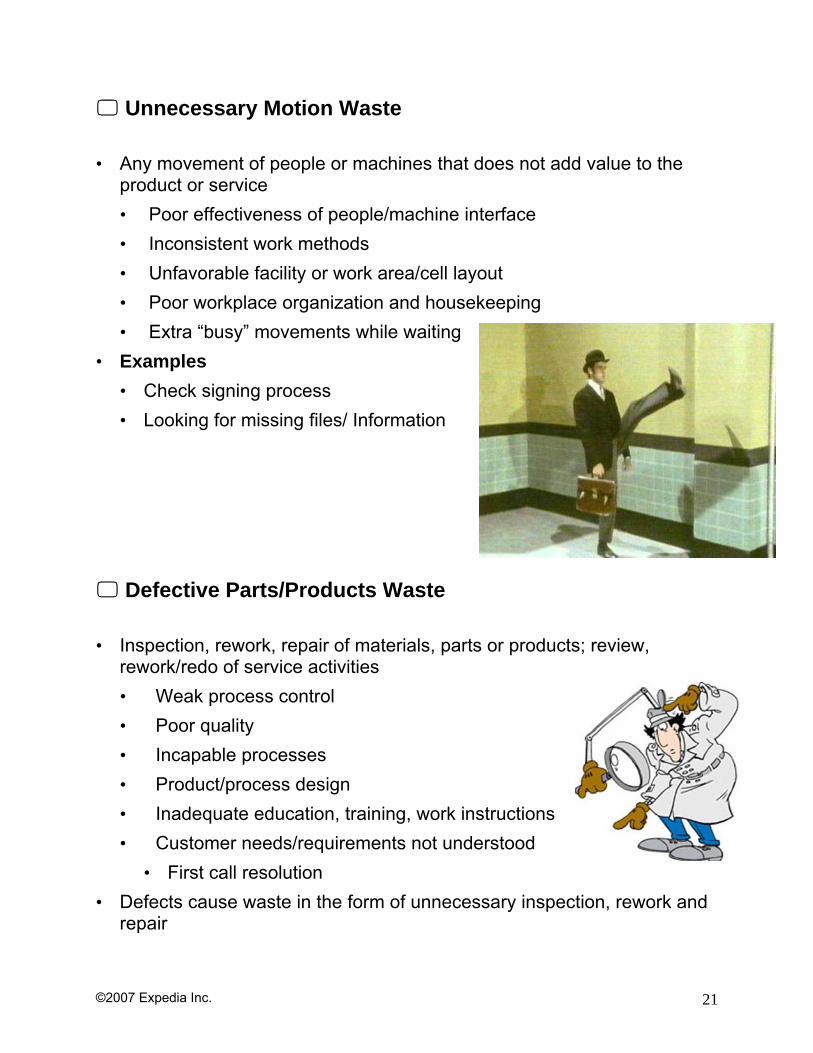
Unnecessary Motion Waste • Any movement of people or machines that does not add value to the
product or service • Poor effectiveness of people/machine interface • Inconsistent work methods • Unfavorable facility or work area/cell layout • Poor workplace organization and housekeeping • Extra “busy” movements while waiting
• Examples • Check signing process • Looking for missing files/ Information
Defective Parts/Products Waste • Inspection, rework, repair of materials, parts or products; review,
rework/redo of service activities • Weak process control • Poor quality • Incapable processes • Product/process design • Inadequate education, training, work instructions • Customer needs/requirements not understood
• First call resolution • Defects cause waste in the form of unnecessary inspection, rework and
repair
©2007 Expedia Inc. 22
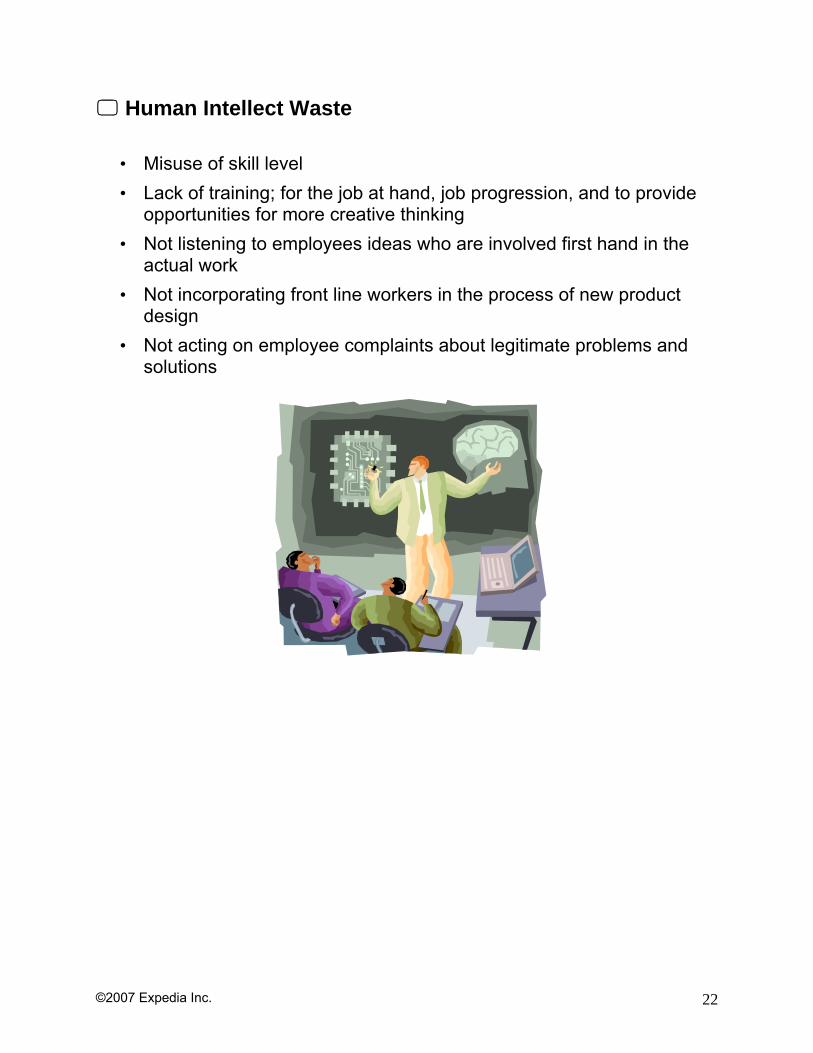
Human Intellect Waste
• Misuse of skill level • Lack of training; for the job at hand, job progression, and to provide
opportunities for more creative thinking • Not listening to employees ideas who are involved first hand in the
actual work • Not incorporating front line workers in the process of new product
design • Not acting on employee complaints about legitimate problems and
solutions
©2007 Expedia Inc. 23
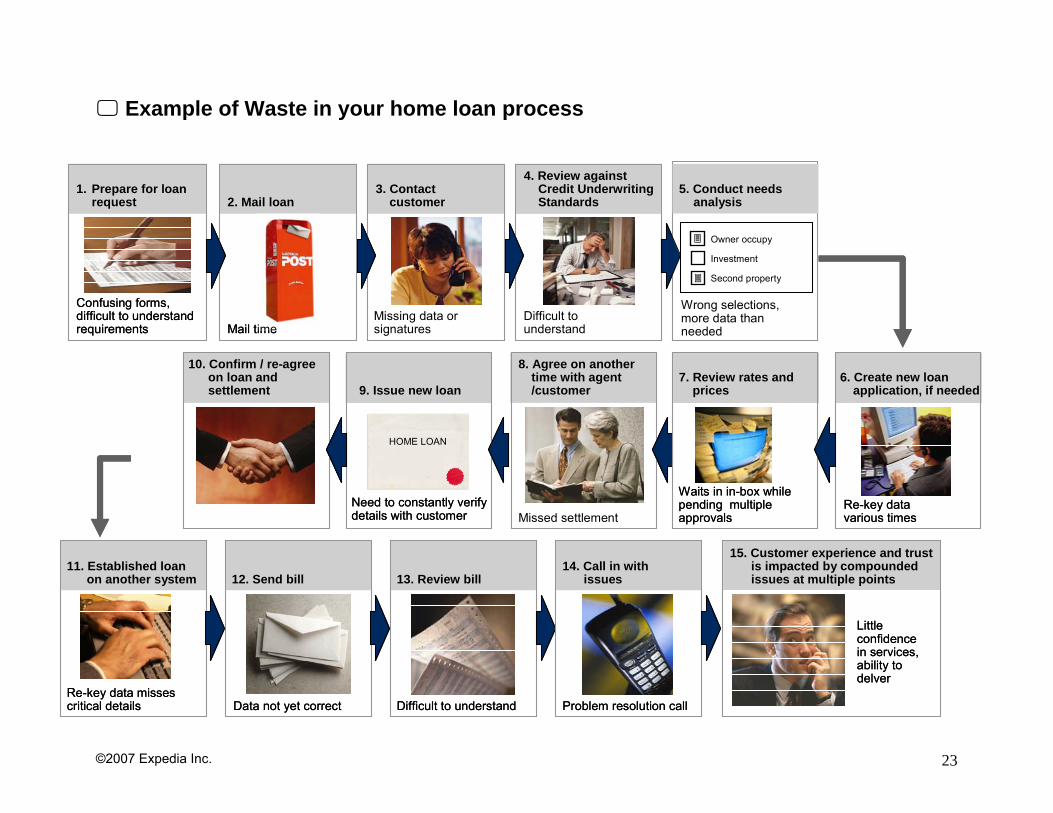
Example of Waste in your home loan process
10. Confirm / re-agree on loan and settlement
3. Contact customer
Need to constantly verify details with customer
8. Agree on another time with agent /customer
7. Review rates and prices
6. Create new loan application, if needed
Missing data or signatures
Missed settlement
Waits in in-box while pending multiple approvals
Data not yet correct
11. Established loan on another system
Re-key data misses critical details
Owner occupy
Investment
Second property
Re-key data various times
Confusing forms, difficult to understand requirements Mail time
2. Mail loan1. Prepare for loan
request
Difficult to understand
5. Conduct needs analysis
4. Review against Credit Underwriting Standards
Wrong selections, more data than needed
9. Issue new loan
12. Send bill 13. Review bill
Difficult to understand
14. Call in with issues
Problem resolution call
15. Customer experience and trust is impacted by compounded issues at multiple points
Little confidence in services, ability to delver
HOME LOAN
©2007 Expedia Inc. 24
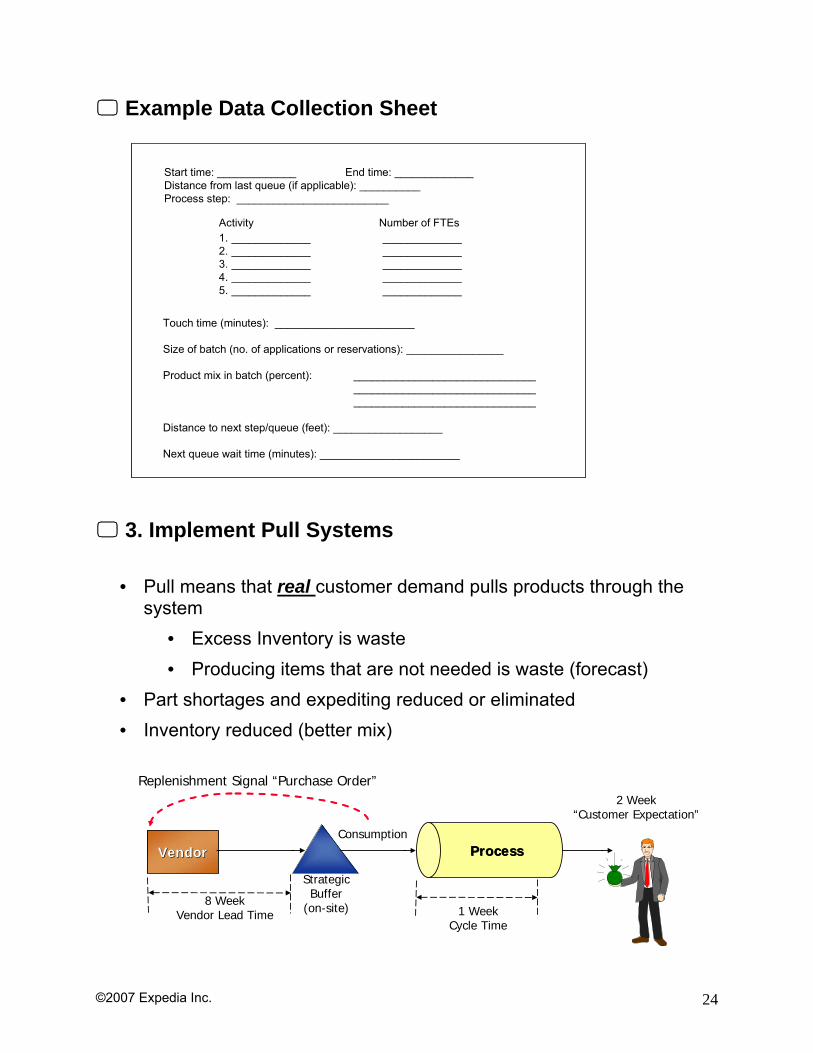
Example Data Collection Sheet
3. Implement Pull Systems
• Pull means that real customer demand pulls products through the system
• Excess Inventory is waste • Producing items that are not needed is waste (forecast)
• Part shortages and expediting reduced or eliminated • Inventory reduced (better mix)
StrategicBuffer
(on-site)8 WeekVendor Lead Time 1 Week
Cycle Time
2 Week“Customer Expectation”
Replenishment Signal “Purchase Order”
Consumption
VendorVendor ProcessProcess
Start time: _____________Distance from last queue (if applicable): __________Process step: _________________________
Activity Number of FTEs1. _____________2. _____________3. _____________4. _____________5. _____________
_________________________________________________________________
Touch time (minutes): _______________________
Size of batch (no. of applications or reservations): ________________
Product mix in batch (percent): __________________________________________________________________________________________
Distance to next step/queue (feet): __________________
Next queue wait time (minutes): _______________________
End time: _____________Start time: _____________Distance from last queue (if applicable): __________Process step: _________________________
Activity Number of FTEs1. _____________2. _____________3. _____________4. _____________5. _____________
_________________________________________________________________
Touch time (minutes): _______________________
Size of batch (no. of applications or reservations): ________________
Product mix in batch (percent): __________________________________________________________________________________________
Distance to next step/queue (feet): __________________
Next queue wait time (minutes): _______________________
End time: _____________
©2007 Expedia Inc. 25
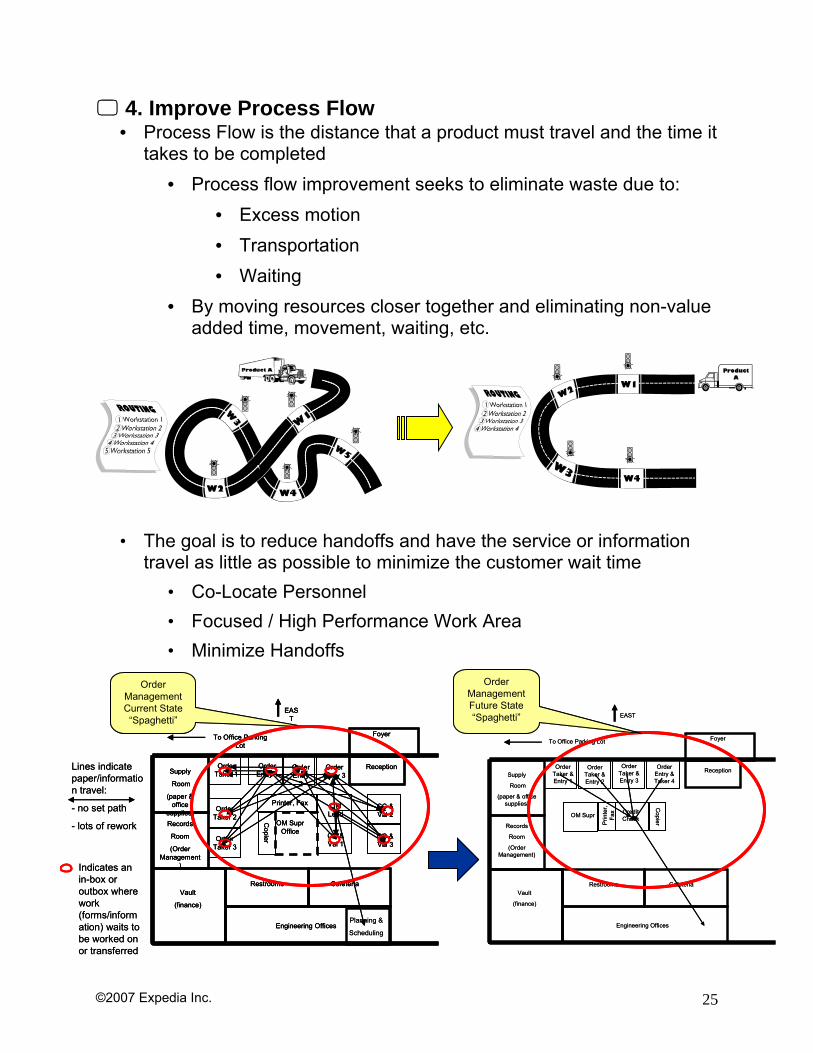
4. Improve Process Flow • Process Flow is the distance that a product must travel and the time it
takes to be completed • Process flow improvement seeks to eliminate waste due to:
• Excess motion • Transportation • Waiting
• By moving resources closer together and eliminating non-value added time, movement, waiting, etc.
• The goal is to reduce handoffs and have the service or information travel as little as possible to minimize the customer wait time
• Co-Locate Personnel • Focused / High Performance Work Area • Minimize Handoffs
To Office Parking Lot
EAST
Vault
(finance)
Supply
Room
(paper & office supplies)
Records
Room
(Order Management)
OM Supr
Reception
Engineering Offices
CafeteriaRestrooms
Foyer
Order Taker & Entry 1
Order Taker & Entry 2
Order Taker & Entry 3
Order Entry & Taker 4
Credit Check
Prin
ter,
Fax
Copier
Order Management Future State“Spaghetti”
To Office Parking Lot
EAST
Vault
(finance)
Supply
Room
(paper & office
supplies)Records
Room
(Order Management
)
OM SuprOffice
Reception
Engineering Offices
CafeteriaRestrooms
Foyer
Order Taker 1
Order Taker 2
Order Taker 3
Order Entry 1
Order Entry
2
Order Entry 3
CC & Val 2
CC & Val 3
CC & Val 1
OM Lead
Printer, Fax
Copier
Indicates an in-box or outbox where work (forms/information) waits to be worked on or transferred
Planning &
Scheduling
Lines indicate paper/information travel:
- no set path
- lots of rework
Order Management Current State“Spaghetti”
To Office Parking Lot
EAST
Vault
(finance)
Supply
Room
(paper & office supplies)
Records
Room
(Order Management)
OM Supr
Reception
Engineering Offices
CafeteriaRestrooms
Foyer
Order Taker & Entry 1
Order Taker & Entry 2
Order Taker & Entry 3
Order Entry & Taker 4
Credit Check
Prin
ter,
Fax
Copier
Order Management Future State“Spaghetti”
To Office Parking Lot
EAST
Vault
(finance)
Supply
Room
(paper & office
supplies)Records
Room
(Order Management
)
OM SuprOffice
Reception
Engineering Offices
CafeteriaRestrooms
Foyer
Order Taker 1
Order Taker 2
Order Taker 3
Order Entry 1
Order Entry
2
Order Entry 3
CC & Val 2
CC & Val 3
CC & Val 1
OM Lead
Printer, Fax
Copier
Indicates an in-box or outbox where work (forms/information) waits to be worked on or transferred
Planning &
Scheduling
Lines indicate paper/information travel:
- no set path
- lots of rework
Order Management Current State“Spaghetti”
©2007 Expedia Inc. 26
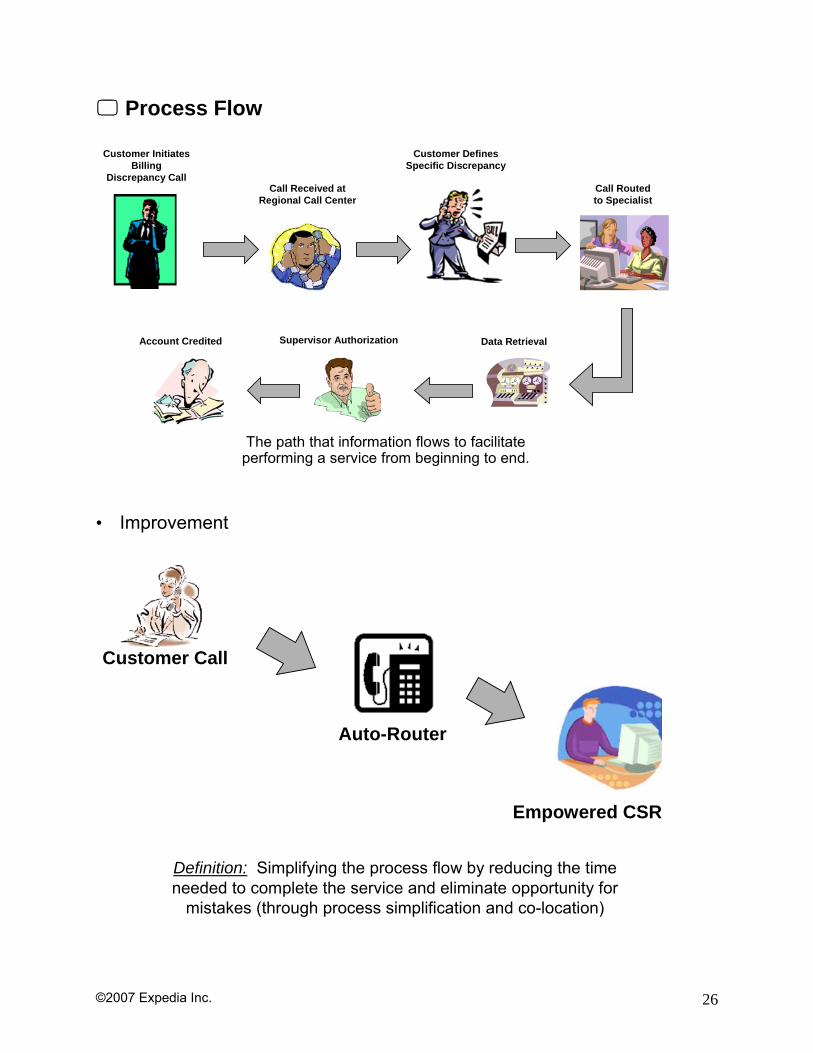
Process Flow • Improvement
Definition: Simplifying the process flow by reducing the time needed to complete the service and eliminate opportunity for
mistakes (through process simplification and co-location)
Auto-Router
Customer Call
Empowered CSR
The path that information flows to facilitate performing a service from beginning to end.
Call Received at Regional Call Center
Customer Initiates Billing
Discrepancy CallCall Routed to Specialist
Data RetrievalAccount Credited Supervisor Authorization
Customer Defines Specific Discrepancy
©2007 Expedia Inc. 27
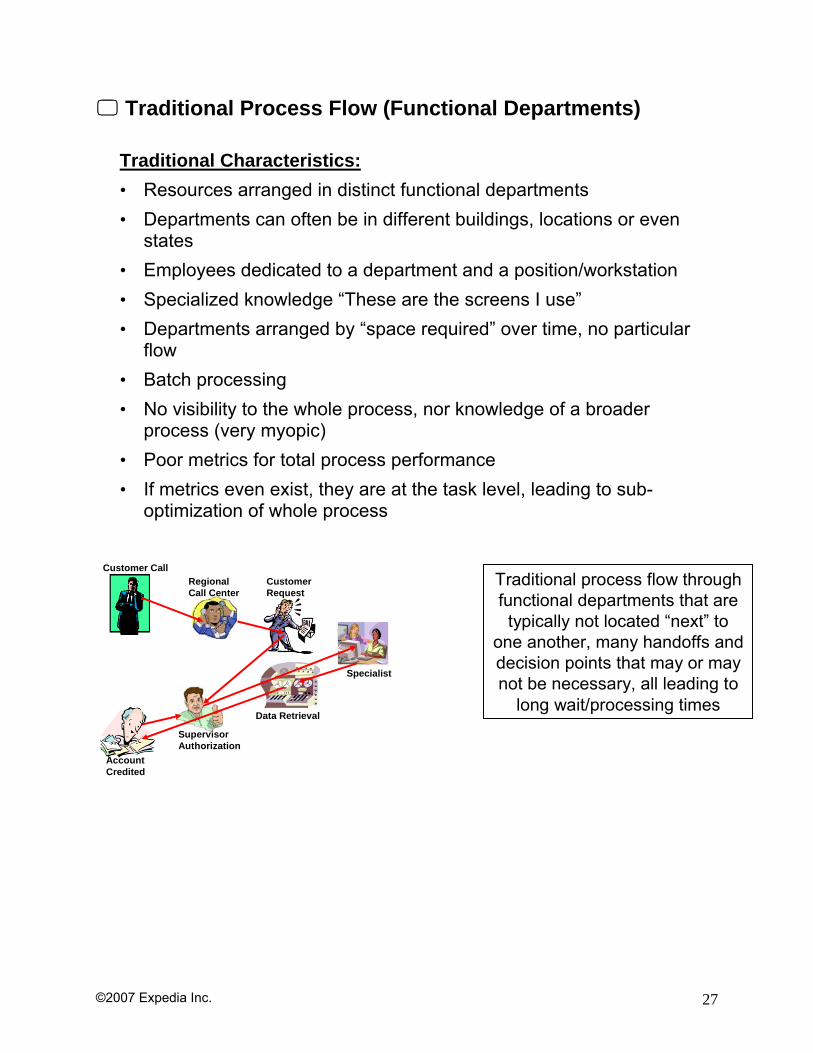
Traditional Process Flow (Functional Departments)
Traditional Characteristics: • Resources arranged in distinct functional departments • Departments can often be in different buildings, locations or even
states • Employees dedicated to a department and a position/workstation • Specialized knowledge “These are the screens I use” • Departments arranged by “space required” over time, no particular
flow • Batch processing • No visibility to the whole process, nor knowledge of a broader
process (very myopic) • Poor metrics for total process performance • If metrics even exist, they are at the task level, leading to sub-
optimization of whole process
Traditional process flow through functional departments that are typically not located “next” to
one another, many handoffs and decision points that may or may not be necessary, all leading to
long wait/processing times
Regional Call Center
Customer Call
Specialist
Data Retrieval
Account Credited
Supervisor Authorization
Customer Request
©2007 Expedia Inc. 28
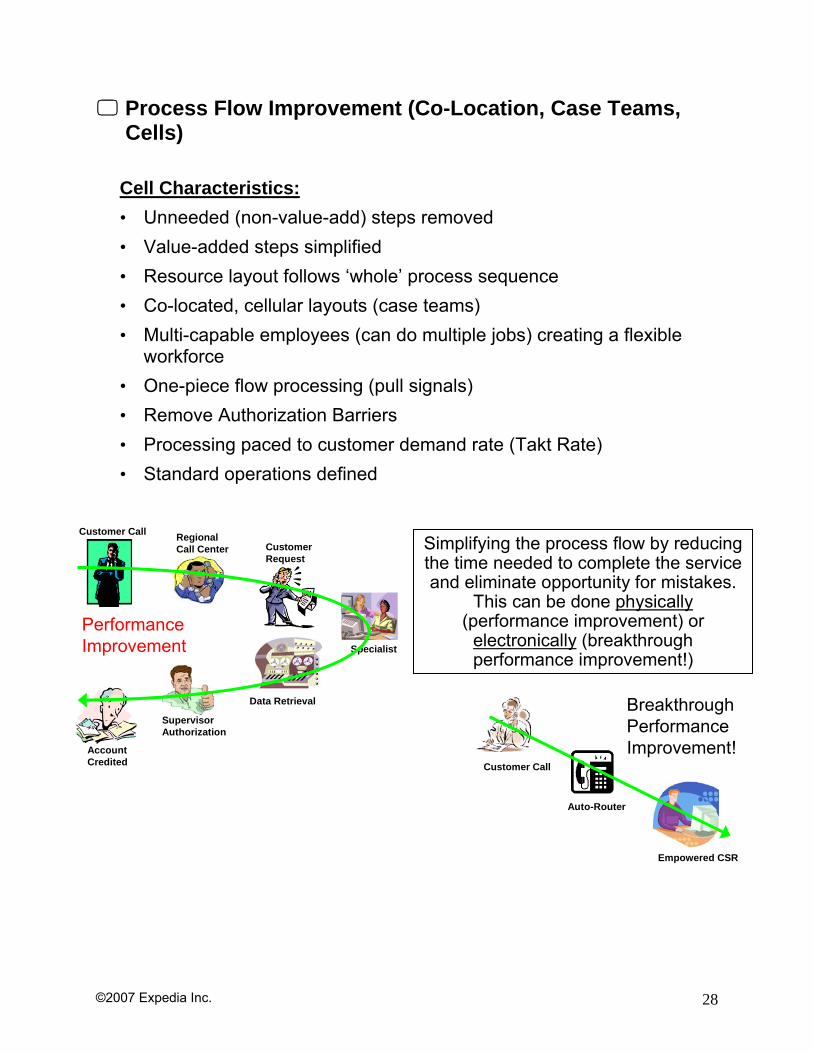
Process Flow Improvement (Co-Location, Case Teams, Cells)
Cell Characteristics: • Unneeded (non-value-add) steps removed • Value-added steps simplified • Resource layout follows ‘whole’ process sequence • Co-located, cellular layouts (case teams) • Multi-capable employees (can do multiple jobs) creating a flexible
workforce • One-piece flow processing (pull signals) • Remove Authorization Barriers • Processing paced to customer demand rate (Takt Rate) • Standard operations defined
Regional Call Center
Customer Call
Specialist
Data Retrieval
Account Credited
Supervisor Authorization
Customer Request
Auto-Router
Customer Call
Empowered CSR
Simplifying the process flow by reducing the time needed to complete the service and eliminate opportunity for mistakes.
This can be done physically(performance improvement) or
electronically (breakthrough performance improvement!)
Performance Improvement
Breakthrough Performance Improvement!
©2007 Expedia Inc. 29
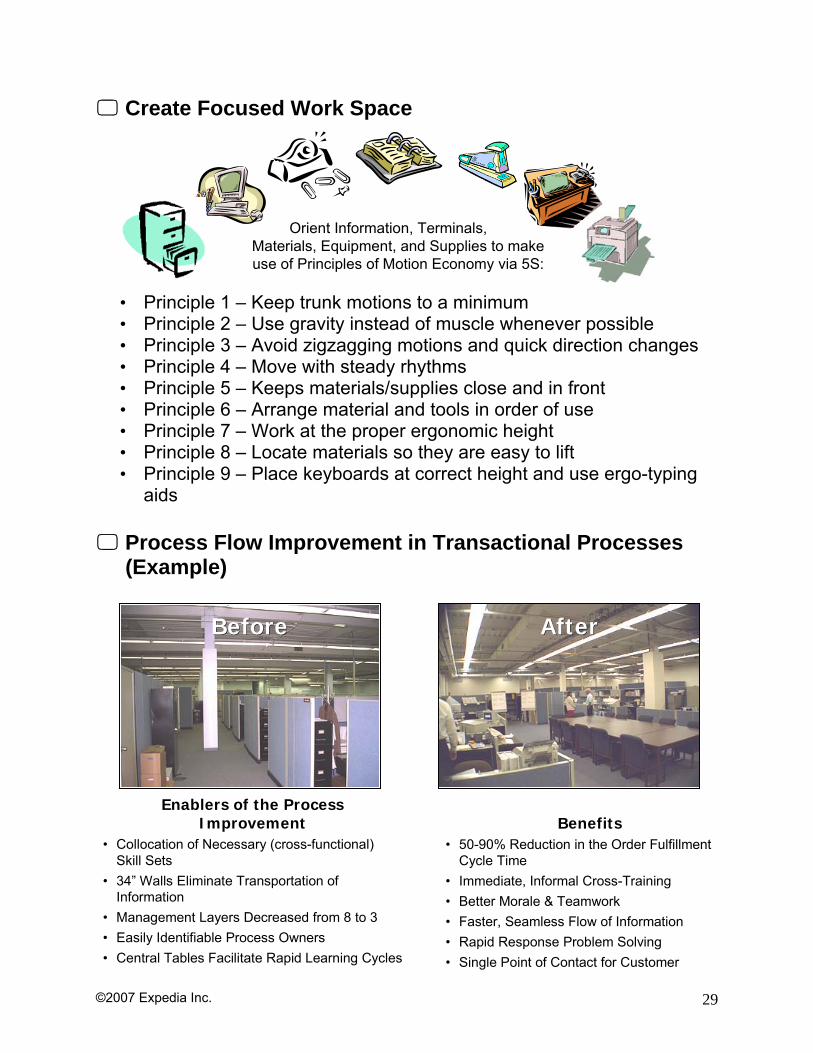
Create Focused Work Space
• Principle 1 – Keep trunk motions to a minimum • Principle 2 – Use gravity instead of muscle whenever possible • Principle 3 – Avoid zigzagging motions and quick direction changes • Principle 4 – Move with steady rhythms • Principle 5 – Keeps materials/supplies close and in front • Principle 6 – Arrange material and tools in order of use • Principle 7 – Work at the proper ergonomic height • Principle 8 – Locate materials so they are easy to lift • Principle 9 – Place keyboards at correct height and use ergo-typing
aids
Process Flow Improvement in Transactional Processes (Example)
Enablers of the Process Improvement
• Collocation of Necessary (cross-functional) Skill Sets
• 34” Walls Eliminate Transportation of Information
• Management Layers Decreased from 8 to 3• Easily Identifiable Process Owners• Central Tables Facilitate Rapid Learning Cycles
Benefits• 50-90% Reduction in the Order Fulfillment
Cycle Time• Immediate, Informal Cross-Training• Better Morale & Teamwork• Faster, Seamless Flow of Information• Rapid Response Problem Solving• Single Point of Contact for Customer
BeforeBefore AfterAfter
Orient Information, Terminals,Materials, Equipment, and Supplies to make use of Principles of Motion Economy via 5S:
©2007 Expedia Inc. 30
Other Improvement Examples • Simplification / Elimination of forms • Eliminate multiple entry of same data
• I.e., only enter account number one time, carries through to all account fields
• Drop down lists to eliminate errors • Single key/field entry to other screens: do not need to back out of long
tree • How to quickly get back to page 4 when on page 10?
• Work all jobs FIFO, or work small/easy jobs first? • Set aside capacity for certain customers?
• 10 item or less check-out counters • Doctor sees patients Mon, Tue, performs surgery Wed, Thur
5. Achieve Lean Perfection
Lean Definition: “A manufacturing strategy that uses less of everything compared with traditional manufacturing: half the human effort, half the space, half the investment in tools, half the engineering hours to develop a new product. Also, it requires keeping far less than half the needed inventory on site, results in many fewer defects and produces a greater and ever growing variety of products.” “The goal of lean manufacturing is perfection: continually declining cost, zero defects, zero inventories, and endless product variety.” – The Machine That Changed the World
©2007 Expedia Inc. 31
5. Achieve Lean Perfection • Identify all opportunities for continuous improvement
• Reduction of effort • Reduction of time • Reduction of space • Reduction of cost • Reduction of mistakes • Increasing customer satisfaction
• Improve the process through a variety of Lean tools/techniques:
• Value Stream Mapping • Time Trap Identification • Heijunka/Leveling/Stability (S&OP) • Kaizen/Continuous Improvement • Kaikaku/Innovation • Jidoka/Automation • Kanban/Just In Time • 5S Organization • Stocking Strategy
• Generic & Replenishment Pull Systems • Visual Tools, Visual Processes • Cellular Layouts & Line Balancing • Standardized Work • Total Productive Maintenance (TPM) • Make vs. Buy, Distribution Mgmt, • Strategic Sourcing, Tactical Purchasing
©2007 Expedia Inc. 32
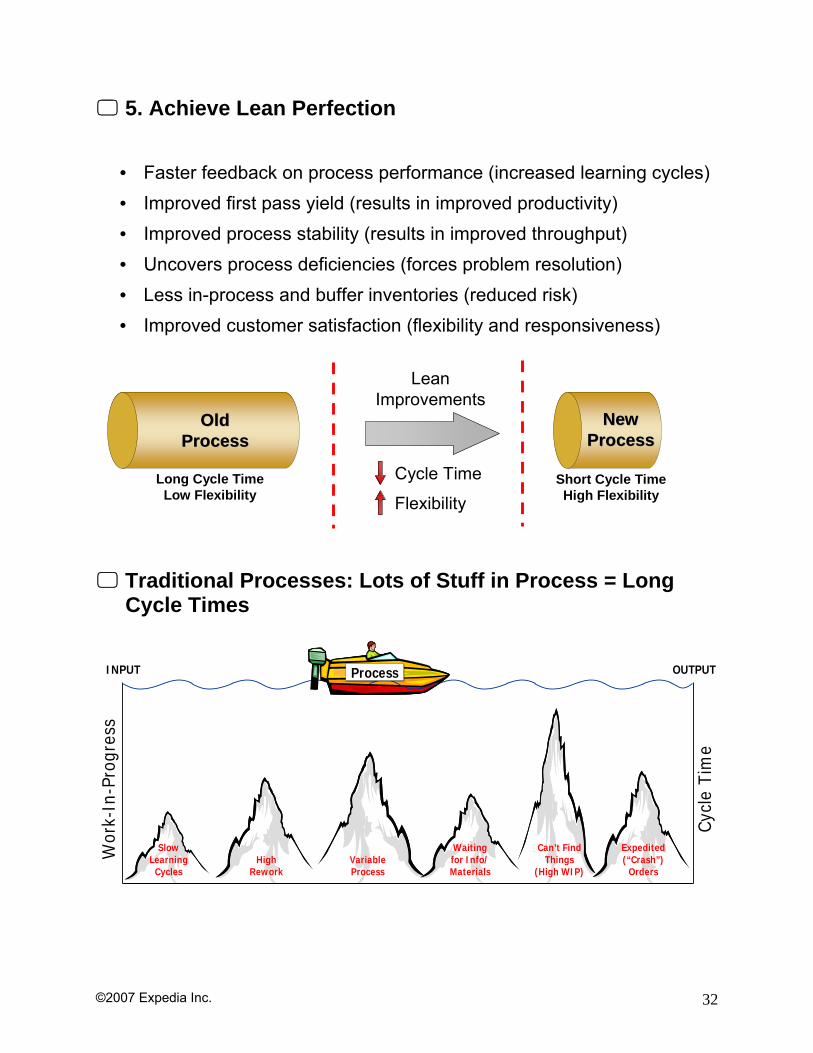
5. Achieve Lean Perfection
• Faster feedback on process performance (increased learning cycles) • Improved first pass yield (results in improved productivity) • Improved process stability (results in improved throughput) • Uncovers process deficiencies (forces problem resolution) • Less in-process and buffer inventories (reduced risk) • Improved customer satisfaction (flexibility and responsiveness)
Traditional Processes: Lots of Stuff in Process = Long Cycle Times
Slow Learning
CyclesHigh
ReworkVariable Process
Waiting for Info/Materials
Can’t FindThings
(High WIP)
Expedited(“Crash”)
Orders
Wor
k-In
-Pro
gres
s
Cycl
e Ti
me
INPUT OUTPUTProcessProcess
Cycle Time
Flexibility
Old Process
Old Process
New Process
New Process
LeanImprovements
Long Cycle TimeLow Flexibility
Short Cycle TimeHigh Flexibility
©2007 Expedia Inc. 33
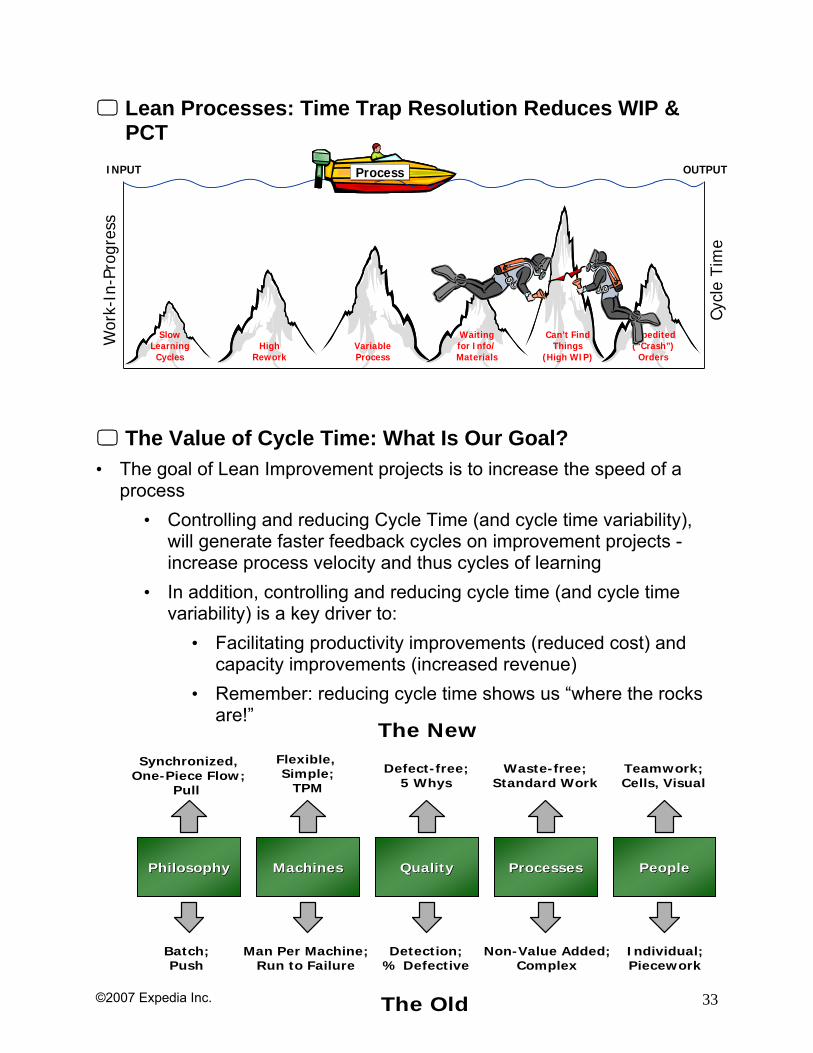
Lean Processes: Time Trap Resolution Reduces WIP & PCT
The Value of Cycle Time: What Is Our Goal?
• The goal of Lean Improvement projects is to increase the speed of a process
• Controlling and reducing Cycle Time (and cycle time variability), will generate faster feedback cycles on improvement projects - increase process velocity and thus cycles of learning
• In addition, controlling and reducing cycle time (and cycle time variability) is a key driver to:
• Facilitating productivity improvements (reduced cost) and capacity improvements (increased revenue)
• Remember: reducing cycle time shows us “where the rocks are!”
Slow Learning
CyclesHigh
ReworkVariable Process
Waiting for Info/Materials
Can’t FindThings
(High WIP)
Expedited(“Crash”)
Orders
Wor
k-In
-Pro
gres
s
Cycl
e Ti
me
INPUT OUTPUTProcessProcess
Synchronized,One-Piece Flow;
Pull
Flexible, Simple;
TPM
Defect-free;5 Whys
Waste-free;Standard Work
Teamwork;Cells, Visual
The New
PhilosophyPhilosophy MachinesMachines QualityQuality ProcessesProcesses PeoplePeople
Batch;Push
Man Per Machine;Run to Failure
Detection;% Defective
Non-Value Added;Complex
Individual;Piecework
The Old
©2007 Expedia Inc. 34
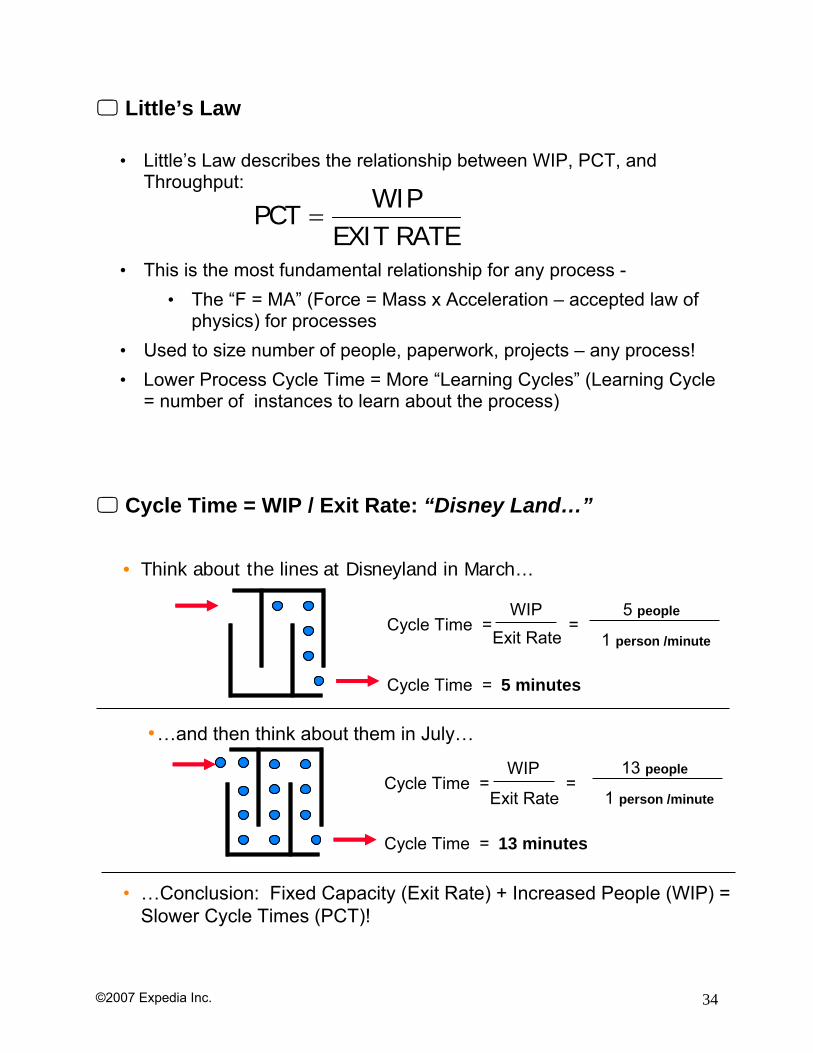
Little’s Law
• Little’s Law describes the relationship between WIP, PCT, and Throughput:
• This is the most fundamental relationship for any process - • The “F = MA” (Force = Mass x Acceleration – accepted law of
physics) for processes • Used to size number of people, paperwork, projects – any process! • Lower Process Cycle Time = More “Learning Cycles” (Learning Cycle
= number of instances to learn about the process)
Cycle Time = WIP / Exit Rate: “Disney Land…”
Cycle Time =
Cycle Time =
WIPExit Rate
=5 people
1 person /minute
5 minutes
•…and then think about them in July…
Cycle Time =
Cycle Time =
WIP
Exit Rate=
13 minutes
• Think about the lines at Disneyland in March…
• …Conclusion: Fixed Capacity (Exit Rate) + Increased People (WIP) = Slower Cycle Times (PCT)!
13 people
1 person /minute
RATE EXITWIP
PCT =
©2007 Expedia Inc. 35
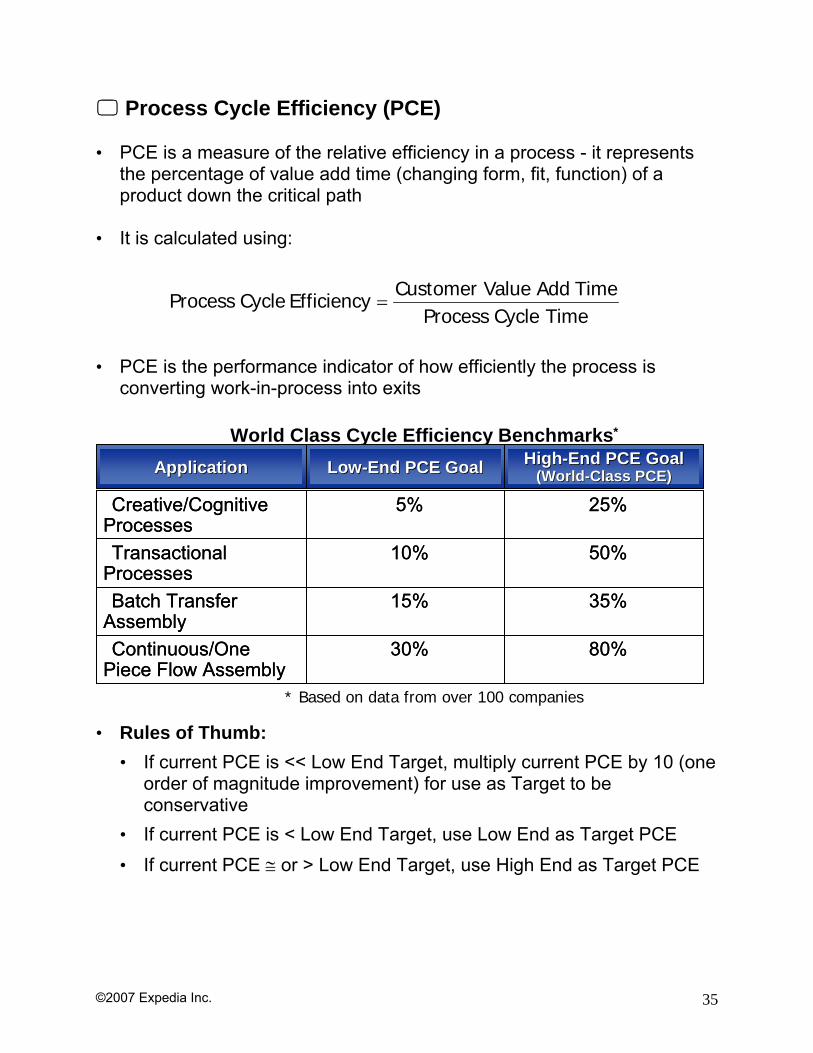
Process Cycle Efficiency (PCE) • PCE is a measure of the relative efficiency in a process - it represents
the percentage of value add time (changing form, fit, function) of a product down the critical path
• It is calculated using: • PCE is the performance indicator of how efficiently the process is
converting work-in-process into exits • Rules of Thumb:
• If current PCE is << Low End Target, multiply current PCE by 10 (one order of magnitude improvement) for use as Target to be conservative
• If current PCE is < Low End Target, use Low End as Target PCE • If current PCE ≅ or > Low End Target, use High End as Target PCE
Time Cycle ProcessTime AddalueCustomer V
Efficiency Cycle Process =
World Class Cycle Efficiency Benchmarks*
80%30%Continuous/One Piece Flow Assembly
35%15%Batch Transfer Assembly
50%10%Transactional Processes
25%5%Creative/Cognitive Processes
80%30%Continuous/One Piece Flow Assembly
35%15%Batch Transfer Assembly
50%10%Transactional Processes
25%5%Creative/Cognitive Processes
ApplicationApplicationApplicationApplication HighHigh--End PCE GoalEnd PCE Goal(World(World--Class PCE)Class PCE)
HighHigh--End PCE GoalEnd PCE Goal(World(World--Class PCE)Class PCE)LowLow--End PCE GoalEnd PCE GoalLowLow--End PCE GoalEnd PCE Goal
* Based on data from over 100 companies
©2007 Expedia Inc. 36
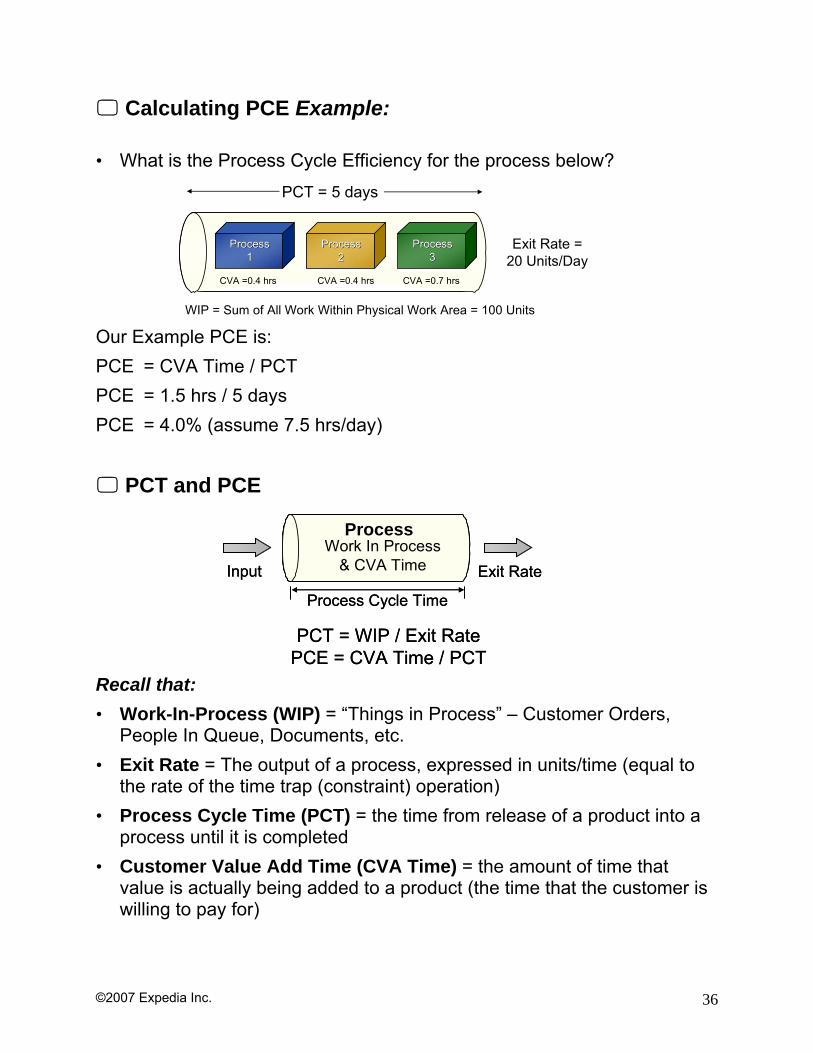
Calculating PCE Example: • What is the Process Cycle Efficiency for the process below? Our Example PCE is: PCE = CVA Time / PCT PCE = 1.5 hrs / 5 days PCE = 4.0% (assume 7.5 hrs/day)
PCT and PCE Recall that: • Work-In-Process (WIP) = “Things in Process” – Customer Orders,
People In Queue, Documents, etc. • Exit Rate = The output of a process, expressed in units/time (equal to
the rate of the time trap (constraint) operation) • Process Cycle Time (PCT) = the time from release of a product into a
process until it is completed • Customer Value Add Time (CVA Time) = the amount of time that
value is actually being added to a product (the time that the customer is willing to pay for)
PCT = 5 days
Exit Rate = 20 Units/Day
WIP = Sum of All Work Within Physical Work Area = 100 Units
CVA =0.4 hrs CVA =0.4 hrs CVA =0.7 hrs
ProcessProcess11
ProcessProcess22
ProcessProcess33
PCT = WIP / Exit RatePCE = CVA Time / PCT
Process
Exit RateWork In Process
& CVA Time
Process Cycle Time
Input
PCT = WIP / Exit RatePCE = CVA Time / PCT
Process
Exit RateWork In Process
& CVA Time
Process Cycle Time
Input
©2007 Expedia Inc. 37
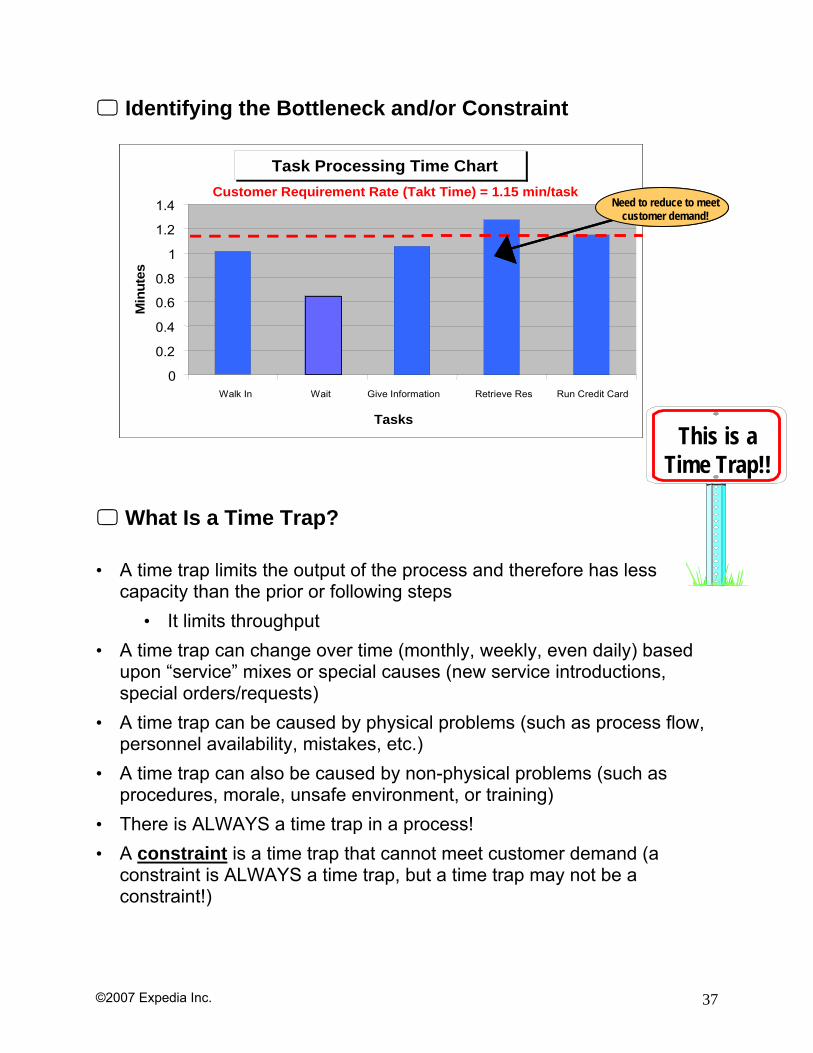
Identifying the Bottleneck and/or Constraint
What Is a Time Trap? • A time trap limits the output of the process and therefore has less
capacity than the prior or following steps • It limits throughput
• A time trap can change over time (monthly, weekly, even daily) based upon “service” mixes or special causes (new service introductions, special orders/requests)
• A time trap can be caused by physical problems (such as process flow, personnel availability, mistakes, etc.)
• A time trap can also be caused by non-physical problems (such as procedures, morale, unsafe environment, or training)
• There is ALWAYS a time trap in a process! • A constraint is a time trap that cannot meet customer demand (a
constraint is ALWAYS a time trap, but a time trap may not be a constraint!)
Takt Time Processing Time Chart
0
0.2
0.4
0.6
0.8
1
1.2
1.4
Turn Drill Finsh Paint Ship
Operations
Min
utes
Takt Time = 1.15
Need to reduce to meet customer demand!
Task Processing Time Chart
0
0.2
0.4
0.6
0.8
1
1.2
1.4
Walk In Wait Give Information Retrieve Res Run Credit Card
Tasks
Min
utes
Customer Requirement Rate (Takt Time) = 1.15 min/task Need to reduce to meet
customer demand!
Takt Time Processing Time Chart
0
0.2
0.4
0.6
0.8
1
1.2
1.4
Turn Drill Finsh Paint Ship
Operations
Min
utes
Takt Time = 1.15
Takt Time Processing Time Chart
0
0.2
0.4
0.6
0.8
1
1.2
1.4
Turn Drill Finsh Paint Ship
Operations
Min
utes
Takt Time = 1.15
Need to reduce to meet customer demand!
Task Processing Time Chart
0
0.2
0.4
0.6
0.8
1
1.2
1.4
Walk In Wait Give Information Retrieve Res Run Credit Card
Tasks
Min
utes
Customer Requirement Rate (Takt Time) = 1.15 min/task Need to reduce to meet
customer demand!
This is aTime Trap!!
This is aTime Trap!!
©2007 Expedia Inc. 38
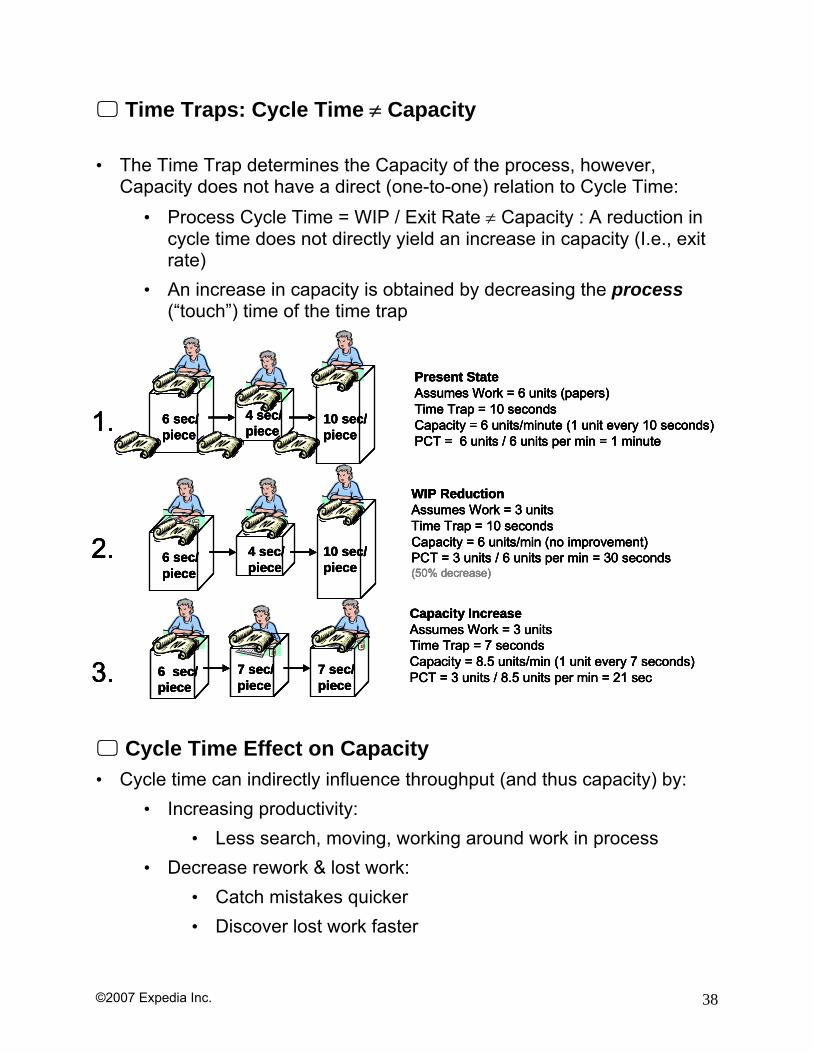
Time Traps: Cycle Time ≠ Capacity • The Time Trap determines the Capacity of the process, however,
Capacity does not have a direct (one-to-one) relation to Cycle Time: • Process Cycle Time = WIP / Exit Rate ≠ Capacity : A reduction in
cycle time does not directly yield an increase in capacity (I.e., exit rate)
• An increase in capacity is obtained by decreasing the process (“touch”) time of the time trap
Cycle Time Effect on Capacity
• Cycle time can indirectly influence throughput (and thus capacity) by: • Increasing productivity:
• Less search, moving, working around work in process • Decrease rework & lost work:
• Catch mistakes quicker • Discover lost work faster
Present StateAssumes Work = 6 units (papers)Time Trap = 10 secondsCapacity = 6 units/minute (1 unit every 10 seconds)PCT = 6 units / 6 units per min = 1 minute
Capacity IncreaseAssumes Work = 3 unitsTime Trap = 7 secondsCapacity = 8.5 units/min (1 unit every 7 seconds)PCT = 3 units / 8.5 units per min = 21 sec
6 sec/piece
10 sec/piece
4 sec/piece
7 sec/piece
10 sec/piece
4 sec/piece
1.
2.
3. 7 sec/piece
6 sec/piece
6 sec/piece
WIP ReductionAssumes Work = 3 unitsTime Trap = 10 secondsCapacity = 6 units/min (no improvement)PCT = 3 units / 6 units per min = 30 seconds(50% decrease)
©2007 Expedia Inc. 39
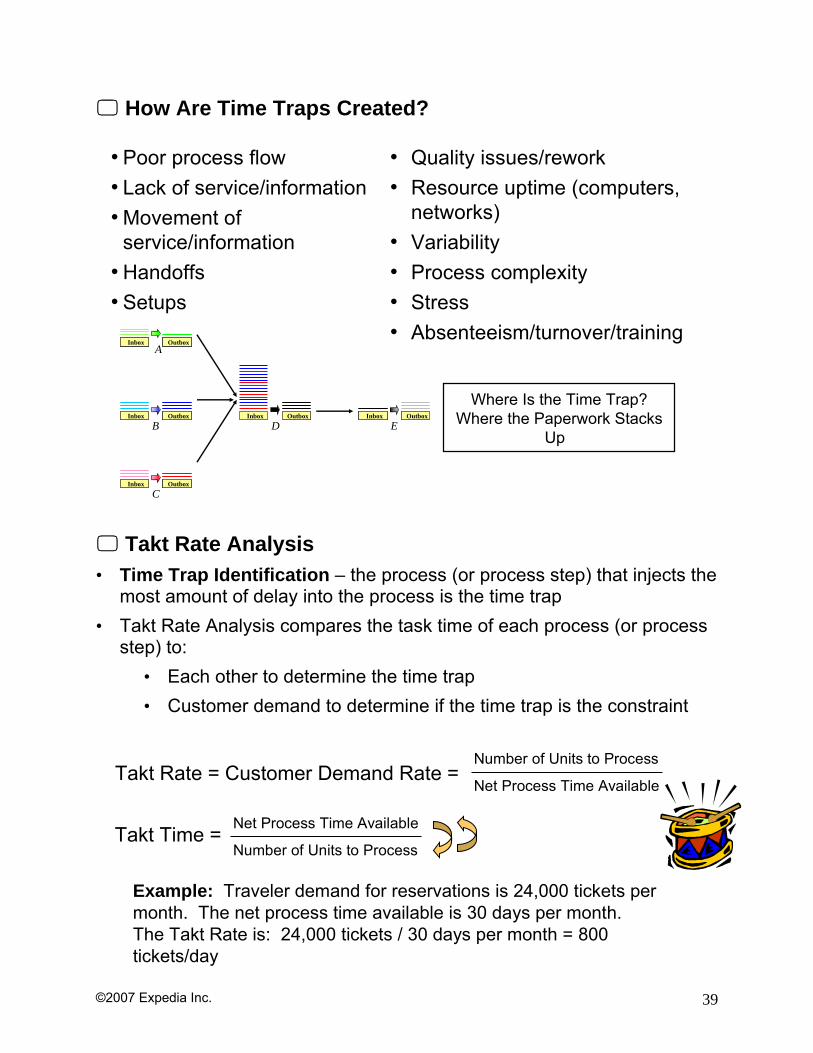
How Are Time Traps Created?
Takt Rate Analysis • Time Trap Identification – the process (or process step) that injects the
most amount of delay into the process is the time trap • Takt Rate Analysis compares the task time of each process (or process
step) to: • Each other to determine the time trap • Customer demand to determine if the time trap is the constraint
• Poor process flow• Lack of service/information• Movement of
service/information• Handoffs• Setups
• Quality issues/rework• Resource uptime (computers,
networks)• Variability• Process complexity• Stress• Absenteeism/turnover/training
Example: Traveler demand for reservations is 24,000 tickets per month. The net process time available is 30 days per month.The Takt Rate is: 24,000 tickets / 30 days per month = 800 tickets/day
Takt Rate = Customer Demand Rate =
Net Process Time Available
Number of Units to ProcessTakt Time =
Number of Units to Process
Net Process Time Available
Inbox
InboxInbox
InboxInbox
OutboxOutbox
OutboxOutbox OutboxOutbox InboxInbox
InboxInbox OutboxOutbox
OutboxOutbox
A
B
C
D E
Where Is the Time Trap? Where the Paperwork Stacks
Up
©2007 Expedia Inc. 40
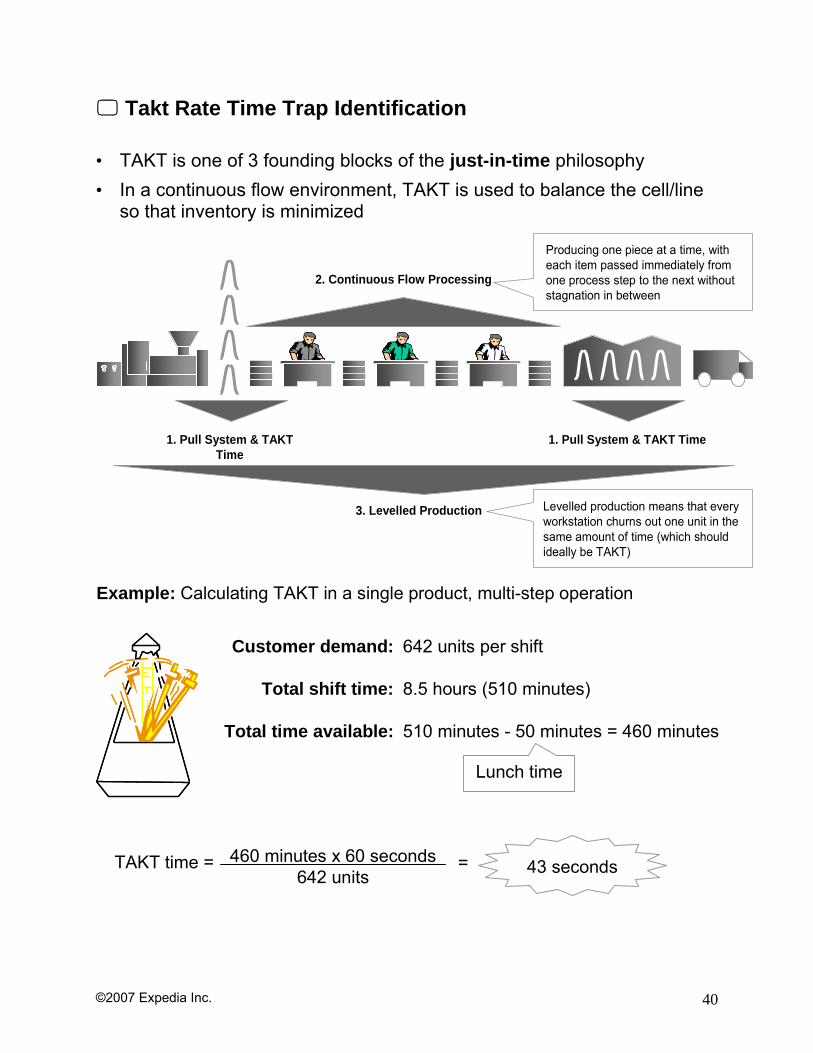
Takt Rate Time Trap Identification • TAKT is one of 3 founding blocks of the just-in-time philosophy • In a continuous flow environment, TAKT is used to balance the cell/line
so that inventory is minimized
1. Pull System & TAKT Time
1. Pull System & TAKT Time1. Pull System & TAKT Time
2. Continuous Flow Processing2. Continuous Flow Processing
3. Levelled Production3. Levelled Production
Producing one piece at a time, with each item passed immediately from one process step to the next without stagnation in between
Levelled production means that every workstation churns out one unit in the same amount of time (which should ideally be TAKT)
Customer demand:
Total shift time:
Total time available:
642 units per shift
8.5 hours (510 minutes)
510 minutes - 50 minutes = 460 minutes
460 minutes x 60 seconds642 units
TAKT time = = 43 seconds
Example: Calculating TAKT in a single product, multi-step operation
Lunch time
©2007 Expedia Inc. 41
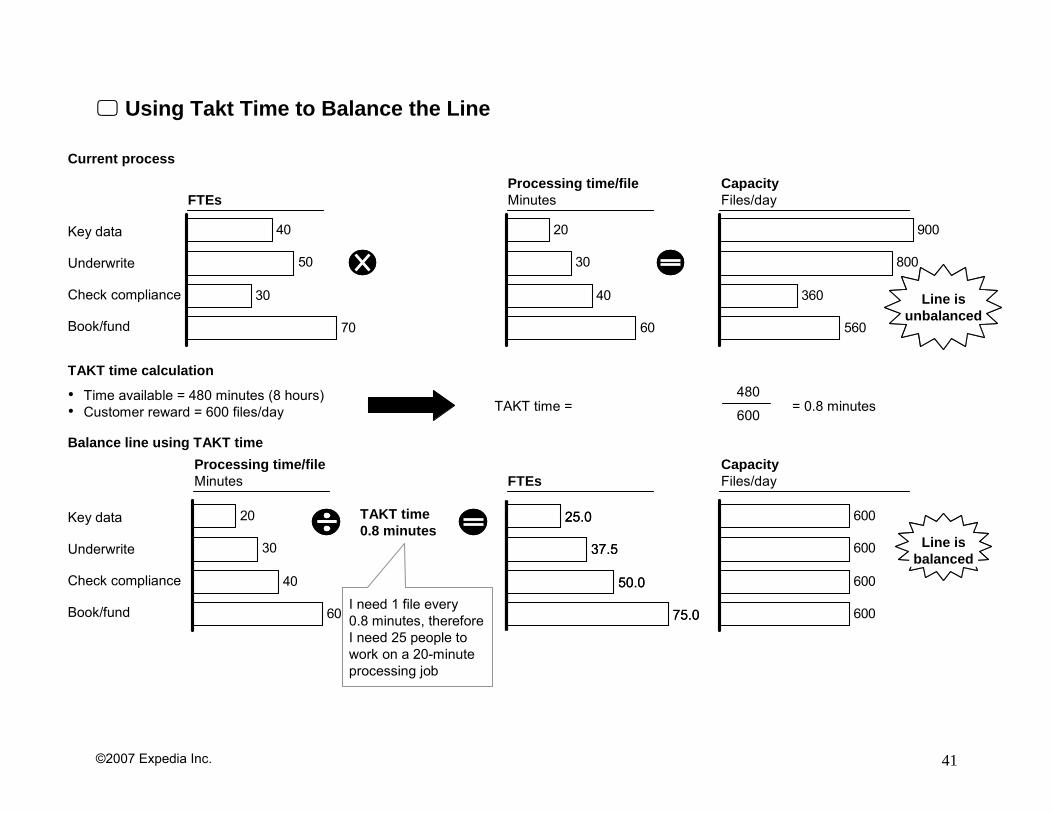
Using Takt Time to Balance the Line
Key data
Underwrite
Check compliance
Book/fund
Current process
70
30
50
40
FTEs
60
40
30
20
Processing time/file Minutes
560
360
800
900
Capacity Files/day
Key data
Underwrite
Check compliance
Book/fund
Balance line using TAKT time
600
600
600
600
Capacity Files/day
60
40
30
20
Processing time/file Minutes FTEs
75.0
50.0
37.5
25.0
75.0
50.0
37.5
25.0
I need 1 file every 0.8 minutes, therefore I need 25 people to work on a 20-minute processing job
TAKT time 0.8 minutes
TAKT time calculation
• Time available = 480 minutes (8 hours)• Customer reward = 600 files/day TAKT time =
480
600= 0.8 minutes
Line is unbalanced
Line is unbalanced
Line is balanced
Line is balanced
©2007 Expedia Inc. 42
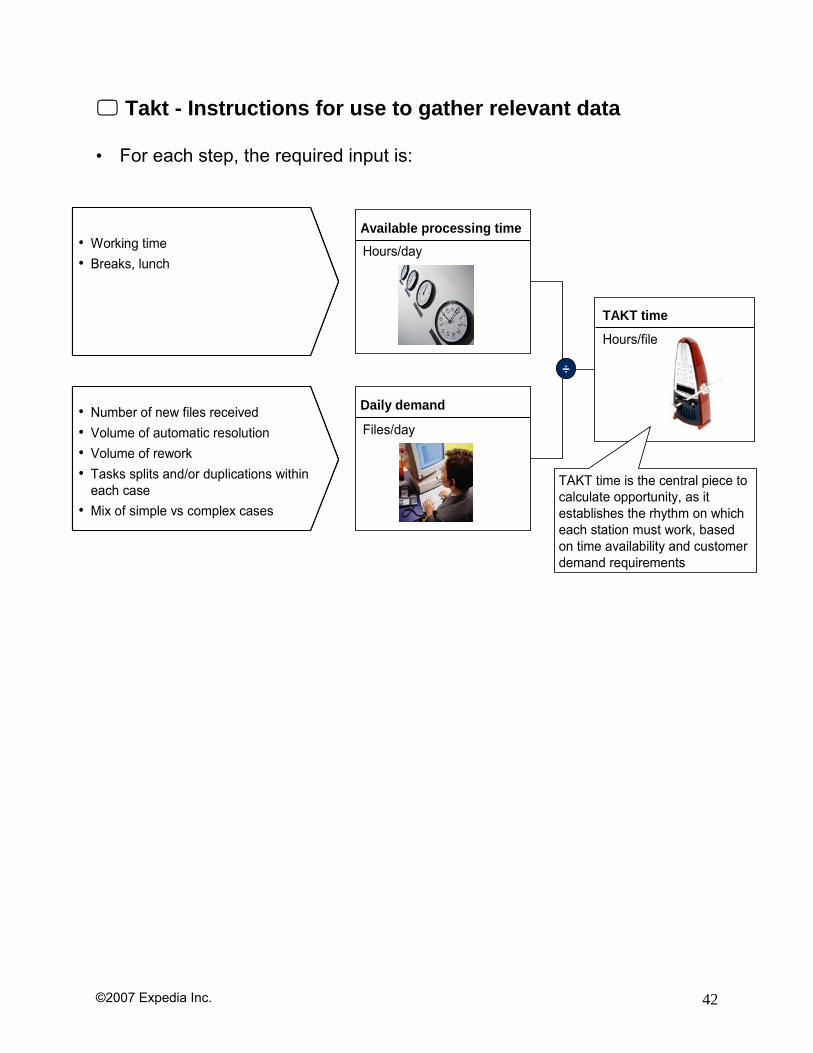
Takt - Instructions for use to gather relevant data • For each step, the required input is:
• Working time• Breaks, lunch
• Number of new files received• Volume of automatic resolution• Volume of rework• Tasks splits and/or duplications within
each case• Mix of simple vs complex cases
• Working time• Breaks, lunch
• Number of new files received• Volume of automatic resolution• Volume of rework• Tasks splits and/or duplications within
each case• Mix of simple vs complex cases
Available processing timeHours/day
Daily demand
Files/day
÷
TAKT time
Hours/file
TAKT time is the central piece to calculate opportunity, as it establishes the rhythm on which each station must work, based on time availability and customer demand requirements
©2007 Expedia Inc. 43
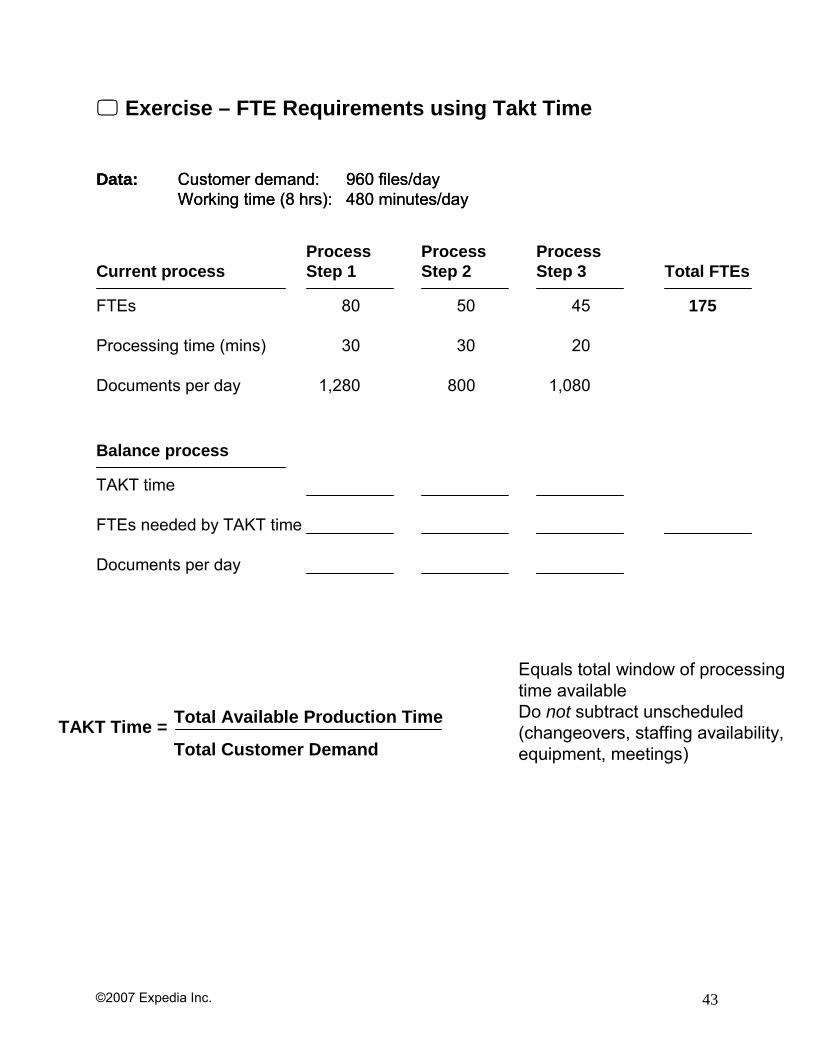
Exercise – FTE Requirements using Takt Time
Data: Customer demand: 960 files/dayWorking time (8 hrs): 480 minutes/day
Data: Customer demand: 960 files/dayWorking time (8 hrs): 480 minutes/day
Current processProcess Step 1
Process Step 2
Process Step 3 Total FTEs
FTEs
Processing time (mins)
Documents per day
80
30
1,280
50
30
800
45
20
1,080
175
Balance process
TAKT time
FTEs needed by TAKT time
Documents per day
TAKT Time = Total Available Production Time
Total Customer Demand
Equals total window of processing time availableDo not subtract unscheduled (changeovers, staffing availability, equipment, meetings)
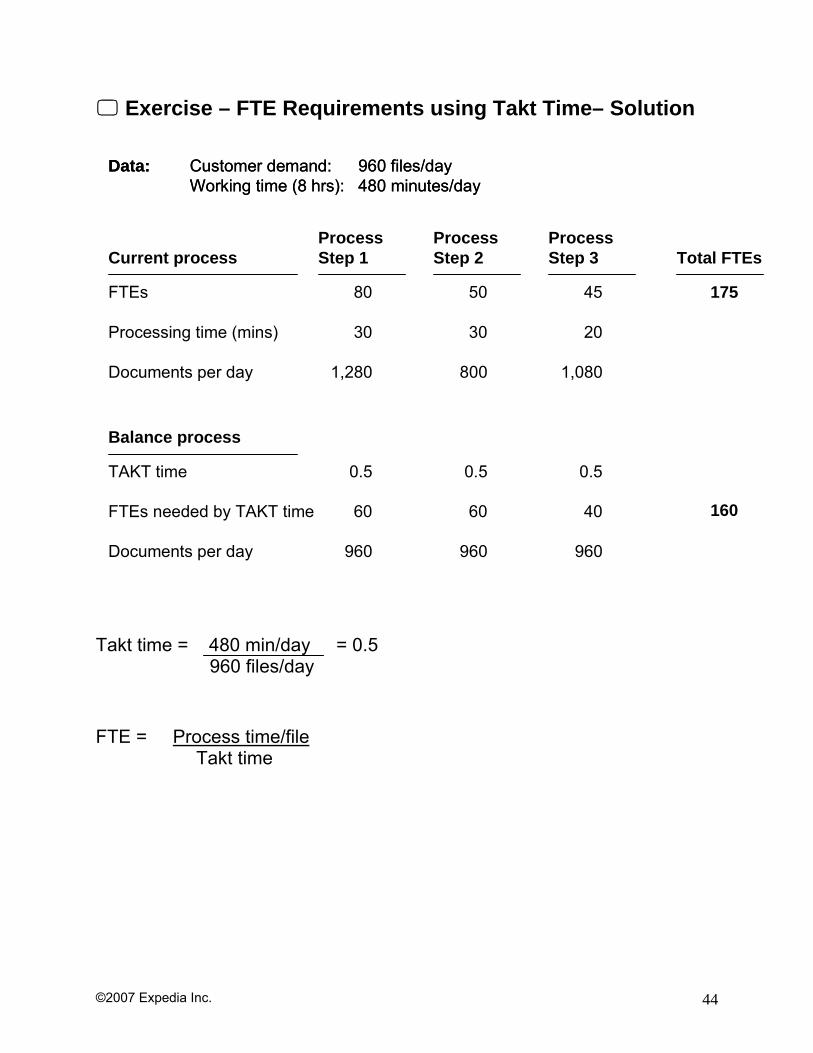
©2007 Expedia Inc. 44
Exercise – FTE Requirements using Takt Time– Solution Takt time = 480 min/day = 0.5 960 files/day FTE = Process time/file Takt time
Data: Customer demand: 960 files/dayWorking time (8 hrs): 480 minutes/day
Data: Customer demand: 960 files/dayWorking time (8 hrs): 480 minutes/day
Current processProcess Step 1
Process Step 2
Process Step 3 Total FTEs
FTEs
Processing time (mins)
Documents per day
80
30
1,280
50
30
800
45
20
1,080
175
Balance process
TAKT time
FTEs needed by TAKT time
Documents per day
0.5
60
960
0.5
60
960
0.5
40
960
160
©2007 Expedia Inc. 45
Integration of Lean and Six Sigma
• Lean and Six Sigma can co-exist independently, but the benefits of integration are tremendous...
• Single channel for employing limited resources • One improvement strategy for the organization • Highly productive and profitable synergy
• The pitfalls of not integrating them are formidable • Six Sigma does not always teach speed tools and therefore
does not always attack manufacturing overhead cost and invested capital directly using available best practices
• Lean lacks defined cultural infrastructure - without CEO engagement, deployment organization (Champions and Black Belts), and focus on customer many lean implementations fail
• Lean lacks the consistency of the DMAIC philosophy, leading to wide variation in application of tools & techniques
• Most lean efforts lack focus on variation elimination and simply “account for” the variability by carrying excess inventory and resources
• Lean Tools do not intrinsically focus on bringing a process under control
• The result • Divided focus of the organization • Separate and unequal messages for improvement • Destructive competition for resources and projects
©2007 Expedia Inc. 46
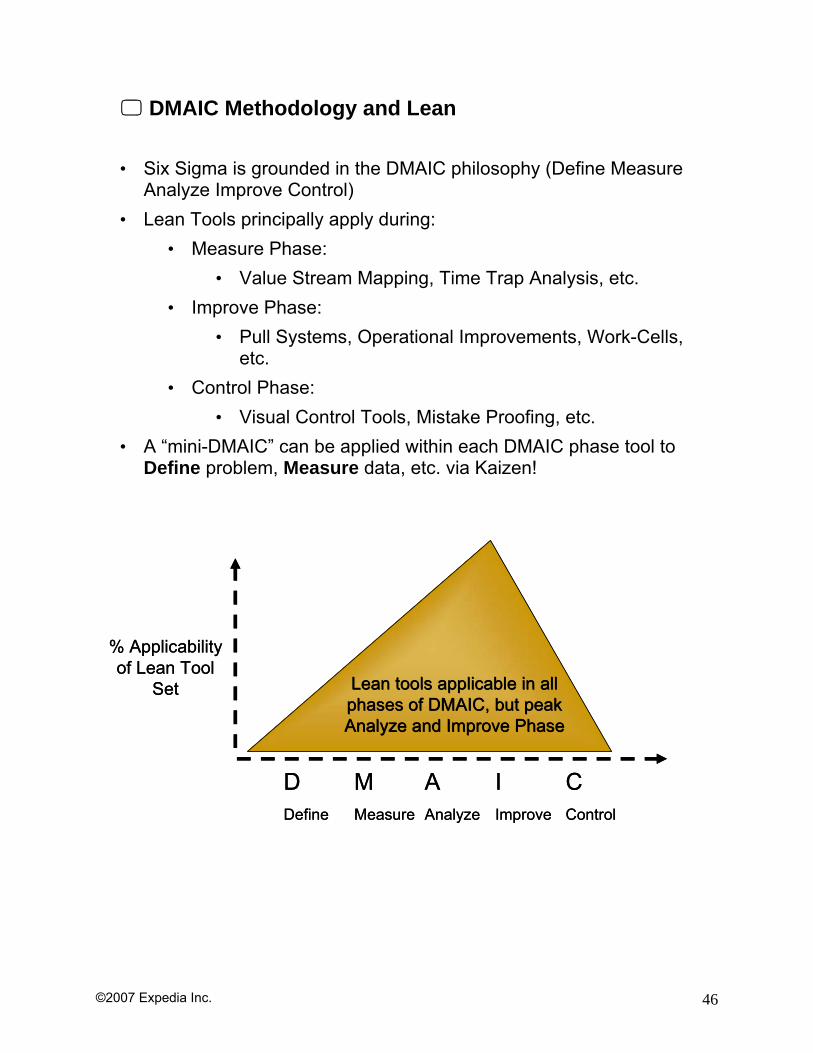
DMAIC Methodology and Lean • Six Sigma is grounded in the DMAIC philosophy (Define Measure
Analyze Improve Control) • Lean Tools principally apply during:
• Measure Phase: • Value Stream Mapping, Time Trap Analysis, etc.
• Improve Phase: • Pull Systems, Operational Improvements, Work-Cells,
etc. • Control Phase:
• Visual Control Tools, Mistake Proofing, etc. • A “mini-DMAIC” can be applied within each DMAIC phase tool to
Define problem, Measure data, etc. via Kaizen!
D M A I CDefine Measure Analyze Improve Control
% Applicability of Lean Tool
Set Lean tools applicable in all phases of DMAIC, but peak Analyze and Improve Phase
Lean tools applicable in all phases of DMAIC, but peak Analyze and Improve Phase
D M A I CDefine Measure Analyze Improve Control
% Applicability of Lean Tool
Set Lean tools applicable in all phases of DMAIC, but peak Analyze and Improve Phase
Lean tools applicable in all phases of DMAIC, but peak Analyze and Improve Phase
©2007 Expedia Inc. 47
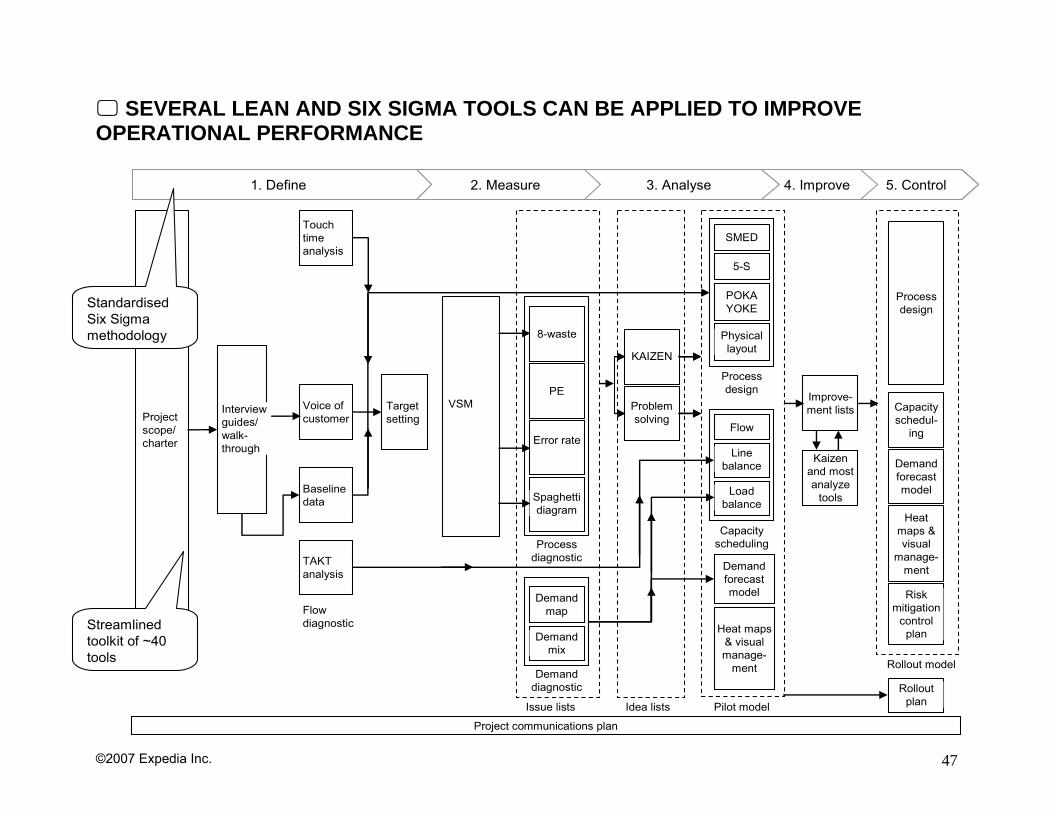
SEVERAL LEAN AND SIX SIGMA TOOLS CAN BE APPLIED TO IMPROVE OPERATIONAL PERFORMANCE
Project scope/ charter
Interview guides/ walk-through
Touch time analysis
Voice of customer
Baseline data
TAKT analysis
Flow diagnostic
Target setting
VSM
8-waste
PE
Error rate
Spaghetti diagram
Demand map
Demand mix
Demand diagnostic
Issue lists Idea lists
KAIZEN
Problem solving
SMED
5-S
POKA YOKE
Physical layout
Flow
Line balance
Capacity scheduling
Process design
Load balance
Demand forecast model
Pilot model
Heat maps & visual manage-
ment
Improve-ment lists Capacity
schedul-ing
Demand forecast model
Risk mitigation
control plan
Rollout model
Rollout plan
Process design
Heat maps & visual
manage-ment
Process diagnostic
Kaizen and most analyze
tools
Project communications plan
2. Measure 3. Analyse1. Define 4. Improve 5. Control2. Measure 3. Analyse1. Define 4. Improve 5. Control1. Define 4. Improve 5. Control
Standardised Six Sigma methodology
Streamlined toolkit of ~40 tools
©2007 Expedia Inc. 48
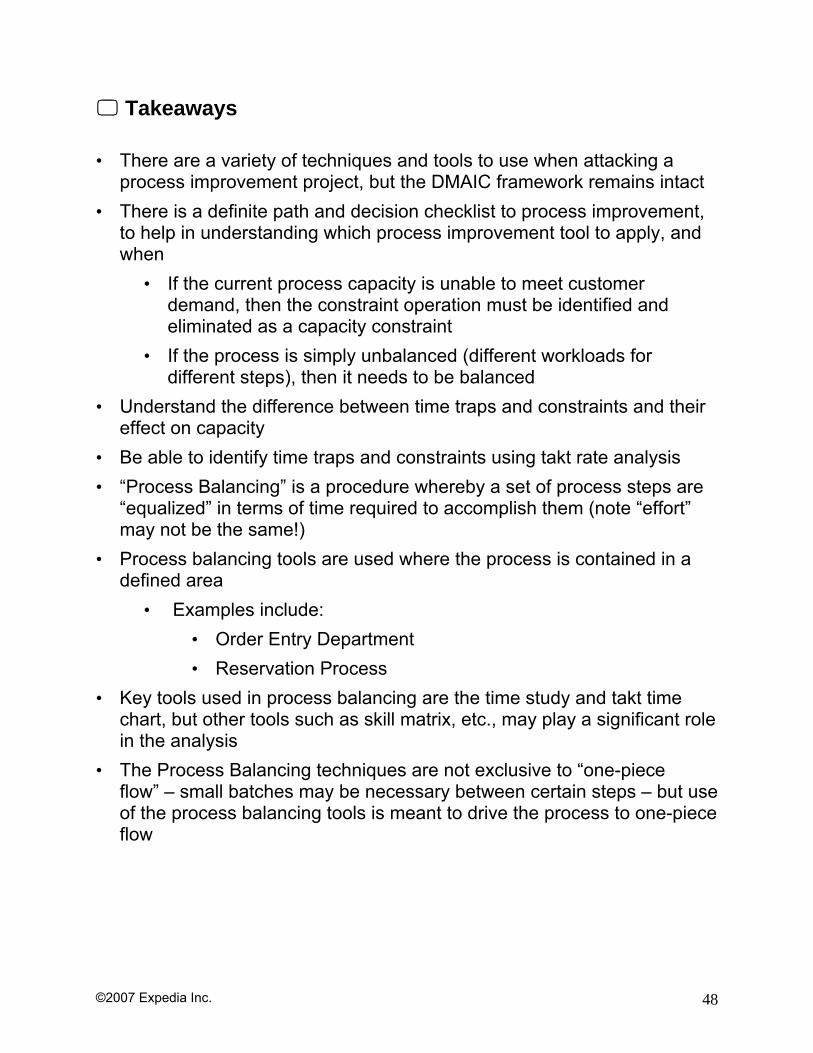
Takeaways • There are a variety of techniques and tools to use when attacking a
process improvement project, but the DMAIC framework remains intact • There is a definite path and decision checklist to process improvement,
to help in understanding which process improvement tool to apply, and when
• If the current process capacity is unable to meet customer demand, then the constraint operation must be identified and eliminated as a capacity constraint
• If the process is simply unbalanced (different workloads for different steps), then it needs to be balanced
• Understand the difference between time traps and constraints and their effect on capacity
• Be able to identify time traps and constraints using takt rate analysis • “Process Balancing” is a procedure whereby a set of process steps are
“equalized” in terms of time required to accomplish them (note “effort” may not be the same!)
• Process balancing tools are used where the process is contained in a defined area
• Examples include: • Order Entry Department • Reservation Process
• Key tools used in process balancing are the time study and takt time chart, but other tools such as skill matrix, etc., may play a significant role in the analysis
• The Process Balancing techniques are not exclusive to “one-piece flow” – small batches may be necessary between certain steps – but use of the process balancing tools is meant to drive the process to one-piece flow
©2007 Expedia Inc. 49
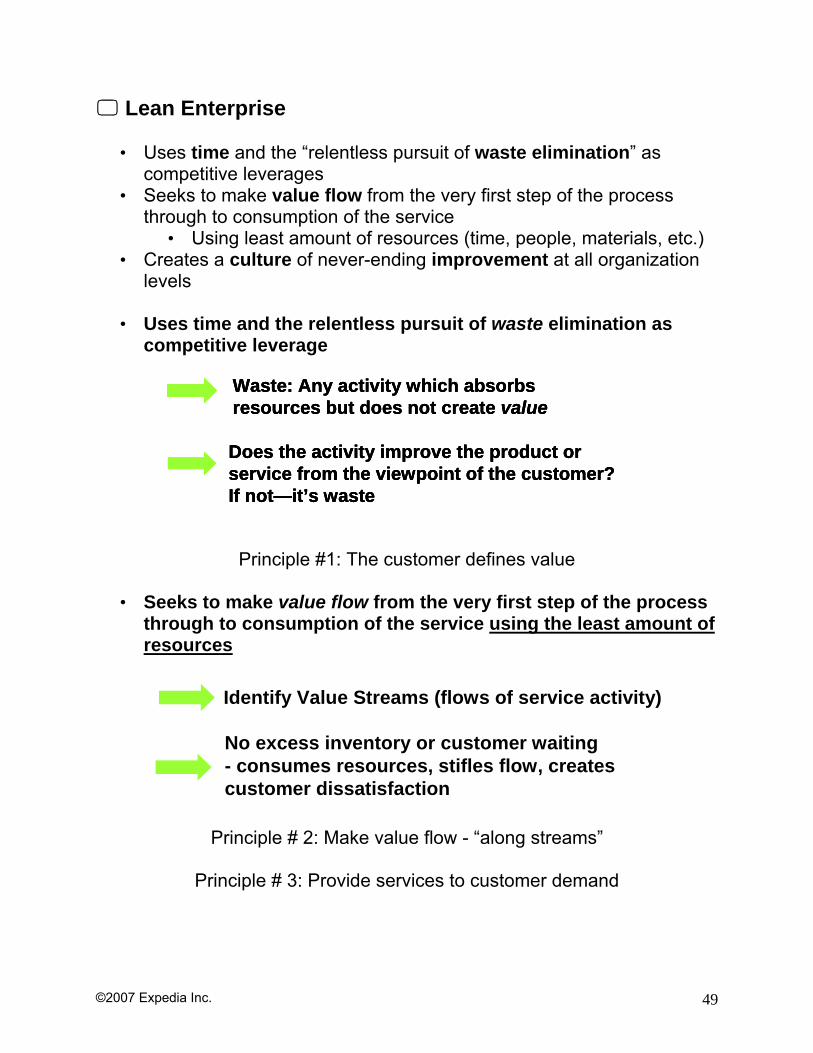
Lean Enterprise
• Uses time and the “relentless pursuit of waste elimination” as competitive leverages
• Seeks to make value flow from the very first step of the process through to consumption of the service
• Using least amount of resources (time, people, materials, etc.) • Creates a culture of never-ending improvement at all organization
levels
• Uses time and the relentless pursuit of waste elimination as competitive leverage
Principle #1: The customer defines value
• Seeks to make value flow from the very first step of the process through to consumption of the service using the least amount of resources
Principle # 2: Make value flow - “along streams”
Principle # 3: Provide services to customer demand
Waste: Any activity which absorbs resources but does not create value
Does the activity improve the product or service from the viewpoint of the customer?If not—it’s waste
Waste: Any activity which absorbs resources but does not create value Waste: Any activity which absorbs resources but does not create value
Does the activity improve the product or service from the viewpoint of the customer?If not—it’s waste
Does the activity improve the product or service from the viewpoint of the customer?If not—it’s waste
Identify Value Streams (flows of service activity)
No excess inventory or customer waiting- consumes resources, stifles flow, createscustomer dissatisfaction
©2007 Expedia Inc. 50
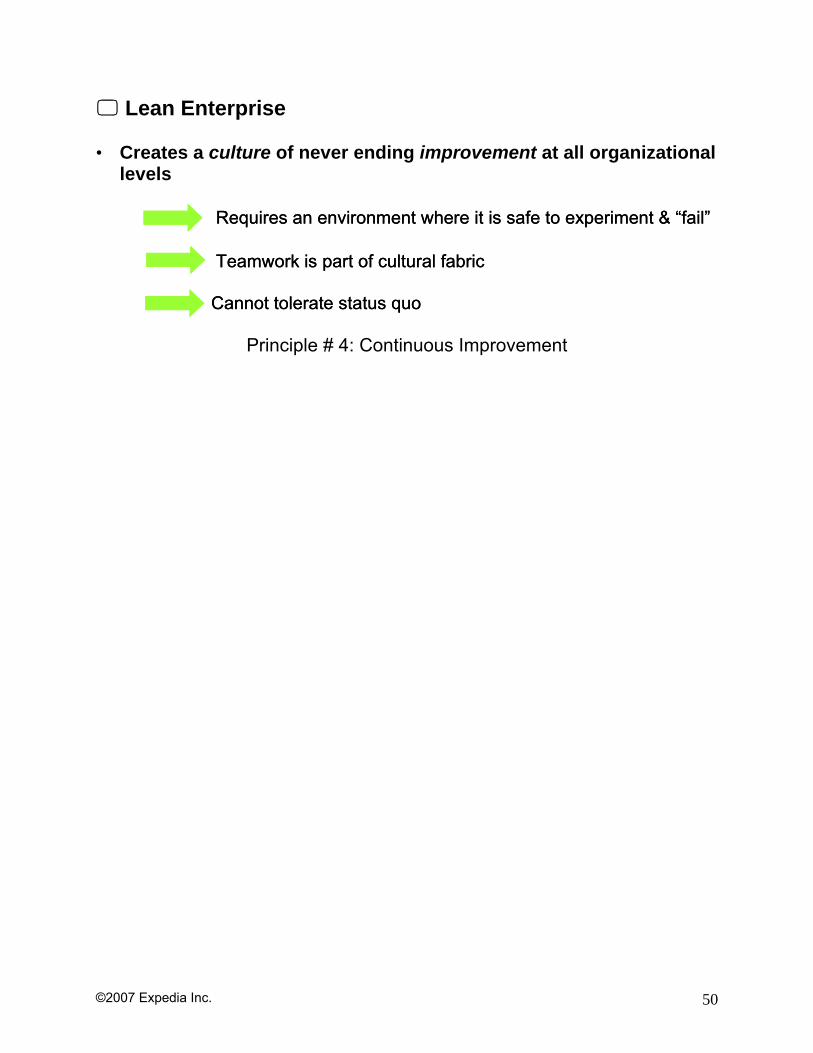
Lean Enterprise • Creates a culture of never ending improvement at all organizational
levels
Principle # 4: Continuous Improvement
Requires an environment where it is safe to experiment & “fail”
Teamwork is part of cultural fabric
Cannot tolerate status quo
Requires an environment where it is safe to experiment & “fail”
Teamwork is part of cultural fabric
Cannot tolerate status quo
©2007 Expedia Inc. 51
Transactional Cycle Time Simulation
“Alphabet Soup”
A CB
©2007 Expedia Inc. 52
Learning Objectives • Demonstrate the fundamental relationship between WIP, Cycle Time,
and Exit Rate • Demonstrate the impact of increasing WIP on a process performance
What’s in it for Me? • When performing process improvements, be able to understand the
fundamental drivers of a project to improve cycle time and a project to improve throughput rate
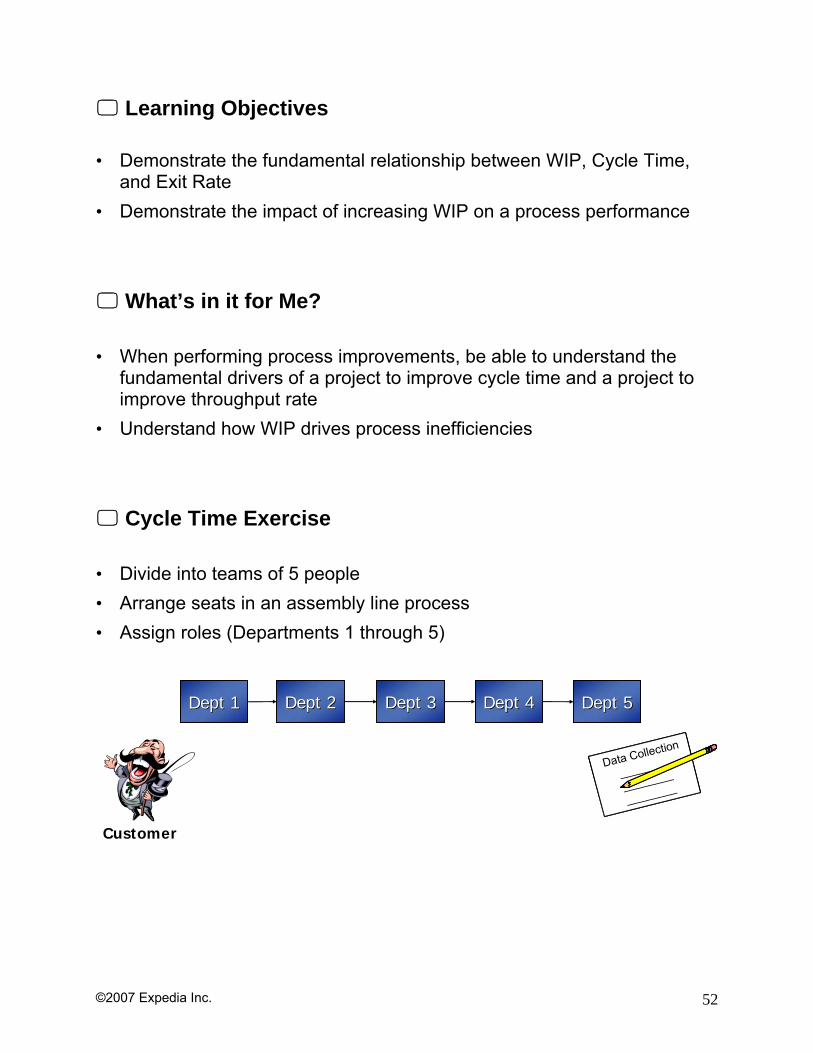
• Understand how WIP drives process inefficiencies
Cycle Time Exercise • Divide into teams of 5 people • Arrange seats in an assembly line process • Assign roles (Departments 1 through 5)
Dept 2Dept 2 Dept 3Dept 3 Dept 4Dept 4
Data Collection
________
________
________
Data Collection
________
________
________
Data Collection
________
________
________
Customer
Dept 1Dept 1 Dept 5Dept 5
©2007 Expedia Inc. 53
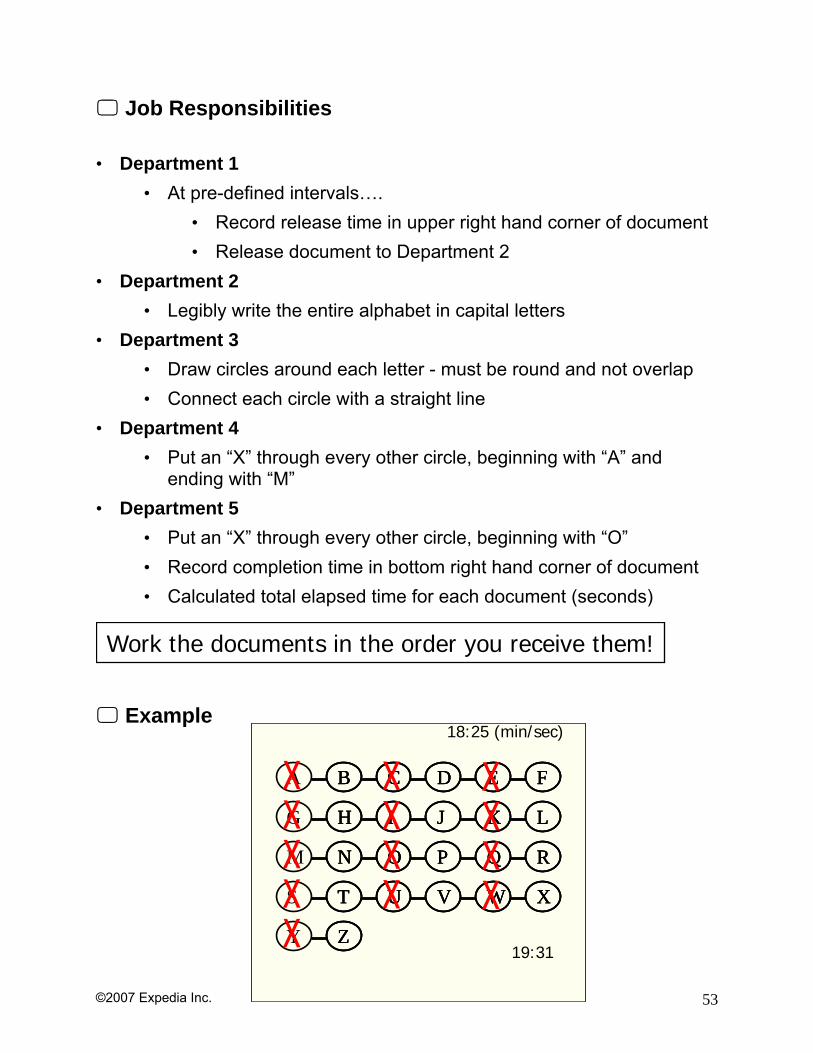
Job Responsibilities • Department 1
• At pre-defined intervals…. • Record release time in upper right hand corner of document • Release document to Department 2
• Department 2 • Legibly write the entire alphabet in capital letters
• Department 3 • Draw circles around each letter - must be round and not overlap • Connect each circle with a straight line
• Department 4 • Put an “X” through every other circle, beginning with “A” and
ending with “M” • Department 5
• Put an “X” through every other circle, beginning with “O” • Record completion time in bottom right hand corner of document • Calculated total elapsed time for each document (seconds)
Example
Work the documents in the order you receive them!
A B C D E F
G H I J K L
M N O P Q R
S T U V W X
Y Z
X X XX X XX X XX X XX
18:25 (min/sec)
19:31
A BBB CCC DDD EEE FFF
G HHH III JJJ KKK LLL
M NNN OOO PPP QQQ RRR
S TTT UUU VVV WWW XXX
Y ZZZ
X X XX X XX X XX X XX
18:25 (min/sec)
19:31
©2007 Expedia Inc. 54
Exercise – Part 1a • Pilot the process – run one document through the process
Exercise – Part 1b • Run another document through the process
• The first one was practice • This one is real
Exercise – Part 1b Results
• What was the cycle time?
Team 1 Team 2 Team 3 Output Cycle Time Cycle Time Cycle Time
Part 1
Part 2
©2007 Expedia Inc. 55
Exercise – Part 2 • Run one document every 10 seconds through the process • Begin with 1 document of WIP at each of Departments 2-5 • Run for 240 seconds
Exercise – Part 2 Results • How many did we get out? • What was the cycle time for each document? • Do you notice a trend? Why? • How do we get a predictable cycle time?
Exercise – Part 3 • Run one document every 30 seconds through the process • Begin with 1 document of WIP at each of Departments 2-5 • Run for 240 seconds
Exercise – Part 3 Results • How many did we get out? • What was the cycle time for each document? • Is the trend the same as Part 2 of the exercise? • Was each Department fully utilized? • What happens if we balance the workload throughout the process?
©2007 Expedia Inc. 56
Exercise – Part 4 • Department 3 now only draws circles around each letter • Department 4 connects each circle with a straight line • Department 5 puts an “X” through every other circle (from A to Z) • Run one document every 15 seconds through the process • Begin with 1 document of WIP at each of Departments 2-5 • Run for 240 seconds
Exercise – Part 4 Results • How many did we get out? • What was the cycle time for each document? • Observations? • How do we reduce cycle time?
©2007 Expedia Inc. 57
Takeaways • Cycle time is related to WIP and exit rate by Little’s Law:
Process Cycle Time = WIP / Exit Rate
• As WIP increases, cycle time increases, but Exit Rate is unaffected • Exit Rate is controlled by the bottleneck operation • Exit Rate can be improved by reducing the processing time at the
bottleneck workstation • Cycle time can be improved by reducing WIP or reducing the processing
time at the bottleneck workstation