improving energy efficiency in the steel ... politecnico di milano scuola di ingegneria dei sistemi...
TRANSCRIPT

POLITECNICO DI MILANO
Scuola di Ingegneria dei Sistemi
POLO TERRITORIALE DI COMO
Master of Science in
Management, Economics and Industrial Engineering
IMPROVING ENERGY EFFICIENCY IN THE STEEL INDUSTRY THROUGH SCRAP RECYCLING
Supervisor: Prof. Marco Taisch Assistant Supervisor: Dr. Alessandro Cannata
Master Graduation Thesis by: AMAEFULE KELECHI CHINEDU
Student ID Number: 740889
MARCH, 2011

ii
POLITECNICO DI MILANO
Scuola di Ingegneria dei Sistemi
POLO TERRITORIALE DI COMO
Master of Science in
Management, Economics and Industrial Engineering
IMPROVING ENERGY EFFICIENCY IN THE STEEL INDUSTRY THROUGH SCRAP RECYCLING
Supervisor: Prof. Marco Taisch Assistant Supervisor: Dr. Alessandro Cannata
Master Graduation Thesis by: AMAEFULE KELECHI CHINEDU Student ID Number: 740889
MARCH, 2011
iii
0. ABSTRACT
Energy efficiency in manufacturing industries has become an issue of concern in the world
today. This has become paramount to adopt efficient practices due to scarcity and unsecured
energy supply, rising price of energy, awareness of “green” customer, environmental concern
and above all, the need to manufacture products that are competitive. Considering the process
industry, a lot of processes have been adopted to enhance energy efficiency ranging from more
efficient technological innovations, better management and better operational practices. As a
means to further exploring energy efficient practices in iron and steel industries, this study
aims at investigating the energy consumption in producing steel through scrap recycling route
and the energy savings that could be accrued it compared to other steel production routes.
Once the difference in energy consumption of these different process routes are considered
and evaluated scrap recycling could be proposed as an alternative route to producing steel in
Nigerian context. This approach will help the country (as it lacks the availability of quality iron
ore and coking coal) to produce steel internally thereby reducing it’s over dependence in
imported steel, creates employment and also produce semi-finished steel at a competitive
price.

iv
DEDICATION
This thesis is dedicated to the memory of my beloved father;
Nze Ernest Onuohaegbu Amaefule.

v
ACKNOWLEDGEMENTS
I would like to express my appreciation to all those who have provided assistance and
encouragement to me throughout the period of this research work. My special thanks to my
supervisor Professor Marco Taisch for his dedicated attention and support. I also would like to
acknowledge my assistant supervisor Dr. Alessandro Cannata for his tolerance, assistance and
commitment to always give a helping hand towards the successful completion of this thesis
work.
I would also appreciate in a special way Ms Clare Boadbent (The World-steel LCA manager) and
Engr. O.S. Obiji for helping to provide me with the data that was used for analysis in this work.
My thanks to all my friends who made my stay in Italy a lively one; I appreciate you all.
Finally, I would like to express my sincere gratitude for my family who have given support to my
study and prayed for my life.

vi
Contents 0. ABSTRACT ...............................................................................................................................iii
1. INTRODUCTION ...................................................................................................................... 1
1.1 Background ...................................................................................................................... 1
1.2 Problem definition........................................................................................................... 3
1.3 Objective .......................................................................................................................... 3
2. LITERATURE REVIEW .............................................................................................................. 5
2.1 Steel making Background ................................................................................................ 5
2.2 Process route of manufacturing steel............................................................................. 7
2.2.1 The primary route .................................................................................................... 8
2.2.2 The secondary route............................................................................................... 10
2.2.3 The direct Reduced Iron (DRI)................................................................................ 11
2.3 Recycling ........................................................................................................................ 12
2.3.1 Overview of steel recycling .................................................................................... 14
2.3.2 Types of iron and steel scraps................................................................................ 15
2.3.3 Sources of steel scrap ............................................................................................. 17
2.4 Brief History of Nigeria steel industry .......................................................................... 19
3. METHODOLOGY AND DATA ANALYSIS ................................................................................ 24
3.1 Profile of the company .................................................................................................. 24
3.2 Model for the analysis ................................................................................................... 25
3.2.1 Porter’s Generic value chain model....................................................................... 25
3.3 Data collection and its source ....................................................................................... 27
3.4 Calculation of the energy consumption........................................................................ 28
3.5 Analysis of the result ..................................................................................................... 35
4. BENEFITS OF RECYCLING ...................................................................................................... 41
4.1 Conservation of Resources ............................................................................................ 41
4.2 Energy saving ................................................................................................................. 41
4.3 Environment protection (Air pollution and water pollution) ...................................... 42

vii
4.4 Reduced landfill ............................................................................................................. 42
4.5 Making Money ............................................................................................................... 43
4.6 Production Plant can be sited close to the market ...................................................... 43
4.7 Endless Recycling Potential ........................................................................................... 44
4.8 Comparison of LCI of steel produced from virgin ore and recycling ........................... 45
4.8.1 Data collection for the Life Cycle Inventory and its Analysis ............................. 46
5. SOURCING OF THE STEEL SCRAP .......................................................................................... 55
5.1 The curb-side collection program ................................................................................. 57
5.2 Drop- off collection program......................................................................................... 58
5.3 Buy-back centre ............................................................................................................. 59
5.4 Use of agents ................................................................................................................. 59
5.5 Scrap importation .......................................................................................................... 59
6. CONCLUSION ........................................................................................................................ 61
Appendix 1 .................................................................................................................................... 67
Appendix 2 .................................................................................................................................... 67
Appendix 3 .................................................................................................................................... 68
Appendix 4 .................................................................................................................................... 68

viii
List of figures
Figure 2-1 Change in the business paradigm .................................................................................. 6
Figure 2-2 Process route in the Iron and steel industry [7] ............................................................ 7
Figure 2-3 Standard Chemical equation showing the reduction process of Iron ore through the
Direct Reduction process (DRI) and the reform of the carbon doixide to produced carbon
monoxide ...................................................................................................................................... 12
Figure 2-4 cyclic flow routes of steel scrap material [8] ............................................................... 13
Figure 2-5 A crane loading auto bodies to be recycled from collection center(source: institute of
scrap recycling industries.............................................................................................................. 14
Figure 2-6 Graphical representation of sources of steel scrap [12] ............................................. 17
Figure 2-7 Sample of mini mill prepared steel scrap. ................................................................... 18
Figure 2-8 Map of Nigeria showing the major commercial cities................................................. 19
Figure 3-1 Diagram of the porter's value chain generic model [20]............................................. 26
Figure 3-2 Schematic flow for DRI/EAF process route [10] .......................................................... 30
Figure 3-3 Schematic of recycling (EAF) process flow [10] ........................................................... 33
Figure 3-4 Steel making routes:Integratedroute,EAF(recycling) route and DRI+EAF route [13] . 34
Figure 3-5 Graph showing the daily energy consumption for steel production through scrap
recycling(EAF) route ...................................................................................................................... 37
Figure 3-6 Graph showing the daily energy consumption for steel production from iron ore
through DRI+EAF process route .................................................................................................... 37

ix
Figure 3-7 Graph for comparing the energy consumed for daily steel production through the
DRI+EAF route and recycling (EAFonly) routes ............................................................................. 38
Figure 4-1 Reclaimed steel scrap from landfill(source: Institute of scrap recycling industries) .. 43
Figure 4-2 Steel life cycle (source: world steel association) ......................................................... 46
Figure 5-1 The steel scrap cycle(collection, distribution, ttreatment and processing) [16] ........ 56
Figure 5-2 A recycling truck collecting the contents of a recycling
bin(source:ACTT_recycling_Truck.jpg) ......................................................................................... 57

x
List of Tables
Table 2-1 The main source of steel scrap [12] .............................................................................. 17
Table 2-2 The showing the average life of items made maily from steel [12] ............................. 18
Table 2-3 List of public and private sector companies showing their product line and production
capacities [19] ............................................................................................................................... 22
Table 3-1 Data calculation for steel production through the DRI+EAF Route .............................. 31
Table 3-2 Data calculation for steel production through the recycling route(EAF only) ............. 32
Table 3-3 Table showing the analysis of energy consumption for steel production through scrap
recycling(EAF) and production through direct reduction (DRI+EAF) and the savings achieved .. 36
Table 3-4 Table showing the data for world best practice final energy intensity for steel
production through the three process route inclusive of energy consumed per ton of thin slab
casting [18] .................................................................................................................................... 39
Table 4-1 Summary of the benefits of using iron and steel scrap instead of virgin ore to make
new steel ....................................................................................................................................... 44
Table 4-2 Input mass(kg) and its emission(gram) for steel LCI produced through virgin
ore(source:world steel association LCI report, 2008) ................................................................... 49
Table 4-3 Emission of steel produced from virgin ore to air(mass in grams)(source:world steel
association LCI report, 2008) ........................................................................................................ 49
Table 4-4 Emission of steel produced from virgin ore to fresh water(mass in grams) ................ 50
Table 4-5 Environmental indicators of LCI of steel produced from virgin ore(cradle-to-gate) ... 50

xi
Table 4-6 Inputs mass in kiligram and its emission in gram for Life cycle inventory of steel
produced from scrap..................................................................................................................... 51
Table 4-7 Emission to air for steel produced from recycling(steel scrap) .................................... 51
Table 4-8 LCI result showing Emission to fresh water(in grams) for steel produced from steel
scrap recycling............................................................................................................................... 52
Table 4-9 Overal LCI result showing the environmental indicators of steel produced from steel
scrap recycling............................................................................................................................... 53
Table 4-10 Table showing the comparison of the overal environmental indicators for LCI'S of
steel produced from virgin ore and the one produced from steel scrap recycling...................... 54

1
Chapter one
1. INTRODUCTION
1.1 Background
The term energy efficiency has become a central focus of energy policies as well as for
industrial company’s [1]. It is the aim of efforts to reduce the amount of energy required to
produce goods and services and to make it competitive in the market. Giving the rising price of
energy, global warming, awareness of green houses gases, scares resources and so on, it has
awaken the consciousness on efficient innovative technology, efficient
manufacturing/operation practices and better management. Because of this, the improvement
in energy efficiency has become very fundamental, and yet a significant way of addressing
energy security and environmental concerns [1].
Sitting European Union for instance (as an advanced industrialized economy) the ratio of energy
consumption in different sectors are as follows: 33% in manufacturing, 29% in households, 26%
in transportation, 9% in service sector and 4% in others while total direct and indirect carbon
dioxide emission are distributed as follows: 38% in manufacturing, 21% in households, 12% in
service sector, 25% in transport and 4% others [1]. This statistics shows that manufacturing
sector is the main consumer of energy and emitter of carbon dioxide. Among the
manufacturing sector, the energy intensive industries are the cement industry, chemical
industry, iron and steel, pulp & paper and refining .Because of the significant and indispensible
role of iron and steel as regards to its use in automotive industries, construction, bridges,

2
machinery, tools, railways, container, buildings, household appliances and many more, it has
become imperative to device means of producing it in more efficient manner .This will serve as
a competitive factor, for customers ask not for only efficient product but also for efficient
production process.
Identifying recycling as one of the efficient ways of producing steel, obsolete iron and steel
products and ferrous scraps generated in steel mill and steel-product manufacturing plants are
collected because they are economically advantageous to recycle by re-melting and recasting
them into semi finished form for use in the manufacture of new steel products. The steel scrap
market is mature and highly efficient [14]. Iron and steel scrap is more than just economically
beneficial to steelmakers; ferrous scrap recycling is part of wise management of iron resources.
Recovery of one metric tone of steel from scrap conserves an estimate of 1,030kg of iron ore,
580kg of coal and 50 kg of limestone [4]. Each year ,steel recycling saves the energy equivalent
required to electrically power about one-fifth of the households in the united states(about
18million homes) for one year [4][14].
Faced with low awareness of energy efficiency by developing countries, Nigeria is consuming
0.2 % out of the total world energy consumption and this is not to say that the total demand is
being met. Of this 0.2%; 10% is consumed in the manufacturing sector, 68% in transportation,
3% in residential, 12% in communication and public service and 8% others [2]. Be that as it may,
Nigeria is a developing economy and as such the iron and steel industry is intensifying effort to
ensure efficiency in its operations, that is why this research work is focused on evaluating steel

3
production through recycling of scrap in other to ensure energy saving and make their product
competitive.
1.2 Problem definition
This study attempts to answer the following questions:
1. What is the amount of energy that could be saved from producing steel from scrap
through recycling rather than producing from iron ore?
2. What are the benefits of recycling compared to production from iron ore?
3. How this process could be sustained in the Nigerian context in terms of making available
the feedstock (steel scrap).
1.3 Objective
The objective of this research work is to investigate the energy efficiency (saving) of producing
steel from scrap (recycling) compare to its production from virg in material (ore). Literature has
shown that considerable amount of energy could be saved from recycling of steel scrap. Sitting
Nigeria iron and steel industry which forms the bases for this study, our iron and steel industry
has been non functional because of the problem of un-coke-able coal and also low quality iron
ore. But with the much availability of steel scrap, this can serve as an alternative mean of local
production of steel. This will go a along way to reduce cost, time to market and reduction on
carbon emission. Nigeria as a developing country where there is high demand for steel for huge
number of construction work going on day by day. It has a total projected annual demand of

4
10.4 million tons as such, there is a great need for steel production locally; in other to boost its
local content and reduce it’s over dependence on steel importation [3].

5
Chapter two
2. LITERATURE REVIEW
2.1 Steel making Background
Steel is an alloy of iron usually containing less than 1% carbon [5]. It is used most frequently in
the automotive and construction industries. Steel can be casted into bars, strips, sheets, nails,
spikes, wire, rods or pipes depending on the need of the intended user.
The process of steelmaking has undergone many changes in the 20th century based on the
political, social and technological evolution [6]. In the 1950s and 1960s, demand for high
quantity steel encouraged the steelmaking industry to produce large quantities. Large,
integrated steel mills with high capital costs and limited flexibility were built in the U.S. [21].
Integrated steel plants produce steel by refining iron ore in several steps and produce very high
quality steel with well controlled chemical compositions to meet all product quality
requirements.
The energy crisis of the 1970s made thermal efficiency in steel mills a priority [21]. The furnaces
used in integrated plants were very efficient; however, the common production practices
needed to be improved. The large integrated plants of the 1950s and 1960s tend to produce
steel in batches where iron ore was taken from start to finish. This causes some equipment to
be idle while other equipment was in use and a lot of heat losses. To help reduce energy used-
up during the idle time, continuous casting methods were developed. By keeping blast furnaces
continually feed with iron ore, in this way heat is used more efficiently.

6
As environmental concerns have gained importance in the 1980s and 1990s coupled with scare
resources and high cost of energy, regulations have become more stringent, and also changes
to green manufacturing. This also aroused other changes in the steelmaking industry.
Competition has also increased during this period do to decreasing markets and increasing
foreign steel production plants. The competition has forced steelmaking facilities to reduce
expenses by maximising value from minimum spent resources in other to be competitive.
Figure 2-1 Change in the business paradigm
To meet these changing needs, automation of processes, ICT and just-in-time technology has
become more prominent and integrated steel plants are being replaced with smaller plants,
called mini-mills, which rely on steel scrap as a base material rather than iron ore. But mini-
mills will never completely replace integrated steel plants . This is because they cannot maintain
the tight control over chemical composition and more especially the possibility to fulfil the
market demand.

7
2.2 Process route of manufacturing steel
Steel making is a complicated process involving many stages and yielding thousands of by-
products (see appendix 2). Steel can be produced either from scrap or iron ore .The process
used for the manufacturing of iron and steel determines to a great extent on the cost of its
production (energy consumption and emission) and the quality of the steel produced.
Worldwide steel is manufactured through two main routes namely; primary route and the
secondary route. Also there is the intermediate route called direct reduction route which uses
the combination of direct reduced iron and feed into the Electric Arc Furnace for onward steel
production as detailed in figure 2.2 below.
Figure 2-2 Process route in the Iron and steel industry [7]

8
2.2.1 The primary route
The primary route uses the blast furnace/ basic oxygen furnace (BF/BOF) for steel making,
which is a traditional route. It is also generally called the integrated route. Iron ore and coke is
the main raw material in this process. This leads to high carbon emission into the environment.
Steel produced by primary route accounts for about 70% of the global production (Iron and
steel report 2005).
The Steel production through this integrated steel plant involves three basic steps. First, the
heat source used to melt iron ore is produced. Secondly, the iron ore is melted in a furnace.
Thirdly, the molten iron is processed for crude steel production in the Basic Oxygen Furnace.
These three steps can be done at one facility; however, the fuel source is often purchased from
off-site producers.
2.2.1.1 Coke making
Coke is a solid carbon fuel and carbon source used to melt and reduce iron ore. Coke
production begins with pulverized, bituminous coal. The coal is fed into a coke oven (figure 2.2
above) which is sealed and heated to very high temperatures for 14 to 36 hours [7]. Coke is
produced in batch processes, with multiple coke ovens operating simultaneously. In the coke
making process, heat is frequently transferred from one oven to another to reduce energy
requirements. After the coking is finished, it is moved to a quenching tower where it is cooled
with water spray. Once cooled, the coke is moved directly to an iron melting furnace (B last
Furnace) or into storage for future use.

9
2.2.1.2 Iron-making
During iron-making, iron ore, coke, heated air and limestone or other fluxes are fed into the
blast furnace. The heated air causes the coke combustion, which provides the heat and carbon
sources for iron production. Limestone or other fluxes may be added to react with and remove
the acidic impurities, called slag, from the molten iron. The limestone-impurities mixtures float
on the top of the molten iron and are skimmed off, after melting is completed.
Sintering products may also be added to the furnace. Sintering is a process in which solid
wastes are combined into a porous mass that can then be added to the blast furnace. These
wastes include iron ore fines, pollution control dust, coke breeze, water treatment plant sludge,
and flux. Sintering plants help reduce solid waste by combusting waste products and capturing
traces of iron present in the mixture. Sintering plants are not used at all steel production
facilities.
2.2.1.3 Steelmaking (in BOF)
Molten iron from the blast furnace is sent to a basic oxygen furnace, which is used for the final
refinement of the iron into steel. This process can also use up to 25-30% scrap as feed stock for
cooling the melt [7]. High purity oxygen is blown into the furnace and combusts carbon and
silicon in the molten iron. The basic oxygen furnace is fed with fluxes to remove any final
impurities. Alloy materials may be added to enhance the characteristics of the steel depending
on the customer’s orders and/or specification. The resulting steel is most often cast into slabs,
beams or billets. Further shaping of the metal may be done at steel foundries, which re-melt
10
the steel and pour it into moulds, or at rolling facilities, depending on the desired final shape
known as continuous casting. The entire energy consumption of this process as recorded by the
world best practice (ranging from iron raw material processing to thin slab casting) is 14.8GJ/t
[18]
2.2.2 The secondary route
In this route, the initial process of coke-making, sintering and iron making is omitted. The raw
material to this process is 100% scrap which is feed into the Electric Arc Furnace (EAF) as the
raw material [7].
Steelmaking from scrap metals involves melting scrap metal, removing impurities and casting it
into the desired shapes. Electric arc furnaces (EAF) are often used. The Electric Arc Furnace
melts the scrap metal in the presence of electric energy and oxygen. The process does not
require the three step refinement as needed to produce steel from ore as stated above.
Production of steel from scrap can also be economical on a much smaller scale.
Frequently mills producing steel with Electric Arc Furnace technology are called mini-mills.
While Electric Arc Furnaces are sometimes small, some are large enough to produce 400 tons of
steel at a time. The growth of Electric Arc Furnace has been driven by the technology's smaller
initial capital investment and lower operating costs and better energy efficient processes.
Moreover, scrap metal is found in all parts of the country, so Electric Arc Furnace process route
are not tied to closeness to raw material deposits as are in the case of integrated mills (primary
route) and thus can be placed closer to customers. For instance Electric Arc Furnaces now

11
account for well over half of American steel production and their share is expected to continue
to grow in coming years [13]. The energy consumption of this process as a world best practice
(ranging from steel production to thin slab casting) is 2.6GJ/ T [18]
2.2.3 The direct Reduced Iron (DRI)
The Direct Reduced Iron is another alternative route of producing Iron. It can be called
“intermediate process route” because it uses the iron ore as the raw material to produce the
sponge iron which is later feed into the secondary route (Electric Arc Furnace) for onward
production of steel. The Direct Reduction process produces iron (sponge iron) by the reduction
of iron ore at a temperature of 10000 which is below the melting point of iron (15300). Figure
2.3 show the standard chemical equation for the reduction of iron ore through the direct
reduction process. The product of this process is direct reduced iron (DRI). This reduction
process which uses a combination of iron ore lumps, pellet or fines depending on the
processing technology normally require high grade(>90%) of iron ore and low impurity level in
this ferrous raw material than other iron-making producers. As such, this tends to limit the iron
ore sources that can be used for this process. Direct reduction grade iron ore normally sell at
premium price compared to regular blast furnace grade ore reflecting higher quality and limited
supply. The direct reduction process can use gas, uses fine ores and involves a lower capital
investment. The downside is that a relatively high grade of iron ore is required as the process
retains the impurities and even some unconverted iron oxide. This process can also use steel
scrap as a combination when feed (sponge iron) into the Electric Arc Furnace for steel making
process. It can consume about 20% of steel scrap as combination with the sponge iron in the

12
steelmaking process [7].The energy consumption of this process as recorded by world best
practice from the sponge iron making to the steel making and finally thin slab casting is
16.9GJ/t [18]
Figure 2-3 Standard Chemical equation showing the reduction process of Iron ore through the Direct Reduction process (DRI) and the reform of the carbon doixide to produced carbon monoxide
2.3 Recycling
Recycling involves processing of used materials (scrap) into new product to prevent waste of
potentially useful materials. It reduces the consumption of fresh materials, reduce energy
usage, reduce water pollution and landfill. It also reduces air pollution from incineration by
reducing the need for “conventional” waste disposal, and lower greenhouse gas emission as
compared to production from virgin material. It is the key component of modern waste
reduction and is the third component of the “reduce”, “reuse” and “recycle” in the waste
hierarchy [13].

13
Figure 2-4 cyclic flow routes of steel scrap material [8]
With the increasing need for environmental concern in terms of carbon emission coupled with
scares resources and high cost of energy this has made recycling of steel to gain much
awareness as such changed the image from “rust coloured “to “green material”. Figure 2.4
above details the cyclic flow of steel materials from its production to its use and reuse before
the end of its useful life. Then recycling process starts at this end of the useful life of the first
steel produced. This continues cyclic process shows the endless recycling potential of steel. The
figure 2.4 above is a modified version from the original source. The endless recycling of steel
products has also transformed steel recycling from merely an environmental goal into a
genuine business. For instance, according to a recent study released by steel recycling
institute , automobiles are recycling more than any other product with nearly 100% of vehicle
recycled today for there iron and steel content .

14
Figure 2-5 A crane loading auto bodies to be recycled from collection center(source: institute of scrap recycling industries
2.3.1 Overview of steel recycling
Recycling of steel has been a common practice in human history, with recorded advocates as
far back as Plato in 400BC [22]. During that period when resources were scare, archaeological
studies of ancient waste dumps shows less household waste such as ash, broken tools and
pottery. This implies that more waste was being recycled in the absence of new materials. In
the pre-industrial times, there is evidence of scrap bronze and other metals being collected in
Europe and melted down for perpetual reuse [22]. In Britain, dust ash from wood and coal fires
was collected by dustmen and down cycled as a base material used in brick making .The driver
for this type of recycling was the economic advantage of obtaining recycled feedstock instead
of acquiring virgin material as well as lack of public waste removal in ever more dense
populated areas.

15
The properties of metal compared to other materials provide a unique benefit and advantage
for their recycling. Unlike other recycled materials, such as paper and plastic, glasses etc, steel
can be repeatedly recycled without degradation of their properties. Steel from secondary
source are just as good as steel from primary source.
As practiced since ancient times, iron and steel recycling embodies the spirit of sustainable
development .This is a development which meets the requirements of the present without
compromising the ability of future generation to fulfil their own needs as defined by world
commission on environment and development .Recycling widens the efficient use of metals
and minerals, reduce pressure on landfill and incinerators which result in significant major
energy saving compared to primary production.
Steel is one of the world’s most recycled products. In fact it is 100% recyclable, which means its
life cycle is potentially continuous .Steel scrap is a necessary component in the production of
new steel. With the growing awareness of the benefit of recycling, the industry has made even
stronger moves to reuse as much steel as possible.
2.3.2 Types of iron and steel scraps
Scraps which are the main source of Electric Arc Furnace (EAF) steelmaking feedstock consist of
three main types: home scrap, prompt scrap, and obsolete scrap. The forth type is know as
dormant scrap which are the unrecovered scrap.

16
2.3.2.1 Home scrap
These are scraps generated within the steel mills which are left-over pieces from steel making
and defective or rejected products. They are collected and recycled into new steel right there
at the mill. Home scrap never leaves the plant. Technological advancement has really reduced
the generation of home scrap through the use of efficient processes.
2.3.2.2 Prompt scrap (purchased scrap)
These are off-cut generated from product manufacturing companies, such as car companies,
home appliance manufacturers, and other similar companies. Off-specification products are
also returned as prompt scrap. They are created during the production of steel products.
Prompt scrap can also be called industrial scrap.
2.3.2.3 Obsolete scrap (post consumed scrap)
These are steel locked up in items that have come to the end of their useful lives. The quality of
obsolete scrap varies considerably, depending on the use and how the steel was manufactured
in the past. Often the quality of many small pieces cannot be economically determined.
2.3.2.4 Dormant scrap
These are that portion of iron and steel scrap units which is not, as yet, recycled back into the
steel-making process. It is made up of two distinct categories:
One: Oxides (dust, sludge, slag, etc.) that go into special landfills, usually on or near the steel
plant site. Two: Metallic parts that are no longer useful product but which cannot be
economically recovered as obsolete scrap.

17
Table 2-1 The main source of steel scrap [12]
Source Percentage vehicles 25
Manufacturing off-cuts 14 Consumer durables and landfill 22
Industrial machinery 11 Demolition 18
cans 5 rails 5
Figure 2-6 Graphical representation of sources of steel scrap [12]
2.3.3 Sources of steel scrap
There are different channels in which steel scrap can be generated. Scrap can be generated
from vehicles that have come to the end of its useful life or those that are damaged through
accident which are normally sent for demolition. Examples of such vehicles are shown in figure
2.5 above. Other channels include steel cans, damaged rails, industrial machineries etc. Details

18
are shown in table 2.1 and there corresponding percentages (figure 2.6) of availability. Most of
these steel scraps are generated from steel that has come to the end of their useful life. Table
2.2 shows the average life span of steel in their application areas. The steel scraps when
collected are prepared as feedstock for the electric arc furnace by passing through the
processing steps to make them ready to be feed into the furnace. Samples of prepared steel
scraps are shown in figure 2.7.
Table 2-2 The showing the average life of items made maily from steel [12]
Figure 2-7 Sample of mini mill prepared steel scrap.
Item manufactured from steel Average year
Buildings 20-60
Major industrial and power plants 40
Heavy industrial machinery 30
rails 25
Consumer durables 7-15
Cars –all types 5-15
Steel cans <1

19
2.4 Brief History of Nigeria steel
industry
The Plan to set up Nigerian Steel
Industry started as early as 1958. At this
time, many international organizations
and consulting firms had been
commissioned at various levels to study
the feasibility of steel plants to be built
in Nigeria under the umbrella of the
Federal Ministry of Industries. Parallel
efforts were made to identify and analyze
the principal raw materials needed for the steel industry. In 1971 an extra-ministerial agency
was established to stream line efforts required to actualize a steel plant in Nigeria. That Agency
was called “Nigerian Steel Development Authority”. Under this agency, efforts were intensified
in market survey of the feasibility of steel market in Nigeria. They searched for the appropriate
local inputs (iron ore and coal), of which the quality of the iron ore found will determined the
particular technologies that would be adopted. In the quest of this search, Iron ore was found
to be located at Agbaja, Itakpe and Udi. Also suitable deposit of Limestone was found at Jakura,
Mfamosin and other parts of the country. Coal deposits were always found at Enugu while
potential coke-able coal was struck at Lafia.
Figure 2-8 Map of Nigeria showing the major
commercial cities

20
Market surveys were commissioned and the construction of the Kainji Hydro-electric Dam
promised an abundant source of electrical energy. Between 1961 and 1965 many firms fr om
the industrialized nations of the world submitted proposals for the construction of an
integrated Steel Plant in Nigeria. Though, it was anticipated that the available raw materials
could not be used in conventional Iron and Steel making technologies. As such the “Strategic
Udy Process”, a direct reduction (DR) process still in the pilot plant stage in the USA, was then
considered by Nigeria. The idea was accepted by the joint venture company. Then the Nigerian
Steel Associates was formed with Westinghouse and Koppers as the foreign Partners.
Unfortunately, this program failed because it did not prove capable of meeting commercial
scale requirements.
Again In 1967 a UNIDO survey identified Nigeria as a potential steel Market. This led to the
signing of a bilateral agreement between the defunct Soviet Union and Nigeria, and, the arrival
of Soviet steel experts in Nigeria to conduct a feasibility study. The experts recommended the
Blast Furnace/Basic Oxygen Furnace (BF/BOF) process . They also confirmed the availability of
raw materials and recommended further geological surveys. In 1970 a contract was awarded to
TiajProm Export (TPE) of defunct USSR to conduct a study to identify sources of feedstock,
quality and quantity of materials for the proposed integrated iron and steel plant. By this time
the second National Development Plan had envisaged the construction of 750,000 tons per
year capacity Plant.
With the source of Iron Ore confirmed it was proposed that coking coal would be imported and
blended appropriately with local coals. A three-phased development program (1st phase to

21
produce 1.3 million tons, which will be expanded to 2.6 million tons incorporating the flat sheet
production in the 2nd phase, and the third phase to increase capacity to 5.2 million tons) was
accepted.
The initial product mix proposal suggested 50% long products and 50% flat products. This was
based on the product demand profile revealed by market surveys. The Government decided
that Ajaokuta Steel Plant should produce only long products in the first stage of 1.3 million tons
per year, and flat products in the 2.6 million tons expansion which was planned to dove-tail the
first phase completion and this is to be followed by a third phase of 5.2 million tons per annum.
This decision was advised by the need to take advantage of economy of scale since flat-product
mills of capacity below 1 million tons were considered uneconomical. An additional
consideration was to use the relatively simpler technology of long-products rolling to rain up an
otherwise virgin and inexperienced Nigerian Workforce of the time.
The National Steel Development Authority was dissolved by the federal Government in 1979
and this metamorphosed into forming several organizations, namely: Ajaokuta Steel Project,
Ajaokuta, The Delta Steel Company, Ovwian – Aladja, Jos Steel Rolling Company, Jos, Katsina
Steel Rolling Company, Katsina, Oshogbo Steel Rolling Company, Oshogbo, National Iron Ore
Mining Company, Itakpe, National Steel Raw Materials Exploration Agency, Kaduna, National
Metallurgical Development Center, Jos, Metallurgical Training Institute, Onitsha. With the
dissolution of the National Steel Development Authority (NSDA) the above mentioned bodies
were formed and other public and private companies with there various proposed product line
and production capacity as stated in the table2.3 below.

22
Table 2-3 List of public and private sector companies showing their product line and
production capacities [19]
S/No
Plant Location Type of Plant
Iron-making Process and capacity (per year)
Casting Process
Rolling Capacity (per year)
Product Mix
1 Ajaokuta Steel Co. Ltd.
Ajaokuta
Inter-
grated (Public)
Blast
furnace, capacity 1.35m.ton
3 no.
4-strand for blooms
540,000 tons
long products
Bars, rods,
light sections
2 Alliance Steel Co., Ibadan
Rolling mill
- - 20,000 tons long products
Bars
3 Allied Steel Co., Onitsha Rolling mill
- - 20,000 tons long products
Bars
4 Asiastic Manarin Ind., Ikeja
Rolling mill
- - 60,000 tons long products
Bars; sections
5 Continental Iron & Steel Co., Ikeja
Mini mill - - 150,000 tons long products
Bars; sections
6 Delta Steel Co.,
Ovwien/Aladja,
Inter-
grated (Public)
2 Midrex
600 series Direct
Reduction furnaces;
capacity1.02 m.t
3no.
6-strand for billets
320,000 tons
long products
Bars; rods;
sections
7 Federated Steel
Industry, Otta
Mini mill - - 140,000 tons
long products
Bars;
sections
8 General Steel Mill, Asaba
Mini-mill - - 50,000 tons long products
Bars
9 Jos Steel Rolling
Company, Jos
Rolling
mill (Public)
- - 210,000 tons
long products
Bars, rods
10 Katsina Steel Rolling Co.
Katsina
Rolling
mill (Public)
- - 210,000 tons
long products
Bars, rods
11 Kew Metal Industries,
Ikorodu
Mini-mill - - 20,000 tons
long products
Bars;
sections
12 Kwara Commercial, Metal and Chemical
Rolling mill
- - 40,000 tons long products
Bars

23
But it is very unfortunate that these steel companies have remained un-operational after the
commissioning stage of most of them while some are still under construction till date due to
poor funding from the Government. The unavailability of adequate raw material and coke-able
coal has also been a very great impediment. These has made the steel companies not to
produce steel from iron ore and are left with the only alternative of importing semi finished
steel products which they use as their feedstock.
Industries, Ilorin
13 Mayor Eng. Co., Ikorodu Rolling mill
- - 220,000 tons long products
Bars. sections
14 Metcombe Steel Co., Owerri
Rolling mill
- - 10,000 tons long products
Bars; sections
15 Nigerian Spanish Eng.
Co., Kano
Mini mill - - 100,000 tons
long products
Bars
16 Nigersteel Co., Enugu Mini mill - - 40,000 tons long products
Bars; sections
17. Oshogbo Steel Co., Oshogbo
Rolling mill (Public)
- - 210,000 tons long products
Bars; rods
18 Qua Steel Products, Eket Rolling
mill
- - 60,000 tons
long products
Bars,
sections 19 Selsametal, Otta Rolling
mill
- - 100,000 tons
long products
Bars
20 Union Steel Co., Ilorin Rolling mill
- - 20,000 tons long products
Bars
21 Universal Steel Co., Ikeja Mini mill - - 80,000 tons long products
Bars, sections
22 Baoyao Futurelex, Abuja Rolling mill
- - 20,000 tons long
Bars

24
Chapter three
3. METHODOLOGY AND DATA ANALYSIS
As the objective of this research work is to investigate the energy saving in steel production
through the use of scrap to produce new steel. The data used for this analysis was collected
from a steel company in Nigeria which was revitalized after the privatization exercise and it
stated operation less than six months ago.
3.1 Profile of the company
This company in view was among the nine steel company and institutes established in Nigeria in
1980 after the dissolution of the Nigerian Steel Development Authority.
The company’s project started as a turnkey project with an Austro-German Loan. What the
concept of turn-key project means, is that the Austro-German Consortium of Seven Companies,
completed the plant, commissioned it and hand over the key (commissioning) to the Federal
Government of Nigeria for continuing operation.
The Consortium completed the plant according to the terms of the contract as stated in the
project charter and did bring in commissioning raw materials like Iron Ore from Liberia and
Brazil, Graphite electrodes, ferro-alloys, scraps and so on. They also brought in some spares
(called commissioning spares). After the commissioning raw materials were exhausted, it then
became necessary that the Federal Government should provide adequate working capital, so

25
that the plant could attempt proving itself to design capacity, which was one million tons of
liquid steel. But it was unfortunate that adequate working capital was not made available. This
led to the non production of the company after commissioning because of insufficient fund to
import raw material (iron ore) to run the company.
The company had a new life after the privatization exercise undergone by the Federal
Government of Nigeria under the bureau of public Enterprise BPE, which led to the purchase of
the company.
The business type of the company is manufacturing of iron and steel from Midrex Direct
Reduced Iron (DRI) and scrap recycling. The products and services are steel production, billets,
roll products etc. It has a total of 1000 employees. The trade and market areas are Eastern
Europe and Southern Asia and the main market are Africa, Eastern Asia and Western Europe.
The company is located in the southern part of Nigeria and it has a factory size of
100,000square meters. It has management certification of ISO 9001:2000 and ISO 14001:2004.
3.2 Model for the analysis
3.2.1 Porter’s Generic value chain model
This model helps us to better understand the activities through which a firm develops
competitive advantage and creates shareholders value .The model separate the business
system into a series of value generating activities (primary and support activities) which are
referred to as the value chain.

26
The goal of these activities is to offer the customer a level of value that exceeds the cost of the
activities thereby resulting in a profit margin.
In this way, the profit of the company will be attributed to the effective performance of these
activity chains more especially in the operation activity through the use of steel scrap in the
production of new steel. This is intended to reduce the energy consumption and also carbon
emission as such reducing the cost of energy purchased. Through this effective performance,
the amount the customer will be willing to pay for the end steel product will exceed the cost of
the activities in the value chain.
Figure 3-1 Diagram of the porter's value chain generic model [20] Inbound logistics (primary activity): The semi-finished steel manufacturing companies receives
the delivery of their raw materials and warehouses them. For this Company in quote, they
receive the imported iron ore from Bulgaria or Brazil. They are cleared at the sea-port and are
transported to the company for warehousing. The steel scrap is sourced locally from local
supplier’s .These supplier’s source for the scrap from homes, foundry and fabrication shops and

27
so on. They purchase and gather these scraps for onwards supply to the company. At times the
company uses direct sourcing. By this I mean that they send some of their own agents who go
out to the cities at strategic places to purchase steel scrap from there owners and finally
transport them to the company for warehousing.
Operation (primary activity): This activity forms the basis of this research work. At this stage
the input raw materials which are the steel scrap and iron ore are processed and transformed
into the semi-finish product (steel). The scrap passes through some preparation stages which
include: sorting, cutting, sizing and weighing before being charged into the electric Arc furnace.
When charged into the electric arc furnace (EAF) the scrap is heated-up till it reaches its melting
point. This point marks the energy saving compared to amount of energy used to melt iron ore
and produce steel when producing through the direct reduction process. The data in table 3.1
and 3.2 shows the calculation of energy consumption for producing semi-finished steel through
Electric Arc Furnace route and iron ore through the Direct Reduction/EAF Route.
3.3 Data collection and its source
The data for the amount of raw material input ( iron ore in tons) used for the Direct Reduction
Route and the steel Scrap (in tons) for the recycling route (EAF only) are collected from the
steel company in Nigeria that started operation few months ago. The data includes:
The amount of input iron ore per day (in tons) for the Direct Reduction process Route
The amount of input steel scrap per day (in tons) for the Recycling route
Energy consumed to process the input ore in other to produce semi-finished steel (in
MWH) for the Direct Reduction Route.

28
Energy consumed to process the input steel scrap in other to produce semi-finished
steel (in MWH) for the recycling route.
The corresponding tap weight of semi-finished steel for the Direct Reduction Route and
that of Recycling Route.
The furnace temperature for the two process routes.
These data were collected in agreement with this company for the purpose of this work, for a
period of one month (thirty one days). The data was limited for one month because it was the
time the company ran full production from the Direct Reduction Route and Recycling Route
(EAF) concurrently. This data reflect the whole amount of input iron ore and the steel scrap
used (in tons) and the energy consumed for each of the routes. The data for tap weight will be
used to calculate the yield and the energy consumed for one ton of semi-finished steel
produced for each of the process route as done in table 3.1 and 3.2 below. The production
process runs for twenty four hours, three shifts per day for a period of thirty one days.
3.4 Calculation of the energy consumption
As stated earlier, the data for this analysis was collected for a period of one month when the
company ran full production for the direct reduction route and the scrap recycling (EAF) route.
The amount of input raw materials in tons, energy consumed and the tap weight for the two
routes are recorded for each day for a period of thirty one days. The following steps was
adopted in the calculation and analysis
1. The amount of the raw material was calculated and recorded to represent the
input iron ore for the direct reduction route and steel scrap for recycling route.

29
2. The energy consumption was calculated and recorded to represent the energy
consumption for the direct reduction process (DRI+EAF) and that of the recycling
process (EAF only) respectively.
3. Using the input iron ore data and scrap input data and the corresponding tap
weight for each of them respectively. The yield of semi-finished steel was
calculated for each of the process routes as follows: Yield rate=output semi-
finished steel divided by input iron ore or steel scrap respectively.
4. Summation of the output semi-finished steel for direct reduction route for the
thirty one days
5. Summation of the output semi-finished steel for the recycling route for the thirty
one days
6. Summation of the energy consumption for each of the direct reduction route
and the recycling route respectively for a period of thirty one days.
7. Finally the energy consumed for one ton of semi-finished steel produced was
calculated by dividing the total consumed energy by the total output steel for
each of the two process routes(table 3.1 and 3.2) using the formula below
A weighted average approach was used to calculate the amount of energy consumed and the
output semi-finished steel produced for the period of thirty one days in each of the process
routes. The yield rate for each of the two process route was also computed by dividing the
output semi-finished steel by the input iron ore or scrap as applicable.

30
Energy consumed to produce one ton of semi-finished steel = Total energy consumed (MWH)
Total Quantity of semi-finished
Steel produced (Tons)
DRIUNIT
ELECTRIC
ARCFURNACE
ROLLINGMILL
SECONDARYMETALLURGY
CONTINUOUSCASTING
ONE TON OF FINISHED STEEL
DRI
IRON
ORE
CRUDESTEEL+ALLOYS
Figure 3-2 Schematic flow for DRI/EAF process route [10]
The diagram in figure 3.2 above shows the process flow for steel production through the direct
reduction process. First the sponge iron need to be produced in the DRI unit and later fed into
the electric arc furnace for semi-finished steel production. This means that in the direct
reduction route, two major process are involve(1)sponge iron making in the DRI unit (2) semi-
finished steel making in the electric arc furnace. And it is in this two process more especially in
the DRI unit that marks the differential energy consumption.

31
Table 3-1 Data calculation for steel production through the DRI+EAF Route
Energy consumed per ton produced from the DRI+EAF route=4.68MWH
DATA ANALYSIS FOR STEEL PRODUCTION FROM DRI( DRI+EAF ROUTE)
Day ORE INPUT(TONS)
ENERGY CONSUMED (MWH)
TAP WEIGHT(TONS)
YIELD YIELD (%) FURNACE TEMP (OC)
1 38.12 157.16 32.614 0.855561 85.55614 1733
2 39.52 153.43 32.874 0.831832 83.1832 1730
3 41.02 156.9 34.723 0.84649 84.64895 1733
4 46.92 153.98 41.014 0.874126 87.41262 1739
5 59.62 149.69 51.391 0.861976 86.19758 1730
6 55.12 156.73 48.853 0.886303 88.63026 1730
7 47.79 154.37 40.748 0.852647 85.2647 1730
8 53.62 145.4 44.388 0.827825 82.78254 1735
9 39.12 153.16 33.587 0.858563 85.85634 1742
10 21.12 154.9 18.982 0.898769 89.87689 1730
11 43.62 149.08 36.143 0.828588 82.85878 1728
12 39.12 151.41 33.77 0.863241 86.32413 1730
13 46.12 132.53 33.996 0.737121 73.71206 1730
14 43.62 153.32 36.566 0.838285 83.82852 1665
15 37.52 139.89 29.133 0.776466 77.64659 1730
16 44.12 170.39 36.631 0.830258 83.02584 1740
17 36.12 148.42 30.476 0.843743 84.37431 1730
18 31.12 156.32 28.083 0.90241 90.241 1670
19 21.12 162.73 17.093 0.809328 80.93277 1740
20 23.45 138.42 20.958 0.893731 89.37313 1730
21 27.37 145.99 23.071 0.84293 84.29302 1730
22 25.14 151.81 21.592 0.85887 85.88703 1730
23 31.12 153.53 24.331 0.781844 78.18445 1735
24 32.72 149.93 29.143 0.890678 89.06785 1730
25 39.87 158.1 34.072 0.854577 85.45774 1730
26 34.92 153.17 28.638 0.820103 82.01031 1730
27 43.82 154.63 36.528 0.833592 83.3592 1730
28 45.36 146.79 35.114 0.774118 77.41182 1730
29 38.62 144.89 32 0.828586 82.85862 1730
30 26.12 138.86 22.467 0.860145 86.01455 1669
31 36.12 143.91 30.16 0.834994 83.49945 1730
Total 1189.08 4679.84 999.139 26.0977 2609.77 53499
AVERAGE 38.35742 150.9626 32.23029 0.841861 84.18614 1725.77419
ENERGY CONSUMED TO PRODUCE ONE TON OF STEEL=150.9626/32.23029=4.6839MWH/TON

32
Table 3-2 Data calculation for steel production through the recycling route(EAF only) DATA ANALYSIS FOR STEEL PRODUCTION FROM SCRAP(EAF ROUTE)
DAYS SCRAP INPUT(TONS)
ENERGYCONSUMED (MWH)
TAP WEIGHT (tons)
YIELD YIELD (%) FURNACE TEMP.0c
1 105.06 62.1 93.83 0.8931087 89.31086998 1733
2 101.34 62.35 88.174 0.870080916 87.00809157 1730
3 100.16 61.76 88.887 0.88745008 88.74500799 1733
4 87.13 70.25 80.103 0.919350396 91.9350396 1739
5 76.75 64.85 70.177 0.914358306 91.43583062 1730
6 76.71 71.35 71.744 0.935262678 93.52626776 1730
7 91.29 64.88 82.008 0.898324022 89.83240223 1730
8 91.12 60.95 79.829 0.876086479 87.60864794 1735
9 98.86 60.36 88.778 0.898017398 89.80173983 1742
10 116.92 56.46 107.905 0.922895997 92.28959973 1730
11 116.79 58.35 101.428 0.868464766 86.84647658 1728
12 117.41 67.45 105.762 0.900792096 90.07920961 1730
13 116.51 61.06 90.431 0.776165136 77.6165136 1730
14 113.9 68.65 99.96 0.87761194 87.76119403 1665
15 100.7 67.55 81.653 0.810854022 81.08540218 1730
16 102.69 69.55 89.635 0.872869802 87.28698023 1740
17 90.05 66.65 86.298 0.958334259 95.83342587 1730
18 117.7 64.58 112.573 0.956440102 95.6440102 1670
19 133.02 57.45 107.358 0.807081642 80.70816419 1740
20 120.01 58.26 109.983 0.916448629 91.64486293 1730
21 117.97 60.55 102.528 0.869102314 86.91023141 1730
22 115.25 59.59 101.571 0.881310195 88.13101952 1730
23 107.6 62.58 86.861 0.807258364 80.72583643 1735
24 104.15 65.6 96.016 0.921901104 92.19011042 1730
25 103.8 67.45 92.899 0.894980732 89.49807322 1730
26 91.87 66.14 78.686 0.85649287 85.64928704 1730
27 106.06 68.57 92.799 0.874967 87.49669998 1730
28 110.66 69.8 90.538 0.818163745 81.81637448 1730
29 101.02 68.23 88.291 0.873995248 87.39952485 1730
30 113.1 62.57 102.569 0.90688771 90.688771 1669
31 118.17 67.73 102.6 0.86824067 86.82406702 1730
TOTAL 3263.77 1993.67 2871.874 27.33329732 2733.329732 53499
AVERAGE 105.2829032 64.31193548 92.64109677 0.881719268 88.17192684 1725.774194
ENERGYCONSUMED TO PRODUCE ONE TON OF STEEL=64.31193548/92.64109677=0.69420MWH/TON
Energy consumed per ton produced from the recycling (EAF) route=0.69420MWH

33
PROCESSEDSCRAP
+ FLUXES
ELECTRIC
ARCFURNACE
ROLLINGMILL
SECONDARYMETALLURGY
CONTINUOUSCASTING
ONE TON OF FINISHED STEEL
CRUDESTEEL+ALLOYS
INTERNAL
SCRAPS
Figure 3-3 Schematic of recycling (EAF) process flow [10]
In figure 3.3 above it shows the process flow for the recycling process route. The steel scrap is
fed into the electric arc furnace which is heated up till its melting point. Fluxes and other
purifying agents are also added in other to remove impurities and further increase the quality
of the semi-finished steel to be produced. The recycling process is easier and requires a very
short step to produce the semi-finished steel. The figure also show how home scraps generated
within the plant yard could also be fed into the electric arc furnace again.

34
Limestone
`
pelletising
Coal
Iron Ore
Recycled
steel
sinterplant
coke plant
BlastFurnace
EAF
SECONDARYSTEELMAKING
Basic
oxygenfurnace
CONTINOUS
CASTING
ROLLING
GALVANIZING
MANUFACTURINGCONSTRUCTION
STEEL IN USE
(CARS,BRIDGES,SHIPS,MEDICAL INSTRUMENT,ETC)
EAF ROUTE
INTEGRATED ROUTE
PELLETS
Lump ore
fine oresinter
Hot metal
Molten
steel
slab
bloombillets
End of Lifesteel product
(obsolate scrap)
RECYCLED STEEL(PROMPT SCRAP)
INTERNALLYRECYCLED STEEL(HOME SCRAP)
MOLTEN STEEL
STEL
PRODUCTPLATES
SHAPESRAIL, ETC
Iron Ore Pelletising
DRI
UNIT
DRIROUTE
Figure 3-4 Steel making routes:Integratedroute,EAF(recycling) route and DRI+EAF route [13]
In figure 3.4 above it diagramtically details the three process routes of steel production. It also
show the steps of flow of each of the routes. For the recycling route, the diagram details all the
channels in which steel scrap could be generated and how they are fed back into the electric
arc furnace for new steel production. This diagram is a modified version incorpurating the
direct reduction route into the original source of the diagram.

35
3.5 Analysis of the result
From the computations in table 3.1 and 3.2 above, the energy consumption to produce one ton
of semi-finished steel from the direct reduction process and the scrap recycling process has
been calculated. The analysis of the result based on the calculation for steel production from
recycling route and the direct reduction route are analyzed below under the following key
indicators.
ENERGY CONSUMPTION AND SAVING: From the calculation , it showed that the energy
consumed to produce one ton of semi-finished steel through the secondary route using steel
scrap recycling (EAF) is 0.6942MWH/T while the energy consumed for producing one ton of
semi-finished steel through the direct reduction process route (DRI+EAF) is 4.6839MWH/T.
This implies that a total of 3.9897MWH/T (4.6839 minus 0.6942) of energy could be saved by
producing semi-finished steel from the secondary route (steel scrap recycling).
COST: Also calculating this savings in monetary term, taking the cost of energy to be 5.45cents
per KWH, It is calculated that the cost of energy for producing one ton of semi-finished steel
from the direct reduction process (DRI+EAF) will be $255.27/T (4.6839*1000*5.45) while the
cost for producing through the recycling route (EAF) will be $37.83/T (0.6942*1000*5.45).This
also shows a savings of $217.44/T for each ton of semi-finished steel produced from the
recycling route.
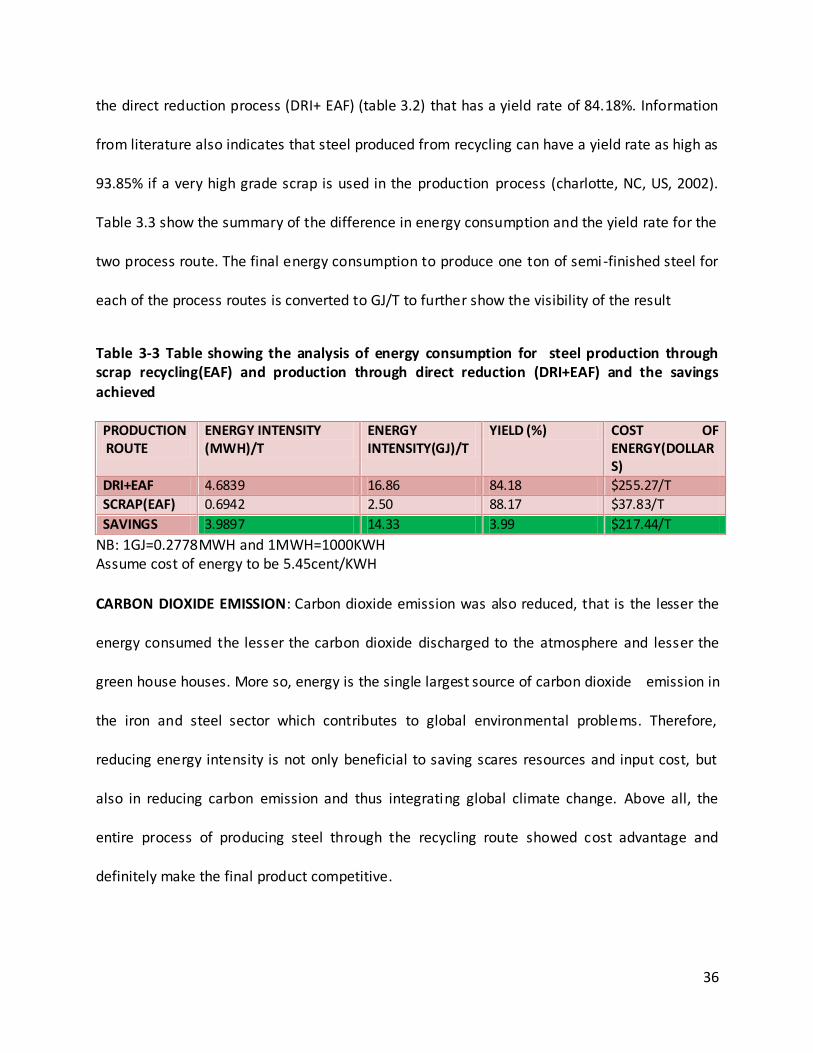
YIELD RATE: In terms of yield, the result of the calculation also proves further advantage of
producing steel through the recycling process. In this analysis as shown in table 3.3 below,
semi-finished steel produced from the recycling process has a yield rate of 88.17% as against
36
the direct reduction process (DRI+ EAF) (table 3.2) that has a yield rate of 84.18%. Information
from literature also indicates that steel produced from recycling can have a yield rate as high as
93.85% if a very high grade scrap is used in the production process (charlotte, NC, US, 2002).
Table 3.3 show the summary of the difference in energy consumption and the yield rate for the
two process route. The final energy consumption to produce one ton of semi-finished steel for
each of the process routes is converted to GJ/T to further show the visibility of the result
Table 3-3 Table showing the analysis of energy consumption for steel production through scrap recycling(EAF) and production through direct reduction (DRI+EAF) and the savings achieved
PRODUCTION ROUTE
ENERGY INTENSITY (MWH)/T
ENERGY INTENSITY(GJ)/T
YIELD (%) COST OF ENERGY(DOLLARS)
DRI+EAF 4.6839 16.86 84.18 $255.27/T
SCRAP(EAF) 0.6942 2.50 88.17 $37.83/T
SAVINGS 3.9897 14.33 3.99 $217.44/T
NB: 1GJ=0.2778MWH and 1MWH=1000KWH Assume cost of energy to be 5.45cent/KWH
CARBON DIOXIDE EMISSION: Carbon dioxide emission was also reduced, that is the lesser the
energy consumed the lesser the carbon dioxide discharged to the atmosphere and lesser the
green house houses. More so, energy is the single largest source of carbon dioxide emission in
the iron and steel sector which contributes to global environmental problems. Therefore,
reducing energy intensity is not only beneficial to saving scares resources and input cost, but
also in reducing carbon emission and thus integrating global climate change. Above all, the
entire process of producing steel through the recycling route showed cost advantage and
definitely make the final product competitive.

37
Figure 3-5 Graph showing the daily energy consumption for steel production through scrap recycling(EAF) route
Figure 3-6 Graph showing the daily energy consumption for steel production from iron ore through DRI+EAF process route

38
Figure 3-7 Graph for comparing the energy consumed for daily steel production through the DRI+EAF route and recycling (EAFonly) routes
Also comparing the results of the analysis above with the world best practices (table 3.4) for
steel production, the energy consumed by my own analysis for recycling process route was
lesser (2.5GJ/T) while that of the world best practice was 2.6GJ/T. Though in the world best
practice data, the energy for producing thin slab casting was included and from literature it
takes between 0.6 to 0.9GJ/T for each thin slab casted [15]. Analyzing the world best practice
data, producing steel from scrap has a savings of 14.3GJ/T (16.9 minus 2.6) when compared
with the direct reduction plus electric arc furnace process (DRI+EAF).Also an energy savings of
12.2GJ/T (14.8 minus 2.6) will be achieved when compared to producing steel from the blast
furnace/basic oxygen furnace route and the recycling route.
Figure 3.5 and 3.6 shows the graph for daily energy consumption of the recycling route and the
direct reduction route respectively. While the comparison of the two graphs when plotted
together is shown in figure 3.7.

39
Table 3-4 Table showing the data for world best practice final energy intensity for steel production through the three process route inclusive of energy consumed per ton of thin slab casting [18] S/NO Technology process unit Energy intensity(GJ/t)
1 BF>BOF>Thin slab casting steel 14.8
2 DRI>EAF>Thin slab casting steel 16.9
3 Scrap>EAF>Thin slab casting steel 2.6
Outbound Logistics: At this stage of the value generation, the steel product is casted into semi
finished product such as bloom, thin slab, etc. some of the semi finished products might be
taken to the rolling mill where they are rolled into rods, wires and other product based on
customer’s order and/or specification. These products are finally, taken to the warehouse for
sorting and packaging according to customer order and final distribution. This is a continuous
process because customers make there orders in advance. It is only on rare cases that semi-
finished steel manufacturing companies take delivery to their customers because the
customers come to the company to carry their ordered semi finished products.
Marketing and sales: The customers to semi-finished steel manufacturing companies are more
of manufacturing companies also who uses these semi-finished steel products to manufacture
the final product. The marketing activity is more of business-to-business (B2B). With the good
image name of a company and better quality of their products, this will make any company to
retain good number of their customers. This is achieved through effective customer
relationship management and always making sure that the customer’s orders and the required
specification are met at any point in time.

40
Service: Companies should try as much as possible to attend to the need of their teeming
customer chain. They should not stop at selling their semi- finished steel product to their
customers but also try as much as possible to find out from their customers about the
performance of their product at the manufacturing shops floor. They should take the customers
complains and make sure that they are attended to as quickly as possible without any delay.
Support activities: In every organization, the primary and support activities work hand in hand
to ensure effective performance of the company .This is really the case for effective growth of
any company. The procurement team tries as much as possible to make sure that the raw
materials are purchased from the best supplier at the best competitive price and the best
quality. The technology applied should also be modern. This will help the company in being very
efficient in their operation. The workers should also be well trained and the human resources
department makes sure that the best workers are employed at any point in time. There should
also be a constant training of staff to ensure their development which will finally transcend to
better performance. Finally with better infrastructure on ground all these put together will
make any company to be the best steel company.

41
Chapter four
4. BENEFITS OF RECYCLING
Steel scrap has become the steel industry's single largest source of raw material because it is
economically advantageous to recycle old steel into new steel. In light of this, steelmaking
furnaces have been designed to consume steel scrap. Apart from the huge amount of energy
that could be saved through steel recycling, a lot of other benefits are also derived. On this
note, the benefits of producing steel through recycling as compared to producing from Iron ore
(direct reduction route and blast furnace/ basic oxygen furnace route) are itemized below.
4.1 Conservation of Resources
Steel scrap recycling has been identified as an effective means of conserving natural resources.
It is more than economically beneficial for steelmakers and also a part of wise management of
iron ore resources. It reduces the consumption of valuable minerals like iron ore, coal,
limestone and water. For every metric ton of recycled steel scrap, 1.5tons of iron ore, 0.5ton of
coal, 0.054ton (120 pound) of limestone and 40%of water normally used in the production from
virgin material is conserved [4]. Through this recycling process, not only the resources that are
conserved, the natural habitat is also protected for the future.
4.2 Energy saving
Using steel scrap in the manufacturing of new steel uses considerably lesser energy than that
required for producing new steel from virgin raw materials (iron ore, coal, limestone). Not only

42
that, there is also extra energy savings because more energy is required to extract, refine,
transport and process raw materials ready for industry use compared with providing steel
scrap which are ready materials to be charged into the Electric Arc Furnace for easy and faster
steel production. Producing one ton of steel from recycling steel scrap saves a total of 14.3 GJ
of energy as show in my analysis (table 3.3). This amount of energy saving from my analysis is
affirmed from data in world best practices energy consumption data in table 3.4 above
4.3 Environment protection (Air pollution and water pollution)
Manufacturing steel from virgin ore involves the emission of greenhouse gases, which
contribute to global warming. Using recycled steel srcap generates 85 percent fewer emissions
[21]
Recycling reduces the need for extracting (mining, qua rrying and logging), refining and
processing raw materials all of which create substantial air and water pollution.
As recycling saves energy it also reduces greenhouse gas emissions, which helps to tackle
climate change. Currently, UK recycling is estimated to save more than 18 million tons of
carbon dioxide a year – the equivalent to taking 5 million cars off the road (steel recycling
institute)
4.4 Reduced landfill
Recycling steel scrap helps in saving landfill space by diverting steel scrap from the waste
stream. When we recycle, steel scrap materials are reprocessed into new products, and as a

43
result of this, the amounts of scraps sent to landfill sites are substantially reduced. Figure 4.1
below shows a picture of scraps that are reclaimed from landfill .
Figure 4-1 Reclaimed steel scrap from landfill(source: Institute of scrap recycling industries)
4.5 Making Money
Recycling metal provides many benefits for everyone, such as a cleaner environment and fewer
greenhouse gas emissions. But a huge sum of money can also made by selling scrap metal to
scrap-metal recycling company. In this case steel materials which are generated from homes or
cars that are discarded can be sold by the owner to scrap collecting centres or even agent that
move from house to house to buy steel scrap(obsolete scrap) from the owners. Through this
the owners can generate some revenue from their steel properties that are no longer useful to
them.
4.6 Production Plant can be sited close to the market
Unlike the primary steel production route, the mini mills can be sited in a location that is closer
to the market. This is because the location of the plant is not tied to the source of the raw

44
material. In the steel recycling process route there is much flexibility because the raw materials
(steel scrap) can be sourced from any where and transported to the plant location. While in the
case of integrated process route (BF/BOF) and the Direct Reduction Route the plant need to be
sited to a place that is close to the source of the raw material. This is done to reduce the cost of
transporting the huge raw materials (iron ore, coke etc) to the production site.
4.7 Endless Recycling Potential
Steel scraps are 100% recyclable and it does not degrade during the recycling process like other
recyclable materials such as paper. As such it can be recycled over and over again without
losing its quality. Steel recycling therefore represents one of the most effective and valuable
strategies for saving resources. Table 4.1 below summarises other saving obtain from producing
new steel from recycling of steel scrap.
Table 4-1 Summary of the benefits of using iron and steel scrap instead of virgin ore to make new steel Savings sources Percentage savings
Energy 74%
Raw material(iron ore ) 90%
Reduction in water use 40%
Water pollution reduction 75%
Air pollution reduction 86%
Reduction in mining waste 97%
Reduction in consumer waste 105%
Source: Institute of Scrap Recycling Industries

45
4.8 Comparison of LCI of steel produced from virgin ore and recycling
The life cycle assessment (LCA) is a holistic approach to evaluate the environmental
performance of a product by considering the potential impacts of that product from all stages
of manufacturing, product use and end-of-life stages, some times called cradle-to-gate
approach. It comprises of goal and scope definition, life cycle inventory, life cycle impact
assessment and finally interpretation of the result.
Though Life Cycle Inventory is outside the boundaries of this work, but I consider it important
to be highlighted as a way of further buttressing the energy savings for steel production from
steel scrap.
Steel is one of the most recyclable materials in the world and therefore it is important to
consider recycling in life cycle assessment studies involving steel, more especially steel scraps
that are recycled from a product at the end of its useful life (EOL). In addition, steel scrap is a
vital input to the steel making process, and this input of steel scrap should a lso be considered in
investigating the Life Cycle Inventory of steel. Figure 4.2 illustrates the cyclic flow of steel
starting from the extraction to processing, manufacturing, uses and its end of life recycling.

46
Figure 4-2 Steel life cycle (source: world steel association)
4.8.1 Data collection for the Life Cycle Inventory and its Analysis
The data collection and analysis of this Life Cycle Inventory shown in the tables below was
carried out by worldsteel association and has undergone critical review from an independent
Critical Review Panel (CRP) of LCA specialists . These data that was used for this Life cycle
inventory analysis was collected by world steel association from different steel producing
companies all over the world. These companies contributing data for the LCI study of world
steel association account for 39.7% of global crude steel production outside that of the former
USSR and China. Companies in Europe, and Far East Asia were well represented and a typical
range of operating configurations included, North America is included in the global averages
(world steel association). As such the result of the analysis given below was based on the world
steel association data and not mine. The reference year for this data is 2000 to 2007. These
data are for cradle-to-gate. That is, it covers all of the production steps from raw materials in
the earth (i.e. the cradle) to finished products ready to be shipped from the steelworks (i.e. the

47
gate). It also includes the credits associated with recycling the steel from the product at the end
of their useful life. It does not include the manufacture of downstream products or their use.
The result of this analysis was personally requested by me for the completeness of this work
and the life cycle analysis was conducted and released by world steel association on February
2010
The general life cycle equation used by the world steel association for the “closed material loop
recycling methodology” is applied as shown by the equation shown below:
LCI for 1 kg of steel product including recycling = X – (RR – S) × Y(Xpr – Xre)
where:
X is the cradle to gate LCI of the product
(RR – S) is the net amount of scrap
RR is the end of life recycling rate of the steel product
S is the scrap input to the steelmaking process
Y(Xpr - Xre) is the value of scrap
Y is the process yield of the EAF (i.e. >1kg scrap is required to produce 1kg steel)
Xpr = the LCI for 100% primary metal production. This is a theoretical value of steel slab made
in the BF/BOF route, assuming 0% scrap input.

48
Xre = the LCI for 100% secondary metal production from scrap in the EAF (assuming scrap =
100%)
This LCI data below were calculated for products derived through the blast furnace/basic
oxygen furnace route (based on iron ore and steel scrap), known as the primary route and the
electric arc furnace route (based on 100% steel scrap), which is the secondary route. Sixteen
products were included in the studies which are the main finished products of the steel
industry. They include hot rolled coil (with and without pickling), cold rolled coil (with and
without finishing), hot dip and electrically galvanized sheet, painted sheet, tinplate and tin-free
sheet, welded and UO pipe, sections, plate, rebar and wire rod. The products are of general
relevance to a wide range of downstream applications including those in the construction,
automotive and packaging sectors. The inputs are expressed in kilogram while the outputs are
expressed in gram.
4.8.1.1 LCI data analysis: cradle to gate for steel production from virgin ore( primary route)
Table 4.2, 4.3 and 4.4 shows the input elements in kilogram and their corresponding emissions
to the environment, air and fresh water respectively in grams. While table 4.5 shows the
summary of its environmental indicator of the LCI in terms of global warming potential and
energy demand from renewable and non-renewable resources for steel produced from virgin
ore.

49
Table 4-2 Input mass(kg) and its emission(gram) for steel LCI produced through virgin ore(source:world steel association LCI report, 2008)
Inputs (mass, kg) Cradle to gate
Crude oil (resource) 0.0008594971
Hard coal (resource) 0.7822917
Lignite (resource) -0.003791867
Natural gas (resource) 0.01228506
Uranium (resource) 2.366164E-007
Iron ore 1.349514
Dolomite 0.03662349
Limestone (calcium carbonate) -0.01008424
Tin ore 1.512103E-016
Water 14.62153
Carbon dioxide 0.01465696
Ferrous scrap 0.1214011
Table 4-3 Emission of steel produced from virgin ore to air(mass in grams)(source:world steel association LCI report, 2008)
Inputs (mass, kg) Cradle to gate
Cadmium (+II) 6.278E-005
Carbon dioxide 1889
Carbon monoxide 22.73
Chromium (total) 0.000179
Dioxins (unspec.) 1.802E-009
Hydrogen chloride 0.03695
Hydrogen sulphide 0.2828
Lead (+II) 0.002751
Mercury (+II) 7.109E-005
Methane 5.284
Nitrogen dioxide 0.01641
Nitrogen oxides 2.429
Nitrous oxide (laughing gas) 0.006713

50
NMVOC (unspecified) 0.2507
Particles to air 1.517
Sulphur dioxide 2.689
Table 4-4 Emission of steel produced from virgin ore to fresh water (mass in grams)
Cradle to gate
Ammonia (NH4+, NH3, as N) 0.003486
Biological oxygen demand (BOD) 0.002891
Cadmium (+II) 3.045E-005
Chemical oxygen demand (COD) 0.1211
Chromium (total) 5.084E-005
Iron 0.003285
Lead (+II) 1.096E-005
Nickel (+II) 0.0001066
Nitrogenous Matter (unspecified, as N) 0.1935
Phosphate 6.037E-005
Phosphorus 0.0004734
Solids (dissolved) 0.01005
Zinc (+II)
Table 4-5 Environmental indicators of LCI of steel produced from virgin ore(cradle-to-gate)
Cradle to gate
Global Warming Potential (GWP 100 years) [kg CO2-Equiv.] 2.009421
Primary energy demand from ren. and non ren. resources (net cal. value) [MJ] 21.63931
4.8.1.2 LCI data analysis for 1kg Steel Scrap (recycling) is given below
Life Cycle Inventory for one kilogram of steel scrap analyzed shows the emission (of steel
produced from scrap through recycling) to the environment, air and fresh water shown in
tables 4.6, 4.7 and 4.8 respectively. Then table 4.9 showed the summary of its overall

51
environmental indicators in terms of global warming potential and energy demand from
renewable and non-renewable resources.
Table 4-6 Inputs mass in kiligram and its emission in gram for Life cycle inventory of steel produced from
scrap
Scrap LCI
Crude oil (resource) -0.01763265
Hard coal (resource) 0.740115
Lignite (resource) -0.0494894
Natural gas (resource) -0.05367357
Uranium (resource) -3.057218E-006
Iron ore 1.415598
Dolomite 0.03607125
Limestone (calcium carbonate) -0.05547075
Tin ore -8.815403E-017
Water 13.06657
Table 4-7 Emission to air for steel produced from recycling(steel scrap) Scrap LCI
Cadmium (+II) 5.044E-005
Carbon dioxide 1409
Carbon monoxide 22.62
Chromium (total) -0.0001464
Dioxins (unspec.) -1.064E-008
Hydrogen chloride 0.03143
Hydrogen sulphide 0.3725
Lead (+II) 0.001814
Mercury (+II) -9.828E-006
Methane 4.291
Nitrogen dioxide 0.01432

52
Nitrogen oxides 1.354
Nitrous oxide (laughing gas) 0.005271
NMVOC (unspecified) 0.1594
Particles to air 1.397
Sulphur dioxide 1.789
Table 4-8 LCI result showing Emission to fresh water(in grams) for steel produced from steel scrap recycling
Scrap LCI
Ammonia (NH4+, NH3, as N) 0.002327
Biological oxygen demand (BOD) 0.01092
Cadmium (+II) 1.916E-005
Chemical oxygen demand (COD) -0.007725
Chromium (total) -3.48E-005
Iron -0.07544
Lead (+II) -0.0001005
Nickel (+II) 6.097E-005
Nitrogenous Matter (unspecified, as N) 0.122
Phosphate -0.0001758
Phosphorus -0.0005332
Solids (dissolved) 0.006315
Zinc (+II) -0.0008956

53
Table 4-9 Overal LCI result showing the environmental indicators of steel produced from steel scrap recycling
Scrap LCI
Global Warming Potential (GWP 100 years) [kg CO2-Equiv.] 1.51211
Primary energy demand from renewable. And non renewable.
resources (net cal. value) [MJ] 13.40748
Comparing the result of the Life Cycle Inventories of steel produced from virgin ore and steel
produced from scrap recycling, the analysis shows that producing steel from the virgin ore has
a global warming potential(GWP 100 year) in kgco2-equivalent of 2.009421 and primary
energy demand of 21.63931MJ as shown in table4.8 above. While producing steel from scrap
has a global warming potentials (GWP 100years) in kgco2-equivalent of 1.51211 and primary
energy demand of 13.40748MJ as shown in table 4.9 above. This implies that for each
kilogram of steel produced from scrap it has energy savings of 8.23183MJ/KG (see table 4.10)
compared to producing from virgin ore.
Also , comparing the ratio of energy consumed for steel production from the primary and
secondary(recycling) route with the corresponding Life Cycle Inventory energy demand of the
two processes. There ratio calculation is shown in (1) and (2) below.
1. Blast furnace/basic oxygen furnace or Direct reduction energy ratio= energy
comsumed for one ton of semi-finished steel produced divided by the LCI energy
demand per kilogram of steel which is 0.77:1(16.81/21.63). This implies that
the ratio of the energy consumed for producing one ton of steel from virgin ore

54
to its energy demand from renewable and non-renewable resources is 0.77: is to
1
2. Scrap recycling energy consumption ratio=energy consumed for on ton of steel
produced divided by LCI energy demand per kilogram of steel which is 0.19:1( ie
2.48/13.40). This implies that the ratio of energy consumed for producing on ton
of steel from srcap to its energy demand from renewable and non-renewable
resources is 0.19 is to 1.
Table 4.10 show the final comparison of the energy demand of steel produced directly from
iron ore and steel produced from recycling of steel scrap and the coresponding saving s that
could be achieved when steel is produced from steel scrap recycling.
Table 4-10 Table showing the comparison of the overal environmental indicators for LCI'S of
steel produced from virgin ore and the one produced from steel scrap recycling Production Route+LCI Global Warming
Potential (GWP100Years){kgco2-Equiv}
Primary Energy Demand
(MJ)
Iron Ore(credle-to-gate LCI)
2.009421 21.63931
Steel Scrap(Recycling LCI)
1.51211 13.40748
Savings 0.497311 8.23183

55
Chapter five
5. SOURCING OF THE STEEL SCRAP
Steel scrap has been traditionally obtained from three sources. ”home scrap” derived within
the steel production plants. Prompt scrap derived from the manufacture of steel products and
obsolete scrap that is steel scrap that has come to the end of their useful life. The reuse of steel
scrap has always been an integrated part of the steelmaking process. For instance, for the past
50years, more than 50% of the steel produced in the United States has been recycled into a
multitude of new steel products [16]. These new steel products will eventually be re-melted
again in mini mills to make new steel.
The steel scrap cycle consists of scrap collection and sorting, distribution and trade, treatment
and processing as shown in the figure 5.1 below.

56
Figure 5-1 The steel scrap cycle(collection, distribution, ttreatment and processing) [16]
Along this recycling chain, steel scrap is cleaned to become the secondary material for final
steel product production.
The two types of process route used in today’s steel mills require more steel scrap than ever as
a result of the enormous amount of energy savings and lower carbon dioxide emission. The
basic oxygen furnace (BOF) blends molten iron with approximately 25% steel scrap and the

57
electric arc furnace (EAF) uses 100% scrap (world steel report 2004). With these efficiencies in
steelmaking through recycling, it has created the need for more external sourcing of steel scrap.
As the methods below are ways in which steel scrap can be sourced. These methods are almost
the same with the waste management collection approach.
The following methods of sourcing of steel scrap represent the means in which the input
feedstock to mini mill is to be supplied in other to sustain the steel production through the
recycling route.
5.1 The curb-side collection program
This is a service provided to households in the urban and suburban areas aiming at removing
Figure 5-2 A recycling truck collecting the contents of a recycling bin(source:ACTT_recycling_Truck.jpg)
The household waste materials (in this case steel scraps). This is accomplished by personnel
(usually government or contracted agents) using purpose built vehicles to pick up household

58
waste (in this case steel scraps). Through this means, iron and steel scraps will be collected
which are finally sold to the steel producing companies (usually mini mills) who are the final
consumers.
Steel scrap collected through this means requires further sorting and cleaning. Scraps collected
through this means are more of steel cans and some other household appliances. When these
scraps are purchased by the steel producing companies, they are further process and are finally
used to produce new steel products. These scraps will be specifically for steel production
through the electric arc furnace route which consumes 100% scraps. Steel scraps that are
collected through the curb-side program normally falls into the category of obsolete scraps .
5.2 Drop- off collection program
In this case, the waste producer (steel scrap) carries the scrap to the central collection location.
This is normally an installed or mobile collection station or even processing plant. In this
situation the producer of the waste most have sorted the steel scrap and then drops it off at
the appropriate bin at the collection centre. Because of the increasing demand for the steel
scrap, this drop-off method is now done with an exchange of cash for the steel scrap. In this
situation, the scrap is weighed and valued and the producer being paid the money equivalent of
the scrap. This method is the easiest way of collection but it suffers from low and
unpredictable throughput. The only motivating factor here is the cash equivalent the producer
gets.

59
5.3 Buy-back centre
In this case, steel scraps which are clean steel scrap are purchased from the owners. The steel
scrap is weighed and graded before payment is made to the owner. This will provide a clear
incentive for use and also create a stable supply. The post–processed scrap can be sold to the
steel manufacturing companies.
With the increasing shipment of fairly used cars, fridges and other metal bodies, this method
will increase the supply of abandoned steel materials to the buy-back centres.
5.4 Use of agents
This is the process of using personnel who will go from house to house or companies and
fabrication shops to source for steel scraps. Other sources are machineries, construction and
demolished buildings. Here mini mills use their own agents who are paid on commission bases.
They will be provided with vehicles which will enable the agents to travel into the rural areas to
source for the scraps from the owners. This method provides a very high supply because the
agents will be so dedicated to their job knowing that the more scrap they are able to purchase
the more money they get.
5.5 Scrap importation
Scrap importation still remains another avenue to source for scrap. With the low level of
development of steel industry in most West Africa states, it will give Nigeria the opportunity to
source and buy steel scrap from neighbouring countries at a reduced price and transport it to

60
Nigeria. The fifteen members of Economic Community of West African States (ECOWAS) enjoy
free trade relationship among its members. As such this will lead to zero tariff for the
movement of the locally sourced scraps from these countries to Nigeria. With the quantity of
scrap expected to be sourced locally and those to be sourced and supplied from the West
African counties, it will be more then enough as the input raw materials for the mini mills which
will definitely boost Nigeria’s steel production locally.

61
Chapter six
6. CONCLUSION
This research work focused on investigating the energy saving from producing steel through
recycling of steel scrap as a way of enhancing efficiency in process industry. Nigeria steel
industry was sited as a focal point in this study .The steel industry in Nigeria has suffered a huge
set back as a result of unavailability of quality Iron ore and coke-able coal which are the major
raw material for steel production through the primary or direct reduction process. Through the
findings of this work, recycling of steel scrap is suggested as an alternative to boost the local
content of steel production, reduce energy consumption, carbon dioxide emission (as the
world production and manufacturing system is going green) and also reduce the
overdependence of the country on imported semi-finished steel product. It has become an
established fact that energy efficiency has been an issue of concern in the world at large. This
has become imperative because of the high cost of energy, scarcity of resources and carbon
dioxide emission to the environment as a result of its combustion and above all making goods
produced to be competitive.
In this study, three questions were answered.
1. The amount of energy that could be saved from producing steel from steel
scrap (recycling) rather than producing from Iron ore( virgin material)
2. The benefits of producing steel from scrap
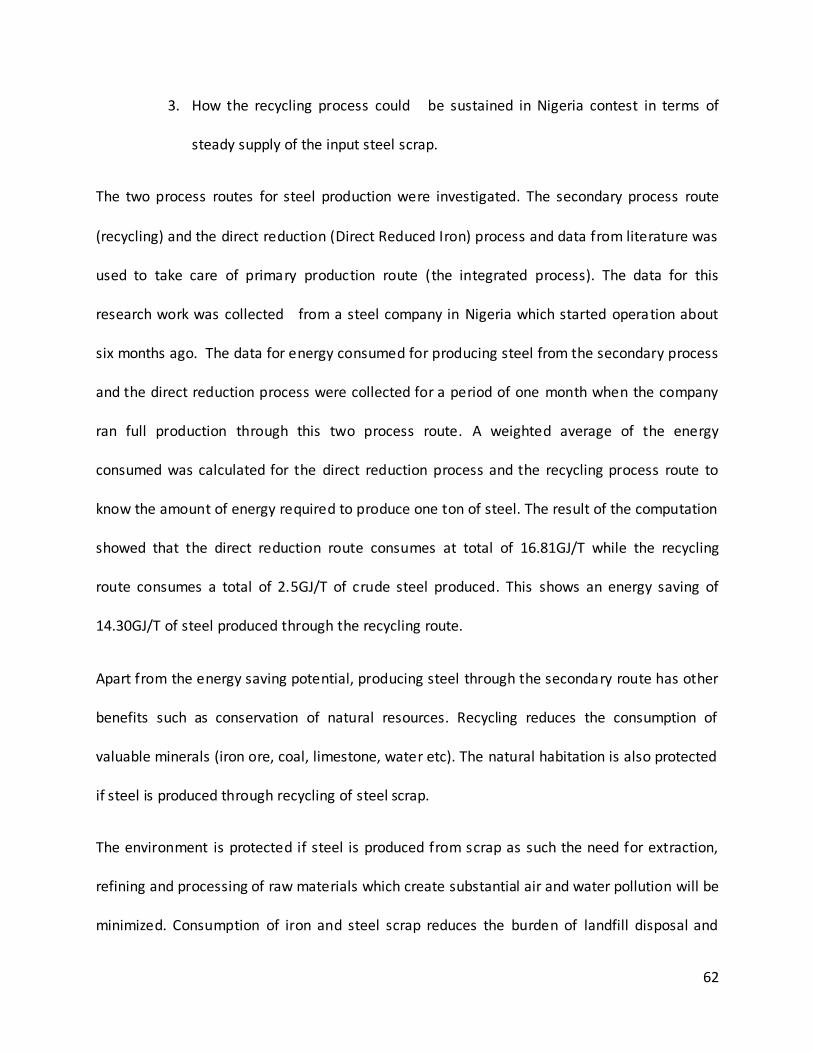
62
3. How the recycling process could be sustained in Nigeria contest in terms of
steady supply of the input steel scrap.
The two process routes for steel production were investigated. The secondary process route
(recycling) and the direct reduction (Direct Reduced Iron) process and data from literature was
used to take care of primary production route (the integrated process). The data for this
research work was collected from a steel company in Nigeria which started operation about
six months ago. The data for energy consumed for producing steel from the secondary process
and the direct reduction process were collected for a period of one month when the company
ran full production through this two process route. A weighted average of the energy
consumed was calculated for the direct reduction process and the recycling process route to
know the amount of energy required to produce one ton of steel. The result of the computation
showed that the direct reduction route consumes at total of 16.81GJ/T while the recycling
route consumes a total of 2.5GJ/T of crude steel produced. This shows an energy saving of
14.30GJ/T of steel produced through the recycling route.
Apart from the energy saving potential, producing steel through the secondary route has other
benefits such as conservation of natural resources. Recycling reduces the consumption of
valuable minerals (iron ore, coal, limestone, water etc). The natural habitation is also protected
if steel is produced through recycling of steel scrap.
The environment is protected if steel is produced from scrap as such the need for extraction,
refining and processing of raw materials which create substantial air and water pollution will be
minimized. Consumption of iron and steel scrap reduces the burden of landfill disposal and

63
prevents the accumulation of abandoned steel products in the environment. Also a substantial
amount of money could be made by owners of steel scrap who sale them to the scrap sourcing
agents or through the buy-back collection program.
The endless recycling potential of steel gives it an added advantage as steel scrap can be
recycled over and over again without losing the quality or the properties of the steel. The low
capital investment in terms of starting-up of mini-mills compared to the integrated route (blast
furnace and basic oxygen furnace) is further advantage of recycling. Location of the plant is
also another advantage as the mini-mill (EAF) can be sited any where and closer to the market
while the integrated route is location sensitive as the plant has to sited to a place near to the
sources of the raw materials(Iron ore).
A further investigation on the life cycle inventory of steel produced from scrap and steel
produced from Ore showered that for one kilogram of steel produced from ore has a global
warming potential of 2.0098kgco2-equivalent and also has a primary energy demand both from
renewable and non- renewable sources of 21.639MJ while steel produced from steel scrap has
a global warming potentials of 1.5kgco2-equivalent and 13.407MJ primary energy demand.
Finally, in other to provide a steady supply of steel scrap as feedstock to the secondary process
route, steel scrap can be sourced/supplied through the use of company agents who go from
house to house, manufacturing companies, fabrication shops etc to buy the steel scrap also the
buy-back, drop-off and curb-side collection programs remains another promising sources in
which scrap could be sourced and supplied to the mini-mills. Also considering the free trade
relationship that exist among the Economic Community of West African States (ECOWAS) steel

64
scraps could be sourced from these countries and being transported to Nigeria to supplement
the locally sourced once.
Future research
A similar study should be carried out with more elaborate and sufficient data from different
companies in different context (in different countries for instance). More so, the cost benefit
analysis of scrap recycling for all the stakeholders involved, not limited to steel companies
alone but also the local communities, waste facilities and so on should further be investigated
in other to justify the findings of this thesis work.

65
References
1. Katharina Bense, Julia Sach, Mathias Vodicka. “Evaluating Energy Efficiency
Improvement in Manufacturing Processes”, Centre for Enterprise science, 8092, Zurich, Switzerland.
2. P.O. Oluseyi, O. Okoro, E. Chikuni. “Energy Efficiency Program in Nigeria Industries”-A lesion from india
3. B. Kareem. “A prediction of made in Nigeria steel Bar Demand and supply using regression method”, Journal of Engineering and applied science 2(3): 580-584, 2007,
Medwell Journal, 2007. 4. Michael D. Fenton, V.A. Reston. “Iron and steel Recycling in the united states in
1998”,US department of interior ,US geological survey , open file Report,01-224
5. Michael D. Fenton. “Iron and steel scrap”. 6. A. Javaid, E. Essidiqi. “Final report on scrap management sorting and classification of
steel”, Report No. 2003-23(CF), December, 2003. 7. “Energy Efficiency indicators”, Asia Pacific Energy Research Centre, Tokyo, March, 2000.
8. “Life Cycle Analysis and Assessment”, http://www.gdri.org/uem/lca/life-cycle.hmtl 9. Tom Bird. “Current situation on Global market for ferrous scrap”, sims metal
management, united kingdom. 10. “Cradle-to –gate life cycle Inventory: Canadian and US steel production by mill type”,
The Athena Sustainable material institute, Markus Engineering service, March, 2002. 11. “Steel Recycling Institute Urges consumers to go green from National Recycling month,
recycling institute. 12. “BHP is committed to a policy of waste minimization and management” , steel and the
Environment, http://www.bhpbilliton.com/bbccontent
repository/report/steelandtheenvironment 13. “Available and Emerging Technologies of Reducing greenhouse gas emission from the
Iron and steel Industry”, United States Environmental Protection Agency, October,2010 14. S. Bell, B.Davis, A.Javaid,E.Essadiqi. “Final report on energy Efficiency and Energy savings
in Recycling” report No.2005(CF) March, 2006 15. L.Price, J. Sinton, E. Worrell, D. Phylipsen, X. Hu, J. Li. “Energy use and carbon dioxide
emission from steel production in China”, Environmental Energy Technology Division, MAY, 2001.
16. Background Paper, Iron and Steel Scrap, http://www.susproc.jrc.ec.europa.eu 17. K. Schumache, J. Sathaye. “India Iron and steel Industry, productivity, Energy Efficiency
and carbon dioxide emission”, October, 1998, http://www.ies.lbl.gov 18. E. Worrell, L.Price, M. Neelis, C. Galitsky, Z. Nan. “World Best Practices Energy Intensity
Values for selected industrial sectors” , Environmental Energy Technology Division, February, 2008
19. S.A.Mohammed. “Historic Development of Nigeria Steel Industry, African Iron and Steel Association”, October, 2002.

66
20. P. Kotler, V. Wong, J. Saunders, G. Armstrong.(2005) “Principles of Marketing”, Forth
edition, Pearson practice hall, ISBN:-10:0-273-68456. 21. Chattergee, Amit. “Recent Development in Ironmaking and Steelmaking”, Iron and
Steelmaking, 222.2(1995). Pp100-104 22. Bruce Hannon, James R. Brodrick. “Steel Recycling and Energy Conservation”.
23. 23 R.J. Fruehan et al. “The future of steelmaking and its technologies” (Idaho Falls, ID: Idaho National Research Laboratory. 1995)
24. Industry commission, Recycling report, No.6, volume 11. Recycling of products, Australian Government publishing service Canberra 22, February, 1991
25. 25. American Iron and steel Institute, 2003, Steel Recycling Continues to grow, accessed May, 30, 2003.
26. Bhaktavatsalam, A.K. Choudhury,R. 1995.Specific energy consumption in the steel industry. Energy, 2001.
27. 27. Choudhury,R., Bhaktavatsalam, A.K., 1997. “Energy inefficiency of Indian steel industry – scope of energy conservation”, Energy conservation and management, 38, 167-171
28. Kusik, C., Kenehan,C., 1978. Information circular 8781: Energy use pattern for metal Recycling. United States Bureau of mines, Washington, DC.
29. 29.Us Department of Energy , 2002, Energy and Environmental Profile of the US mining industry, Office of Energy Efficiency and Renewable Energy , Washington , DC.
30. Worrel , E., Levine,M, Price , L, Martin, N, 1996, Potentials and policy implications of energy materials efficiency improvement . A report of the United Nations, Division for sustainable Development.
31. Worrel, E., Levine,M, Price , L, Martin, N., 2001. Energy Efficiency and carbon dioxide emission reduction opportunities in the US Iron and steel sector, Energy 26, 513-536
http://greenlivingtips.com/articles/182/1/recycling-energy-savings.html
http://www.wasteonline.org.uk/resources/informationsheets/metals.htm
http://www.steelonthenet.com/ISSB/html/Sep_2010.html

67
Appendix
Appendix 1: Top steel producing countries
Serial number Country name Amount in million metric tons(MMT)
1 China 567.80
2 Japan 87.50
3 India 62.80
4 Russia 60.00
5 United States 58.2
Source: World steel in figures, 13, July, 2010
Appendix 2: By–products and waste comparison between integrated route (Blast
furnace/Basic Oxygen Furnace) and mini mills (recycling route-EAF) [14]
By-products and waste Integrated route(kg/ton) By-product and waste Mini mills(kg/ton)
Blast furnace slag 250 EAF slag 116
BF dust and sludge 25 EAF dust 18
BOF slag 135 Metallic waste 11
Metallic wastes 7 Refractory wastes 10
Refractory Waste 5.5 others 5
Total 423 Total 160

68
Appendix 3: Scrap Top Exporting/Importing Counties
EXPORT(In Million Tons) IMPORT(In Million Ton)
Country 2002 2003* Country 2002 2003*
USA 9.00 10.80 Turkey 9.90 11.80
Germany 7.50 6.70 China 7.90 9.20
Japan 6.00 5.70 South Korea 7.20 6.00
France 5.80 5.10 Spain 5.50 6.30
Russia 5.80 6.00 Italy 4.00 4.00
UK 5.60 7.20 Germany 4.00 4.40
2003* data includes estimates Source: Iron and Steel Statistics bureau
Appendix 4 : Worldwide steel production, steel scrap consumption and purchase (million
tons) [9]