implications of an eu eastern enlargement under a new
TRANSCRIPT

Implications of an EU Eastern EnlargementUnder a New Common Agricultural Policy
Claudia A. Herok and Hermann Lotze, Department ofAgricultural Economics and Social Sciences, HumboldtUniversity of Berlin
In preparing for an Eastern enlargement it is almost certain that the EU has to modifythe Common Agricultural Policy (CAP). Four scenarios for an Eastern enlargement in2005 under a simplified CAP are analyzed within a multiregion CGE model. Two possibledevelopment paths up to the date of enlargement are taken into consideration. Under apartial liberalization of the CAP, agricultural output and domestic welfare in CEEC riseafter EU integration, but it is questionable whether the new members would still complywith their WTO bindings. Under a complete liberalization of the CAP, agricultural outputin CEEC declines after EU integration. EU expenditures on agricultural policy are heavilyreduced, which would provide room for more general structural aid for the new mem-bers. 2000 Society for Policy Modeling. Published by Elsevier Science Inc.
Key Words: EU eastern enlargement; Common agricultural policy; CGE model; Globaltrade analysis project (GTAP).
1. INTRODUCTION
The integration of several Central and East European countries(CEEC) will probably be one of the biggest challenges for theEuropean Union (EU) in the near future. In contrast to earlierenlargement rounds, there are not only considerable differencesbetween the EU-15 and potential new members in terms of eco-nomic development, but also with respect to the political environ-ment in the transition process. While 10 CEEC have formallyapplied for membership, the EU recently announced five of themas being the first candidates for integration, i.e., Estonia, CzechRepublic, Hungary, Poland, and Slovenia.
Address correspondence to Dr. Hermann Lotze, Department of Agriculture Economicsand Social Sciences, Humboldt University of Berlin, Luisenstr. 56, D-10099 Berlin, Germany.
Received August 1997; final draft accepted June 1999.
Journal of Policy Modeling 22(6):661–690 (2000) 2000 Society for Policy Modeling 0161-8938/00/$–see front matterPublished by Elsevier Science Inc. PII S0161-8938(98)00035-0

662 C. A. Herok and H. Lotze
For several reasons the agriculture and food sector could be-come a major stumbling block on the way towards an enlargedEU. The potential new members have a higher share of agriculturein GDP, a much higher proportion of agricultural labor force, andhousehold expenditures on food that are considerably above EUlevels (OECD, 1996; World Bank, 1996). Hence, protection mea-sures and transfers under the Common Agricultural Policy (CAP)will have an important impact on the new members during theprocess of enlargement.
There is almost no doubt that the CAP will have to changeprior to the integration of any CEEC. The pressure for change isalready indicated by the EU Commission in the “Agenda 2000”(European Commission, 1997a). As a consequence of the GATTUruguay Round, the EU faces constraints on the level of agricul-tural border protection. Depending on the level of world marketprices in the near future, upper limits for subsidized exports andthe total amount of export subsidies could become binding andforce the EU to cut down overall production in grains, sugar, beef,and dairy products (European Commission, 1997a, p. 29). So-called “blue box” measures under the WTO, for example, product-related compensation payments that were introduced in the 1992CAP reform, will also be challenged in the upcoming WTO round(USDA, 1997a).
With regard to new members, it is debated whether they shouldbe eligible for all benefits under the CAP. Because most of thedirect payments currently in operation in agriculture were intro-duced as a compensation for earlier price cuts within the EU-15,it could be argued that there is no need for compensation in theCEEC. More importantly, income distribution between agricul-ture and other sectors would be heavily distorted if farmers in theCEEC received the same nominal subsidy payments as currentlyavailable in the EU-15. On the other hand, so far all agriculturalpolicy measures are applied uniformly throughout the EU, andit might be difficult to establish a “two-class” system where farmersin some countries are subsidized more than in others. The EUCommission itself indicates that there will be a single agriculturalpolicy regime for old as well as new members, although possiblyonly after a longer transition period (Agra Europe, 1997, p. E7).However, the transfer of current protection levels to the CEECmight not be possible for other reasons. From the GATT UruguayRound the CEEC face limits regarding border protection that aremuch lower than current EU levels. If they would join the EU

IMPLICATIONS OF AN EU EASTERN ENLARGEMENT 663
without major changes to the CAP, their WTO obligations wouldcertainly be violated (Twesten, 1997).
Finally, the discussion about financing the CAP in general isanother crucial issue. It can be assumed that the CEEC will benet recipients with respect to the EU budget, at least in the firstyears of membership. Hence, the financial impact of a potentialenlargement will become a crucial issue during the upcomingnegotiations. Already now the EU agricultural guideline sets alimit to the agricultural budget, as expenditures must not increaseby more than 74 percent of the growth rate of GDP (Tangermann,1997, p. 14). It is unlikely that the EU will raise this rate in thenear future.
There is a broad discussion and a variety of proposals for furtherdeveloping the CAP. In the “Agenda 2000” the EU Commissionrecently proposed intervention price cuts for grains, milk, andbeef combined with per-animal compensation payments, an exten-sion of the milk quota until 2006, and set-aside rates fixed at zeropercent. Uniform per-hectare payments for grains, oilseeds, andvoluntary set-aside will be provided. Going much beyond this,several agricultural economists suggested further decoupling ofagricultural income support from production including the intro-duction of direct factor subsidies (Kirschke et al., 1997, 1998; Wiss.Beirat, 1997). The debate over changes in EU agricultural policymakes the CAP a “moving target” for the new members anddifficult to adjust their own policies towards the CAP in prepara-tion of joining the EU.
Several studies have been conducted analyzing a potential EUEastern enlargement in a partial equilibrium framework (e.g.,Tangermann, Josling, and Munch, 1994; Anderson and Tyers,1995; European Commission, 1995; Mahe et al., 1995). While par-tial equilibrium models are usually quite detailed in the commoditydisaggregation, they do not account for linkages to other sectorsof the economy through factor markets and intermediate inputuse.1 In the case of the CEEC, where agriculture has a significantshare in GDP and trade, this becomes even more important. Inthis paper the EU enlargement is analyzed using a multiregionalCGE model that was developed by the Global Trade Analysis
1 Brockmeier, Hertel, and Swaminathan, (1996) provide an overview of these studiesand discuss the advantages of general versus partial equilibrium approaches for the analysisof EU integration of transition countries.

664 C. A. Herok and H. Lotze
Project (GTAP). The GTAP model and the database have beenused for this purpose in other studies (Baldwin and Francois, 1996;Brockmeier, et al., 1996; Frandsen, Bach, and Stephensen, 1996;Hertel, Masters, and Gehlher, 1997; Swaminathan, 1997). Thispaper adds to these studies a different set of policy options underthe CAP and an explicit modeling of the development path upthe point of enlargement. Different scenarios for the integrationof Central European countries into the EU are analyzed with auniform payment on agricultural land as the major policy instru-ment under a modified CAP. In addition to various policy options,two possible growth scenarios up to the date of enlargement aretaken into consideration.
In the next section the policy scenarios are described in detailfollowed by the model description and empirical implementation.Selected simulation results are provided in Section 4 coveringgrowth in output and trade as well as changes in domestic pricesand factor use after EU enlargement. Trade creation and tradediversion effects of the enlargement are discussed, and some bud-getary consequences are provided. The paper concludes with asummary and outlook regarding further modeling options.
2. POLICY SCENARIOS FOR EU ENLARGEMENT
In modeling a potential Eastern enlargement of the EU witha focus on agriculture and food, we have to answer the followingquestions: 1) Which of the CEE countries will be the first newmembers of the EU? 2) Will there be any changes to the CAPprior to enlargement, and will all policy measures be fully extendedto the new members? 3) When will the enlargement actually occurand how will the model regions develop up to this point?
Although the EU recently announced the first five candidatesfor enlargement negotiations, in this paper we analyze a simultane-ous integration of a group of seven countries from Central Europe,i.e., Bulgaria, Czech Republic, Hungary, Poland, Romania, Slo-vakia, and Slovenia, which will be called “CEEC-7.” The reasonfor choosing this group is mainly technical, due to the regionaldisaggregation of the model database.
With regard to the second question, it can be assumed thatthe EU will, due to WTO obligations and budgetary restrictions,further liberalize its agricultural policies in the future. This mighteven become a precondition for enlargement, because tariff bind-ings for CEEC under the WTO are generally much below those

IMPLICATIONS OF AN EU EASTERN ENLARGEMENT 665
of the EU-15, and any new member country will have free accessto agricultural markets and policies within the EU (Tangermann,1997, p. 14). From the various proposals for further CAP reform(see Kirschke et al., 1997, for an overview) in this paper a uniformsubsidy on agricultural land is chosen as the main policy instrumentunder a modified CAP. This was also considered as an importantoption in recent studies in the context of German agriculture(Kirschke et al., 1997, 1998; Wiss. Beirat, 1997). Land subsidiesmay not only be seen as a means of income compensation due toprice liberalization, they also could be easily linked to achievementof certain environmental standards. In modeling the EU enlarge-ment we assume a complete and immediate transfer of all agricul-tural policy measures into the CEEC-7.2
Policy options covered in this paper comprise partial as well ascomplete liberalization of the CAP. Partial liberalization includesthe abolishment of animal payments and compensation paymentsfor crops as well as the compulsory set-aside program. Borderprotection for sugar, milk, and beef is reduced by 10 percent.Production quotas and other market regulations remain in place.With respect to changes in border protection, this scenario issimilar to the “Agenda 2000,” as mentioned above. However, auniform land subsidy is substituted for the variety of direct pay-ments for crops and livestock in the “Agenda.” It can be assumed,as a side effect, that this will also lead to lower administrative costs.The scenario of complete liberalization implies the abolishment ofall border protection measures in agriculture and food, no quotarestriction for milk and sugar, as well as the removal of all product-related compensation payments. In addition, the same uniformland subsidy is introduced.
With respect to the third question, the actual date of enlarge-ment, we assume that the integration of the CEEC-7 will occurat once in the year 2005. To come up with realistic referencescenarios for the actual enlargement we chose to update the modeldatabase prior to integration of the CEEC-7 into the EU-15.However, the general economic development until 2005 is difficultto forecast, especially in the Eastern European transition coun-tries. Slovenia or Poland lately achieved economic growth rates
2 In this paper we abstract from the fact that introduction of the CAP in CEEC willprobably have to provide for an adjustment period of several years; e.g., Banse and Munch(1997) assume an integration period between 2003 and 2007.

666 C. A. Herok and H. Lotze
Table 1: Possible Scenarios for an EU Integration of the CEEC-7 in 2005
EU agricultural policy
Growth in CEEC-7 Partial liberalization Complete liberalization
Slow plib s lib sFast plib f lib f
at 4–7 percent p.a. (Ryan and Jones, 1997), but it is questionablewhether they can sustain this development in the near future.Another question is whether other new members like Bulgariaand Romania will be able to catch up in the process of economicand political transition.
Taking these uncertainties into account, we construct fourcounterfactual reference situations for the actual enlargement in2005 that differ with respect to economic growth in the CEEC-7and further reform of the CAP in the EU-15. For the CEEC-7we assume (1) a moderate growth rate of GDP close to projectionsfor the EU-15, and (2) a faster growth rate more in line withexperiences from the “tiger economies” in South East Asia. Ex-pected growth rates for other regions in the model are the samethroughout the scenarios. Table 1 provides an overview of theenlargement scenarios covered in this paper.
3. IMPLEMENTATION OF THE SCENARIOS
3A. Model Structure and Aggregation
A multiregion CGE model seems appropriate for the analysesin this paper. It does not only cover the agriculture and foodsector, but traces the links to other sectors of the economy includ-ing effects on international trade. The GTAP model provides aflexible structure for CGE analysis of problems in internationaltrade. From the data base a maximum of 32 regions and 37 com-modities can be aggregated according to the problem at hand.3
3 A detailed description of the GTAP modeling framework can be found in Hertel(1997) or on the Internet at “http://www.agecon.purdue.edu/gtap/”. The Version 3 databaseis described in McDougall (1997).

IMPLICATIONS OF AN EU EASTERN ENLARGEMENT 667
Table 2: Model Regions and Sectors
Model regions Model sectors
EU-12 Agriculture: Wheat (wht)Austria/Finland/Sweden Other grains (gro)CEEC-7 Nongrain crops (ngc)Australia/New Zealand Livestock products (olp)Canada Food industry: Meat products (met)USA Milk products (mil)Japan Other food products (ofp)Former Soviet Union (FSU) Other sectors: Primary products2 (opp)Asia Manufactures (mnfcs)“Rest of the World”1 Services (svces)
1 Mainly Latin America and Africa.2 Mainly forestry, fishery, mining and energy.
The model aggregation used here covers 10 regions with 10 sectors(see Table 2). Each sector only produces one output.
On the production side of all sectors the model has a so-called“nested structure.” Land, labor, and capital as the primary factorsof production are combined to a primary aggregate input usinga constant elasticity of substitution (CES) function. The sameapplies to domestic and imported intermediate inputs that arecombined to an intermediate aggregate input. The two aggregatesthen contribute to final output via a Leontief function. In thestandard model capital and labor are perfectly mobile betweensectors, but the total endowment with these factors within a regionis fixed.
Land is only used in primary agriculture and in the other primaryproducts (opp) sector, while mobility of land between these sectorsis limited by an elasticity of transformation. Private demand ismodeled by a Constant Difference in Elasticities (CDE) function,which is more flexible than the CES function and allows for differ-ences in price and income responsiveness of demand in differentregions depending on the level of development and consumptionpatterns (Hertel, 1997, p. 26).
Main assumptions of the standard model are perfect competi-tion in all markets as well as profit and utility maximizing behaviorof producers and consumers, respectively. In modeling interna-tional trade flows the so-called Armington assumption is applied(Armington, 1969). It is assumed that there is product differentia-tion by regions. This implies that for a certain product trade flows

668 C. A. Herok and H. Lotze
between two regions can always go in either direction at the sametime and there is no net trade flow. The Armington assumptionfits nicely with regularly observed discrepancies between “worldmarket prices” for the same commodity at different locations. Thechange in world market prices in GTAP is calculated as a weightedaverage price index using bilateral trade flows as weights. How-ever, the Armington assumption has also been criticized by manyauthors, as it is not very flexible and does not endogenize aspectsof imperfect competition and industrial organization into interna-tional trade. But it still seems to be a reasonable compromise,as detailed information on the competitive situation for varioussectors is currently not available on a global basis (see Hertel,1997, pp. 21–22). The macroeconomic closure of the model isaccomplished by a “global bank,” which assures an equilibriumof savings and investments between the model regions. In thestandard closure used here the regional share in global investmentis fixed. This closure rule is basically neoclassical, but it allowsfor some adjustment in the mix of investment on a regional level(Hertel, 1997, pp. 28–30). The model is solved using the GEM-PACK software package (Harrison and Pearson, 1996).
The GTAP project has developed a comprehensive databaseusing information from numerous international sources (McDou-gall, 1997). The base year for the data is 1992. However, for furtherdevelopment of the CAP the reference scenario should be thesituation in 1996/97 when the changes of the 1992 reform weresupposed to be fully implemented. To update the database forthe simulations in this paper we implemented the 1992 policychanges within the EU-12, i.e., price decreases for grains, oilseeds,protein seeds, and meat products in connection with compulsoryset-aside and direct compensation payments. Furthermore, by in-tegrating Austria, Finland, and Sweden the current EU-15 wascreated prior to the simulations of further enlargement to the East.
3B. Modeling the Development Period Up to 2005
To update the database and create a realistic base scenariofor the enlargement year 2005 we have to forecast the generaleconomic development of the model regions. For this it would benecessary to have exogenous estimates on population growth andcommodity-specific changes in total factor productivity (TFP) forall regions. Because information on TFP changes by commodity

IMPLICATIONS OF AN EU EASTERN ENLARGEMENT 669
is not available, we have to derive rates of technical change endog-enously within the model by applying a methodology first pre-sented by Gehlhar, Hertel, and Martin (1994).4 We use exogenousforecasts for several macroeconomic indicators (growth of GDP;growth of population and labor force; capital accumulation) astarget values and solve the model by taking technical changeparameters as endogenous variables. Thus, we derive TFP changesfor every model region according to the exogenous assumptionsabout overall economic development up to 2005. Moreover, gen-eral economic growth is disaggregated into the equivalent sectorspecific development within the model regions.5 Table 3 providesmacroeconomic forecasts used for calculating the TFP changes inthe development period up to 2005. For the region CEEC-7, weassumed two different options with respect to economic growth—aslow scenario with annual GDP growth at about 3 percent, anda fast scenario with 6–7 percent.6
3C. Reform of the CAP and Implementation of theUruguay Round
The policy options covering partial and complete liberalizationof the CAP in connection with a uniform land subsidy in agricul-ture are implemented in the model as follows (see Table 4).
Under the partial liberalization scenarios all direct paymentsfor grains, nongrain crops, and livestock that were introduced inthe 1992 CAP reform are abolished. Border protection for non-grain crops, meat, and milk products is reduced by 10 percent.7
For wheat and other grains in the model we assume for simplicitythat after completion of the 1992 reform in 1996 there is no moreborder protection, although actually export subsidies and some-times even export taxes were temporarily enforced.
4 This method was also used by Frandsen et al. (1996) for modeling an EU enlargementin 2005.
5 Here we just derived uniform rates of technical change throughout all sectors in oneregion. This could certainly be refined if more information was available on sector-specificrates of technical change. For example, Frandsen et al. (1996) assume higher rates oftechnical change in agriculture than in the rest of the economy. They set agricultural ratesof technical change exogenously and let the other sectors adjust accordingly.
6 A growth rate of 6–7 percent is certainly a strong assumption, especially as the CEECgroup is very heterogeneous and growth might not be sustained over several years. Thisoption should be seen as an upper bound for the transition countries.
7 Partial liberalization of ngc and met is taken as an approximation for partial liberaliza-tion of sugar and beef, which belong to these commodity aggregates.

670 C. A. Herok and H. Lotze
Tab
le3:
Mac
roec
onom
icF
orec
asts
for
1992
–200
5(i
n%
)
CE
EC
-7C
EE
C-7
slow
fast
EU
-15
FSU
AU
S/N
ZC
AN
USA
JAP
ASI
AR
OW
Ann
ual
grow
thof
GD
Pin
perc
ent
1992
–199
52
1.6
21.
62.
12
11.6
2.6
1.3
1.8
1.9
7.3
2.4
1995
–200
03.
517.
012.
22
0.6
2.8
2.7
2.5
2.1
7.0
3.6
2000
–200
53.
016.
012.
33.
22.
32.
92.
52.
16.
64.
0A
nnua
lpo
pula
tion
grow
th2
inpe
rcen
t19
92–1
995
20.
32
0.3
0.4
0.3
1.2
1.3
1.0
0.3
1.6
2.4
1995
–200
00.
00.
00.
30.
20.
91.
00.
90.
21.
42.
220
00–2
005
0.2
0.2
0.3
0.4
0.8
0.9
0.8
0.2
1.2
2.0
Ann
ual
capi
tal
accu
mul
atio
nin
perc
ent
1992
–200
53.
013.
013.
02.
03.
213.
43.
44.
87.
22.
9
Sour
ces:
USD
A19
97b;
Geh
lhar
etal
.19
94;
1 own
assu
mpt
ions
;2 eq
ual
togr
owth
rate
ofla
bor
forc
e.

IMPLICATIONS OF AN EU EASTERN ENLARGEMENT 671
Tab
le4:
Mod
elIm
plem
enta
tion
ofth
eSc
enar
ios
plib
spl
ibf
lib
sli
bf
Dir
ect
subs
idie
s1A
bolis
hmen
tof
all
prod
uct-
rela
ted
Abo
lishm
ent
ofal
lpr
oduc
t-re
late
dw
ht,g
ro,
ngc,
olp
subs
idie
ssu
bsid
ies
met
,m
il,of
pA
bolis
hmen
tof
all
prod
uct-
rela
ted
subs
idie
san
dta
xes
Bor
der
prot
ecti
on2
ngc,
met
,m
il2
10pe
rcen
t2
10pe
rcen
tA
bolis
hmen
tof
bord
erpr
otec
tion
wht
,gr
o,ol
p,of
pA
bolis
hmen
tof
bord
erpr
otec
tion
Lan
dsu
bsid
y3
wht
,gro
,ng
c,ol
p75
perc
ent
75pe
rcen
t75
perc
ent
75pe
rcen
tG
row
thin
CE
EC
-7sl
owfa
stsl
owfa
st
1C
ompe
nsat
ion
paym
ents
,se
t-as
ide
paym
ents
,an
dan
imal
paym
ents
from
the
1992
CA
Pre
form
.2
Mea
sure
das
the
rati
odo
mes
tic
pric
e/w
orld
mar
ket
pric
e;a
redu
ctio
nof
bord
erpr
otec
tion
by10
perc
ent
iseq
uiva
lent
toa
redu
ctio
nof
the
rati
oby
10pe
rcen
t.3
Dir
ect
fact
orpa
ymen
ts,
inpe
rcen
tof
the
rele
vant
fact
orpr
ice.
Sour
ce:K
irsc
hke
etal
.19
97;
own
calc
ulat
ions
.

672 C. A. Herok and H. Lotze
As a substitute for current output subsidies a uniform paymenton agricultural land is introduced that is not related to any specificproduct. Because the GTAP model works in percentage changes,any policy measure has to be translated into relative terms. Thelevel of the land subsidy is determined by taking the amount ofall current compensation payments and direct subsidies in theEU-15 (i.e., 18.7 billion ECU in 1996), reducing it by 10 percentand dividing it by the total value of agricultural land as shown inthe GTAP data base for the EU-15.8 Thus, we derive a subsidylevel at about 75 percent of the factor price for land, which isequivalent to a payment of about 130 ECU per hectare of agricul-tural land. Technically, the ratio between the market price forland and the perceived factor price for producers is reduced suchthat factor costs per unit, net of the subsidy, are 25 percent of theactual market price.
When the land subsidy is transferred to the CEEC-7 the ques-tion arises whether the same absolute amount per hectare shouldbe paid or some adjustment to local price ratios should be made.An additional problem in the process of modeling a land subsidycauses the fact that information on land prices or land rents ishardly available in Central and Eastern Europe, because landmarkets are still not fully developed. In this paper we introducea land subsidy in CEEC-7, which is equal to the EU-15 in relativeterms, i.e., 75 percent of the local land rent, based on the valueof land endowment in the GTAP database.9 This seems to be areasonable compromise in terms of a harmonized policy regime,because it would provide a uniform policy measure throughout theenlarged EU with some specific adjustment to regional conditions.
With respect to policy changes in nonagricultural sectors in theEU-15 and all sectors in the other model regions, it is assumed thatthe obligations from the GATT Uruguay Round are completelyfulfilled until 2005. This part of the analysis was possible becausethe GTAP 3 database contains global protection data at pre- andpost-Uruguay-Round rates (Ingco, 1997).
8 Current expenditures on direct payments were arbitrarily reduced by 10 percent,because we assume that some degree of budget reduction will be likely in any furtherCAP reform.
9 Data on CEEC-7 and the Former Soviet Union are generally quite poor even in theGTAP database (see McDougall, 1997, Ch. 16). This is especially true for primary factorendowments. However, the GTAP database seems to be the only source where thisinformation is harmonized with other regions.

IMPLICATIONS OF AN EU EASTERN ENLARGEMENT 673
3D. Modeling of CEEC-7 Integration
EU integration of the CEEC-7 is simulated in the model as acreation of a customs union. First, all barriers to trade within theCEEC-7 region and between CEEC-7 and EU-15 are removed.Second, with respect to trade with third countries border protec-tion levels of EU-15 are applied to CEEC-7. And finally, internalregulations under the CAP are transferred to the CEEC-7. Themilk quota, which is still in operation under partial liberalization,is applied in the new member countries by fixing output quantitiesat the level of 2005 prior to integration. New payments on landare applied at the same relative level as in the EU-15.
Table 5 gives an impression of the levels of agricultural supportin the EU-15 and the CEEC-7 prior to enlargement. It showsprotection levels in percent for the status quo in 1996 and thescenarios in 2005 after partial liberalization in the EU-15. Valuesfor CEEC-7 in 1996 are not given because they are assumed toremain basically the same until 2005. There are only marginaleffects due to Uruguay Round obligations. Also, the values forEU-15 in 2005 after complete liberalization are omitted becausein the agriculture and food sectors they are all equal to zero.
The effects of a partial liberalization in the EU-15 after 1996(abolishment of output subsidies in agriculture, reduction of bor-der measures) as well as the need for adjustment for CEEC-7during the integration process become clear. This is especiallyrelevant for export subsidies that are mostly zero in the transitioncountries prior to integration. As far as import tariffs are con-cerned, there is serious upward pressure in nongrain crops andmilk, whereas tariffs on meat are similar to EU-15. In feed grains,livestock, and other food products protection levels in CEEC-7are slightly higher than in EU-15.
4. SIMULATION RESULTS
4A. Development Period Up to 2005
First, we will briefly discuss the simulation results for the devel-opment period up to 2005 and then look at the EU enlargementeffects in more detail.
For the EU-15 an overall GDP growth rate of about 31 percentis assumed for the development period up to 2005. Differencesin output growth in the various sectors are mostly due to changes

674 C. A. Herok and H. Lotze
Tab
le5:
Pro
tect
ion
Lev
els
inE
U-1
5an
dC
EE
C-7
in19
96an
d20
05(A
fter
Par
tial
Lib
eral
izat
ion
ofth
eC
AP
inE
U-1
5;in
Per
cent
)1,2 O
utpu
tsu
bsid
ies
Exp
ort
subs
idie
sIm
port
tari
ffeq
uiva
lent
s
EU
-15
EU
-15
CE
EC
-7E
U-1
5E
U-1
5C
EE
C-7
EU
-15
EU
-15
CE
EC
-719
9620
0520
053
1996
2005
2005
1996
2005
2005
wht
24.6
0.0
0.7
0.0
0.0
0.0
0.0
0.0
27.
5gr
o16
.90.
00.
50.
00.
00.
00.
00.
011
.8ng
c71
.00.
00.
430
.417
.40.
050
.035
.011
.2ol
p9.
20.
00.
60.
00.
00.
01.
51.
54.
4m
et2
4.1
24.
16.
871
.254
.00.
050
.535
.535
.4m
il2
0.2
20.
20.
291
.372
.20.
012
6.6
105.
72
2.1
ofp
210
.82
10.8
1.2
0.6
0.6
0.0
12.7
12.7
18.9
mnf
cs2
0.8
20.
82
0.2
20.
12
0.1
21.
48.
54.
28.
1sv
ces
22.
12
2.1
20.
20.
02
0.1
0.0
0.0
0.0
0.0
opp
212
.82
12.8
23.
50.
40.
20.
00.
60.
61.
5
1C
ompl
ete
liber
aliz
atio
nis
omit
ted
beca
use
all
valu
esar
eze
ro.
2P
rote
ctio
nle
vels
are
give
nby
the
rati
o[(
dom
esti
cpr
ice
2w
orld
pric
e)/w
orld
pric
e].
3V
alue
sfo
rC
EE
C-7
in19
96ar
eom
itte
dbe
caus
eth
eyon
lym
argi
nally
diff
erfr
om20
05.
Sour
ce:G
TA
P3
data
base
;ow
nca
lcul
atio
ns.

IMPLICATIONS OF AN EU EASTERN ENLARGEMENT 675
Table 6: Forecasts for Output Growth Between 1995 and 2005 (in Percent)
wht gro ngc olp met mil ofp mnfcs svces opp
EU-15plib_s 17.5 17.4 219.5 17.1 17.2 14.5 20.8 31.6 37.3 34.2plib_f 17.4 16.7 219.9 16.6 16.8 14.3 20.7 31.5 37.3 34.1lib_s 18.6 18.6 234.2 16.1 15.0 2.3 31.5 32.3 37.2 35.1lib_f 18.5 17.8 234.6 15.6 14.6 1.9 31.5 32.2 37.3 35.0
CEECplib_s 26.8 26.4 38.9 29.9 28.0 30.4 27.2 40.4 44.5 34.4plib_f 88.1 88.4 110.1 87.3 79.3 81.8 89.0 141.1 124.1 137.8lib_s 29.0 26.7 44.0 35.8 37.7 62.9 23.4 38.7 44.3 32.9lib_f 91.8 89.4 118.8 96.4 94.1 130.8 83.9 138.4 123.8 135.3
Source: Own calculations.
in agricultural policies (see Table 6). Different growth rates inCEEC-7 have only marginal effects for the EU-15.
With the exception of nongrain crops, all sectors are growingdue to overall expansion of the economy. Nongrain crops (includ-ing sugar and oilseeds) suffer most from the abolishment of highoutput subsidies and border protection. Other food products (ofp)gain more from complete liberalization because there is a certainlevel of taxation effective in the original GTAP database that isalso taken away in this scenario.
With respect to milk products, we have to explain the fact thatoutput is rising by about 14 percent under the partial liberalizationscenarios, despite the fact that the quota system is assumed to bestill in operation. This is a rather synthetic result, due to theassumptions made in forecasting the development until 2005. GDPand population are growing at certain rates (see Table 3) thatcauses a growth in private and intermediate demand. Instead offixing domestic output we rather allow the production quota toadjust in line with domestic demand.10 The resulting growth inoutput is sensitive to the assumed growth rates of population andtotal factor productivity. The model result of 14 percent is certainlytoo high compared to EU forecasts that predict stagnating milkconsumption for the period 1995–2005 (EU Commission, 1997b).But our predictions are based on different assumptions, for ex-ample, we cannot account for changes in consumer preferencesover time.
10 This idea was taken from Frandsen et al. (1996).

676 C. A. Herok and H. Lotze
Table 7: Changes in World Market Prices Between 1995 and 2005 UnderVarius Policy Scenarios (in Percent)
wht gro ngc olp met mil ofp mnfcs svces opp
plib_s 6.6 2.4 16.3 6.2 5.6 11.3 22.1 23.6 21.8 27.6plib_f 6.1 2.0 15.8 5.8 5.2 11.0 22.3 23.6 21.8 27.7lib_s 6.8 2.9 18.4 5.4 18.0 29.0 26.0 23.5 21.8 27.5lib_f 6.3 2.5 17.9 4.9 17.6 28.5 26.1 23.6 21.8 27.6
Source: own calculations.
Manufacturing and service sectors are growing on average fasterthan agriculture and food industries. The limited endowment ofland is not a constraint here. Moreover, these sectors are relativelycapital intensive and the fact that capital accumulation is assumedto be faster than the growth in labor force also accelerates outputgrowth in these sectors.
The dominant effect on output in CEEC-7 is the overall growthrate in this region, which is assumed to be 37 percent in the slowscenarios and 93 percent in the fast scenarios. In addition todomestic growth effects, agricultural liberalization in the EU-15especially affects nongrain crops, livestock, meat, and milk prod-ucts in the CEEC-7. Here, output growth is significantly higherin the scenarios with complete liberalization of the CAP. Similarto the EU-15, output growth is strongest in manufacturing, primaryproducts and services. Some of the output changes in the fastscenarios seem to be very high. As mentioned earlier, they corre-spond to an overall growth assumption of 6–7 percent p.a., whichis certainly an upper bound.11
Changes in world market prices up to the date of enlargementare mainly caused by further CAP reform.12 Table 7 shows theprice effects simulated for the development period up to the year2005. Different growth rates in CEEC-7 hardly affect these resultsbecause they are a small region in the global market.
Growth of GDP and population in other regions and implemen-tation of the Uruguay Round also contribute to the price increase
11 However, in the South East Asian economies output in some commodities doubledover the last 10 years (see Faostat), so some of the results in Table 6 might not be toounrealistic. As another example, production of oilseeds in the EU also heavily increasedover the last decade (Uhlmann, 1996, p. 28).
12 The changes are comparable to the effects derived in Herok and Lotze (1997) forCAP reform without any growth effects.

IMPLICATIONS OF AN EU EASTERN ENLARGEMENT 677
Figure 1. Changes in trade balance in EU-15 until 2005 prior to enlargement(in Mill. 1992 ECU).
in agriculture and food products. In the nonagricultural sectors,world market prices are falling. Here, the change in productivityseems to be stronger than the increase in global demand.
Figure 1 shows changes in the trade balance for the EU-15 until2005 in the slow scenarios. Because the Armington specificationin the model causes changes in exports as well as imports in eachsector, the trade balance summarizes net effects on internationaltrade. The trade balance for nongrain crops deteriorates heavily,between 35 and 58 billion 1992 ECU. Although not presentedhere, the quantity changes for most agricultural exports indicatethat even under a partial liberalization as presented here theEU-15 might be able to fulfill its Uruguay Round obligations withrespect to export quantities. This is, with the exception of meatproducts, where export quantities are only reduced by about 11percent, while WTO commitments are about 30 percent (IATRC,1994). A further reduction in the level of border protection formeat products would be required, like, for example, a 30-percentprice reduction as it is proposed by the EU Commission in the“Agenda 2000.”
In the nonagricultural sectors of the EU-15, manufacturing andprimary products lose world market shares, which is due to strongexpansion in Asia (including China) where an overall growth rateof about 136 percent is projected. Only in the services sector is

678 C. A. Herok and H. Lotze
the EU able to improve the trade balance considerably. The totaltrade balance deteriorates, which is in accordance with the as-sumed capital accumulation and the macroeconomic closure ofthe model.
4B. Eastern Enlargement in 2005
Production effects in the EU-15 as a consequence of an Easternenlargement are relatively small. According to the GTAP data-base, the share of CEEC-7 in overall trade of EU-15 is about 4percent, and GDP in CEEC-7 is about 3 percent of the EU-15.Hence in this section, model results are primarily discussed withrespect to the new members. However, trade effects are alsoimportant for the EU-15 and responsible for the resulting welfarechanges.
The enlargement effects are mainly determined by the differ-ences in protection levels between EU-15 and the new membercountries as shown in Table 5. In the process of integration intothe EU and implementation of CAP regulations, the new memberscompletely remove all border protection measures towards theold EU countries. At the same time, border protection againstimports from third countries is adjusted to levels prevailing in theEU-15 at the time of enlargement. Even after partial liberalizationin the EU-15 import tariff equivalents for nongrain crops and milkproducts are still much higher, and there are no export subsidiesat all in CEEC-7 prior to the integration. For grains, livestockproducts, other food products, and manufactures, border protec-tion in the new member countries has to be decreased. Becausesome of the CEEC-7 have reached their WTO tariff bindingsalready in 1996 (Tangermann, 1997; Twesten, 1997), EU integra-tion under the partial liberalization scenarios discussed here mightbe problematic. However, the sectors in the GTAP model arelarge commodity aggregates, whereas the WTO regulations applyto specific products, which makes it difficult to draw a conclusionfrom the model results in this respect. Moreover, the final condi-tions for the enlargement also very much depend on negotiationsbetween the EU-15, the new members, and their WTO partners.
Figure 2 provides the changes in net trade in CEEC-7 due toan EU integration under the slow-growth scenarios. Nongraincrops and meat products gain a significant trade surplus in thecase of partial liberalization of the CAP, whereas the balance forother food products deteriorates. Complete liberalization only

IMPLICATIONS OF AN EU EASTERN ENLARGEMENT 679
Figure 2. Changes in trade balance in CEEC-7 after EU integration in 2005under the slow growth scenarios (in Mill. 1992 ECU).
improves the net trade position in manufactures, while the totaltrade balance hardly changes at all.
By looking at changes in bilateral trade flows (Table 8) we areable to analyze trade creation and trade diversion effects that canbe expected from EU enlargement, for example, a shift in tradefrom the East (i.e., Former Soviet Union) to the West (i.e., EU-15). Considerable trade creation occurs within the new EU-22 inall sectors, especially in scenario plib_s imports in food productsfrom EU-15 to CEEC-7 increase heavily (114%). Furthermore,imports in nonagricultural sectors into CEEC-7 are increased fromall regions. On the other hand, agriculture and food imports fromthird countries into CEEC-7 are reduced (e.g., 217% from FSU).The latter is clearly a trade diversion effect.
Under a completely liberalized CAP (lib_s) trade creation ef-fects can be observed as more agriculture and food products areimported by the CEEC-7 from all model regions. Imports in othersectors also increase, but at smaller rates.
Table 9 shows the percentage changes in output for theCEEC-7 as a consequence of EU integration in the year 2005.The relative changes do hardly differ between the scenarios withslow and fast growth. However, in terms of absolute changes thereare differences between these scenarios because the enlargementoccurs at different GDP levels.

680 C. A. Herok and H. Lotze
Table 8: Changes in Bilateral Trade Flows After EU Enlargement in 2005Under the Slow Growth Scenarios (in Percent)
to
from EU-15 CEEC-7 FSU ROW
plib_sAgriculture/food EU-15 22.8 113.6 0.2 20.1Other sectors 20.7 18.5 0.5 20.2Agriculture/food CEEC-7 89.6 65.4 20.6 7.8Other sectors 29.5 3.1 25.4 25.1Agriculture/food FSU 22.3 217.1 22.5 20.3Other sectors 20.9 8.1 0.8 20.9Agriculture/food ROW 21.8 27.7 0.4 1.0Other sectors 20.5 6.0 0.8 0.0
lib_sAgriculture/food EU-15 0.1 47.6 0.3 20.2Other sectors 20.8 16.8 0.3 20.2Agriculture/food CEEC-7 21.0 47.4 2.1 0.1Other sectors 35.0 7.1 21.1 21.2Agriculture/food FSU 20.5 14.5 20.2 20.7Other sectors 21.0 7.4 0.5 20.9Agriculture/food ROW 0.2 16.7 0.1 20.6Other sectors 20.6 4.5 0.6 0.1
Source: own calculations.
Under partial liberalization output strongly increases in non-grain crops and meat products due to higher protection levels.Milk production does not change because the quota level wasfixed at the preenlargement quantity. Production of other foodproducts falls because border protection is reduced and more isimported from the old EU-15. Integration under partial liberaliza-tion of the CAP increases GDP in CEEC-7 by about 3.5 percent.
Table 9: Changes in Output in CEEC-7 After EU Integration in 2005(in Percent)
wht gro ngc olp met mil ofp mnfcs svces opp
plib_s 22.3 25.6 15.6 2.2 11.4 0.0 214.9 1.7 20.7 27.0plib_f 22.1 24.9 17.5 2.7 13.0 0.0 213.8 1.2 20.8 26.5lib_s 21.7 23.0 21.9 22.1 25.9 0.8 27.4 4.3 20.6 23.9lib_f 21.8 22.7 21.5 22.0 26.0 0.6 26.8 3.7 20.7 23.5
Source: own calculations.
IMPLICATIONS OF AN EU EASTERN ENLARGEMENT 681
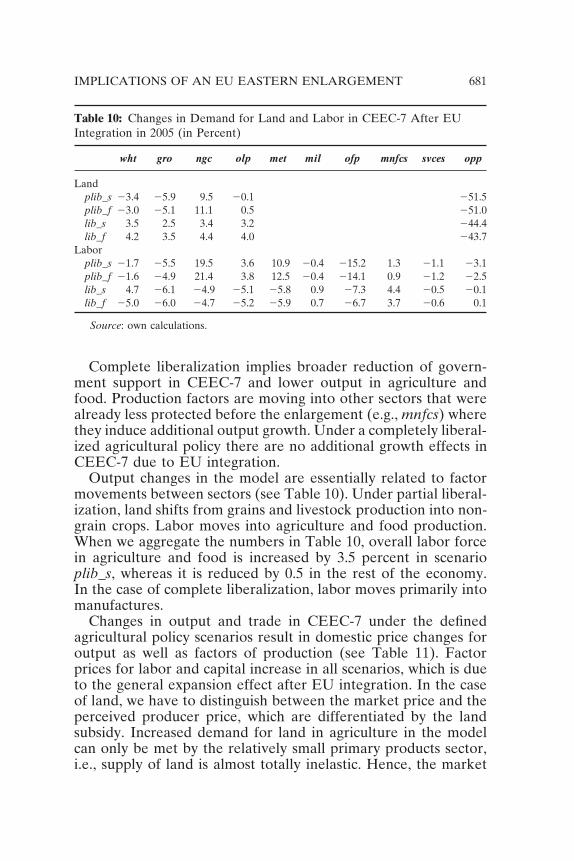
Table 10: Changes in Demand for Land and Labor in CEEC-7 After EUIntegration in 2005 (in Percent)
wht gro ngc olp met mil ofp mnfcs svces opp
Landplib_s 23.4 25.9 9.5 20.1 251.5plib_f 23.0 25.1 11.1 0.5 251.0lib_s 3.5 2.5 3.4 3.2 244.4lib_f 4.2 3.5 4.4 4.0 243.7
Laborplib_s 21.7 25.5 19.5 3.6 10.9 20.4 215.2 1.3 21.1 23.1plib_f 21.6 24.9 21.4 3.8 12.5 20.4 214.1 0.9 21.2 22.5lib_s 4.7 26.1 24.9 25.1 25.8 0.9 27.3 4.4 20.5 20.1lib_f 25.0 26.0 24.7 25.2 25.9 0.7 26.7 3.7 20.6 0.1
Source: own calculations.
Complete liberalization implies broader reduction of govern-ment support in CEEC-7 and lower output in agriculture andfood. Production factors are moving into other sectors that werealready less protected before the enlargement (e.g., mnfcs) wherethey induce additional output growth. Under a completely liberal-ized agricultural policy there are no additional growth effects inCEEC-7 due to EU integration.
Output changes in the model are essentially related to factormovements between sectors (see Table 10). Under partial liberal-ization, land shifts from grains and livestock production into non-grain crops. Labor moves into agriculture and food production.When we aggregate the numbers in Table 10, overall labor forcein agriculture and food is increased by 3.5 percent in scenarioplib_s, whereas it is reduced by 0.5 in the rest of the economy.In the case of complete liberalization, labor moves primarily intomanufactures.
Changes in output and trade in CEEC-7 under the definedagricultural policy scenarios result in domestic price changes foroutput as well as factors of production (see Table 11). Factorprices for labor and capital increase in all scenarios, which is dueto the general expansion effect after EU integration. In the caseof land, we have to distinguish between the market price and theperceived producer price, which are differentiated by the landsubsidy. Increased demand for land in agriculture in the modelcan only be met by the relatively small primary products sector,i.e., supply of land is almost totally inelastic. Hence, the market

682 C. A. Herok and H. Lotze
Table 11: Changes in Domestic Output Prices and Factor Prices in CEEC-7After EU Integration in 2005 (in Percent)
plib_s plib_f lib_s lib_f
Land (market price) 337.8 333.4 240.1 232.4Land (producer price) 14.1 14.3 212.2 213.4Labor 3.0 3.1 1.9 2.1Capital 2.2 2.4 2.1 2.3wht 4.0 4.0 21.8 21.7gro 3.0 3.1 22.3 22.1ngc 7.5 7.5 22.4 22.3olp 5.5 5.6 22.1 21.8met 17.3 17.4 5.6 5.9mil 62.9 64.6 20.7 20.5ofp 19.1 19.4 0.9 1.2mnfcs 1.1 1.3 0.1 0.4svces 2.2 2.4 1.1 1.3opp 4.9 5.1 3.4 3.6
Source: own calculations.
price for land increases heavily in all scenarios. Because of a risingvalue marginal product for land, and despite the land subsidy, theproducer price for land also rises by about 14 percent under apartially liberalized CAP. Under complete liberalization the pro-ducer price for land falls. Heavily increasing land prices indicatethat a significant share of the subsidy is transferred to land owners.Because land is not yet fully privatized in most transition countries,it is not clear who would ultimately benefit from this policy.
In the plib scenarios, output prices for processed food increasesignificantly. The strong price increase for milk products of morethan 60 percent is caused by the introduction of a quota restrictiontogether with increased border protection. Although producersclearly benefit from these changes, consumer welfare is negativelyeffected. This could be especially important in transition countrieswhere the food share in household expenditure is currently stillhigh. However, after significant economic growth in the preen-largement period expenditure shares might have adjusted down-ward to EU-15 levels. Under complete liberalization prices formost agricultural and food products, except for meat products,fall in CEEC-7.
Finally the resulting changes in welfare and budget expenditureswill be discussed. Welfare changes for all model regions are given

IMPLICATIONS OF AN EU EASTERN ENLARGEMENT 683
Table 12: Welfare Changes Due to an EU Enlargement in 2005 Under VariousPolicy Scenarios (Equivalent Variation in Million 1992 ECU)
plib_s plib_f lib_s lib_f
EU-15 840 673 1,189 1,446CEEC-7 654 1,215 67 236Australia/New Zealand 270 288 12 17Canada 28 28 29 212USA 2148 2190 2142 2202Japan 2204 2275 2321 2469Former Soviet Union 195 286 185 260Asia 2621 2815 2676 2941Rest of the World 2395 2535 2157 2243World Total 243 263 147 91
Source: own calculations.
in Table 12 measured as the equivalent variation in million 1992ECU.13 The EU-15 benefits more from the enlargement aftercomplete liberalization of the CAP, whereas the CEEC-7 gainmost after partial liberalization and fast growth. The other regionsin the model, except the Former Soviet Union, lose in all scenarios,which is mainly due to trade diversion effects of the EU integra-tion. While EU-15 and CEEC-7 abolish their internal trade barri-ers,14 all other regions leave existing protection unchanged. Hence,they participate less from rising output and trade in CEEC-7. Theoverall global welfare increase is negligible. However, we have tokeep in mind that the numbers in Table 12 are pure effects ofthe EU enlargement. If welfare increases from the developmentperiod up to 2005 are taken into account, the world as a wholeis better off under a complete liberalization of the CAP.15 In thiscase, EU enlargement occurs at a higher welfare level; therefore,the additional welfare gain from the integration itself is smaller.
13 The equivalent variation is derived from the regional per-capita utility function inthe GTAP model (see Hertel, 1997, p. 35).
14 Under a complete liberalization, of course, all external barriers in agriculture andfood are also reduced.
15 Hertel et al. (1997) calculate welfare gains from an EU Eastern enlargement that aremuch higher than the results in this paper. This is due to their assumption that in thecourse of EU integration productivity gains could be achieved in CEEC-7. Here, we firstmodeled a development period with different rates of productivity growth up to 2005, andthe enlargement effects only include the pure gains from trade.

684 C. A. Herok and H. Lotze
Nevertheless, the welfare gains calculated here are only part ofthe story. There is more to be expected than simply the static gainsfrom trade. It can be concluded from other studies on regionalintegration (e.g., Baldwin and Venables, 1995; Baldwin and Fran-cois, 1996) that the new EU members will experience gains fromeconomies of scale and increased competition as well as increasedcapital accumulation in the long run due to increased politicalstability. Baldwin and Francois (1996) conclude for an EU integra-tion of the CEEC-7 that the static trade effects are overwhelmedby the more dynamic effects in the longer run.
To provide a statement on the budgetary effects of EU enlarge-ment we have to do some side calculations because the standardversion of the GTAP model does not single out budget expendi-tures and revenues. Besides, the absolute values of all subsidyequivalents in the GTAP database do not necessarily correspondto EU budget statistics, as the GTAP protection data also include“dirty protection measures” such as quantitative restrictions andnon-tariff barriers.16 Hence, we take the official data on the EUbudget in 1996 as a base and apply only the relative changes inthe value of protection from the model calculations. The amountpaid for land subsidies is calculated as 75 percent of the value ofagricultural land for the EU-15 in 1996 and for CEEC-7 in 2005.The results are shown in Table 13.
The sum of direct payments, export subsidies, import tariffs,and factor subsidies for the EU-15 is reduced by about 18 percentafter partial CAP liberalization and by 34 percent after completeliberalization. With respect to changes in other expenditures, forexample, guidance funds and accompanying measures, we haveto make some additional assumptions, especially in the case ofcomplete liberalization. Even in these scenarios it seems unrealis-tic that expenditures on structural funds will be completely re-moved. The assumptions are partly taken from Kirschke et al.(1997). When we look at the total budget, the savings under thevarious policy scenarios are even more pronounced.
In CEEC-7, the introduction of a land subsidy together withchanges in border protection after EU integration adds up to
16 Brockmeier et al. (1996) add the EU budget as a seperate entity to the model. Yetanother problem arises, as all non-tariff barriers are converted into tariff equivalents inthe GTAP data base (see Ingco, 1997). Taking the sum of all tariff equivalents in the EU-15 as a proxy for EU budget revenue yields a much higher value than actually reportedin EU statistics.

IMPLICATIONS OF AN EU EASTERN ENLARGEMENT 685
Table 13: Budget Effects of an EU Enlargement in 2005 Under Various PolicyScenarios (in Mill. 1992 ECU)
1996 plib_s plib_f lib_s lib_f
EU-15Direct payments1 18,677Export subsidies 7,060 5,385 5,299Import tariffs 2864 21,401 21,362Land subsidies 16,511 16,511 16,511 16,511Subtotal 24,873 20,495 20,448 16,511 16,511Other expenditures2 19,174 17,257 17,257 8,3004 8,3004
Other revenues3 21,287 2644 2644Total 42,760 37,108 37,061 24,811 24,811
CEEC-7Output subsidies 104Export subsidies 853 1,180Import tariffs 2768 2591 2660Land subsidies 5,837 6,884 5,837 6,884Subtotal 2665 6,098 7,404 5,837 6,884Other expenditures2 n.a. n.a. n.a. n.a. n.a.Other revenues3 n.a. n.a. n.a. n.a. n.a.Total 2665 6,098 7,404 5,837 6,884Contribution to EU budget5 1,454 2,038 1,407 1,979Net transfer from EU-15 4,645 5,366 4,430 4,906
1 Compensation, set-aside, and animal payments from the 1992 CAP reform.2 Market intervention, guidance funds, food aid refunds, accompanying measures; not
available for CEEC-7.3 Sugar levies; not available for CEEC-7.4 Under complete liberalization “other expenditures” are defined as guidance funds
and minimum intervention stocks.5 Calculated as 0.65 percent of regional GDP.
Source: Kirschke et al., 1997; EU Commission 1997c; own calculations.
budget expenditures between 5.8 and 7.4 billion 1992 ECU. Inthe model, all subsidy payments within a region have to be paidby the regional household itself, with negative consequences forregional welfare. However, it is most likely that the new membersfrom CEEC-7 will be net recipients in a new EU-22 for sometime. Most of the support payments under the CAP will be paidout of the EU budget. The budget contribution of the new mem-bers can be calculated as 0.65 percent of GDP.17 The bottom line
17 See Frandsen et al. (1996, p. 15): total budget contribution of any member state isabout 1.3 percent of GDP, while about half of the budget can be assigned to agricultureand food.

686 C. A. Herok and H. Lotze
in Table 13 provides the calculated transfer from the EU budgetto CEEC-7 net of their own contribution. We must consider,though, that these budget expenditures do not represent the “totalcost of enlargement” from the EU perspective, because they onlyinclude direct protection measures. Structural aid and generalsupport for CEEC-7, which are already proposed in the “Agenda2000” (EU Commission, 1997a), will significantly increase EUbudget expenditures during the enlargement process. If we addup the welfare increase from Table 12 and the direct budgettransfers from EU-15, the total gain in CEEC-7 from the enlarge-ment in 2005 is between 1.7 percent (lib_f) and 2.4 percent ofGDP (plib_s).
5. SUMMARY AND OUTLOOK
In this paper we use the GTAP applied general equilibriummodel for simulating the integration of seven Central and EastEuropean countries into the EU in 2005. The Common Agricul-tural Policy is modified by introducing a uniform subsidy on ag-ricultural land that is currently discussed among other proposals.The land subsidy is transferred to the new members only in relativeterms according to local price levels. Moreover, despite consider-able uncertainty, we simulate two different paths up to the year2005 within the modeling framework.
Welfare gains from EU enlargement are mainly due to tradecreation within a new EU-22. Under partial liberalization domesticprices in CEEC-7 rise, labor and land are drawn into agricultureand food production and, hence, output and exports increase inthese sectors. Domestic welfare in CEEC-7 rises by about 2 per-cent of GDP at preenlargement levels. This includes budget trans-fers from EU-15, which amount to about 5 billion ECU. Despitethese increased expenditures the total agricultural budget of theEU-15 does not rise, due to savings as a result of agriculturalpolicy reform. Not included in the budget expenditures are struc-tural funds and general support measures because they are cur-rently difficult to forecast. Due to trade diversion, most otherregions in the model lose after an EU enlargement.
Under complete liberalization of the CAP output in agricultureand food in CEEC-7 declines after EU integration. Labor movesout of these sectors into manufactures, where output increasesand the trade balance improves significantly. The overall welfaregain in CEEC-7 from enlargement is slightly less than under partial

IMPLICATIONS OF AN EU EASTERN ENLARGEMENT 687
liberalization, and in this case it is almost completely due to EUbudget transfers related to the land subsidy. Nevertheless, expen-ditures under the CAP are heavily reduced, which would provideroom for more general structural aid for the new members. Al-though the direct welfare gains from EU integration are largerunder a partially liberalized CAP, in the case of complete liberal-ization the CEEC-7 are able to grow faster prior to EU enlarge-ment and the combined effects outweigh the partial liberalizationresults.
While interpreting the calculated effects of an EU enlargementwe have to keep in mind that the model results crucially dependon the underlying assumptions with regard to agricultural policies,the general economic development up to the date of enlargement,as well as indirect effects of the EU integration like productivityshifts, investment incentives, and changes in the policy environ-ment. Furthermore, endogenizing dynamic effects like interre-gional capital flows within the model would also change the results.
With regard to political viability, it is quite clear in view of the“Agenda 2000” that a partial liberalization scenario seems to bea more realistic option in the near future. However, the proposedpolicy changes might not be “green box” compatible, and theymight not be sufficient for the CEEC-7 to meet their WTO obliga-tions. A uniform payment on agricultural land would be less mar-ket distorting than product-related compensation payments, andthey are likely to lower administrative expenses related to agricul-tural policies. This would probably improve the position of theEU in future WTO negotiations on agricultural and food products.However, new distortions on factor markets due to the land sub-sidy cannot be ruled out. Depending on the design of the payment,a considerable part of the subsidy might be transferred to thefactor owners. This effect is questionable because a major policyobjective of the CAP still is income support to active farmers.
There are certainly limits to the model in the current verison.Changes in the CAP and effects of the EU enlargement are ana-lyzed on a highly aggregated level. Consideration of product-specific aspects is only possible to a limited extent. Wider productdisaggregation, especially in agriculture and food, would certainlybe desirable.18 As far as regional aggregation is concerned, the
18 This could be an argument in favor of partial equilibrium modeling where singleproducts are usually covered in more detail. But the version 4 of the GTAP database alsoprovides more detail with respect to agricultural commodities and processed goods (E-mail information from the Center of Global Trade Analysis, Purdue University, Ithaka).

688 C. A. Herok and H. Lotze
group of CEEC-7 does not consist of homogeneous countries. Onthe contrary, in many aspects they are very diverse, but this hasto be neglected as long as the group is treated as a single regionin the model. Data availability puts serious constraints to anyempirical modeling exercise in transition economies. The GTAPdatabase, although probably a collection of the best informationavailable, still has deficiencies regarding countries in Central andEastern Europe and the former Soviet Union. This should be keptin mind when the model results are interpreted.
One of the core assumptions of our model are well-functioningmarkets in all sectors and regions. This is certainly not always thecase in the CEEC-7 and even less in the Former Soviet Union atthis point. Extensions of the model used in other studies includethe implementation of monopolistic competition, imperfect factormarkets, and dynamics. There is plenty of scope for modeling thesituation in transition countries more realistically in the future.
REFERENCESAgra Europe. (1997) Brusseler Prognosen fur die EU-Agrarmarkte eroffnen die Reformde-
batte. Bonn: Anonymous, vol. 17/97, pp. E1–E7.Anderson, K., and Tyers, R. (1995) Implications of EU Expansion for European Agricul-
ture, Policies, Trade and Welfare. In: Expanding Membership of the EuropeanUnion. Baldwin, R.E., Haaparanta, P.J., and Kiander, J. (eds.). Cambridge, UK:Cambridge University Press.
Armington, P.A. (1969). A Theory of Demand for Products Distinguished by Place ofProduction. IMF Staff Papers (16), S. 159–178. Washington, DC.
Baldwin, R.E., and Francois, J.F. (1996) Scale Economies, Imperfect Competition, andthe Eastern Expansion of the EU. Paper presented at the 50th EAAE Seminar.October 15–17. Giessen.
Baldwin, R.E., and Venables, A.J. (1995) Regional Economic Integration. In Handbookof International Economics (Grossman, G.M., and Rogoff, K., Eds.). Amsterdam:North-Holland.
Banse, M., and Munch, W. (1997) Auswirkungen eines EU-Beitritts der Visegrad-Staaten.Eine Partielle und Allgemeine Gleichgewichtsanalyse. Paper presented at the An-nual Meeting of the German Association of Agricultural Economists (GEWI-SOLA). October 6–8. Munchen.
Brockmeier, M., Hertel, T.W., and Swaminathan, P.V. (1996) Integration of the CentralEuropean Economies into the European Union. Paper presented at the 50th EAAESeminar. October 15–17. Giessen.
European Commission. (1995): Agricultural Situation and Prospects in the CEEC. Sum-mary Report. DG VI. Brussels.
European Commission. (1997a) Agenda 2000. DOC/97/6, Brussels.European Commission. (1997b) Long term prospects—Grains, milk and meat products.
CAP 2000 Working document. Brussels.

IMPLICATIONS OF AN EU EASTERN ENLARGEMENT 689
European Commission. (1997c) The situation of agriculture in the European Union. Brus-sels.
Frandsen, S.E., Bach, C.F., and Stephensen, P. (1996) European Integration and theCommon Agricultural Policy: A CGE Multi Regional Analysis for the CentralEuropean Countries and Denmark. Paper presented at the 50th EAAE Seminar.October 15–17. Giessen.
Gehlhar, M.J., Hertel, T.W., and Martin, W. (1994) Economic Growth and the ChangingStructure of Trade and Production in the Pacific Rim. American Journal of Agricul-tural Economics, 76:1101–1110.
Harrison, W.J., and Pearson, K.R. (1996) Computing Solutions for Large General Equilib-rium Models using GEMPACK. Computational Economics, 9:83–127.
Herok, C.A., and Lotze, H. (1997) Neue Wege der Gemeinsamen Agrarpolitik: Handelsef-fekte und gesamtwirtschaftliche Auswirkungen. Agrarwirtschaft 46:257–264.
Hertel, T.W. (Ed.) (1997) Global Trade Analysis: Modeling and Applications. Cambridge,UK: Cambridge University Press.
Hertel, T.W., Masters, W.A., and Gehlhar, M.J. (1997) Regionalism in World Food Mar-kets: Implications for Trade and Welfare. Paper presented at the XXIII. Interna-tional Conference of Agricultural Economists. August 10–16. Sacramento.
Ingco, M. (1997) Agricultural protection. In: Global Trade, Assistance, and Protection:The GTAP 3 Data Base (McDougall, R.A., Ed.). Perdue: Center for Global TradeAnalysis, Purdue University.
International Agricultural Trade Research Consortium (IATRC). (1994) The UruguayRound Agreement on Agriculture: An Evaluation. Commissioned Paper No. 9.Minnesota.
Kirschke, D., Hagedorn, K., Odening, M., and von Witzke, H. (1997) Optionen fur dieWeiterentwicklung der EU-Agrarpolitik. Kiel: Vauk.
Kirschke, D., Odening, M., Doluschitz, R., Fock, T., Hagedorn, K., Rost, D., and vonWitzke, H. (1998) Untersuchungen zur Weiterentwicklung der EU-Agrarpolitik ausSicht der neuen Bundeslander. Kiel: Vauk.
Mahe, L.P., Cordier, J., Guyomard, H., and Roe, T. (1995) L’Agriculture et l’elargissementde l’Union europeene aux pays d’Europe centrale et orientale: Transition en vuede l’integration ou l’integration pour la transition? Study for DG I of the EuropeanCommission. Brussels.
McDougall, R.A. (1997) Global Trade, Assistance, and Protection: The GTAP 3 Data Base.Perdue: Center for Global Trade Analysis. Purdue University.
OECD. (1996) Agricultural Policies, Market and Trade in Transition Economies, Monitor-ing and Evaluation. Paris: OECD.
Ryan, M., and Jones, W. (1997) Globalisation of the Food Industry in Central and EasternEurope. In Globalisation of the Food Industry: Policy Implications. ConferenceProceedings. Loader, R.J., Henson, S.J., and Traill, W.B. (Eds.). Reading, UK:University of Reading.
Swaminathan, P.V. (1997) Regional Integration in the Presence of Monopolistic Competi-tion: Implications for enlarging the European Union. Ph.D. Dissertation. Depart-ment of Agricultural Economics. Purdue University.
Tangermann, S., Josling, T.E., and Munch, W. (1994) Pre-accession agricultural policiesfor central Europe and the European Union. Study for DG I of the EuropeanCommission. Brussels.
Twesten, H. (1997) Implikationen der WTO-Verpflichtungen der Visegrad-Staaten furden Beitritt zur Europaischen Union. Paper presented at the Annual Meeting of

690 C. A. Herok and H. Lotze
the German Association of Agricultural Economists (GEWISOLA). Munchen,October 6–8.
Uhlmann, F. (1996) Die Markte Fur Getreide, Olsaaten und Kartoffeln. Agrarwirtschaft45:18–39.
United States Department of Agriculture (USDA). (1997a) International AgriculturalTrade: Europe. WRS-97-5, December. Washington, DC.
United States Department of Agriculture (USDA). (1997b) International AgriculturalBaseline Projections to 2005. Washington, DC.
Wissenschaftlicher Beirat Beim Bundesministerium Fur Ernahrung, Landwirtschaft undForsten (Wiss. Beirat). (1997) Zur Weiterentwicklung der EU-Agrarreform. An-gewandte Wissenschaft. Heft 459. Bonn.
World Bank. (1996) World Development Report 1996. From Plan to Market. Washing-ton, DC.