eastern pennsylvania: implications for the tectonic
TRANSCRIPT

JOURNAL OF GEOPHYSICAL RESEARCH, VOL. 91, NO. B12, PAGES 12,791-12,803, NOVEMBER 10, 1986
SYNFOLDING AND PREFOLDINGMAGNETIZATIONS IN THE UPPER DEVONIAN CATSKILL FORMATION OF
EASTERN PENNSYLVANIA: IMPLICATIONS FOR THE TECTONIC HISTORY OF ACADIA
John D. Miller and Dennis V. Kent
Lamont-Doherty Geological Observatory and Department of Geological Sciences, Columbia University, Palisades, New York
Abstract. The Upper Devonian Catskill Formation was sampled for paleomagnetic study in east-central Pennsylvania (41øN, 76øW). In one area the dominant component of magnetization (SE) is revealed over a broad spectrum of demagnetization temperatures ranging to at least 660øC. A conventional fold test is positive at the 99% confidence level. However, statistical analysis of dispersion with incremental bedding tilt correction shows a significant peak in the precision parameter after about 3/4 unfolding. The magnetization is therefore secondary, with a mean direction of D = 166.6 ø , I = -1.8 ø. The corresponding pole position (48.1øN, 124.1øE, a95 = 4.0 ø) is indistinguishable from paleopoles from earlier studies of the Catskill, which therefore can also be regarded as representing Pertoo- Carboniferous remagnetizations. A second component of magnetization (SW, pole position 32 8øN, 90 0øE a95 = 7 2 ø) with discrete unblocking temperature spectra and southwesterly declination was isolated in a few samples from the first area and in most samples from a second area. A prefolding origin of this magnetization is supported by a positive fold test on five samples from the first area. If this magnetization does represent a Devonian magnetization then the true paleolatitude for east-central Pennsylvania is 16 ø +/-7 2øS which is consistent with the paleolatitude observed in many of the Upper Devonian rock units in the Acadia region, although inconsistent with others. The question of the position of Acadia relative to North America in the Upper Devonian is therefore still open.
Introduct ion
Until recently, most paleomagnetic results from Permian, Carboniferous, and Devonian cratonic rock units of North America have been
interpreted to indicate low paleolatitudes. In contrast, results from the Acadia region (coastal New England-Maritime Canada) for the Devonian and lower Carboniferous consistently place this area some 20 ø south of cratonic North America. These
observations have led to two basic hypotheses. The first is that Acadia was in fact located to the south of North America in the Devonian and
Early Carboniferous and then moved to its present location with respect to the continent by the Late Carboniferous [Kent and Opdyke, 1978, 1979; Van der Voo et al., 1979; Irving, 1979]. The second hypothesis is that the similarity in Devonian through Permian cratonic pole positions resulted from remagnetization in the Permian
Copyright 1986 by the American Geophysical Union.
Paper number 6B5921. 0148-0227 / 86/006B-5921 $05.00
during the long, reversed polarity Kiaman superchron [Roy and Morris, 1983; Irving and Strong, 1984, 1985]. According to this hypothesis, the relative position of Acadia with respect to North America could not be determined for the Carboniferous or the Devonian because the
relevant cratonic pole positions are masked by the Permian overprint.
Two critical studies of cratonic units were on
the lower Carboniferous Mauch Chunk [Knowles and Opdyke, 1968] and on the Upper Devonian Catskill [Van der Voo et al., 1979] formations. Both of these studies reported near-equatorial paleolatitudes, normal and reversed polarity directions, and positive fold tests. Other studies of rock units with lower Carboniferous
and Upper Devonian ages generally report similar near equatorial paleolatitudes but lack normal polarity samples and/or field stability tests. The Mauch Chunk Formation has recently been restudied from the same outcrop area as the earlier study [Kent and Opdyke, 1985]. It was shown that the earlier study failed to isolate all of the components of magnetization. The magnetization of the Mauch Chunk is actually a composite of an intermediate to high unblocking temperature synfolding magnetization and a very high unblocking temperature prefolding magnetization. The dominant synfolding magnetization is late Carboniferous to Early Permian in age. The prefolding or characteristic magnetization reveals a more southerly paleolatitude and is in agreement with lower Carboniferous results from Acadia.
The results from the Mauch Chunk make it
imperative that all the components of magnetization in the Catskill be isolated. The present study was designed to test whether the magnetization of the Catskill is a single component as reported by Kent and Opdyke [1978] and Van der Voo et al. [1979] or if multiple components of magnetization representing a Permian remagnetization and an older, po&sibly primary, magnetization exist in the Catskill, as was found in the Mauch Chunk.
Geologic Setting
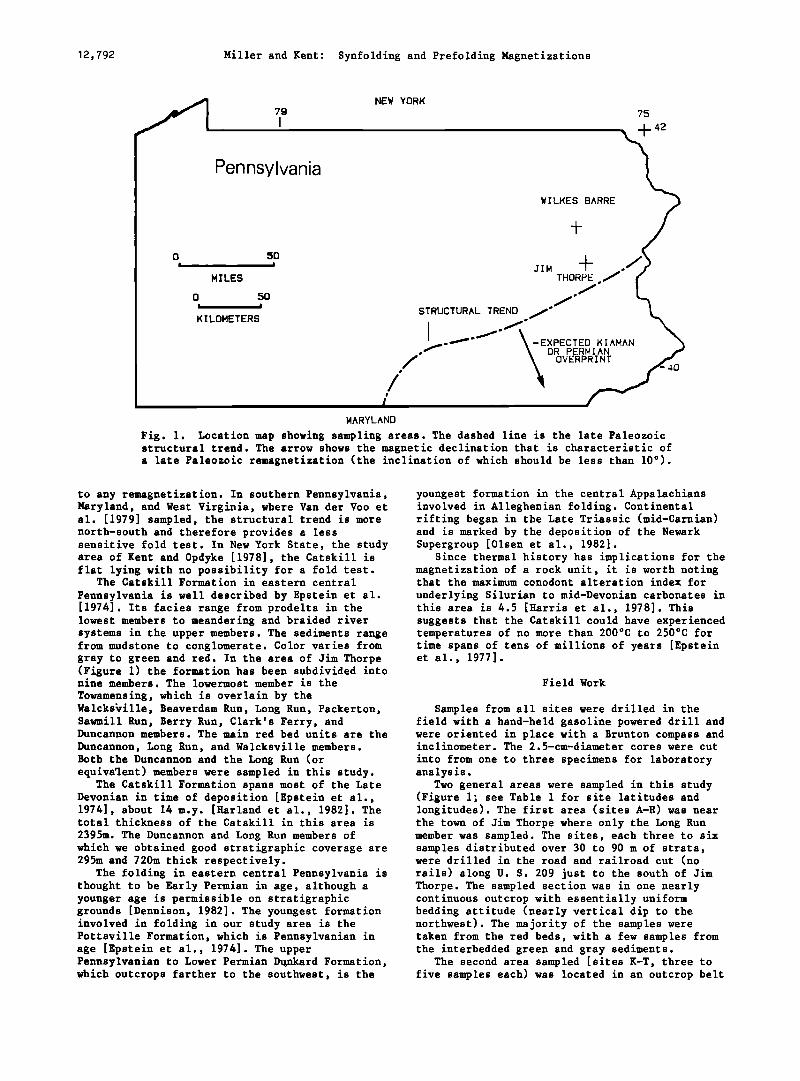
We chose to investigate the Catskill Formation in eastern central Pennsylvania because of the favorable fold geometry for a fold test and because the study of the Upper Silurian Bloomsburg Formation [Roy et al., 1967] suggests that remagnetization problems may be less severe in this part of the Appalachians. The expected declination for a Kiaman or Permian overprint is between 160 ø and 170 ø with a very shallow inclination (Figure 1). The bedding strikes of the sampled sites in this study are at a high angle to the expected Kiaman overprint and as such allow for a fold test that is very sensitive
12,791
12,792 Miller and Kent: Synfolding and Prefolding Magnetizations
?9
Pennsylvania
MILES
0 50
KILOMETERS
5O
NEW YORK
75
WILKE•BARRE + ./>
THORPE
STRUCTURAL TREND
i , HARYLAND
Fiõ. 1. •.oc•tion m• s5o•in• s•m•li•õ •re•s. •Se •sSe• li•e is tSe l•te P•leo•.oic structural tre•. •Se •rro• s5o•s tSe maõ•etic •ecli•tio• tS•t is cS•r•cteristic of • l•te P•leo•.oic rem•õ•eti•tio• (tSe inclination of •Sic• s5o•l• be less tS• 10ø).
to any remagnetization. In southern Pennsylvania, Maryland, and West Virginia, where Van der Voo et al. [1979] sampled, the structural trend is more north-south and therefore provides a less sensitive fold test. In New York State, the study area of Kent and Opdyke [1978], the Catskill is flat lying with no possibility for a fold test.
The Catskill Formation in eastern central
Pennsylvania is well described by Epstein et al. [1974]. Its facies range from prodelta in the lowest members to meandering and braided river systems in the upper members. The sediments range from mudstone to conglomerate. Color varies from gray to green and red. In the area of Jim Thorpe (Figure 1) the formation has been subdivided into nine members. The lowermost member is the Towamensing, which is overlain by the Walcks•ille, Beaverdam Run, Long Run, Packerton, Sawmill Run, Berry Run, Clark's Ferry, and Duncannon members. The main red bed units are the
Duncannon, Long Run, and Walcksville members. Both the Duncannon and the Long Run (or equivaHent) members were sampled in this study.
The Catskill Formation spans most of the Late Devonian in time of deposition [Epstein et al., 1974], about 14 m.y. [Harland et al., 1982]. The total thickness of the Catskill in this area is
2395m. The Duncannon and Long Run members of which we obtained good stratigraphic coverage are 295m and 720m thick respectively.
The folding in eastern central Pennsylvania is thought to be Early Permian in age, although a younger age is permissible on stratigraphic grounds [Dennison, 1982]. The youngest formation involved in folding in our study area is the Pottsville Formation, which is Pennsylvanian in age [Epstein et al., 1974]. The upper Pennsylvanian to Lower Permian D•nkard Formation, which outcrops farther to the southwest, is the
youngest formation in the central Appalachians involved in Alleghenian folding. Continental rifting began in the Late Triassic (mid-Carnian) and is marked by the deposition of the Newark Supergroup [Olsen et al., 1982].
Since thermal history has implications for the magnetization of a rock unit, it is worth noting that the maximum conodont alteration index for
underlying Silurian to mid-Devonian carbonates in this area is 4.5 [Harris et al., 1978]. This suggests that the Catskill could have experienced temperatures of no more than 200øC to 250øC for time spans of tens of millions of years [Epstein et al., 1977].
Field Work
Samples from all sites were drilled in the field with a hand-held gasoline powered drill and were oriented in place with a Brunton compass and inclinometer. The 2.5-cm-diameter cores were cut
into from one to three specimens for laboratory analysis.
Two general areas were sampled in this study (Figure 1; see Table 1 for site latitudes and longitudes). The first area (sites A-H) was near the town of Jim Thorpe where only the Long Run member was sampled. The sites, each three to six samples distributed over 30 to 90 m of strata, were drilled in the road and railroad cut (no rails) along U.S. 209 just to the south of Jim Thorpe. The sampled section was in one nearly continuous outcrop with essentially uniform bedding attitude (nearly vertical dip to the northwest). The majority of the samples were taken from the red beds, with a few samples from the interbedded green and gray sediments.
The second area sampled [sites K-T, three to five samples each) was located in an outcrop belt

Miller and Kent: Synfolding and Prefolding Magnetizations 12,793
TABLE 1. Site Locations and Bedding Orientations
Site Latitude, øN Longitude, øW Strike Dip
A-H 40.84 75.69 24 82 I 40.84 75.51 54 14 J 40.83 75.51 240 10 K 41.09 76.33 78 36 L 41.09 76.28 74 35 M 41.11 76.12 256 40 N 41.13 76.00 257 40 O-P 40.99 76.16 66 18
Q 40.99 76.16 65 24 R 40.99 76.16 74 53 S 41.06 75.95 63 17 T 41.15 75.92 259 41
Dip direction is 90 ø clockwise from strike.
between the towns of Bloomsburg and Wilkes-Barre. Sites L, M, N, S, and T were drilled in the Duncannon member. Sites K, O, P, Q, and R were drilled in the Sherman Creek member, which is correlatable to the Long Run member [Berg et al., 1980]. Sites were occupied with both northwest and southeast dip directions, allowing for application of fold tests.
Laboratory Procedures
Measurements were made on both a two-axis
cryogenic [Goree and Fuller, 1976] magnetometer and a computerized flux gate spinner [Molyneaux, 1972] magnetometer. Most samples were thermally demagnetized in a minimum of 10 steps, and the susceptibility was measured after each step. Alternating field (AF) demagnetization proved ineffective in decomposing the natural reinanent magnetization (NRM) of the red bed samples and so was little used. Chemical demagnetization through acid leaching (6N or 12N HC1 in a low field space) was also performed in a minimum of 10 steps. Local mu-metal shielding was used throughout the demagnetization procedures to minimize ambient field contamination.
Demagnetization paths were plotted on Zijderveld [1967] diagrams, and magnetization directions were computed using principal component analysis [Kirschvink, 1980]. Unless otherwise specified, lines were not anchored to the origin. Mean directions and poles were calculated using standard Fisher [1953] statistics.
Experimental Results
Properties Common to Both Areas
Samples from the few green and gray beds that were sampled typically have low unblocking temperatures (below 300øC) and were easily demagnetized by alternating field treatment to 30roT. The magnetic direction is northwest in declination and steeply down in inclination, which is consistent with a present-day or Cretaceous remagnetization. Results from these beds will not be discussed further.
Thermal demagnetization of the red bed samples
shows that in most samples, unblocking of the NRM does not begin until between 300øC and 400øC, and some fraction of the NRM remains to above 650øC.
The resistance to AF demagnetization and the high unblocking temperatures clearly suggest hematite as the principal magnetic carrier.
The main problem in thermal demagnetization of samples from the Catskill Formation is that most samples undergo magnetochemical alteration at high temperatures. The alteration is best expressed by up to order of magnitude increases in magnetic susceptibility after heating between 600øC and 680øC (also noted by Kent and Opdyke [1978]. The alteration makes the samples highly susceptible to contamination by stray laboratory fields. The effects of the contamination are
quite apparent in the higher temperature portion of some of the demagnetization paths despite the use of local mu-metal shielding around the samples. For this reason, only the data points from demagnetization steps below the temperature where the susceptibility had increased by a factor of 2 tended to be used in the principal component analysis.
Sites A-H
The main component in samples from sites A-H has a southwesterly declination, with moderately negative inclinations before bedding tilt correction and moderately positive inclinations after tilt correction. This component we refer to as magnetization SWa. Component SWa is characterized by a very discrete unblocking temperature spectra. Often a large portion of the NRM is unblocked only in a narrow temperature band near 680øC (Figure 2a). For roughly half of the samples the NRM decays clearly to the origin. The remainder of the sample NRM's appear to have an additional very high unblocking temperature component which is poorly defined. In the sample demagnetization trajectories that appear to trend to a point slightly removed from the origin, any final component is difficult if not impossible to isolate because of the discrete nature of the
unblocking temperature spectra and because of the magnetochemical alteration. There is no significant difference between the mean sample directions defined by trajectories that clearly trend to the origin and those that do not.
Only two samples from sites A-H have thermal demagnetization paths that trend away from the origin and into the northern hemisphere. In neither sample is the final northerly component isolated directly. In one sample (Figure 2b) the final component appears to be essentially antiparallel to the SWa magnetization. In the other sample the two magnetizations are clearly not antiparallel.
The sample NRM's were stable in acid (Figure 2c), decaying only slowly. After over 2000 hours in acid, all samples were still easily measurable. The magnetizat ions revealed by chemical demagnetization are statistically indistinguishable from those found through thermal demagnetization. However, for reasons to be discussed later, the directions isolated through chemical demagnetization were excluded from calculation of the mean SWa magnetization direction.

12,794 Miller and Kent: Synfolding and Prefolding Magnetizations
400øC SAMPLE E5
r••500øC • •-•550 øc 648oc
632•C
S• " œ.
W, UP N. UP
'N 3N
= lxlO-3 A/M
684øC
SAMPLE F4
79øC
B
$.DN
ß - Ix10œ-3 A/M ; .
c
SAMPLE C4 W. UP
625HR / 1008HR J
E, DN
- lxlOE-3 A/M
W, UP
• SAMPLE M4 NRM •'• 500øC J
% 610øc /
630• •k.•.J 650 ø O 665 • C•,,•J 660øO
st • 622• C
E, DN
= lxlO-3 A/M
W. UP 680øC
SAMPLE L4 672 o//••• W. UP
E • ,• F sl • sF /•-/ - •
665ø0 68/.• 658ø0
NRM E, DN / ' = lxlO-3 A/M E, DN
= lxlO-4 A/M
Fig. 2. Typical thermal (øC) and chemical (HR) demagnetization Zijderveld diagrams. All plots are in in $itu coordinates. Open (star) symbols represent vertical (horizontal) components of vector end points. All other Zijderveld diagrams are plotted in this manner. (a) Typical thermal demagnetization for magnetization SWa (Jim Thorpe area). (b) The only sample to have present an obvious normal component that appears to be antiparallel to SWa (note the change in axes). (c) Typical chemical demagnetization for a sample from the Jim Thorpe area. (d) Demagnetization of a sample with magnetization SE (Wilkes-Barre area). (e and f) Samples with both magnetization SE (below 650•C) and magnetization SWb (Wilkes-Barre area).
Sites K-T
In contrast to magnetization SWa, the dominant component in sites K-T (magnetization SE) is to the southeast, is removed over a broad demagnetization temperature range, and in most samples appears to decay univectorially to the origin, by 660øC (Figure 2d). Some of the samples do have demagnetization paths that do not
converge to the origin but viscous effects clearly associated with enhanced susceptibility after demagnetization to high temperatures usually precluded isolation of any possible final component. The exceptions were five samples from sites K-T in which the susceptibility did not change appreciably during thermal treatment and the main SE magnetization trajectory misses the origin. A final discrete, high unblocking
Miller and Kent: Synfolding and Prefolding Magnetizations 12,795
NRM
SAMPLE 03 (THERMAL DEMAGNETIZATION)
550øC
400øC
22.5HR
O0øC 600øC 610øC
44HR
66HR
94HR
SAMPLE O1 (CHEMICAL DEMAGNETIZATION)
142HR
216HR
620øC
W, U• 658oC 640øC
630øC
672øC
$ N
E. ON
: : - 1>•10E-3
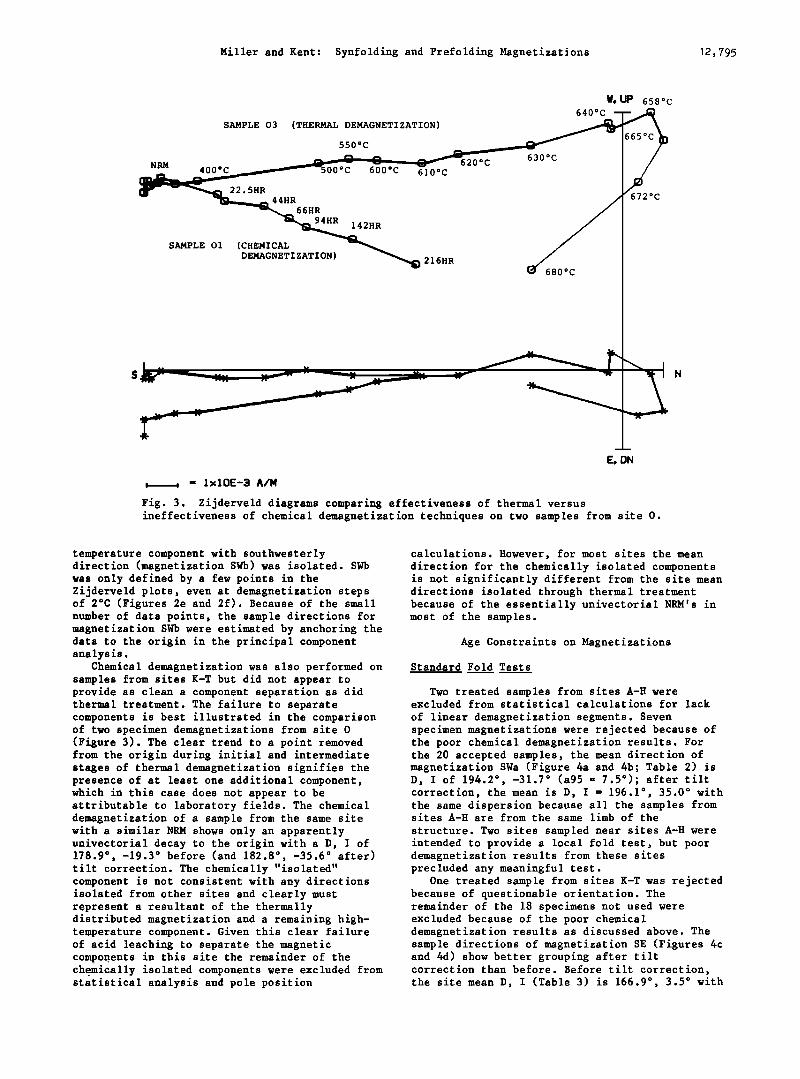
Fig. 3. Zijderveld diagrams comparing effectiveness of thermal versus ineffectiveness of chemical demagnetization techniques on two samples from site O.
temperature component with southwesterly direction (magnetization SWb) was isolated. SWb was only defined by a few points in the Zijderveld plots, even at demagnetization steps of 2øC (Figures 2e and 2f). Because of the small number of data points, the sample directions for magnetization SWb were estimated by anchoring the data to the origin in the principal component analysis.
Chemical demagnetization was also performed on samples from sites K-T but did not appear to provide as clean a component separation as did thermal treatment. The failure to separate components is best illustrated in the comparison of two specimen demagnetizations from site 0 (Figure 3). The clear trend to a point removed from the origin during initial and intermediate stages of thermal demagnetization signifies the presence of at least one additional component, which in this case does not appear to be attributable to laboratory fields. The chemical demagnetization of a sample from the same site with a similar NRM shows only an apparently univectorial decay to the origin with a D, I of 178.9 ø, -19.3 ø before (and 182.8 ø , -35.6 ø after) tilt correction. The chemically "isolated" component is not consistent with any directions isolated from other sites and clearly must represent a resultant of the thermally distributed magnetization and a remaining high- temperature component. Given this clear failure of acid leaching to separate the magnetic components in this site the remainder of the chemically isolated components were excluded from statistical analysis and pole position
calculations. However, for most sites the mean direction for the chemically isolated components is not significantly different from the site mean directions isolated through thermal treatment because of the essentially univectorial NRM's in most of the samples.
Age Constraints on Magnetizations
Standard Fold Tests
Two treated samples from sites A-H were excluded from statistical calculations for lack
of linear demagnetization segments. Seven specimen magnetizations were rejected because of the poor chemical demagnetization results. For the 20 accepted samples, the mean direction of magnetization SWa (Figure 4a and 4b; Table 2) is D, I of 194.2 ø, -31.7 ø (a95 = 7.5ø); after tilt correction, the mean is D, I = 196.1 ø, 35.0 ø with the same dispersion because all the samples from sites A-H are from the same limb of the
structure. Two sites sampled near sites A-H were intended to provide a local fold test, but poor demagnetization results from these sites precluded any meaningful test.
One treated sample from sites K-T was rejected because of questionable orientation. The remainder of the 18 specimens not used were excluded because of the poor chemical demagnetization results as discussed above. The sample directions of magnetization SE (Figures 4c and 4d) show better grouping after tilt correction than before. Before tilt correction, the site mean D, I (Table 3) is 166.9 ø, 3.5 ø with

12,796 Miller and Kent: $ynfolding and Prefolding Magnetizations
SAMPLE DIRECTIONS
A -
i i i i i -,i,- i O i i ...
i i i i i i i i • i i i i i i i i i i i i i i i • i i i i t i i i
-- •GNETIZATI
- i i i + i i i i i + i i i i i i i i
_ -- •GNETI ZATION
•- * - (Y. C. ) • I• n=5 n= 5
Fi E . 4. E9ual-area stereo net plots of best fit sample directions for maEnetizations SWa (top), SE (center) and S• (bottom). Left hand plots are before tilt correction; riEht-hand plots are after full tilt correction. Open represent neEatiwe (upwar4) inclinations, star s•bols represent positiwe (do•war4)
k = 8.5, and after tilt correction the site mean D, I is 166.7 ø, -3.6 ø with k = 44.8 (a95 = 7.8ø). The fLvefold increase in k, for N = 9 sites, gives a statistically valid fold test at the 99% confidence level [Watson, 1956; McElhinny, 1964].
The magnetization SWb found in five samples also appears to show a positive fold test at the 99% confidence level (Figures 4e and 4f; Table 2). The mean D, I is 190.9 ø , 25.4 ø (a95 = 11.0 ø) after tilt correction.
We are thus left with the interesting problem of having two components of magnetization from sites K-T that appear to pass the fold test and apparently predate folding: the dominant thermally distributed, southeasterly component ($E) and the subordinant thermally discrete, southwester ly component (SWb).
Incremental Fold Tests
All of the site mean inclinations from
magnetization SE change sign after correction for
bedding tilt (Table 3). This means that the magnetic directions from opposite limbs pass near a common point during correction for bedding tilt. We therefore suspected that this component might be of synfolding origin. In order to test this hypothesis, an incremental fold test was applied. An incremental fold test consists of correcting the site means by progressively larger fractions of the measured bedding dips at each site and calculating the overall precision parameter, k, at each step. For example, at 50% of unfolding, all of the bedding dips are reduced to one half of their original value, and the group k is calculated. The value of k can then be plotted versus percentage of unfolding. If there is a statistically significant peak in k at some intermediate point in unfolding, then that magnetization can be interpreted as having occurred after some amount of folding. This method represents a mathematical convenience, and the percentage of unfolding corresponding to a peak in k cannot be strictly related to the

Miller and Kent: Synfolding and Prefolding Magnetizations 12,797
TABLE 2.
Site/ Sample
Direct ions and Poles:
Magnetizations SWa and SWb
In S itu
Dec Inc
Magnetization SWa (Site Mean Data)
A-H*
s/s--•0/•? 194.2-31.7 196.1 35.0
k--20.1 a95--7.5
Magnetization SWb (Sample Data)
L 1A 194.2 66.7 177.7 33.8 L 4 216.9 45.9 200.2 20.4 N 3A 189.7 -21.1 189.0 16.0 T 2A 194.2 -3.3 199.6 33.3 T 4A 186.5-16.5 187.3 22.6 MEAN 195.2 13.4 190.9 25.4
k=4.1 a95--43.1 k=49.7 a95--11.0
SWA
their ages, hence directions, should be similar. At no point during incremental rotation do the circles of 95% confidence for SWa and the SE
component overlap. The mean inclinations of Tilt Corrected magnetizations SWa and SE can be made to
correspond at shallow values at partial tilt Dec Inc correction, but there is still a significant
inconsistency in the mean declinations. Therefore if both of the magnetizations are synfolding, then some relative rotation of 15 ø to 20 ø of the two areas must have occurred since the
magnetizations were acquired. There is no physical evidence for any such tectonic rotation. Also, the same areas were sampled in the study of the Mauch Chunk, and no evidence of relative rotation was found in either the prefolding or synfolding magnetizations [Kent and Opdyke, 1985]. This suggests that these two magnetizations (SWa and SE) lack a common origin.
Pole Positions
{Computed from Sample Pole Positions)
SWB
SW
o E o N o E o N 74.4 63.0 86.3 25.9
k--27.2 a95--6.4 k--22.3 a95=7.1 84.4 36.0 91.1 34.4
k=8.2 a95--28.4 k--63.7 a95=9.7
Mean SW Pole Position
Computed from Sit.e Mean Pole Posit ions)
(Tilt Corrected, four Sites) 90.0 32.8 k=165.4 a95--7.2
Further Axe Constraints on SWa
In the absence of a clear local fold test, the interpretation of the age of magnetization SWa is not straightforward. If the magnetization is conservatively considered to be of postfolding age then the mean pole position from SWa is closest to the North American apparent polar wander path (NAAPWP [Irving and Irving, 1982];
TABLE 3. Directions and Poles: Magnetization SE
Site Mean Direct ions
In Situ Tilt Corrected
Dec is declination, Inc is inclination; k is Fisher's precision parameter; and a95 is 95% circle of confidence. S/N is the ratio of the number of samples used in calculation to the number of samples treated. * Treated as one site.
actual degree of folding that had occurred at the time of magnetization. The method can, however, distinguish whether the magnetization was acquired at some point during the folding history, rather than simply before or after folding, as in the conventional fold test.
For component SE, k peaks at 74% unfolding (Figure 5), and k at this unfolding step is significantly greater than the 100% tilt corrected k at the 95% confidence level (Figure 5; Table 3). Hence magnetization SE clearly dates to some point after folding began. The mean D, I for magnetization SE at 74% of unfolding is 166.6 ø, -1.8 ø (a95 = 4.6ø); the corresponding pole position is 48.1øN, 124.1øE.
For component SWb, k reaches a maximum only after full tilt correction. This result confirms
the positive fold test on this component and indicates its age as prefolding.
If we wish to consider the possibility that the magnetization SWa is of synfolding origin, then the obvious data set with which to compare is the clearly synfolding magnetization revealed by the statistically well grouped SE component. If both magnetizations were synfolding, then
Site S/N Dec Inc Dec Inc k a95
K 2/4 167.3 28.8 167.2 -7.2 L 4/6 169.5 19.5 169.4 -15.2 340 5.0 M 2/4 151.1 -31.9 153.3 7.1 N 4/5 162.4 -29.5 163.0 10.6 36 15.5 O-P* 2/6 172.2 8.2 172.3 -9.1 Q 2/2 166.8 7.9 167.1 -15.7 R 4/6 175.4 40.8 172.6 -11.5 295 5.4 S 2/3 166.7 15.8 166.2 -0.9 T 5/9 170.7 -30.8 170.5 10.2 494 3.4
Mean 166.9 3.5 166.7 -3.6
k(0%) = 8.5 k(100%) -- 44.8 a95 = 18.7 a95 = 7.8
at 74% tilt correction: Dec = 166.6 Inc ---1.8
k(74%) -- 124.5 a95 -- 4.6
[k(74%) / k(100%) = 2.8]
Pole Position (Calculated at 74% TC)
øN øE a95
48.1 124.1 4.0
Same notes as Table 2.

12,798 Miller and Kent: Synfolding and Prefolding Magnetizations
- CONFIDENCE
LIMITS VFF
95%
99%
VFF
-95%
-99%
SE
MAGNETIZATION SE
o 20 40 60 80 ! 00
PERCENT UNFOLDING
Fig. 5. Logarithm of precision parameter k versus percent of unfolding of site means for magnetization SE. VFF refers to the curve generated by incremental unfolding of site mean directions as reported by Van der Voo et al. [1979]. Plotting k on a logarithmic scale allows the confidence limits to be applicable over any portion of the curves.
Figure 6) in the Late Triassic/Early Jurassic (200 Ma). These pole positions, with their associated confidence limits, are likely to be different at the 99% confidence level [McFadden and Lowes, 1981]; therefore we do not favor this interpretation of postfolding remagnetization.
While it is not statistically precluded that the magnetization SWa does represent a synfolding remagnetization acquired earlier in the Triassic, this interpretation also seems unlikely. The pole position trace for SWa during progressive unfolding remains close to the NAAPWP back to about the 230 m.y. reference mean pole. The closest approach of the trace to the NAAPWP is at 30% of unfolding and near the Late Triassic (200 to 220 Ma) reference paleopoles. Given the confidence limits of the data, it is statistically permissible that magnetization SWa represents a synfolding remagnetization in the Late Triassic. However, continental rifting and deposition of the Newark Supergroup began at least by the middle Carnian (early in the Late Triassic [Olsen et al., 1982]), s.o t•at it is unlikely that active folding of t•e orogen also continued into the Late Triassic. •
Finally, the SWa pole position calculated either before, during, or after bedding tilt correction does not fall near the prefolding results from the Mauch Chunk Formation. [Kent and Opdyke, 1985] or the Deer Lake Group [Irving and Strong, 1984]. Therefore magnetization SWa is unlikely to represent a lower Carboniferous remagnetization.
We are left then with the possibility that the magnetization SWa represents a prefolding magnetization, possibly Devonian in age. This interpretation is supported by the observation that the tilt-corrected mean pole position for magnetization SWb (which passes a fold test) is statistically indistinguishable from the tilt- corrected mean pole position from magnetization SWa. The magnetizations SWa and SWb thus appear to be samples of the same prefolding magnetization population, SW, with a corresponding pole position of 32.8øN, 90.0øE, a95 = 7.2 for N = 4 sites (Table 2; Fig 6).
Magnetizations SE and SW
In the interest of clarity, a brief summary of the results to this point might be of use. We have sampled members of the Catskill at two different geographic localities. There are only two samples that contain normal polarity components, but in neither sample is the normal polarity component well defined. In the area southwest of Wilkes-Barre (sites K-T), there is a clearly defined thermally distributed southeasterly component (SE) that is of synfolding origin and must therefore be secondary. In the same sites there is also a poorly represented high unblocking temperature southwesterly component (SWb) which passes the fold test. In the area of Jim Thorpe (sites A-I{), the thermally discrete magnetizations (SWa) tend to be southwesterly in declination with moderate
Miller and Kent: Synfolding and Prefolding Magnetizations 12,799
170
200
230 MC(RM) •
KO(
ß PS(ID)
(1C)
MA ( uD )
DL(1C)
• SL(1D) BB(1D)
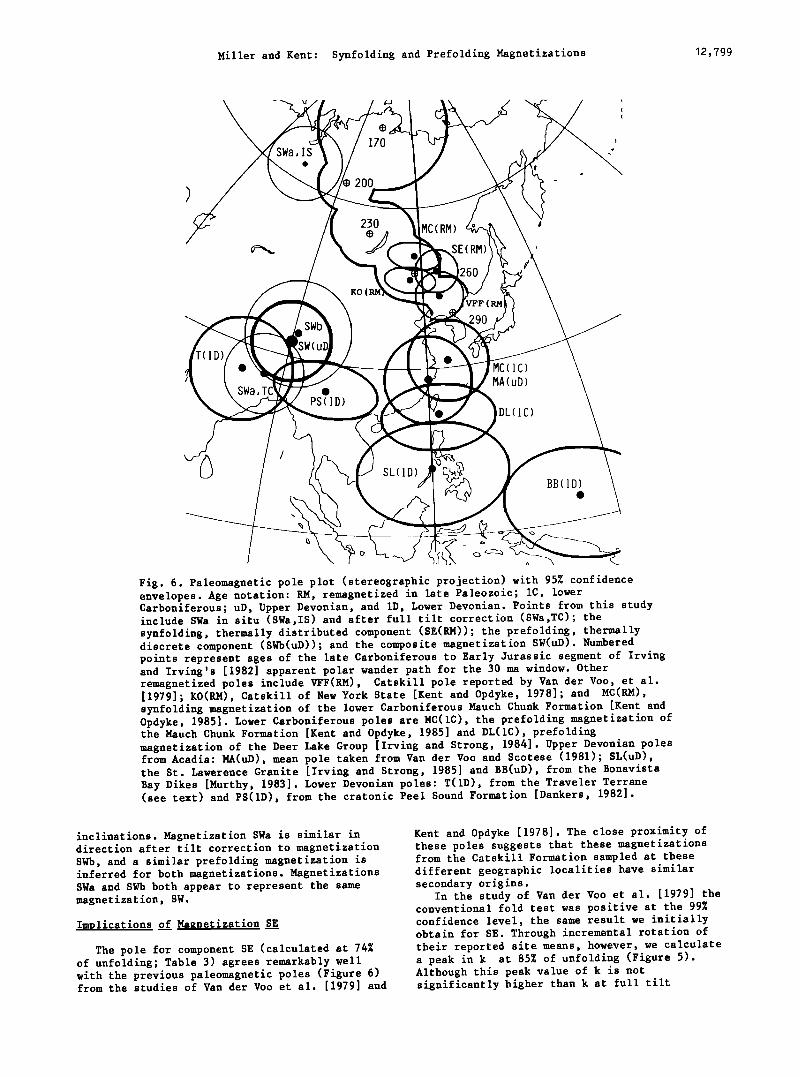
Fig. 6. Paleomagnetic pole plot (stereographic projection) with 95% confidence envelopes. Age notation: RM, remagnetized in late Paleozoi½; 1C, lower Carboniferous; uD, Upper Devonian, and 1D, Lower Devonian. Points from this study include SWa in situ (SWa,IS) and after full tilt correction (SWa,TC); the synfolding, thermally distributed component (SE(RM)); the prefolding, thermally discrete component (SWb(uD)); and the composite magnetization SW(uD). Numbered points represent ages of the late Carboniferous to Early Jurassic segment of Irving and Irving's [1982] apparent polar wander path for the 30 ma window. Other remagnetized poles include VFF(RM), Catskill pole reported by Van der Voo, et al. [1979]; KO(RM), Catskill of New York State [Kent and Opdyke, 1978]; and MC(RM), synfolding magnetization of the lower Carboniferous Mauch Chunk Formation [Kent and Opdyke, 1985]. Lower Carboniferous poles are MC(1C), the prefolding magnetization of the Mauch Chunk Formation [Kent and Opdyke, 1985] and DL(1C), prefolding magnetization of the Deer Lake Group [Irving and Strong, 1984]. Upper Devonian poles from Acadia: MA(uD), mean pole taken from Van der Voo and Scotese (1981); SL(uD), the St. Lawerence Granite [Irving and Strong, 1985] and BB(uD), from the Bonavista Bay Dikes [Murthy, 1983]. Lower Devonian poles: T(1D), from the Traveler Terrane (see text) and PS(1D), from the cratonic Peel Sound Formation [Dankers, 1982].
inclinations. Magnetization SWa is similar in direction after tilt correction to magnetization SWb, and a similar prefolding magnetization is inferred for both magnetizations. Magnetizations SWa and SWb both appear to represent the same magnetization, SW.
Implications of Magnetization S__E
The pole for component SE (calculated at 74% of unfolding; Table 3) agrees remarkably well with the previous paleomagnetic poles (Figure 6) from the studies of Van der Voo et al. [1979] and
Kent and Opdyke [1978]. The close proximity of these poles suggests that these magnetizations from the Catskill Formation sampled at these different geographic localities have similar secondary origins.
In the study of Van der Voo et al. [1979] the conventional fold test was positive at the 99% confidence level, the same result we initially obtain for SE. Through incremental rotation of their reported site means, however, we calculate a peak in k at 85% of unfolding (Figure 5). Although this peak value of k is not significantly higher than k at full tilt

12,800 Miller and Kent: Synfolding and Prefolding Magnetizations
correction, it does support our contention that both of these magnetizations are secondary. The explanation as to why the southeasterly magnetization of the Catskill in the Van der Voo et al. [1979] study area does not show a statistically significant peak in k through the incremental fold test while the magnetization SE clearly does may lie in the geometrical relationship between magnetic overprinting and folding in the two study areas noted earlier. Another interesting possibility is that the relative ages of the remagnetization and folding in the two study areas are different.
Paleomagnetic results from other cratonic rock units (Columbus and Delaware limestones [Martin, 1975]; Temple Butte and Martin formations [Elston and Bressler, 1977]) have previously been considered to possibly represent primary magnetizations largely because of their similar paleopole positions to those of the Catskill. Since it has now been shown that the
magnetization isolated previously in the Catskill is secondary, it seems reasonable to conclude that the results from these other units also
represent late Paleozoic remagnetizations.
Implications of Magnetization SW
The pole position from magnetization SW after full tilt correction falls very close to the pole from the cratonic lower Devonian Peel Sound
Formation [Dankers, 1982] (Figure 6). There is, however, an age difference between the Catskill and Peel Sound units, as the Peel Sound is Lower Devonian. This agreement may be just coincidence, but it is also possible that the reason these poles agree is that they do in fact collectively represent a good estimate of the Devonian pole position for North America.
The SW pole position is also close to the pole from the Lower Devonian Traveler Terrane (25øN, 99øE, a95 = 9 ø for N = 3 studies; Figure 6). The Traveler Terrane pole is calculated as the mean pole from the Traveler Felsite (29øN, 82øE [Spariousu and Kent, 1983]), the Compton metasediments (28øN, 77øE [Seguin et alo, 1982]), and the Dockendorff Group (20øN, 84øE [Brown and Kelly,. 1980]). Particularly interesting is the agreement with the pole from the Compton metasediments [Seguin et al., 1982], as this magnetization passed a fold test on Acadian folding and as such is constrained to be pre- Middle Devonian in age of magnetization. The Traveller is considered a suspect terrane and cannot with confidence be considered cratonic; comparison with the contemporaneous Peel Sound pole position [Dankers, 1982] does allow for some rotation of the Traveler block as proposed by Spariosu and Kent [1983]. Neverthe less, we believe that the close correspondence of the poles for the Catskill, Traveler, and Peel Sound units does suggest similar ages of magnetization.
The new Catskill pole does not coincide with the mean Upper Devonian pole for Acadia [Van der Voo and Scotese, 1981] (Figure 6). However, the nature of the discrepancy is again in the paleoazimuths and not in the paleolatitudinal positions. The paleolatitude calculated for magnetization SW is 16øS +/- 7.2 ø . This compares with a paleolatitude of 19øS +/- 8.1 ø predicted
for the eastern Pennsylvania sampling area from the mean Upper Devonian Acadia pole of Van der Voo and Scotese [1981]. Therefore there is no direct evidence for a latitudinal offset between Acadia and cratonic North America in these data
(as inferred by Irving and Strong [1984, 1985]), contrary to what was interpreted from the earlier Catskill results [Kent and Opdyke, 1978; Van der Voo et al., 1979; Irving, 1979].
The difference in the paleoazimuths may reflect some amount of post-Late Devonian rotation of Acadia counterclockwise relative to
North America and/or of eastern Pennsylvania clockwise relative to both the interior parts of North America and Acadia. In the study of the Mauch Chunk around the curve of the Pennsylvania salient, the prefolding magnetization declinations from sites in eastern Pennsylvania tended to be about 15 ø clockwise to those from
south-central Pennsylvania [Kent and Opdyke, 1985]. We cannot therefore exclude the possibility that the southwesterly declinations in the Catskill of eastern Pennsylvania reflect to some degree regional rotation in this part of the Appalachian orogen.
An alternative interpretation is that the rock units that are summarized as providing the Upper Devonian pole for Acadia were actually magnetized in the Carboniferous (either through remagnetization or poor age control on the rock units themselves]. The Upper Devonian pole for Acadia of Van der Voo and Scotese [1981] is indistinguishable from the two cratonic lower Carboniferous poles (Figure 6) and from the prefolding magnetization observed in the Tournaisian [Howie and Barss, 1975] Terrenceville Formation from Acadia (pole position 27.4øN, 123.5øE [Kent, 1982]), which had previously been thought to be Upper Devonian.
If the recently determined paleopoles from the Upper Devonian Saint Lawrence Granite [Irving and Strong, 1985] and Wesleyville dikes [Murthy, 1983] of the Burin Peninsula are a better representation of the Upper Devonian pole for Acadia than the previous studies summarized by Van der Voo and Scotese [1981], then a discrepancy in paleolatitude reappears because the paleolatitudes predicted from these units for eastern Pennsylvania (35øS +/- 9 ø , St. Lawrence Grantite; 42øS +/- 9 ø , Wesleyville dikes, sotheasterly magnetization) are significantly more southerly than the paleolatitude observed for the Catskill. It should be noted that the mean declinations from these two studies in
Newfoundland differ by some 20 ø , suggesting some amount of local rotation. Also, Murthy [1983] isolated another magnetization from other dikes in the Bonavista Bay area (originally interpreted as the primary magnetization) which corresponds to a paleolatitude of 74.5øS for Acadia in the Upper Devonian. Further work is clearly needed in both the North American craton and Acadia before
any final answer can be given to the question of displacement of Acadia in the Upper Devonian.
Origin of Synfolding Magnetization
The Catskill is not the first rock unit found
to possess a synfolding magnetization. Examples of other units in which synfolding magnetizations

Miller and Kent: Synfolding and Prefolding Magnetizations 12,801
have been isolated include the Mauch Chunk red
beds [Kent and Opdyke, 1985], the Helderberg limestone [McCabe et al., 1983], the Old Red Sandstone [Chamalaun and Creer, 1964; Chamalaun, 1964; McClelland-Brown, 1983], and various Cretaceous units in western Wyoming [Schwartz and Van der Voo, 1984]. The exact nature of the origin of the synfolding magnetization in the Catskill is as yet unknown, but a few inferences can be made from the data presented in this study.
The Permian, or Kiaman, remagnetization of red beds, which is common in the Appalachians, is most likely to be chemical in origin. If the remagnetization were of thermal origin, then the unblocking temperatures of the synfolding magnetization observed in the Catskill (>650øC) would require that the sediments had been subjected to similarly high (>630øC) temperatures at some point during burial [Pullaiah et al., 1975]. Given the lack of evidence for metamorphism in the Catskill and the data from conodonts, it is therefore unreasonable to ascribe a thermal origin to the remagnetization. This observation leaves chemoremanence, the precipitation or recrystallization of hematite from solution, as the only viable alternative mechanism of remagnetization. However, the remagnetization might have been enhanced by elevated fluid temperature during orogenesis.
If the folding in the central Appalachians is seen as a continuous process, then it is interesting to note that synfolding magnetizations produce such linear trends during demagnetization. One might intuitively expect that if the remagnetization and folding were proceeding simultaneously, curved demagnetization trajectories might be the rule. This expectation arises from the idea that if hematite is being chemically precipitated during folding, then that hematite which was deposited early in the folding process would have a somewhat higher unblocking temperature (because it had more time to attain a larger, more magnetically stable grain size) and a slightly different direction (because of the difference in bedding attitude) than hematite deposited later in the folding process.
The observation that the synfolding magnetizations typically have linear demagnetization paths could mean that the remagnetization occurred concurrently with folding over a very short time period with respect to folding. Another possible explanation for the linear demagnetization paths is that the folding was discontinuous and the remagnetization occurred between two phases of deformation. It has been suggested that the Alleghenian orogeny consisted of two phases of deformation that were not everywhere coaxial [Geiser and Engelder, 1983]. It is possible then that the remagnetization event for the red beds occurred after the first phase of folding and was subsequently reordered by the next phase of deformation.
In any case, an observation that tends to support the idea that the remagnetization of the Catskill (as well as the Mauch Chunk) is in some way related to orogenesis is that the magnetization of these rock units lacks any postfolding magnetization except for the present-
day overprint. If the remagnetization were a deep weathering process related to the near-equatorial position of North America in the late Paleozoic [Creer, 1968], then it should have continued past the end of folding, since North America occupied a near-equatorial position into the Late Permian [Irving and Irving, 1982] .
Age of Alleghenian Folding
Regardless of the exact mechanism of the remagnetization, the synfolding magnetization provides an estimate of the age of folding in the Alleghenian orogeny. A mean synfolding pole position (47.6øN, 122.3øE, a95 = 6.9 for N -- 3 studies) can be calculated by combining the synfolding result from the Mauch Chunk [Kent and Opdyke, 1985] with those of the Catskill (the present study and that of Van der Voo et a l. [1979]). Comparison of the mean synfolding pole with the NAAPWP of Irving and Irving [1982] suggests that the folding was in progress in the Early Permian (about 270 Ma) somewhat after the deposition of the Dunkard Group. In a study utilizing postfolding magnetizations from the Ordovician Juniata and Silurian Rose Hill formations, Van der Voo [1979] placed the age of folding as late Carboniferous to Early Permian. These two estimates are consistent and suggest that the age of Alleghenian folding was Early Permian.
Conclusions
A demonstrably secondary magnetization (SE) acquired during late Paleozoic folding was isolated, corresponding to a paleopole position (48.1øN, 124.1øE), which plots on the Early Permian portion of the NAAPWP and near to the paleopole reported for the synfolding magnetization of the Mauch Chunk [Kent and Opdyke, 1985]. This paleopole is indistinguishable from the previous pole positions reported from the Catskill by Van der Voo et al. [1979] and Kent and Opdyke [1978]. It is now clear that these previous studies of the Catskill also isolated secondary late Paleozoic magnetizations and as such should no longer be considered as representative of Devonian age magnetizations. This study confirms the contention of Irving and Strong [1985] that all of the pole positions in addition to the Catskill that had previously been thought to represent the Upper Devonian pole position for North America (Temple Butte and Martin formations [Elston and Bressler, 1977] and Columbus and Delaware limestone [Martin, 1975]) can also be considered late Paleozoic remagnetizations.
Given the results of this study and other studies that have isolated synfolding magnetizations, the application of some form of incremental fold test might be a prudent addition to the standard paleomagnetic NRM stability tests, particulary for rock units folded in the Alleghenian orogeny.
The hypothesis that the synfolding remagnetization actually occurred between two phases of deformation is testable if a suitable location can be found. It will be necessary to sample in an area where the phases of deformation

12,802 Miller and Kent: Synfolding and Prefolding Magnetizations
are well defined structurally, allowing for a multiple phase structural tilt correction. It would then be possible to determine whether the magnetization components were acquired during any given phase or between phases.
Through comparison of the mean synfolding pole position with the NAAPWP [Irving and Irving, 1982], the synfolding magnetization now documented in Devonian and lower Carboniferous
rock units in the central Appalachians is thought to have been in progress at about 270 Ma. This suggests an age of Early Permian for Alleghenian folding in the Valley and Ridge Province.
The high unblocking temperature magnetization SW corresponds to a southern hemisphere paleolatitude for eastern central Pennsylvania of about 16øS, which is some 10 ø to 15 ø farther south than the paleolatitudes reported from the earlier studies of the Catskill. An early acquisition age for this magnetization is implied by a positive fold test on a small number of samples from the Wilkes-Barre area and by the fact that the corresponding pole position does not fall near to any reported post-Devonian paleopoles for North America.
The paleopole from the prefolding magnetization SW (32.8øN, 90.0øE) is similar to poles from rock units in the Traveler Terrane and from the cratonic Peel Sound Formation, which are, however, Lower Devonian. The paleolatitude from magnetization SW suggests that there was no latitudinal offset between Acadia and North
America in the Late Devonian when compared with the paleolatitude predicted for this area from the mean paleopole for Acadia of Van der Voo and Scotese [1981]. A significant latitudinal offset exists, however, with the paleolatitudes observed from eastern Newfoundland Upper Devonian rock units [Murthy, 1983; Irving and Strong, 1985]. The data from eastern Newfoundland leave open the possibility of some latitudinal offset between all, or part, of Acadia and North America in the Late Devonian.
The isolation of prefolding magnetizations from the Catskill over a broader area, especially in south-central Pennsylvania, will be needed to test the hypothesis of relative rotation within this part of the orogen. This, however, would not necessarily solve the problem of an Upper Devonian reference pole for cratonic North America, which must be based on studies from a demonstrably stable area.
Acknowledgements. The laboratory work of D. Lafferty and critical reading of the manuscript by D. Schneider and B. Witte are much appreciated. Helpful comments were offered by the reviewers: E. Irving, R. Burroester, and an associate editor. This work was supported by the National Science Foundation, Earth Sciences grant EAR85-07046. Lamont-Doherty Geological Observatory contribution 4043.
References
Berg, T. M., W. E. Edmunds, A. R. Geyer, A.D. Glover, D. M. Hoskins, D. B. MacLachlan, S. I. Root, W. D. Sevon, A. A. Socolow, C. E. Miles, and J. G. Kuchinski, Geologic map of Pennsylvania, Penn. State Topogr. and Geol. Surv., Harrisburg, 1980.
Brown, L. L., and W. M. Kelly, Paleomagnetic results from northern Maine--
Reinterpretations, Geophys. Res. Lett., 7, 1109-1111, 1980.
Chamalaun, F. H., Origin of the secondary magnetization of the Old Red Sandstones of the Anglo-Wesh curvette, J. Geophys. R.es.., 69, 4327-4337 , 1964.
Chamalaun, F. H., and K. M. Creer, Thermal demagnetization studies on the Old Red Sandstones of the Anglo-Wesh curvette, J. Geophys. Re.s., 69, 1607-1616, 1964. Creer, K. M., Paleozoic paleomagnetism, Nature, 219, 246-250, 1968.
Dankers, P., Implications of Early Devonian poles from the Canadian Arctic Archipelago for the North American apparent polar wander path, Can. Jour. Earth Sci., 19(9), 1802-1809, 1982.
Dennison, J. M., Uranium favorability of nonmarine and marginal marine strata of late Precambrian and Paleozoic age in Ohio, Pennsylvania, New Jersey, and New York, Rep. GJBX-50(82), 254 pp., Nat. Uranium Res. Eval., Grand Junction, Colo., 1982.
Elston, D. B., and S.L. Bressler, Paleomagnetic poles and polarity zonation from Cambrian and Devonian strata of Arizona, Earth Planet. Sci. Lett., 36, 423-433, 1977.
Epstein, A. G., J. B. Epstein, and L. D. Harris, Conodont color alteration--An index to organic metamorphism, USGS Prof. Pap. 995, 1977.
Epstein, J. B., Sevon, W. D. and J. D. Glaeser, Geology and mineral resources of the Lehighton and Palmerton quadrangles, Carbon and Northampton counties, Pennsylvania, 460 pp, Penn. Geol. Surv., Harrisburg, 1974.
Fisher, R. A., Dispersion on a sphere, Proc. R. Soc. London, Ser. A, 217, 295-305, 1953.
Geiser, P., and T. Engelder, The distribution of layer parallel shortening fabrics in the Appalachian foreland of New York and Pennsylvania: Evidence for two non-coaxial phases of the Alleghenian orogeny, Geol. Soc. Am. Mere., 158, 161-175, 1983.
Goree, W. S., and M. Fuller, Magnetometers using RF-driven squids and their applications in rock magnetism and paleomagnetism, Rev. Geophys., 14, 591-608, 1976.
Harland, W. B., A. V. Cox, P. G. Llewellyn, C. A. G. Pickton, A. G. Smith, and R. Walters, A Geologic Time Scale, Cambridge University Press, New York, 1982.
Harris, A. G., L. D. Harris, and J. B. Epstein, Oil and gas data from Paleozoic rocks in the Appalachian Bas in: Maps for assessing hydrocarbon potential and thermal maturity (conodont color alteration isograds and overburden isopachs), USGS Misc. Invest. Ser., ..9!7, 1978.
Howie, R. D. and M. S. Barss, Upper Paleozoic rocks of the Atlantic Provinces, Gulf of St. Lawrence and adjacent continental shelf, Geol. Surv. Can. Pap. 74-30, 2, 35, 1975.
Irving, E., Paleopoles and paleolatitudes of North America and speculations about displaced terrains, Can. J. Earth Sci., 16(3), 669-694, 1979.
Irving, E., and G. A. Irving, Apparent polar wander paths Carboniferous through Cenozoic and the assembly of Gondwana, Geophys. Surv., 5, 141-188, 1982.

Miller and Kent: Synfolding and Prefolding Magnetizations 12,803
Irving, E. and D. F. Strong, Palaeomagnetism of the early Carboniferous Deer Lake Group, western Newfoundland' No evidence for
Carboniferous displacement of "Acadia," Earth Planet. Sci. Lett., 69, 379-390, 1984.
Irving, E., and D. F. Strong, Paleomagnetism of rocks from Burin Peninsula, Newfoundland: Hypothesis of Late Paleozoic displacement of Acadia criticized, J__•. Geophys. Res., 90, 1949- 1962, 1985.
Kent, D. V., Paleomagnetic evidence for Post- Devonian displacement of the Avalon Platform (Newfoundland), J_•. Geophys. Res____•., 87, 8709- 8716, 1982.
Kent, D.V., and N.D. Opdyke, Paleomagnetism of the Devonian Catskill Red Beds: Evidence for
motion of coastal New England-Canadian Maritime region relative to cratonic North America, J__•. Geophys. Res., 83, 4441-4450, 1978.
Kent, D. V., and N. D. 0pdyke, The early Carboniferous paleomagnetic field of North America and its bearing on tectonics of the northern Appalachians, Earth Planet. Sci. Lett., 44, 365-372, 1979.
Kent, D.V., and N.D. Opdyke, Multicomponent magnetizations from the Mississippian Mauch Chunk Formation of the central Appalachians and their tectonic implications, J__•. Geoph¾s. Res., 90, 5371-5383, 1985.
Kirschvink, J. L., The least-squares line and plane analysis of palaeomagnetic data, Geophys. J. R. Astron. Soc., 62, 699-718, 1980.
Knowles, R. R., and N. D. Opdyke, Paleomagnetic results from the Mauch Chunk Formation: A test of the origin of curvature in the folded Appalachians of Pennsylvania, J__•. Geophys. Res., 73, 6515-6526, 1968.
Martin, D. L., A paleomagnetic polarity transition in the Devonian Columbus Limestone
of Ohio: A possible stratigraphic tool, Tectonophysics, 28, 125-134, 1975.
McCabe, C., R. Van der Voo, D. R. Peacor, C. R. Scotese, and R. Freeman, Diagenetic magnetite carries ancient yet secondary remanence in some Paleozoic sedimentary carbonates, Geology, 11, 221-223, 1983.
McClelland-Brown, E., Palaeomagnetic studies of fold development and propagation in the Pembrokeshire Old Red Sandstone, Tectonoph¾sics, 98, 131-149, 1983.
McElhinny, M. W., Statistical significance of the fold test in Paleomagnetism, Geoph¾s. J. R. Astron. Soc., 8(3), 338-340, 1964.
McFadden, P. L., and F. J. Lowes, The discrimination of mean directions drawn from
Fisher distributions, Geophys. J. R. Astron. Soc., 67, 19-33, 1981.
Molyneaux, L., Complete results magnetometer for measuring the reinanent magnetization of rocks, Ge0phys. J. Roy. Astron. Soc., 10, 429, 1972.
Murthy, G. S., Paleomagnetism of diabase dykes from the Bonavista Bay area of northeastern
Newfoundland, Can. J. Earth Sci., 20, 206-216, 1983.
Olsen, P. E., A. R. McCune, and K. S. Thomson, Correlation of the Early Mesozoic Newark Supergroup by vertebrates, principally fishes, Am. Jour. Sc.i., 2,82, 1-44, 1982.
Pullaiah, G., E. Irving, K. L. Buchan, and D. J. Dunlop, Magnetization changes caused by burial and uplift, Earth Planet. Sci. Lett., 28, 133-143, 1975.
Roy, J. L., and W. A. Morris, A review of paleomagnetic results from the Carboniferous of North America; The concept of Carboniferous geomagnetic field horizon markers, Earth Planet. Sci. Lett., 65, 167-18•, 1983.
Roy, J. L., N. D. Opdyke and E. Irving, Further paleomagnetic results from the Bloomsburg Formation, Jour. Geop.hys. Res., 72, 507 5-5086, 1967.
Schwartz, S. Y., and R. Van der Voo, Paleomagnetic study of thrust sheet rotation during foreland impingement in the Wyoming- Idaho overthrust belt, J__. Geophy_s_. Res., 89, 10077-10086, 1984.
Seguin, M. K., K. V. Rao, and R. Pineault, Paleomagnetic study of Devonian rocks from Ste. Cecile-St. Sebastien region, Quebec Appalachians, J__. Geophys. Res., 87, 7853-7864, 1982.
Spariosu, D. J., and D. V. Kent, Paleomagnetism of the Lower Devonian Traveler Felsite and the Acadian orogeny in the New England Appalachians, Geol. Soc. Am. Bull,, 94, 1319-1328, 1983.
Van der Voo, R., Age of the Alleghenian folding in the Central Appalachians, Geo!omy, 7, 297-298, 1979.
Van der Voo, R., and C. Scotese, Paleomagnetic evidence for a large (2,000 kin) sinstral offset along the Great Glen fault during Carboniferous time, Geology, 9, 583-589, 1981.
Van der Voo, R., A. N. French, and R. B. French, A paleomagnetic pole position from the folded Upper Devonian Catskill redbeds, and its tectonic implications, Geology, 7, 345- 348, 1979.
Watson, G. S., Analysis of dispersion on a sphere, Mon. Notic. R. Astron. Soc., Geophys. Suppl., 7, 153-159, 1956.
Zijderveld, J. D. A., A. C. demagnetization of rocks: Analysis of results, in Methods i•n Paleomagneti.sm, edited by D. W. Collinson, M. K. Creer, and S. K. Runcorn, pp. 254-286, Elsevier, New York, 1967.
J. D. Miller and D. V. Kent, Lamont-Doherty Geological Observatory and Department of Geological Sciences, Columbia University, Palisades, NY 10964.
(Recieved January 6, 1986; revised June 2, 1986;
accepted July 30, 1986.)