geological and tectonic implications obtained from first … · 2017-08-28 · geological and...
TRANSCRIPT

Afnimar et al. Geoscience Letters (2015) 2:4 DOI 10.1186/s40562-015-0020-5
RESEARCH LETTER Open Access
Geological and tectonic implications obtainedfrom first seismic activity investigation aroundLembang faultAfnimar1*, Eko Yulianto2 and Rasmid3
Abstract
The Lembang fault located at northern part of populated Bandung basin is the most conspicuous fault that potentiallycapable in generating earthquakes. The first seismic investigation around Lembang fault has been done bydeploying a seismic network from May 2010 till December 2011 to estimate the seismic activities around that fault.Nine events were recorded and distributed around the fault. Seven events were likely to be generated by theLembang fault and two events were not. The events related to the Lembang fault strongly suggest that this faulthas left-lateral kinematic. It shows vector movement of Australian plate toward NNE might have been responsiblefor the Lembang fault kinematic following its initial vertical gravitational movement. The 1-D velocity model obtainedfrom inversion indicates the stratigraphy configuration around the fault composed at least three layers of low Vp/Vs atthe top, high Vp/Vs at the middle layer and moderate Vp/Vs at the bottom. In comparison with general geology of thearea, top, mid and bottom layers may consecutively represent Quaternary volcanic layer, pre-Quaternary water-filledsedimentary layer and pre-Quaternary basement. Two eastern events related to minor faults and were caused by agravitational collapse.
Keywords: Pre-quaternary sedimentary rock; Left-lateral faulting; New segment of Lembang fault
BackgorundThe Bandung Basin is a plateau surrounded by severalmountains and active volcanoes. The basin morphologyformed due to tectonic and volcanic activity during theQuaternary. Thick lake sediments were deposited in thebasin during the Late Quaternary. These deposits mightconceal several buried faults. The Lembang fault islocated at the northern part of the Bandung basin whereThe Bandung City is located. Administratively, thisbasin is located in West Java province and surrounded byseveral mountains, which are associated with mappedfaults (Figure 1). Bandung is a densely populated city inIndonesia. It is surrounded by several faults that maypotentially be earthquake sources. Regarding to disasterrisk reduction, it is important to reveal the seismicity inthis area. We studied seismic activities around the LembangFault, the most conspicuous fault in the basin.
* Correspondence: [email protected] Laboratory, Faculty of Mining and Petroleum Engineering,Bandung Institute of Technology (ITB), Ganesha 10 Street, West Jawa 40132,IndonesiaFull list of author information is available at the end of the article
© 2015 Afnimar et al.; licensee Springer. This isAttribution License (http://creativecommons.orin any medium, provided the original work is p
The formation of the Lembang Fault was explained byDam [1]. In the Early-Middle Quaternary, the west–easttrending highland with the oldest volcanoes of theBurangrang-Sunda complex (including Tangkubanper-ahu Volcano), the volcanic ridges and peaks in thenortheastern Lembang area, and most of the volcanicterrain between Bandung and Sumedang were formed.Following the build up of the Sunda volcano, a gravi-tational collapse, due to the loading of enormousamounts of volcanic deposits on ductile marine sedi-ments, caused thrust faults and diapiric structures inthe near surface strata of the northern foot slopes (VanBemmelen, [2]). Rifting associated with catastrophicsector failure eruptions destroyed the volcanic cones,while the depressurization of the main magma reservoirled to normal faulting and the formation of the Lembangfault. This fault, with an impressive scarp, was studied byTjia [3], who concluded both older dip-slip and youngerstrike-slip displacement had occurred.
an Open Access article distributed under the terms of the Creative Commonsg/licenses/by/4.0), which permits unrestricted use, distribution, and reproductionroperly credited.
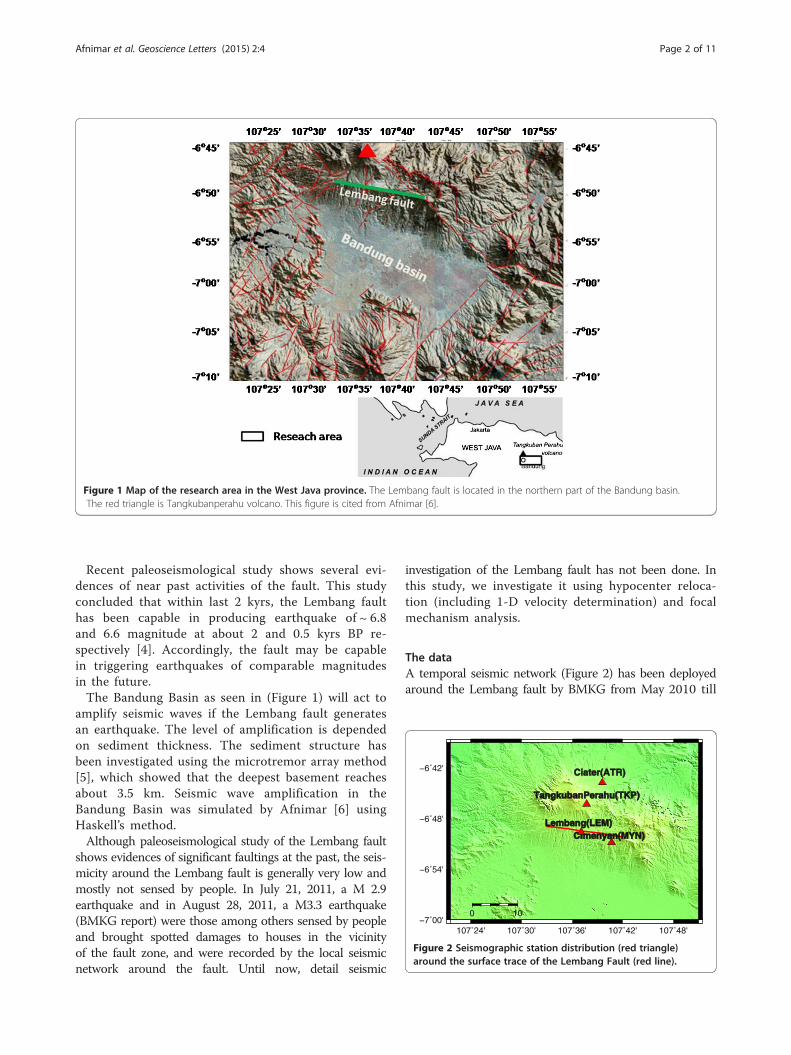
Figure 1 Map of the research area in the West Java province. The Lembang fault is located in the northern part of the Bandung basin.The red triangle is Tangkubanperahu volcano. This figure is cited from Afnimar [6].
107˚24' 107˚30' 107˚36' 107˚42' 107˚48'−7˚00'
−6˚54'
−6˚48'
−6˚42'
0 10
Ciater(ATR) Ciater(ATR)
Lembang(LEM) Lembang(LEM) Cimenyan(MYN) Cimenyan(MYN)
TangkubanPerahu(TKP)TangkubanPerahu(TKP)
Figure 2 Seismographic station distribution (red triangle)around the surface trace of the Lembang Fault (red line).
Afnimar et al. Geoscience Letters (2015) 2:4 Page 2 of 11
Recent paleoseismological study shows several evi-dences of near past activities of the fault. This studyconcluded that within last 2 kyrs, the Lembang faulthas been capable in producing earthquake of ~ 6.8and 6.6 magnitude at about 2 and 0.5 kyrs BP re-spectively [4]. Accordingly, the fault may be capablein triggering earthquakes of comparable magnitudesin the future.The Bandung Basin as seen in (Figure 1) will act to
amplify seismic waves if the Lembang fault generatesan earthquake. The level of amplification is dependedon sediment thickness. The sediment structure hasbeen investigated using the microtremor array method[5], which showed that the deepest basement reachesabout 3.5 km. Seismic wave amplification in theBandung Basin was simulated by Afnimar [6] usingHaskell’s method.Although paleoseismological study of the Lembang fault
shows evidences of significant faultings at the past, the seis-micity around the Lembang fault is generally very low andmostly not sensed by people. In July 21, 2011, a M 2.9earthquake and in August 28, 2011, a M3.3 earthquake(BMKG report) were those among others sensed by peopleand brought spotted damages to houses in the vicinityof the fault zone, and were recorded by the local seismicnetwork around the fault. Until now, detail seismic
investigation of the Lembang fault has not been done. Inthis study, we investigate it using hypocenter reloca-tion (including 1-D velocity determination) and focalmechanism analysis.
The dataA temporal seismic network (Figure 2) has been deployedaround the Lembang fault by BMKG from May 2010 till

Afnimar et al. Geoscience Letters (2015) 2:4 Page 3 of 11
December 2011. Four Taurus-Nanometrics seismome-ters are installed at Lembang (LEM), Cimenyan(MYN), Parongpong and around Cibodas. In the mid-dle of 2010, two seismometers were moved fromParompong and Cibodas to Tangkubanperahu Volcano(TKP) and Ciater (ATR), due to avoid noises fromfarming activities. During these two years, the networkhas recorded about 15 earthquakes. This research willonly analyze events those that originated from the areaaround Lembang.One example of the recorded seismic waveform is
shown in (Figure 3). The P wave arrival picking isbased on its onset that is clearly visible on the seismo-grams. It is more difficult to find the S wave onset,especially in the seismogram from station MYN. Fortu-nately, the horizontal components of seismogramsfrom stations LEM, TKP and ATR show clear S-waveonsets. The picking of S waves from these threestations could be used as a guidance to find the S wavephase on the seismogram from station MYN. There areone or two phases observed at station MYN before the
-101
X 1
0+4
IPU0 ISU0
-1012
X 1
0+4
IPU0 ISU0
-505
X 1
0+3
IPU0 ISU0
-2
0
2
X 1
0+4
IPU0 ISU0
-2-1012
X 1
0+4
IPU0 ISU0
-2-101
X 1
0+4
IPU0 ISU0
-505
X 1
0+3
IPU0 ISU0
-10-505
10
X 1
0+3
IPU0 ISU0
-4-2024
X 1
0+3
IPU0 ISU0
-4-202
X 1
0+3
IPU0 ISU0
-4-202
X 1
0+3
IPU0 ISU0
-2
0
2
X 1
0+3
IPU0 ISU0
9278 9280 9282 9284 9286 9288
Figure 3 Seismogram examples of September 3th, 2011 event. From to
S wave arrival. These phases are probably producedfrom reflections due to complicated structure north ofthis station.
MethodsThe first step that should be done on earthquake ana-lysis is earthquake location determination. An earth-quake location includes a geographical position, a depthand an origin time. The origin time can be determinedusing what is called a Wadati diagram [7]. The resultfrom the Wadati diagram is one input of the gradient in-version method that is usually used to locate one event.This is the reason for this method is often used as a sin-gle event determination (SED). The velocity structureused in this step is guessed from geological structuresaround the Lembang fault. This inversion method wasfirst introduced and applied by Geiger [8] and called theGeiger method of earthquake location. The result of theSED method should be recalculated due to the structureheterogeneity around the Lembang fault. A joint Hypo-center Location (JHD) method was first proposed by
4
SP1LE SHESEP 03 (246), 201119:36:45.510
4
SP1LE SHNSEP 03 (246), 201119:36:45.510
4
SP1LE SHZSEP 03 (246), 201119:36:45.510
4
SP9 BHESEP 03 (246), 201119:36:45.510
4
SP9 BHNSEP 03 (246), 201119:36:45.510
4
SP9 BHZSEP 03 (246), 201119:36:45.510
4
SP10 SHESEP 03 (246), 201119:36:45.510
4
SP10 SHNSEP 03 (246), 201119:36:45.510
4
SP10 SHZSEP 03 (246), 201119:36:45.510
4
SP11 SHESEP 03 (246), 201119:36:45.510
4
SP11 SHNSEP 03 (246), 201119:36:45.510
4
SP11 SHZSEP 03 (246), 201119:36:45.510
9290 9292 9294 9296 9298 9300
p to bottom, seismograms recorded at station LEM, TKP, ATR and MYN.

Afnimar et al. Geoscience Letters (2015) 2:4 Page 4 of 11
Douglas [9] to accommodate the residual time at all sta-tions (station correction) caused by velocity heterogen-eity of station locations. Kissling et al. [10] extended theJHD method by including a 1-D velocity model as a par-ameter in inversion.To estimate the earthquake mechanism, the moment
tensor inversion developed by Kuge [11] is applied inthis research to estimate the earthquake mechanism.The optimum moment tensor solution is reached by bestfitting between observation and synthetic waveformsthrough inversion process. The synthetic waveforms arecalculated by the extended reflectivity method developedby Kohketsu [12]. The velocity structure where that syn-thetic waveform calculated is 1-D velocity model resultfrom the JHD. The observation velocity waveforms arecut from P-wave onset to S-wave pulse (5 to 10 s win-dowing) and are filtered in 0.075-0.25 Hz using SAC.Sometime for small event, the velocity waveforms of anevent are integrated to get the displacement waveformsto reduce the ringing pattern. We show the original out-puts related to the highest magnitude event (Figure 4)and to the lowest one (Figure 5). The fitting betweenobservation waveforms and synthetic ones for all events
Mrr, Mtt, Mff, MMrr, Mtt, Mff, M2.37, −8.25, 5.88, −2.37, −8.25, 5.88, −N1:(Strike,Dip,Slip)N1:(Strike,Dip,Slip)N2:(Strike,Dip,Slip)N2:(Strike,Dip,Slip)Moment = 0.1351E+Moment = 0.1351E+Variance = 0.1723Variance = 0.1723depth = 18.7(km)depth = 18.7(km)
2011_08_28 2011_08_28
ATREW ATREW .86E−05(cm/s).86E−05(cm/s)
ATRNS ATRNS .90E−05(cm/s).90E−05(cm/s)
LEMEW LEMEW .12E−04(cm/s).12E−04(cm/s)
LEMNS LEMNS .38E−04(cm/s).38E−04(cm/s)
MYNEW MYNEW .79E−05(cm/s).79E−05(cm/s)
MYNNS MYNNS .99E−05(cm/s).99E−05(cm/s)
TKPEW TKPEW .13E−04(cm/s).13E−04(cm/s)
TKPNS TKPNS .12E−04(cm/s).12E−04(cm/s)
Figure 4 The complete output of moment tensor solution of the 28 Aare observation waveforms and the red lines are calculation ones.
are varies that is identified by variance value (see Figures 4and 5). Although there is variation of variance values, thesynthetic waveforms still cover the trend of the observa-tion ones. The observation waveforms recorded at stationTKP look like noisy and can not fit well with syntheticwaveforms. Even some events, for example the event in(Figure 5), the observation waveforms can not be iden-tified at this station. The reason should be caused bythe structure heterogeneity around TangkubanperahuVolcano.
Earthquake location and focal mechanismThe relocated SED hypocenters obtained using theJHD method for all events listed in (Table 1) and theirdouble-couple solutions of moment tensor resultslisted in (Table 2) are plotted in (Figures 6 and 7). Mostof them seem to have relationship with the Lembangfault. Only two very shallow events (at a depth lessthen 5.0 km) are located to the east part and thereforeit is unlikely to have relationship with the Lembangfault.The events related to the Lembang fault strongly
suggest that this fault has left-lateral kinematic with
rt, Mrf, Mtfrt, Mrf, Mtf9.94, −1.20, 6.12, x10**119.94, −1.20, 6.12, x10**11 = (156.8, 41.0, 171.8) = (156.8, 41.0, 171.8) = (253.0, 84.6, 49.3) = (253.0, 84.6, 49.3)13(Nm), Mw = 2.013(Nm), Mw = 2.0
ATRUD ATRUD .47E−05(cm/s).47E−05(cm/s)
LEMUD LEMUD .13E−04(cm/s).13E−04(cm/s)
MYNUD MYNUD .78E−05(cm/s).78E−05(cm/s)
TKPUD TKPUD .22E−04(cm/s).22E−04(cm/s)
0 5 10
Time(sec)ugust 2011 event (highest magnitude earthquake). The black lines
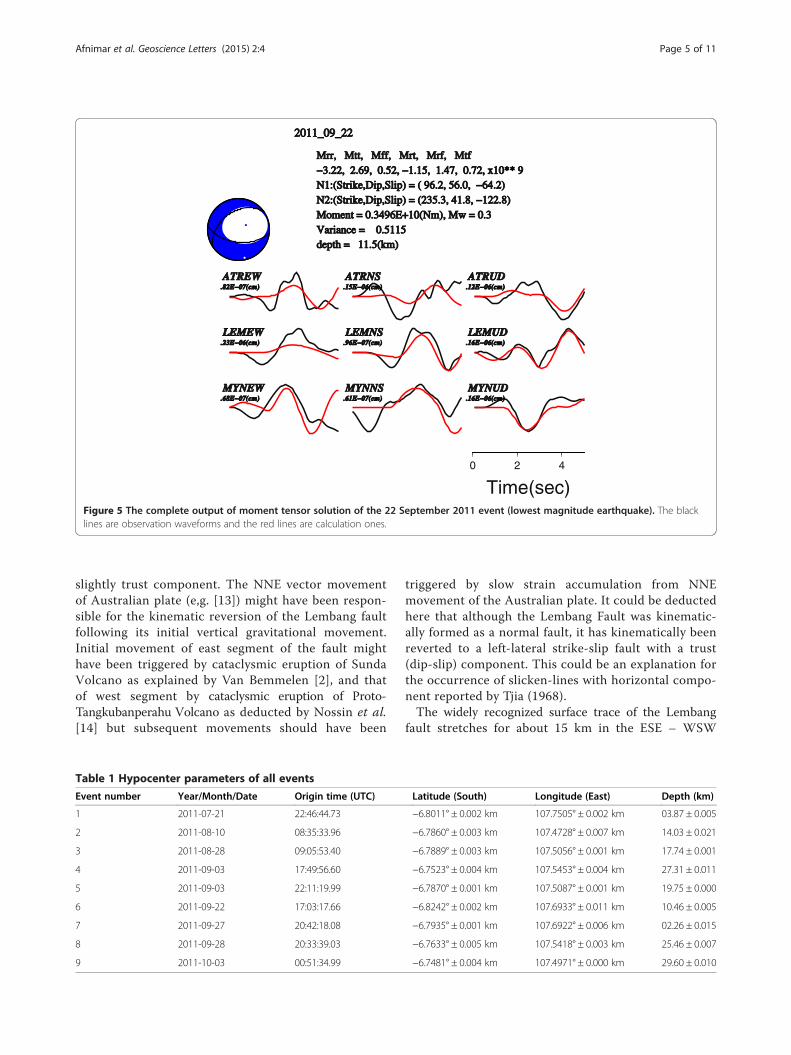
Mrr, Mtt, Mff, Mrt, Mrf, MtfMrr, Mtt, Mff, Mrt, Mrf, Mtf−3.22, 2.69, 0.52, −1.15, 1.47, 0.72, x10** 9−3.22, 2.69, 0.52, −1.15, 1.47, 0.72, x10** 9N1:(Strike,Dip,Slip) = ( 96.2, 56.0, −64.2)N1:(Strike,Dip,Slip) = ( 96.2, 56.0, −64.2)N2:(Strike,Dip,Slip) = (235.3, 41.8, −122.8)N2:(Strike,Dip,Slip) = (235.3, 41.8, −122.8)Moment = 0.3496E+10(Nm), Mw = 0.3Moment = 0.3496E+10(Nm), Mw = 0.3Variance = 0.5115Variance = 0.5115depth = 11.5(km)depth = 11.5(km)
2011_09_22 2011_09_22
ATREW ATREW .82E−07(cm).82E−07(cm)
ATRNS ATRNS .15E−06(cm).15E−06(cm)
ATRUD ATRUD .12E−06(cm).12E−06(cm)
LEMEW LEMEW .23E−06(cm).23E−06(cm)
LEMNS LEMNS .96E−07(cm).96E−07(cm)
LEMUD LEMUD .16E−06(cm).16E−06(cm)
MYNEW MYNEW .68E−07(cm).68E−07(cm)
MYNNS MYNNS .61E−07(cm).61E−07(cm)
MYNUD MYNUD .16E−06(cm).16E−06(cm)
0 2 4
Time(sec)Figure 5 The complete output of moment tensor solution of the 22 September 2011 event (lowest magnitude earthquake). The blacklines are observation waveforms and the red lines are calculation ones.
Afnimar et al. Geoscience Letters (2015) 2:4 Page 5 of 11
slightly trust component. The NNE vector movementof Australian plate (e,g. [13]) might have been respon-sible for the kinematic reversion of the Lembang faultfollowing its initial vertical gravitational movement.Initial movement of east segment of the fault mighthave been triggered by cataclysmic eruption of SundaVolcano as explained by Van Bemmelen [2], and thatof west segment by cataclysmic eruption of Proto-Tangkubanperahu Volcano as deducted by Nossin et al.[14] but subsequent movements should have been
Table 1 Hypocenter parameters of all events
Event number Year/Month/Date Origin time (UTC)
1 2011-07-21 22:46:44.73
2 2011-08-10 08:35:33.96
3 2011-08-28 09:05:53.40
4 2011-09-03 17:49:56.60
5 2011-09-03 22:11:19.99
6 2011-09-22 17:03:17.66
7 2011-09-27 20:42:18.08
8 2011-09-28 20:33:39.03
9 2011-10-03 00:51:34.99
triggered by slow strain accumulation from NNEmovement of the Australian plate. It could be deductedhere that although the Lembang Fault was kinematic-ally formed as a normal fault, it has kinematically beenreverted to a left-lateral strike-slip fault with a trust(dip-slip) component. This could be an explanation forthe occurrence of slicken-lines with horizontal compo-nent reported by Tjia (1968).The widely recognized surface trace of the Lembang
fault stretches for about 15 km in the ESE – WSW
Latitude (South) Longitude (East) Depth (km)
−6.8011° ± 0.002 km 107.7505° ± 0.002 km 03.87 ± 0.005
−6.7860° ± 0.003 km 107.4728° ± 0.007 km 14.03 ± 0.021
−6.7889° ± 0.003 km 107.5056° ± 0.001 km 17.74 ± 0.001
−6.7523° ± 0.004 km 107.5453° ± 0.004 km 27.31 ± 0.011
−6.7870° ± 0.001 km 107.5087° ± 0.001 km 19.75 ± 0.000
−6.8242° ± 0.002 km 107.6933° ± 0.011 km 10.46 ± 0.005
−6.7935° ± 0.001 km 107.6922° ± 0.006 km 02.26 ± 0.015
−6.7633° ± 0.005 km 107.5418° ± 0.003 km 25.46 ± 0.007
−6.7481° ± 0.004 km 107.4971° ± 0.000 km 29.60 ± 0.010
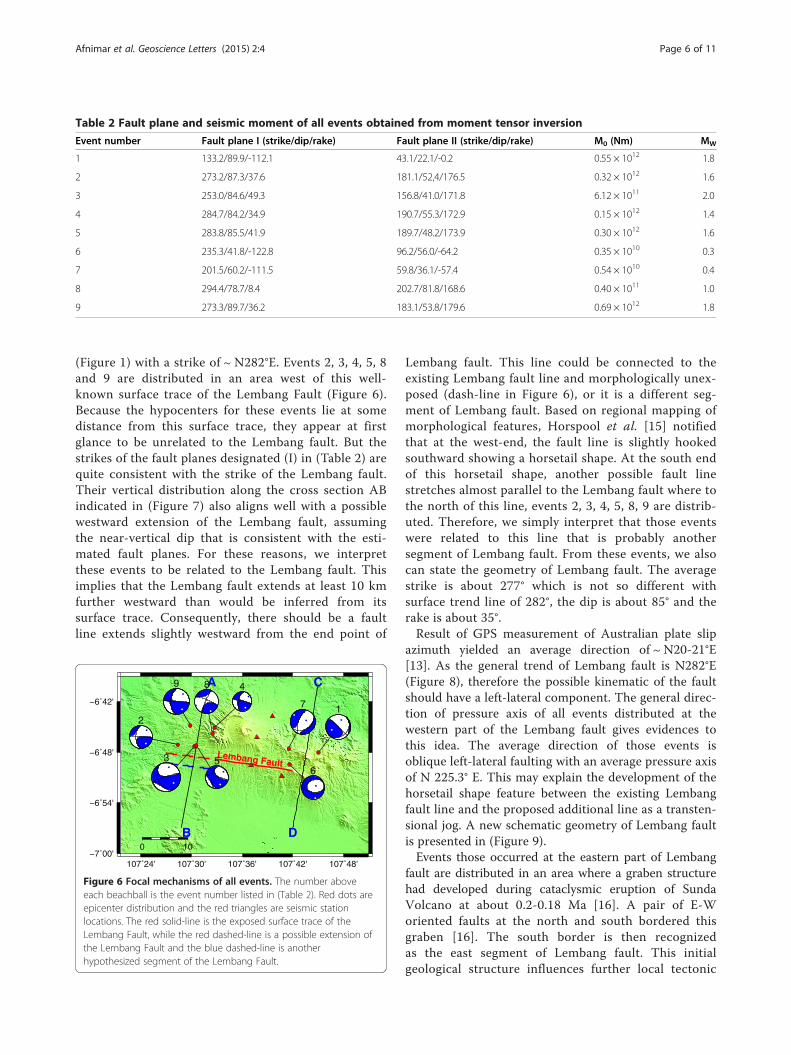
Table 2 Fault plane and seismic moment of all events obtained from moment tensor inversion
Event number Fault plane I (strike/dip/rake) Fault plane II (strike/dip/rake) M0 (Nm) MW
1 133.2/89.9/-112.1 43.1/22.1/-0.2 0.55 × 10¹² 1.8
2 273.2/87.3/37.6 181.1/52,4/176.5 0.32 × 10¹² 1.6
3 253.0/84.6/49.3 156.8/41.0/171.8 6.12 × 10¹¹ 2.0
4 284.7/84.2/34.9 190.7/55.3/172.9 0.15 × 10¹² 1.4
5 283.8/85.5/41.9 189.7/48.2/173.9 0.30 × 10¹² 1.6
6 235.3/41.8/-122.8 96.2/56.0/-64.2 0.35 × 10¹⁰ 0.3
7 201.5/60.2/-111.5 59.8/36.1/-57.4 0.54 × 10¹⁰ 0.4
8 294.4/78.7/8.4 202.7/81.8/168.6 0.40 × 10¹¹ 1.0
9 273.3/89.7/36.2 183.1/53.8/179.6 0.69 × 10¹² 1.8
Afnimar et al. Geoscience Letters (2015) 2:4 Page 6 of 11
(Figure 1) with a strike of ~ N282°E. Events 2, 3, 4, 5, 8and 9 are distributed in an area west of this well-known surface trace of the Lembang Fault (Figure 6).Because the hypocenters for these events lie at somedistance from this surface trace, they appear at firstglance to be unrelated to the Lembang fault. But thestrikes of the fault planes designated (I) in (Table 2) arequite consistent with the strike of the Lembang fault.Their vertical distribution along the cross section ABindicated in (Figure 7) also aligns well with a possiblewestward extension of the Lembang fault, assumingthe near-vertical dip that is consistent with the esti-mated fault planes. For these reasons, we interpretthese events to be related to the Lembang fault. Thisimplies that the Lembang fault extends at least 10 kmfurther westward than would be inferred from itssurface trace. Consequently, there should be a faultline extends slightly westward from the end point of
107˚24' 107˚30' 107˚36' 107˚42' 107˚48'−7˚00'
−6˚54'
−6˚48'
−6˚42'
0 10
Lembang Fault
B
A
D
C
17
6
489
53
2
Figure 6 Focal mechanisms of all events. The number aboveeach beachball is the event number listed in (Table 2). Red dots areepicenter distribution and the red triangles are seismic stationlocations. The red solid-line is the exposed surface trace of theLembang Fault, while the red dashed-line is a possible extension ofthe Lembang Fault and the blue dashed-line is anotherhypothesized segment of the Lembang Fault.
Lembang fault. This line could be connected to theexisting Lembang fault line and morphologically unex-posed (dash-line in Figure 6), or it is a different seg-ment of Lembang fault. Based on regional mapping ofmorphological features, Horspool et al. [15] notifiedthat at the west-end, the fault line is slightly hookedsouthward showing a horsetail shape. At the south endof this horsetail shape, another possible fault linestretches almost parallel to the Lembang fault where tothe north of this line, events 2, 3, 4, 5, 8, 9 are distrib-uted. Therefore, we simply interpret that those eventswere related to this line that is probably anothersegment of Lembang fault. From these events, we alsocan state the geometry of Lembang fault. The averagestrike is about 277° which is not so different withsurface trend line of 282°, the dip is about 85° and therake is about 35°.Result of GPS measurement of Australian plate slip
azimuth yielded an average direction of ~ N20-21°E[13]. As the general trend of Lembang fault is N282°E(Figure 8), therefore the possible kinematic of the faultshould have a left-lateral component. The general direc-tion of pressure axis of all events distributed at thewestern part of the Lembang fault gives evidences tothis idea. The average direction of those events isoblique left-lateral faulting with an average pressure axisof N 225.3° E. This may explain the development of thehorsetail shape feature between the existing Lembangfault line and the proposed additional line as a transten-sional jog. A new schematic geometry of Lembang faultis presented in (Figure 9).Events those occurred at the eastern part of Lembang
fault are distributed in an area where a graben structurehad developed during cataclysmic eruption of SundaVolcano at about 0.2-0.18 Ma [16]. A pair of E-Woriented faults at the north and south bordered thisgraben [16]. The south border is then recognizedas the east segment of Lembang fault. This initialgeological structure influences further local tectonic

0
5
10
15
20
25
30
Dep
th(k
m)
-6.95-6.90-6.85-6.80-6.75-6.70
Latitude
BA
4
8
9
5
3
2
0
5
10
15
20
25
30
Dep
th(k
m)
-6.95-6.90-6.85-6.80-6.75-6.70
Latitude
DC
1
7
6Le
mba
ngF
ault
Lem
bang
Fau
lt
Figure 7 Cross section of all focal mechanisms along line AB (left) and along line CD (right) in (Figure 6). The red dashed-line is a possibleextention of the Lembang Fault, while the blue dashed-line is another hypothesized segment of the Lembang Fault, and the red solid-line isrelated to Lembang Fault.
Afnimar et al. Geoscience Letters (2015) 2:4 Page 7 of 11
evolution as indicated by events 1, 6, and 7. Focalmechanisms of these events, particularly events 1 and 7,suggest apparent normal faulting component (gravitationalcollapses). Events 1 and 7 might be related to faulting ofminor faults in the graben area to the north of Lembangfault. Due to its position (Figure 7) and its focal mech-anism, event 6 might be related to the eastern part ofLembang. Obvious left-lateral component of event 6 isconsistent with those of events distributed at the west
107˚24' 107˚30' 107˚36' 107˚42' 107˚48'−7˚00'
−6˚54'
−6˚48'
−6˚42'
0 10
Lembang Fault
Figure 8 Horizontal components of pressure (outward-pointingarrow couple) and tension vectors (inward-pointing arrow couple).
of Lembang fault and thus strongly suggesting left-lateral kinematic of Lembang fault.
Velocity structureThe 1-D structure including P and S wave velocities(Table 3) obtained from the JHD method is presented asgraphics of Depth vs. Velocity (Figure 10). Interpretationis given in this figure. Three layers can be distinguishedfrom Vp graphic i.e. high Vp values at depths deeperthan 6 km with an exception of that at 18 km, moderate
Figure 9 A modified schematic geometry of the Lembang Fault.
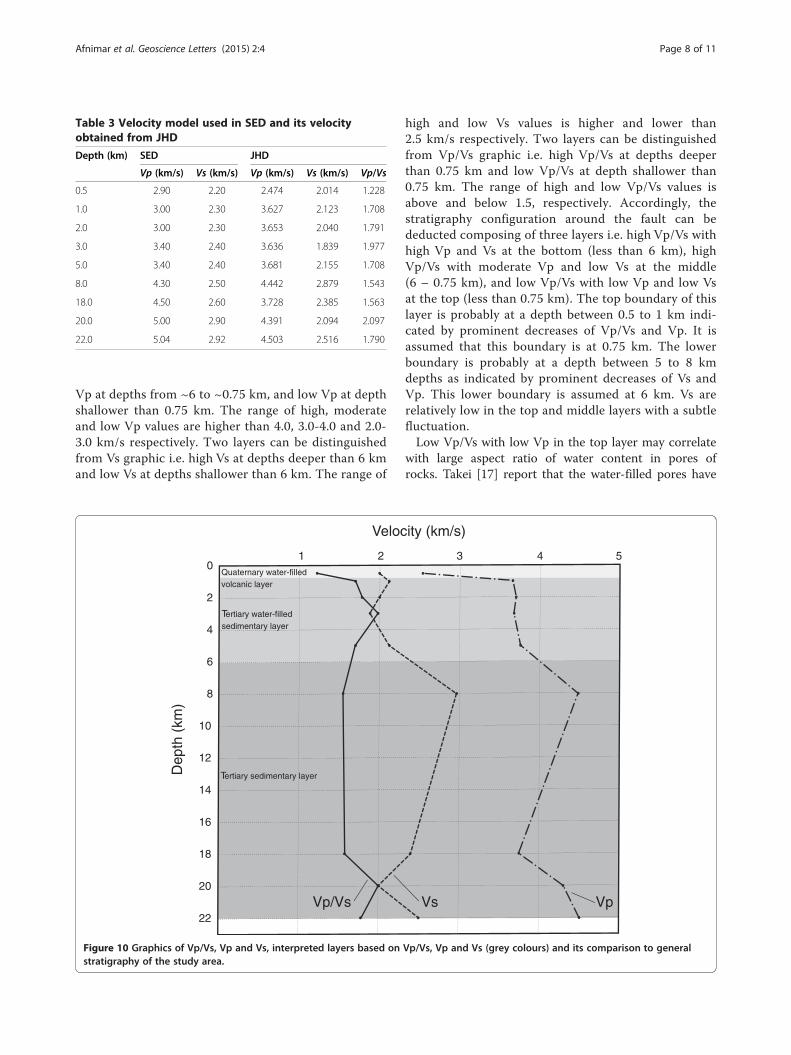
Table 3 Velocity model used in SED and its velocityobtained from JHD
Depth (km) SED JHD
Vp (km/s) Vs (km/s) Vp (km/s) Vs (km/s) Vp/Vs
0.5 2.90 2.20 2.474 2.014 1.228
1.0 3.00 2.30 3.627 2.123 1.708
2.0 3.00 2.30 3.653 2.040 1.791
3.0 3.40 2.40 3.636 1.839 1.977
5.0 3.40 2.40 3.681 2.155 1.708
8.0 4.30 2.50 4.442 2.879 1.543
18.0 4.50 2.60 3.728 2.385 1.563
20.0 5.00 2.90 4.391 2.094 2.097
22.0 5.04 2.92 4.503 2.516 1.790
Afnimar et al. Geoscience Letters (2015) 2:4 Page 8 of 11
Vp at depths from ~6 to ~0.75 km, and low Vp at depthshallower than 0.75 km. The range of high, moderateand low Vp values are higher than 4.0, 3.0-4.0 and 2.0-3.0 km/s respectively. Two layers can be distinguishedfrom Vs graphic i.e. high Vs at depths deeper than 6 kmand low Vs at depths shallower than 6 km. The range of
0
2
4
6
8
10
12
14
16
18
20
22
21
Veloc
Dep
th(k
m)
Vp/Vs
Quaternary water-filledvolcanic layer
Tertiary water-filled sedimentary layer
Tertiary sedimentary layer
Figure 10 Graphics of Vp/Vs, Vp and Vs, interpreted layers based onstratigraphy of the study area.
high and low Vs values is higher and lower than2.5 km/s respectively. Two layers can be distinguishedfrom Vp/Vs graphic i.e. high Vp/Vs at depths deeperthan 0.75 km and low Vp/Vs at depth shallower than0.75 km. The range of high and low Vp/Vs values isabove and below 1.5, respectively. Accordingly, thestratigraphy configuration around the fault can bededucted composing of three layers i.e. high Vp/Vs withhigh Vp and Vs at the bottom (less than 6 km), highVp/Vs with moderate Vp and low Vs at the middle(6 – 0.75 km), and low Vp/Vs with low Vp and low Vsat the top (less than 0.75 km). The top boundary of thislayer is probably at a depth between 0.5 to 1 km indi-cated by prominent decreases of Vp/Vs and Vp. It isassumed that this boundary is at 0.75 km. The lowerboundary is probably at a depth between 5 to 8 kmdepths as indicated by prominent decreases of Vs andVp. This lower boundary is assumed at 6 km. Vs arerelatively low in the top and middle layers with a subtlefluctuation.Low Vp/Vs with low Vp in the top layer may correlate
with large aspect ratio of water content in pores ofrocks. Takei [17] report that the water-filled pores have
543
ity (km/s)
Vs Vp
Vp/Vs, Vp and Vs (grey colours) and its comparison to general

Figure 11 (See legend on next page.)
Afnimar et al. Geoscience Letters (2015) 2:4 Page 9 of 11

(See figure on previous page.)Figure 11 A modified geological map from Sunardi& Kimura [17] and Horspool et al. (2011). The Lembang fault line was identifiedby Horspool et al. (2011) based on morphological features on SRTM digital elevation model of ca. 90 m grid, showing a length ofmore than 30 km excluding the segment identified in this study. The schematic north–south longitudinal stratigraphic profile of the Bandungbasin and its adjacent area inferred from geological map, showing Quaternary and pre-Quaternary rock units and their boundary at about1 km depth.
Afnimar et al. Geoscience Letters (2015) 2:4 Page 10 of 11
a different effect on seismic velocity and Poisson’sratio, which depends on the shape of the pores.Water-filled pores of a small aspect ratio decreaseseismic velocity with increasing Poisson’s ratio.Water-filled pores of a large aspect ratio, however, canlower Poisson’s ratio slightly with decreasing seismicvelocity. From this perspective, high Vp/Vs with mod-erate Vp and low Vs in the middle layer may indicatesmaller aspect ratio of water content of this layer com-pared to that of the top layer. Lower Vp/Vs with highVp and Vs in the bottom layer may indicate smallestaspect ratio of water content compared to that in themiddle and top layers.In comparison with general geology of the study area
(Figure 11), the top layer should represent Quaternaryvolcanic layer. The middle and bottom layers shouldrepresent Tertiary sedimentary layer or basement ac-cording to Satake and Harjono [5].The station corrections obtained from the JHD
method are tabulated in (Table 4). The negative stationcorrection at LEM is observed to occur on bedrockand the positive ones are those on sedimentary orweathering rocks. This means the waves arrived earlierat stations on bedrocks than those on sediment orweathering rocks. Pujol [18] obtained minus valuecorrection related to high velocity anomalies and viceversa from data of Loma Prieta, California, mainshock-aftershock sequence. Our result shows similar indica-tion to that of Loma Prieta. The minus value at LEM isrelated to outcrop of igneous rock (high velocity anom-alies) along Lembang fault. The plus ones at TKP,MYN and ATR are related to the volcanic zone (lowvelocity anomalies).
ConclusionsFrom this investigation, stratigraphy of the study areahas been revealed based on Vp, Vs and Vp/Vs, consisting
Table 4 Station corrections obtained from JHD
Station ΔtVp (sec) ΔtVs (sec)
LEM 0.000 −0.884
TKP 0.324 0.000
ATR 0.455 0.202
MYN 0.460 0.239
of three layers. In a perspective of aspect ratio of watercontent, the top layer with low Vp/Vs, low Vp and lowVs is composed of rocks with largest aspect ratio ofwater content. The bottom layer with high Vp/Vs, highVp and high Vs is composed of rocks with smallestaspect ratio of water content. In comparison withgeneral geology of the area, the top layer should repre-sent the Quaternary volcanic layer, and the middleand bottom layers should represent the Tertiary sedi-mentary layer.The source mechanism of earthquakes along the
Lembang fault is left-lateral faulting. All western eventsare probably related to a new segment of the Lembangfault. This new segment is maybe developed by pressureof Australian plate indicated by horsetail feature. Twoshallow eastern events are related to the minor faultsand caused by a gravitational collapse.
Competing interestsThe authors declare that they have no competing interests.
Authors’ contributionsA picked again on seismograms, reprocessed earthquake relocation,reprocessed focal mechanism estimation and construct the manuscript.EY supports geological interpretation. R provided all seismogram dataand did preliminary processing. All authors read and approved the finalmanuscript.
AcknowledgementsWe thank Prof. Koketsu from Earthquake Research Institute, The Universityof Tokyo for his helpful advices. We also thank two reviewers for theirconstructive comments. Many thanks Prof. Satake from Earthquake ResearchInstitute, The University of Tokyo for his critical review on content andwriting of manuscripts.
Author details1Seismological Laboratory, Faculty of Mining and Petroleum Engineering,Bandung Institute of Technology (ITB), Ganesha 10 Street, West Jawa 40132,Indonesia. 2Research Center of Geotechnology, Indonesian Institute ofSciences, Komplek LIPI Gd. 70, Jl Sangkuriang, Bandung 40135, Indonesia.3Meteorology, Climatology and Geophysical Agency (BMKG), Jl. Angkasa I No.2, Jakarta 13920, Indonesia.
Received: 6 August 2014 Accepted: 2 February 2015
References1. Dam MAC (1994) The late quartenary evolution of the Bandung basin, West
Java, Indonesia, Vrije Universiteit, Amsterdam2. Van Bemmellen RW (1949) The Geology of Indonesia, Vol. IA General
Geology, The Hague3. Tjia HD (1968) The Lembang Fault, West Java. Geologie En Mijnbouw
47(2):126–130

Afnimar et al. Geoscience Letters (2015) 2:4 Page 11 of 11
4. Yulianto E (2011) Understanding the Earthquake Threat to Bandung fromthe Lembang fault, Australia-Indonesia Facility for Disaster Reduction (AIFDR)Project Report, Jakarta, 22 pp
5. Satake K and Harjono H (2012) Multi-disciplinary hazard reduction fromearthquake and volcanoes in Indonesia, Final Report, JST-JICA-RISTEK-LIPI, 165.
6. Afnimar (2014) Estimation of SH-wave amplification in the Bandung basinusing Haskell’s method. J Eng Technol Sci 46:93–101
7. Wadati K (1933) On the traveltime of earthquake waves. Part II, GeophysMag (Tokyo) 7:101–111
8. Geiger L (1910) Herdbestimmungbei Erdbebenaus den Ankunftszeiten.Nachrichten vonder Königlichen Gesellschaft der WissenschaftenzuGöttingen, Mathematisch-Physikalische Klasse, pp. 331–349. 1910. (translatedto English by F. W. L. Peebles and A. H. Corey: Probability method for thedetermination of earthquake epicenters from the arrival time only, BulletinSt.Louis University 8, pp. 60–71
9. Douglas A (1967) Joint hypocenter determination. Nature 215:47–4810. Kissling E, Ellworth WL, Eberhart-Phillips D, Kradolfer U (1994) Initial reference
models in local earthquake tomography. J Geophys Res 99:19635–1964611. Kuge K (1999) Automated determination of earthquake source parameters
using broadband strong-motion waveform data, EOS. Trans Am GeophysUn 80:F661
12. Kohketsu K (1985) The extended reflectivity method for synthetic near-fieldseismograms. J Phys Earth 33:121–131
13. Chamot-Rooke N, Le Pichon X (1999) GPS determined eastward Sunda landmotion with respect to Eurasia confirmed by earthquakes slip vectors atSunda and Philippine trenches. Earth Planetary Sci Lett 173:439–455
14. Nossin JJ, Voskuil RPGA, Dam RMC (1995) Geomorphologic Development ofthe Sunda Volcanic complex, West Java, Indonesia, Proceedings of theInternational Association of Geomorphologist Southeast Asia Conference,Singapore.
15. Horspool N, Natawidjaja D, Yulianto E, Lawrie S, and Cummins P (2011) AnAssessment on the use of High Resolution Digital Elevation Models forMapping Active Faults in Indonesia. Geoscience Australia ProfessionalOpinion. No.2011/XX, 37 pp.
16. Sunardi E, Kimura J (1998) Temporal chemical variation in late Cenozoicvolcanic rocks around the Bandung Basin, West Java, Indonesia. J Min PetrEcon Geol 93:103–128
17. Takei Y (2002) Effect of pore geometry on Vp/Vs: From equilibriumgeometry to crack. J Geophys Res 107(B2):2043
18. Pujol J (2000) Joint Event Location – The JHD Technique and Application toData from Local Seismic Network, in Advances in Seismic Event Location,Thurber C, and N Rabinowitz, eds. Kluwer Academic Publishers, pp. 163–204.
Submit your manuscript to a journal and benefi t from:
7 Convenient online submission
7 Rigorous peer review
7 Immediate publication on acceptance
7 Open access: articles freely available online
7 High visibility within the fi eld
7 Retaining the copyright to your article
Submit your next manuscript at 7 springeropen.com